Interesting quotes from papers
cite:Munk1973:
The authors think that the internal wave energy in the ocean extends to quite high modes, up to 20 (say); but once having said this, we disclaim all belief in the existence (discreteness) of the higher modes under the messy oceanic conditions as they actually exist; iblur the mode spectrum into an equivalent continuum, corresponding not to (3) but to the Tijuana boundary condition: topless and bottomless.
cite:Clarke2019
In the equatorial literature the balance (1.4) has often been referred to as “Sverdrup balance.” This is an unfortunate choice of words because, from (1.5), it implies that \(V=0\). But \(V\) is often referred to as “Sverdrup transport,” so we have a situation in which the Sverdrup transport is zero when the Sverdrup balance is satisfied!
F. Millero, Letter to the editor, Oceanography (1993)
After receiving the latest issue of Oceanography, I was irritated by the Sea-Bird advertisement on the inside cover. It shows a TS diagram that is labeled with the term PSU.
…
If the field of oceanography is to become a recognized science, it must adopt the units that are basic to the fields of chemistry and physics. It also should not adopt new units for variables that are unitless.
cite:MacGilchrist2021:
In describing a mechanism for the selective nature of ventilation over the seasonal cycle, Henry Stommel imagined a Demon sitting at the base of the surface boundary layer, granting access only to parcels of water that meet certain characteristics (namely their speed of “escape”). Thus, “Stommel’s Demon” was born. Here, we investigate this same process as it operates in more northerly regions and on longer timescales. In so doing we give birth to a new “interannual Demon,” and describe its characteristics.
cite:Gregg1993a:
we are indebted to the reviewer of an earlier version of the paper whose comment “Statistical bafflegab is no substitute for physics. . . garbage in, garbage out as they say” strengthened our resolve to improve the statistical training of oceanographers.
cite:Griffies2014:
Some readers may be disappointed with our reticence to penetrate deeper into such mechanisms. We too are disappointed. However, we are limited in how much we can answer such questions based on available diagnostic output from the simulations. Nonetheless, this excuse, which is in fact ubiquitous in such comparison papers utilizing CORE or CMIP (Coupled Model Intercomparison Project) simulations, is unsatisfying.
- cite:Lien1995
The conclusions reached in the house of cards constructed above are that the wind strengthens the heat flux, the Kelvin wave's crest weakens it, and tropical instability waves do not have a dominant effect. We advance this argument as a working hypothesis for future study, not as a strongly supported conclusion.
- cite:Peters1994
Before and during a second cruise of April 1987, we were most curious whether we would find the deep diurnal cycle again. Our hopes were severely dimmed when we decided to surrender to the numerous sharks attacking our small advanced microstructure profiler(AMP) and to operate only the more imposing autonomous multiscaleprofiler(MSP). This meant reducing the profiling rate from4 per hour to 6 per day! To our surprise, the time series of the dissipation rate showed an unmistakable diurnal variation despite the coarse time resolution, and the signal reached well belowthe mixed layer depth as depicted in Figure lb.
cite:Moum1985
Every spectrum was inspected for spurious effects; these consisted mostly of spiking caused by the interception of plankton by the sensors (and two shark attacks).
cite:Appen2015:
The geometry of the iron in the vicinity of the compass can be decomposed into a symmetric and an asymmetric part (National GeospatialIntelligence Agency 2004)². … ²This handbook (National Geospatial-Intelligence Agency 2004) provides useful background and details about compass corrections, as they are standard on ships.
cite:Ruddick1983
Oceanographers are increasingly accepting that one of the processes that can affect oceanic fine structure is double-diffusive convection, such as salt fingering.
cite:Gregg1986:
AMP observations were taken while the ship drifted "in the trough" near the buoy (a procedure that is better for collecting data than keeping the crew happy). (Following a moderately rough transit to the site, our sampling method prompted the chief engineer to call us "a fistful of weirdos".)
cite:Stommel1966 (seen in cite:Jain2017)
When I emphasise the imperfection of observing techniques, perhaps I should say that I wrote this chapter during a succession of midnight-todawn watches during an attempt to survey the Somali Current near Socotra in the heart of the southwest monsoon. It is rather quixotic to try to get the measure of so large a phenomenon armed only with a 12-knot vessel and some reversing thermometers. Clearly some important phenomena slip through the observational net, and nothing makes one more convinced of the inadequacy of present-day observing techniques than the tedious experience of garnering a slender harvest of thermometer readings and water samples from a rather unpleasant little ship at sea. A few good and determined engineers could revolutionise this backwards field.
cite:Pierrehumbert2010 (found on Henri Drake's twitter)
Lest there be any misunderstanding, we must emphasize at this point that "less sensitive" does not mean "insensitive". If CO2 were a gray gas, then doubling its concentration, as we are poised to do within the century, would be unquestionably lethal. Because CO2 is not in fact a gray gas, the results may be merely catastrophic.
cite:Gregg2012
… most dissipation estimates were classified as noise and represented in the final data as zeros because we could not justify any other value.
cite:Pollard1972
GFD models like this one often suffer from lack of relevance. A sign of this is that an investigator cannot find observations quite ideal enough to test his theory. Our guilt would be established, therefore, if we required a resting ocean with uniform stratification and a step-function wind to make any use of observations. Luckily this is not our position, for account can be taken of arbitrary stratification, pre-existing currents, and a stress that varies in time
cite:Hovmoller1949
cite:Groeskamp2019
The following analogy illustrates the utility of buoyancy as a marker of water masses. Imagine a slightly tilted pile of Dutch pancakes sweetened with Canadian maple syrup. As the maple syrup is poured onto the top pancake, it readily spills over the sides but only slowly penetrates through to the interior. The disparate syrup transport arises because there is enhanced resistance to movement through a pancake but little resistance to movement along a pancake surface. We make use of this pancake analogy to conceptualize the stratification of ocean buoyancy and its influence on the associated transport of matter and heat.
cite:Levine1999a on rescaling the Garrett-Munk spectrum
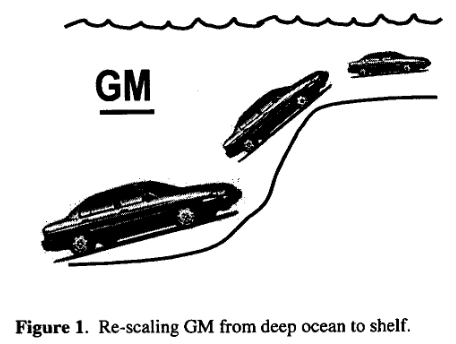
cite:Colosi2016
In 1979, Carl Wunsch famously asserted “Many sources for the internal wave field have been proposed; but it has not yet been possible to make the kind of statement that can be made about surface waves: namely, when the wind blows surface waves are generated and the larger the fetch and duration, the larger the waves.”
cite:Winters1994:
… we generalize the term adiabatic to describe a process in which there is no heat or molecular mass transfer, and define a diabatic process as one that is not adiabatic.
cite:Munk1981 introduces the term "spiciness":
They are here designated by π,for "spiciness" (hot and salty10)
…
[10] Garrett points out that a lot of laboratory experiments have been sweet-and-sour rather than spicy.
cite:Wunsch2009 on instrumented elephant seals
They are singled out here because they are almost our only data sets from under the Antarctic sea ice, and they perhaps represent the future, in which ever more species are used to obtain a truly global observation system2.
…
[2] Perhaps, one day, animals can be bred to grow their own temperature, salinity, and pressure sensors, and GPS transmitters! Whether the existing system is damaging to the animals, and the more general ethical questions concerning animal use, must be discussed elsewhere.
cite:Richardson1948
In the sea we used floats of parsnip because it is easily visible, and because it is almost completely immersed so as not to catch the wind which, moreover, was slight. The floats were about 2cm in diameter.
cite:Hughes2010
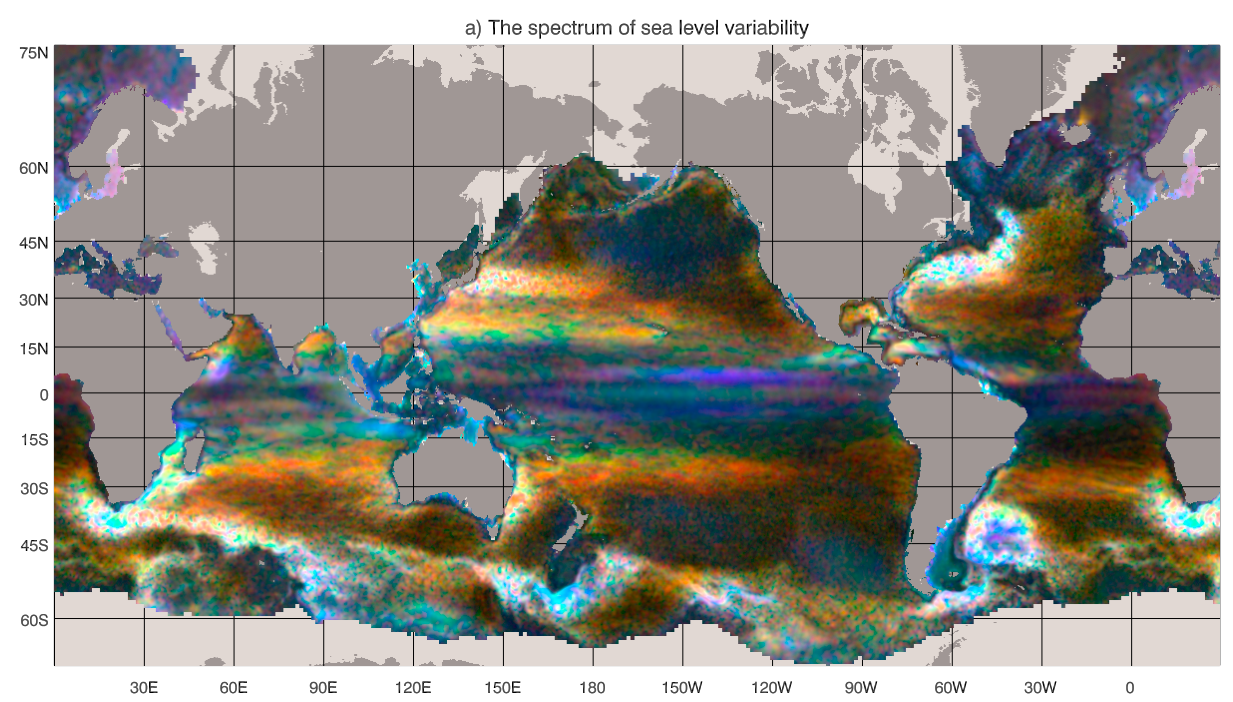
the true relationship between spectrum and color turns out to be rather useful here. We are used to interpreting small differences from white light (“red” noise) as colors, so if the sea level spectrum was exactly “red” noise, a translation into a light spectrum would render it as a gray scale: low‐amplitude variability would be black, and high‐amplitude white, with grays at intermediate values.
cite:Gargett1999

While a zipper makes a closure by the functioning of a single accurate mechanism, the same task can be accomplished by the closing of enough of the myriad tiny hooks and eyes that make up a strip of Velcro. Baker (1983) first used this analogy to suggest "the importance of many relatively cheap measurements that cover a broad area as opposed to expensive detailed measurements at a point." As an example, consider the merits of the plentiful satellite measurements of sea surface temperature (SST) compared with highly accurate but exceedingly sparse shipboard SST measurements. Satellite information on the spatial patterns of SST and the changes of these patterns in space and time have provided a revolutionary new view of the ocean—a view completely unattainable from SST measurements along ship tracks. In such "Velcro" techniques, the quantity of measurements allows a description of the spatial patterns associated with the underlying fluid flows, with detail impossible to obtain from sparse sampling. As has been the case with satellite SST, the quantitative accuracy of the remote sensing algorithm is determined and improved by comparison with "ground-truth" data from accurate but sparsely distributed sensors.
The above analogy is of direct relevance to present state-of-the-art measurement of ocean turbulence, a field in which the accurate "zippers" are microscale profilers. While such profilers have become somewhat more common during the last decade, they remain relatively rare; are expensive to maintain and run; and in operation are often restricted by adverse conditions of weather, surface waves, or oceanic velocity shears.
cite:Ferrari2009
That turbulent mixing processes in the ocean are extremely important in determining the oceanic general circulation, and are major limiting factors in the ability to calculate future climate states, is a cliche in oceanography and climate dynamics. Unlike some other hackneyed statements, this one does retain much of its validity.
And
We have gone from the situation described in Wunsch & Ferrari (2004) of being unable to account for the dissipation of geostrophic turbulence to the opposite case—there are now too many candidates.
cite:Armi1983
We are in effect bragging about the results of a high-resolution yet wide-angle (10°) telescope in the sense of an astronomer looking at the sky. We have only used the new telescope four times in one portion of the ocean.
cite:Ferrari2008
V Canuto and M Dubovikov were included as coauthors during the review process, because they contributed to resolving some inconsistencies in the original expressions for the eddy-induced streamfunction and the residual fluxes.
cite:Hughes2016
cite:Munk2007
The obliquity modulation of tidal mixing by a few percent and the associated modulation in the meridional overturning circulation (MOC) may play a role comparable to the obliquity modulation of the incoming solar radiation (insolation), a cornerstone of the Milanković theory of ice ages. This speculation involves even more than the usual number of uncertainties found in climate speculations.
cite:Polzin2014
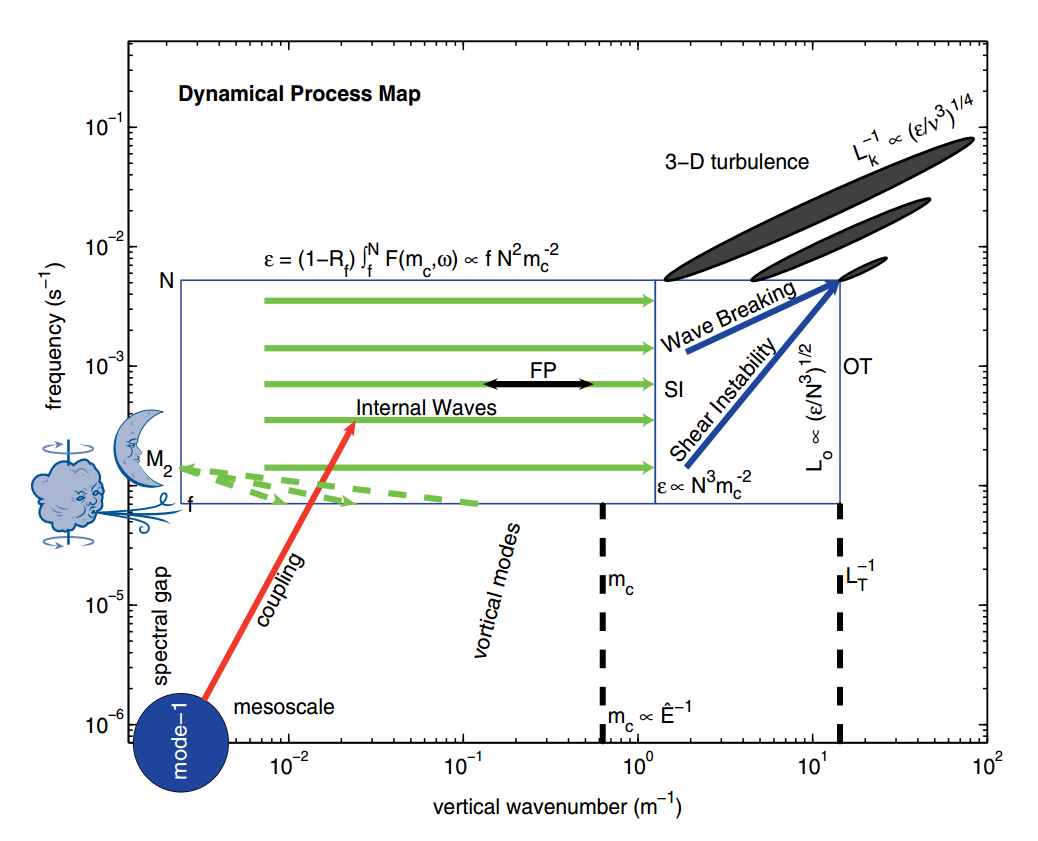
John Lumley, quoted in cite:Leibovich2018
Turbulence is rent by factionalism. Traditional approaches in the field are under attack, and one hears intemperate statements against long time averaging, Reynolds decomposition, and so forth. Some of these are reminiscent of the Einstein-Heisenberg controversy over quantum mechanics, and smack of a mistrust of any statistical approach. Coherent structure people sound like The Emperor’s New Clothes when they say that all turbulent flows consist primarily of coherent structures, in the face of visual evidence to the contrary. Dynamical systems theory people are sure that turbulence is chaos. Simulators have convinced many that we will be able to compute anything within a decade. Modeling is thus attacked as unnecessary, or irrelevant because it starts with Reynolds stress averaging or ignores coherent structures. The card-carrying physicists dismiss everything that has been done on turbulence from Osborne Reynolds until the last decade. Cellular Automata were hailed on their appearance as the answer to a maiden’s prayer, so far as turbulence was concerned. It is no wonder that funding agencies are confused. (quoted in Cantwell 1990, p. 97)
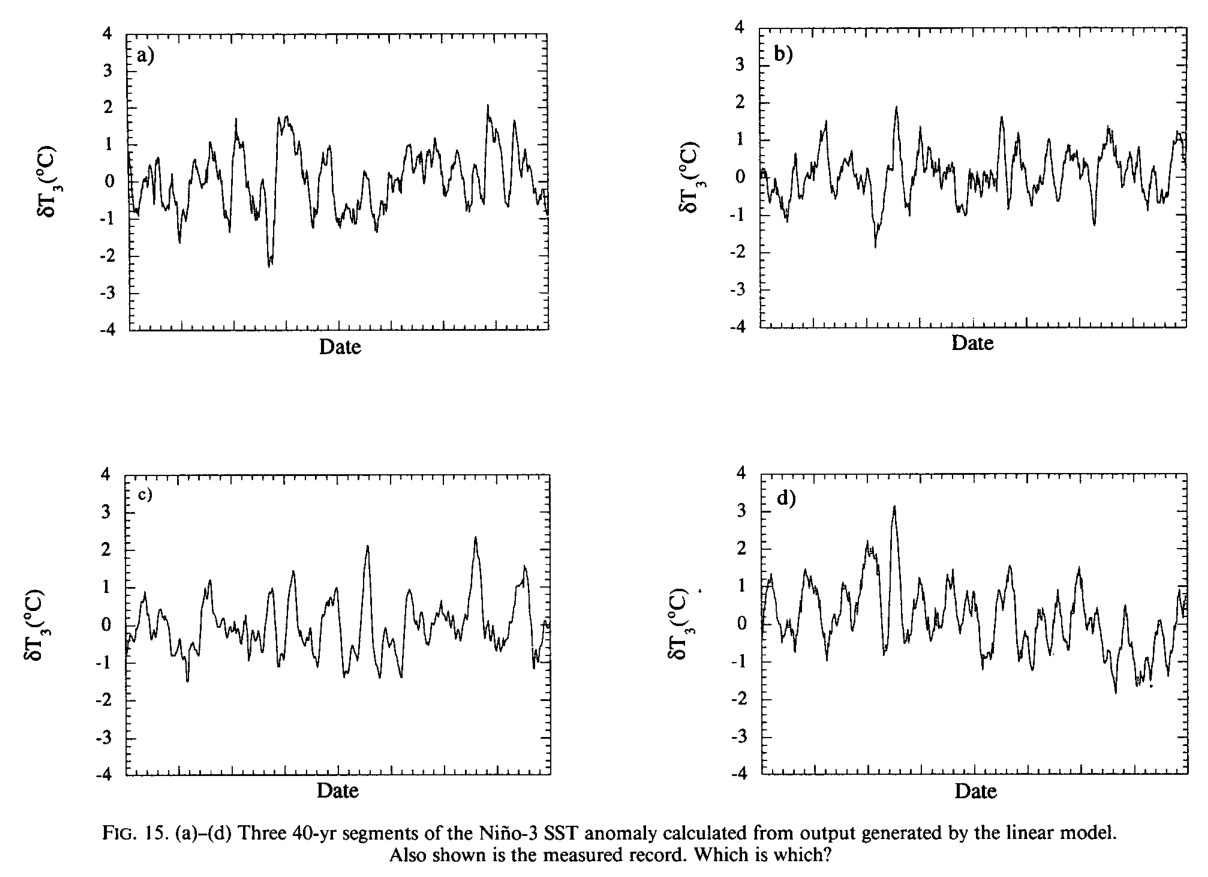
cite:Penland1995 throw down a challenge:
cite:Vallis1993 :
A factor of 2 sometimes finds itself, rather arbitrarily, in the denominator.
cite:Flierl1978 quotes Karl Marx:
A second and, in my opinion, more persuasive argument for our studies is that, in sensitive systems, a small quantitative error may lead to large qualitative errors1.
⋮
[1] "Quantitative changes suddenly become qualitative changes" (Karl Marx)
cite:Holte2009
Most floats sampled at regular pressure levels, though the Canadian Argo floats often sampled at irregular pressures and required substantial editing.
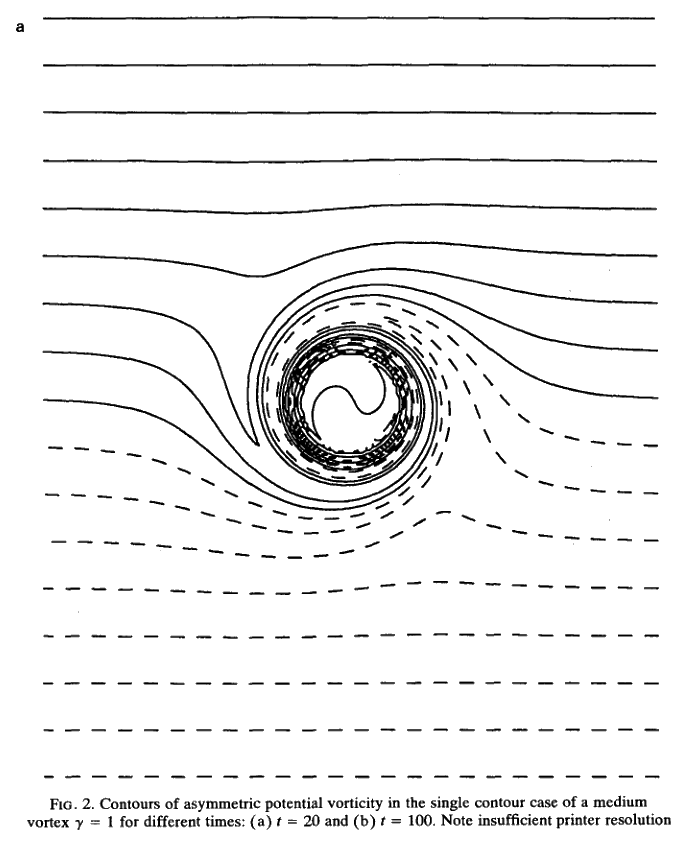
cite:Sutyrin1994 note insufficient printer resolution in their Figure 2.
cite:MacKinnon2017 summarize
A frequently asked question related to this work is “Which mixing processes matter most for climate?”. As with many alluringly comprehensive sounding questions, the answer is “it depends”.
and then end on an inspiring note
At the same time, the epiphanies, new ideas and novel observations that fundamentally drive the field forward frequently come not from big science, but from a cornucopia of much smaller exploratory efforts and the continued small-scale development of innovative observing technology and numerical techniques. We must not lose the ability to be surprised.
Also note the author order:
cite:Wunsch2016 cites the Bible
That which is far off, and exceeding deep, who can find it out? — Ecclesiastes 7:24 (King James Version)
Enrico Fermi quotes John von Neumann to Freeman Dyson, critizing the latter's model citep:Dyson2004:
"I remember my friend Johnny von Neumann used to say, with four parameters I can fit an elephant, and with five I can make him wiggle his trunk." — Enrico Fermi
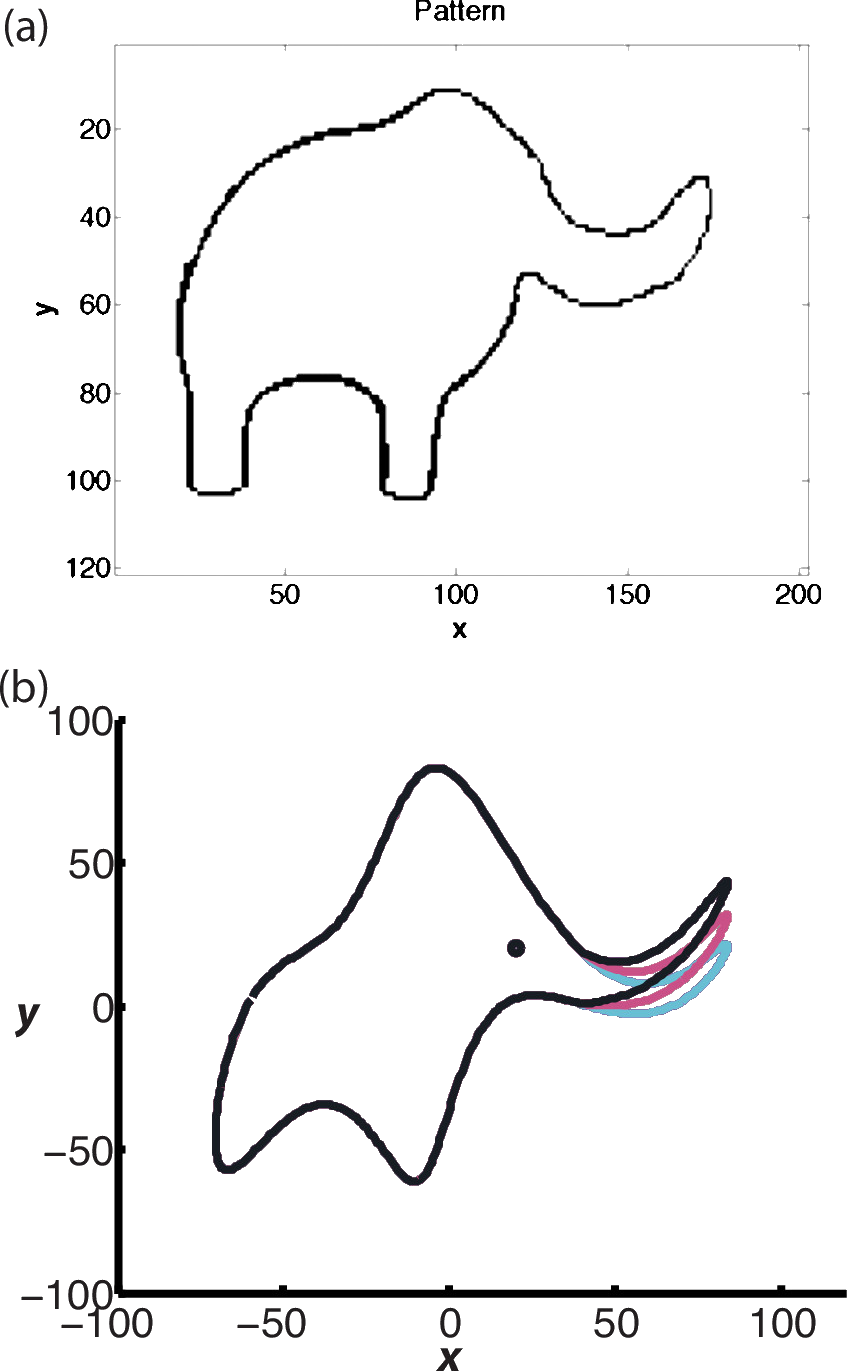
cite:Mayer2010 take on the challenge yielding:
The resulting shape is schematic and cartoonlike but is still recognizable as an elephant. Although the use of the Fourier coordinate expansion is not new, our approach clearly demonstrates its usefulness in reducing the number of parameters needed to describe a two-dimensional contour. In the special case of fitting an elephant, it is even possible to lower it to four complex parameters and therein implement a well-known saying.
With five, they give the elephant an eye and make it's trunk wiggle!
Python implementation here.
…

cite:Lindzen1988
As it turns out, the observations provide a clue to the problem.
bibliography:~/Papers/bibtexLibrary.bib