BoB ASIRI 2013 CTD χpod#
This notebook will attempt to infer eddy diffusivity \(K_e\) from the basin-wide transect of \(χ, K_T\)
import eddydiff as ed
/home/deepak/anaconda3/lib/python3.6/importlib/_bootstrap.py:219: RuntimeWarning: numpy.dtype size changed, may indicate binary incompatibility. Expected 96, got 88
  return f(*args, **kwds)
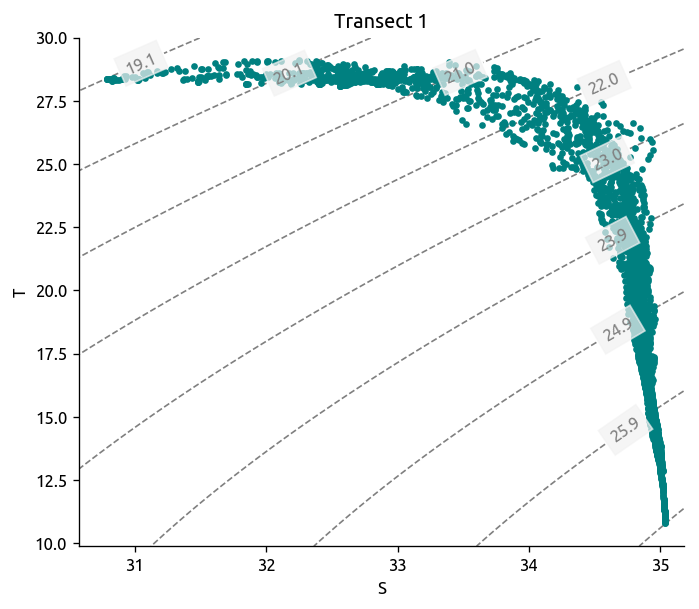
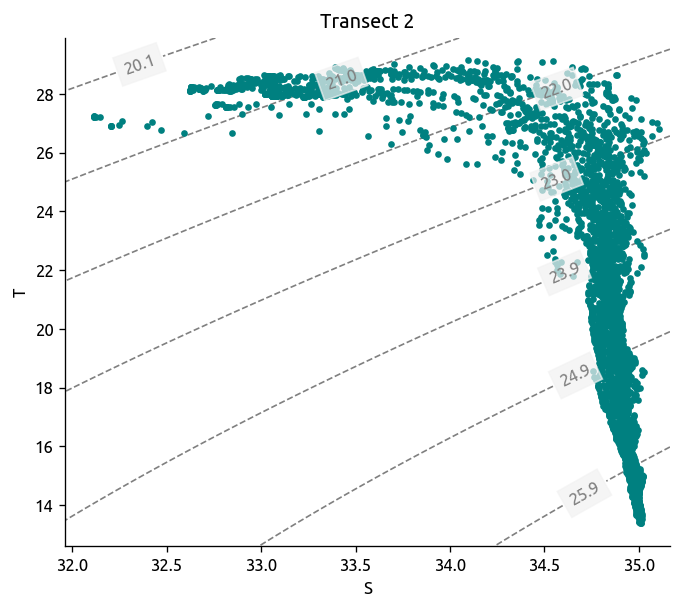
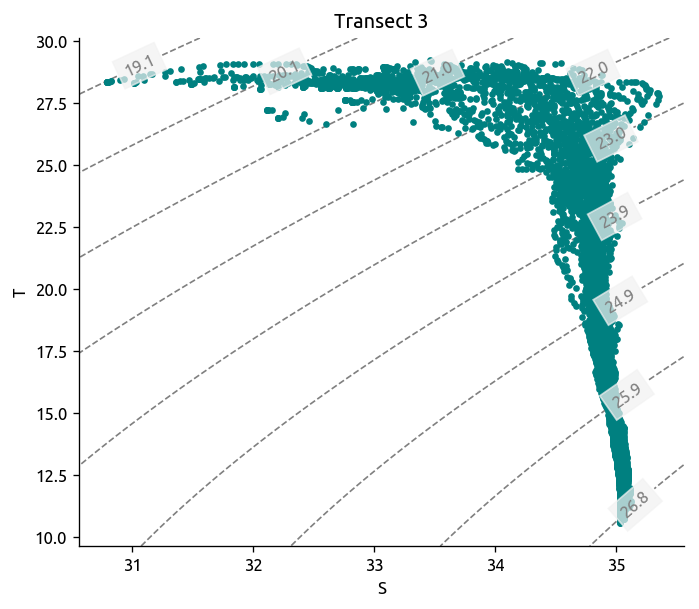
Transect TS plots#
tr1 = xr.open_dataset("../datasets/bob-ctd-chipod/transect_1.nc", autoclose=True)
tr2 = xr.open_dataset("../datasets/bob-ctd-chipod/transect_2.nc", autoclose=True)
tr3 = xr.open_dataset("../datasets/bob-ctd-chipod/transect_3.nc", autoclose=True)

_, bins = pd.cut(tr1.rho.values.ravel(), 8, retbins=True)

dcpy.oceans.TSplot(tr1.S, tr1["T"], tr1.pres, rho_levels=bins - 1000)
plt.title("Transect 1")
plt.savefig("../images/bob-TS-transect-1.png", bbox_inches="tight")
dcpy.oceans.TSplot(tr2.S, tr2["T"], tr2.pres, rho_levels=bins - 1000)
plt.title("Transect 2")
plt.savefig("../images/bob-TS-transect-2.png", bbox_inches="tight")
dcpy.oceans.TSplot(tr3.S, tr3["T"], tr3.pres, rho_levels=bins - 1000)
plt.title("Transect 3")
plt.savefig("../images/bob-TS-transect-3.png", bbox_inches="tight")
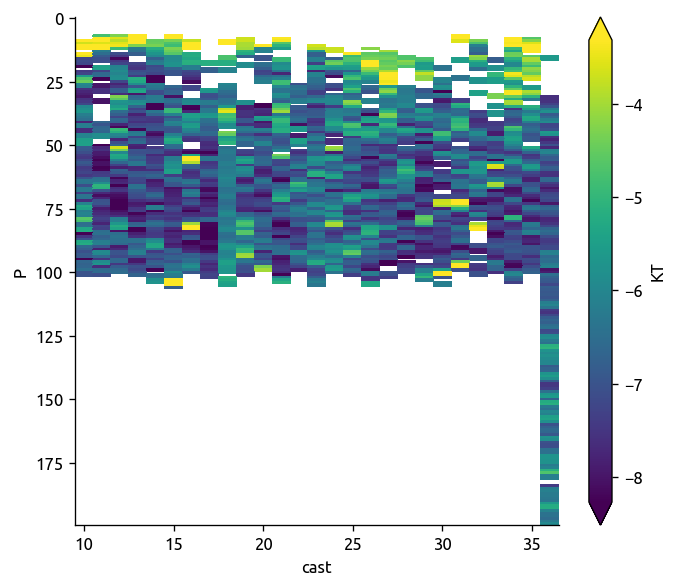
Read and plot single transect#
transect = xr.open_dataset(
"../datasets/bob-ctd-chipod/transect_1.nc", autoclose=True
).sel(cast=slice(10, 36))
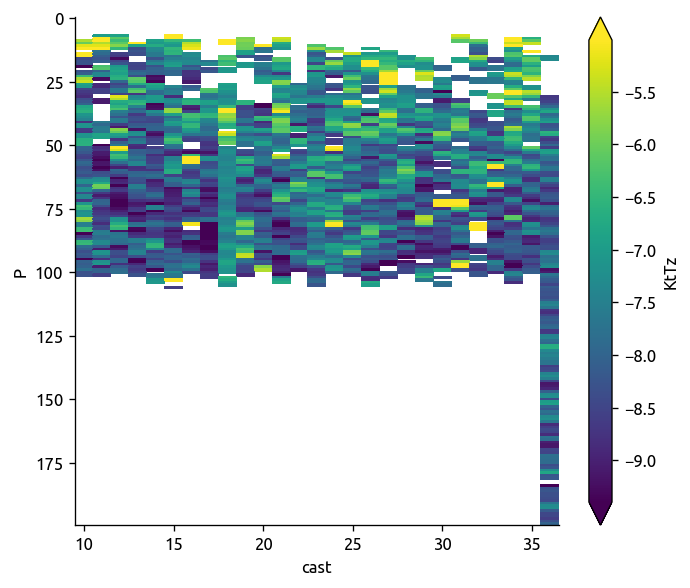
transect["KtTz"] = transect["KT"] * transect["dTdz"]
transect["Jq"] = 1025 * 4200 * transect["KtTz"]
transect["KtTz"].values[np.abs(transect["Jq"].values) > 500] = np.nan
transect["Jq"].values[np.abs(transect["Jq"].values) > 500] = np.nan
np.log10(transect["KT"]).plot(robust=True, yincrease=False)
plt.figure()
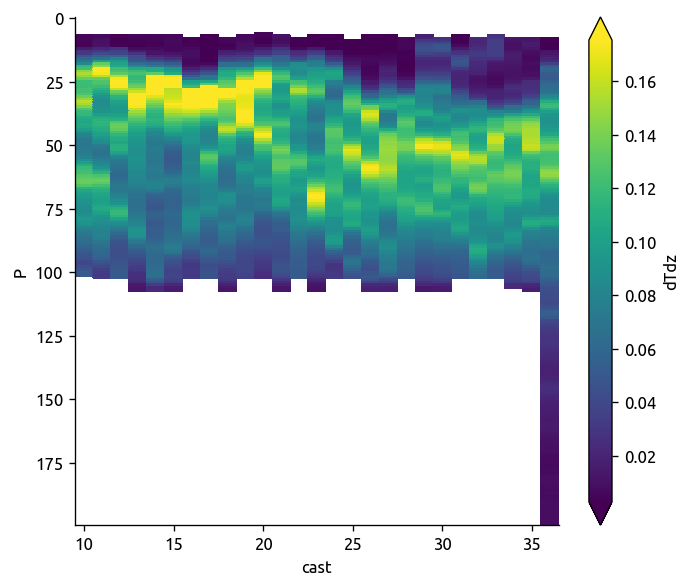
transect["dTdz"].plot(robust=True, yincrease=False)
plt.figure()
np.log10(transect["KtTz"]).plot(robust=True, yincrease=False)
plt.figure()
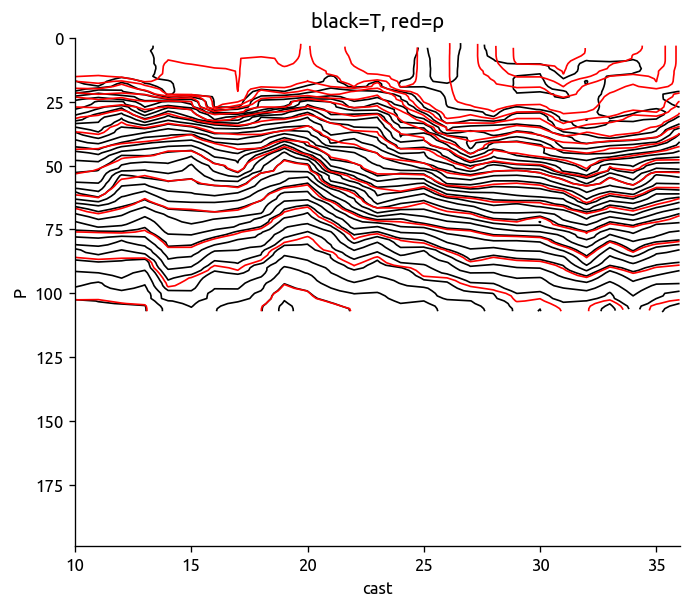
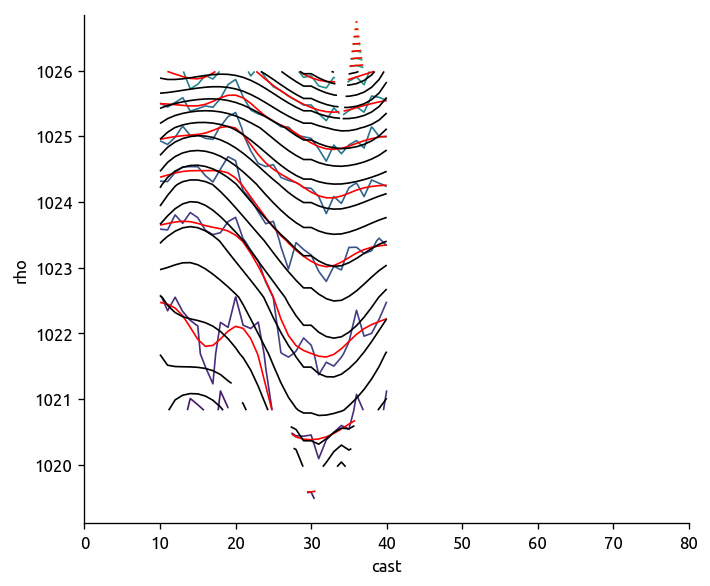
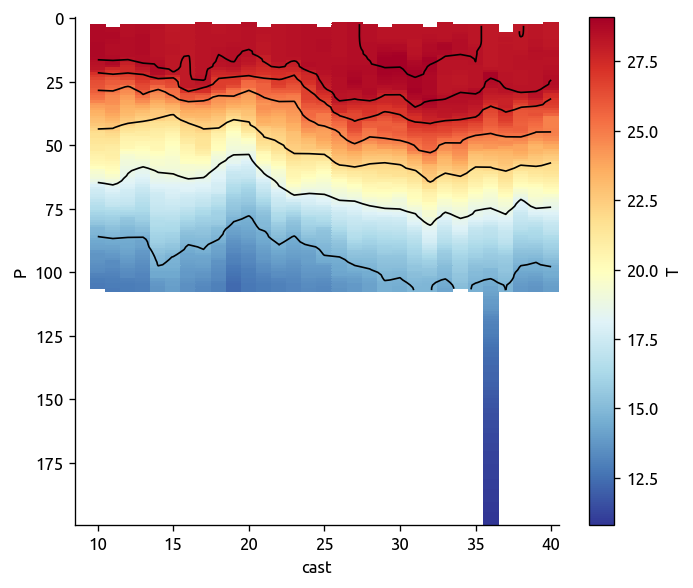
transect["T"].sel(cast=slice(10, 36)).plot.contour(
levels=40, colors="k", robust=True, yincrease=False
)
transect["rho"].sel(cast=slice(10, 36)).plot.contour(
levels=20, colors="r", robust=True, yincrease=False
)
plt.title("black=T, red=ρ")
# transect = transect.drop(30, dim='cast').sel(P=slice(None, 110))
/home/deepak/anaconda3/lib/python3.6/site-packages/ipykernel_launcher.py:7: RuntimeWarning: invalid value encountered in greater
  import sys
/home/deepak/anaconda3/lib/python3.6/site-packages/ipykernel_launcher.py:8: RuntimeWarning: invalid value encountered in greater
Text(0.5,1,'black=T, red=ρ')
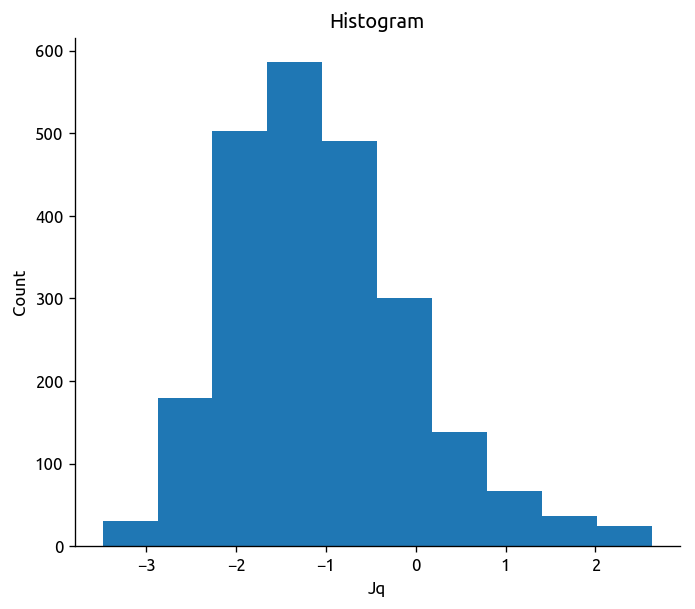
Make sure \(J_q\) isn’t crazy
np.log10(np.abs(transect["Jq"])).plot.hist()
(array([ 30., 179., 503., 586., 491., 301., 138.,  67.,  36.,  25.]),
 array([-3.48594309, -2.87431314, -2.2626832 , -1.65105325, -1.03942331,
        -0.42779336,  0.18383659,  0.79546653,  1.40709648,  2.01872642,
         2.63035637]),
 <a list of 10 Patch objects>)
Process transect data#
transect = xr.open_dataset(
    "../datasets/bob-ctd-chipod/transect_1.nc", autoclose=True
).sel(cast=slice(10, 36))

transect["KtTz"] = transect["KT"] * transect["dTdz"]
transect["Jq"] = 1025 * 4200 * transect["KtTz"]
transect["KtTz"].values[np.abs(transect["Jq"].values) > 1000] = np.nan
transect["Jq"].values[np.abs(transect["Jq"].values) > 1000] = np.nan

transect = transect.sel(P=slice(None, 210))

# def process_transect
# takes transect in z-space as input.

trmean_rho = ed.transect_to_density_space(transect)
/home/deepak/anaconda3/lib/python3.6/site-packages/ipykernel_launcher.py:6: RuntimeWarning: invalid value encountered in greater

/home/deepak/anaconda3/lib/python3.6/site-packages/ipykernel_launcher.py:7: RuntimeWarning: invalid value encountered in greater
  import sys
Read in other datasets#
cole = ed.read_cole()

argograd = xr.open_dataset(
    "../datasets/argo_dec_iso_gradients.nc", decode_times=False, autoclose=True
).load()

eccograd = xr.open_dataset(
    "../datasets/ecco_monthly_iso_gradient.nc", decode_times=False, autoclose=True
).load()
Using climatological gradients#
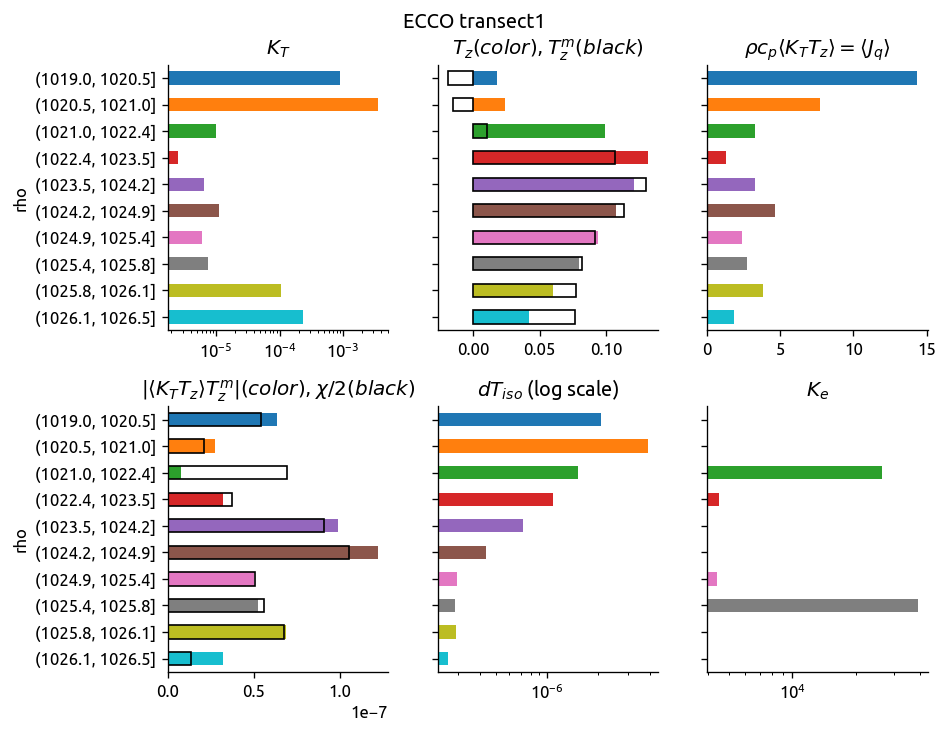
eccoKe = ed.process_transect_1d(transect, eccograd, "ECCO transect1")
argoKe = ed.process_transect_1d(transect, argograd, "ARGO transect1")

Ke = pd.DataFrame()
Ke["ecco"] = eccoKe.Ke
Ke["argo"] = argoKe.Ke
# Ke['rho'] = Ke.ecco.index.mid.astype('float')
eccoKe
| chi | KtTz | dTdz | dTmdz | dTiso | KT | Ke | |
|---|---|---|---|---|---|---|---|
| rho | |||||||
| (1019.0, 1020.5] | 1.087531e-07 | 3.332968e-06 | 0.017668 | -0.019127 | 2.065550e-06 | 0.000894 | -2196.788029 |
| (1020.5, 1021.0] | 4.242331e-08 | 1.787747e-06 | 0.023994 | -0.015216 | 3.913078e-06 | 0.003574 | -391.230758 |
| (1021.0, 1022.4] | 1.383193e-07 | 7.649035e-07 | 0.099101 | 0.010196 | 1.521268e-06 | 0.000010 | 26514.376375 |
| (1022.4, 1023.5] | 7.467831e-08 | 3.012975e-07 | 0.131284 | 0.106301 | 1.086169e-06 | 0.000003 | 4501.655168 |
| (1023.5, 1024.2] | 1.822328e-07 | 7.604694e-07 | 0.121188 | 0.130226 | 7.190793e-07 | 0.000006 | -15309.981990 |
| (1024.2, 1024.9] | 2.110117e-07 | 1.077232e-06 | 0.107393 | 0.113445 | 4.345696e-07 | 0.000011 | -88435.950761 |
| (1024.9, 1025.4] | 1.015220e-07 | 5.481218e-07 | 0.093691 | 0.091905 | 2.953978e-07 | 0.000006 | 4423.677911 |
| (1025.4, 1025.8] | 1.114811e-07 | 6.400163e-07 | 0.079396 | 0.082158 | 2.854238e-07 | 0.000007 | 38766.088873 |
| (1025.8, 1026.1] | 1.349486e-07 | 8.839158e-07 | 0.060302 | 0.077620 | 2.923084e-07 | 0.000105 | -13281.205312 |
| (1026.1, 1026.5] | 2.656529e-08 | 4.195098e-07 | 0.041820 | 0.076793 | 2.593703e-07 | 0.000235 | -281430.091207 |
/home/deepak/anaconda3/lib/python3.6/site-packages/_pytest/fixtures.py:847: DeprecationWarning: The `convert` argument is deprecated in favor of `converter`.  It will be removed after 2019/01.
  params = attr.ib(convert=attr.converters.optional(tuple))
/home/deepak/anaconda3/lib/python3.6/site-packages/_pytest/fixtures.py:849: DeprecationWarning: The `convert` argument is deprecated in favor of `converter`.  It will be removed after 2019/01.
  ids = attr.ib(default=None, convert=_ensure_immutable_ids)
ed.plot_bar_Ke(eccoKe)
# ed.plot_bar_Ke(argoKe)
plt.figure()
argomean.dTdia.plot(x="rho")
eccomean.dTdia.plot(x="rho")
(trmean.dTdz).plot(x="rho")
plt.legend(["argo", "ecco", "transect"])

plt.figure()
argomean.dTiso.plot(x="rho")
eccomean.dTiso.plot(x="rho")
---------------------------------------------------------------------------
NameError                                 Traceback (most recent call last)
<ipython-input-30-9f1417f79a7b> in <module>()
      1 plt.figure()
----> 2 argomean.dTdia.plot(x='rho')
      3 eccomean.dTdia.plot(x='rho')
      4 (trmean.dTdz).plot(x='rho')
      5 plt.legend(['argo', 'ecco', 'transect'])

NameError: name 'argomean' is not defined
<Figure size 780x660 with 0 Axes>
(
    ecco.dTiso.sel(lat=slice(transect.lat.min(), transect.lat.max()))
    .sel(lon=transect.lon.mean(), method="nearest")
    .plot.contourf(robust=True, yincrease=False)
)

(
    ecco.Tmean.sel(lat=slice(transect.lat.min(), transect.lat.max()))
    .sel(lon=transect.lon.mean(), method="nearest")
    .plot.contour(robust=True, colors="w", yincrease=False)
)

plt.gca().set_ylim([200, 0])
---------------------------------------------------------------------------
NameError                                 Traceback (most recent call last)
<ipython-input-12-04509405bfa7> in <module>()
----> 1 (ecco.dTiso.sel(lat=slice(transect.lat.min(), transect.lat.max()))
      2  .sel(lon=transect.lon.mean(), method='nearest')
      3  .plot.contourf(robust=True, yincrease=False))
      4
      5 (ecco.Tmean.sel(lat=slice(transect.lat.min(), transect.lat.max()))

NameError: name 'ecco' is not defined
Naveira Garabato et al. (2016) approach#
For turbulence quantities, the averaging operator ⟨⟩ operates only in the vertical direction.
Mean temperature field is determined by spline smoothing on isopycnals and then differentiated to get “large-scale” gradients.
Calculation#
# 1. convert to density space
#############################
trdens = ed.to_density_space(transect1)
Tdens = trdens["T"]

# 2. fit cubic spline along isopycnal
# - this needs to take ρbins as input?
#####################################
Tdens_i = ed.smooth_cubic_spline(trdens["T"], False)
Pdens_i = ed.smooth_cubic_spline(trdens["P"], False)
Tsmooth = ed.to_depth_space(Tdens_i, Pold=Pdens_i, Pnew=None)

# 3. calculate gradients with smoothed field
############################################
dTiso, dTdia = ed.calc_iso_dia_gradients(Tdens_i, Pdens_i)
dTmdz = ed.to_density_space(-ed.xgradient(Tsmooth, "P"))
dTmdz.name = "dz"

# 4. Bin smoothed gradients by density
######################################
ρbins = Tdens_i.rho[::2]
dTdf = (
    ed.exchange(xr.merge([dTdia, dTiso]), {"cast": "dist"}).to_dataframe().reset_index()
)
dTmean = ed.bin_avg_in_density(dTdf, ρbins)
transmean = ed.bin_avg_in_density(trdens.to_dataframe().reset_index(), ρbins)

# 5. do estimate
################
transKe = xr.Dataset()
transKe["Ke"] = (transmean.chi / 2 - transmean.KtTz * dTmean.dia) / dTmean.iso**2
transKe.Ke.name = "$K_e$"
transKe["KT"] = transmean.KT
transKe["KtTz"] = transmean.KtTz
transKe["dTdz"] = transmean.dTdz
transKe["chi"] = transmean.chi
transKe["dTmdz"] = dTmean.dia
transKe["dTiso"] = dTmean.iso
transKe["rho"].values = np.round(transKe.rho.values, decimals=2)
transKe.attrs.name = "BoB CTD χpod"

ed.plot_transect_Ke(transKe)

ed.plot_bar_Ke(transKe.isel(cast=20).to_dataframe())
/home/deepak/anaconda3/lib/python3.6/site-packages/numpy/lib/function_base.py:1775: RuntimeWarning: divide by zero encountered in true_divide
  a = -(dx2)/(dx1 * (dx1 + dx2))
/home/deepak/anaconda3/lib/python3.6/site-packages/numpy/lib/function_base.py:1775: RuntimeWarning: invalid value encountered in true_divide
  a = -(dx2)/(dx1 * (dx1 + dx2))
/home/deepak/anaconda3/lib/python3.6/site-packages/numpy/lib/function_base.py:1776: RuntimeWarning: divide by zero encountered in true_divide
  b = (dx2 - dx1) / (dx1 * dx2)
/home/deepak/anaconda3/lib/python3.6/site-packages/numpy/lib/function_base.py:1776: RuntimeWarning: invalid value encountered in true_divide
  b = (dx2 - dx1) / (dx1 * dx2)
/home/deepak/anaconda3/lib/python3.6/site-packages/numpy/lib/function_base.py:1777: RuntimeWarning: divide by zero encountered in true_divide
  c = dx1 / (dx2 * (dx1 + dx2))
/home/deepak/anaconda3/lib/python3.6/site-packages/numpy/lib/function_base.py:1777: RuntimeWarning: invalid value encountered in true_divide
  c = dx1 / (dx2 * (dx1 + dx2))
---------------------------------------------------------------------------
InvalidIndexError                         Traceback (most recent call last)
<ipython-input-470-da88d5c9529c> in <module>()
     13 # 3. calculate gradients with smoothed field
     14 ############################################
---> 15 dTiso, dTdia = ed.calc_iso_dia_gradients(Tdens_i, Pdens_i)
     16 dTmdz = ed.to_density_space(-ed.xgradient(Tsmooth, 'P'))
     17 dTmdz.name = 'dz'

~/work/eddydiff/eddydiff/eddydiff.py in calc_iso_dia_gradients(field, pres, debug)
    386
    387     iso = (xgradient(field, 'dist')
--> 388            .interp({'dist': field.dist.values})/1000)
    389     iso.name = 'iso'
    390

~/work/python/xarray/xarray/core/dataarray.py in interp(self, coords, method, assume_sorted, kwargs, **coords_kwargs)
    949         ds = self._to_temp_dataset().interp(
    950             coords, method=method, kwargs=kwargs, assume_sorted=assume_sorted,
--> 951             **coords_kwargs)
    952         return self._from_temp_dataset(ds)
    953

~/work/python/xarray/xarray/core/dataset.py in interp(self, coords, method, assume_sorted, kwargs, **coords_kwargs)
   1876                                     in indexers.items() if k in var.dims}
   1877                     variables[name] = missing.interp(
-> 1878                         var, var_indexers, method, **kwargs)
   1879                 elif all(d not in indexers for d in var.dims):
   1880                     # keep unrelated object array

~/work/python/xarray/xarray/core/missing.py in interp(var, indexes_coords, method, **kwargs)
    427     # simple speed up for the local interpolation
    428     if method in ['linear', 'nearest']:
--> 429         var, indexes_coords = _localize(var, indexes_coords)
    430
    431     # default behavior

~/work/python/xarray/xarray/core/missing.py in _localize(var, indexes_coords)
    388     for dim, [x, new_x] in indexes_coords.items():
    389         index = x.to_index()
--> 390         imin = index.get_loc(np.min(new_x.values), method='nearest')
    391         imax = index.get_loc(np.max(new_x.values), method='nearest')
    392

~/anaconda3/lib/python3.6/site-packages/pandas/core/indexes/numeric.py in get_loc(self, key, method, tolerance)
    417             pass
    418         return super(Float64Index, self).get_loc(key, method=method,
--> 419                                                  tolerance=tolerance)
    420
    421     @cache_readonly

~/anaconda3/lib/python3.6/site-packages/pandas/core/indexes/base.py in get_loc(self, key, method, tolerance)
   3066                 return self._engine.get_loc(self._maybe_cast_indexer(key))
   3067
-> 3068         indexer = self.get_indexer([key], method=method, tolerance=tolerance)
   3069         if indexer.ndim > 1 or indexer.size > 1:
   3070             raise TypeError('get_loc requires scalar valued input')

~/anaconda3/lib/python3.6/site-packages/pandas/core/indexes/base.py in get_indexer(self, target, method, limit, tolerance)
   3228
   3229         if not self.is_unique:
-> 3230             raise InvalidIndexError('Reindexing only valid with uniquely'
   3231                                     ' valued Index objects')
   3232

InvalidIndexError: Reindexing only valid with uniquely valued Index objects
Debugging plots#
trdens = ed.to_density_space(transect1)
Tdens = trdens['T']trdens['P'].plot.contour(levels=20)
dcpy.ts.xfilter(trdens['P'], dim='cast', flen=10).plot.contour(
    colors='r', levels=20)
Pdens_i.plot.contour(levels=20, colors='k')
<matplotlib.contour.QuadContourSet at 0x7f917a6fb048>
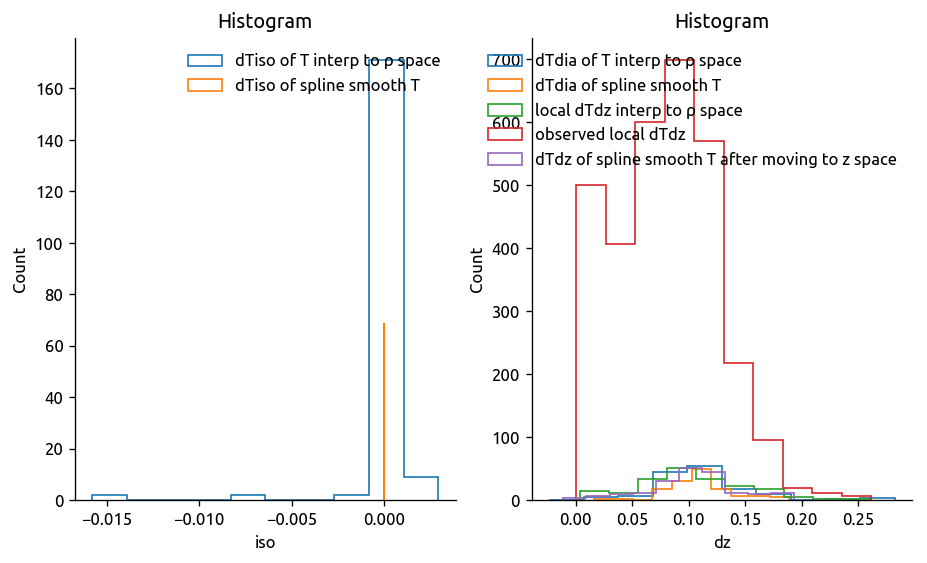
Distributions: dT/dz and dT_diapycnal#
The distributions of (dT/dz)_ρ is different from (dT/dz)_z which is maybe not surprising but the difference is a factor of 2, this makes me suspicious.
dTi, dTd = ed.calc_iso_dia_gradients(trdens["T"], trdens["P"])
dTi_i, dTd_i = ed.calc_iso_dia_gradients(Tdens_i, Pdens_i)

histargs = {"histtype": "step"}

f, ax = plt.subplots(1, 2)
dTi.plot.hist(ax=ax[0], **histargs)
dTi_i.plot.hist(ax=ax[0], **histargs)
ax[0].legend(["dTiso of T interp to ρ space", "dTiso of spline smooth T"])

dTd.plot.hist(ax=ax[1], **histargs)
dTd_i.plot.hist(ax=ax[1], **histargs)
trdens["dTdz"].plot.hist(ax=ax[1], **histargs)
transect["dTdz"].plot.hist(ax=ax[1], **histargs)
dTmdz.plot.hist(ax=ax[1], **histargs)
plt.gca().legend(
    [
        "dTdia of T interp to ρ space",
        "dTdia of spline smooth T",
        "local dTdz interp to ρ space",
        "observed local dTdz",
        "dTdz of spline smooth T after moving to z space",
    ]
)

f.set_size_inches(9, 5)
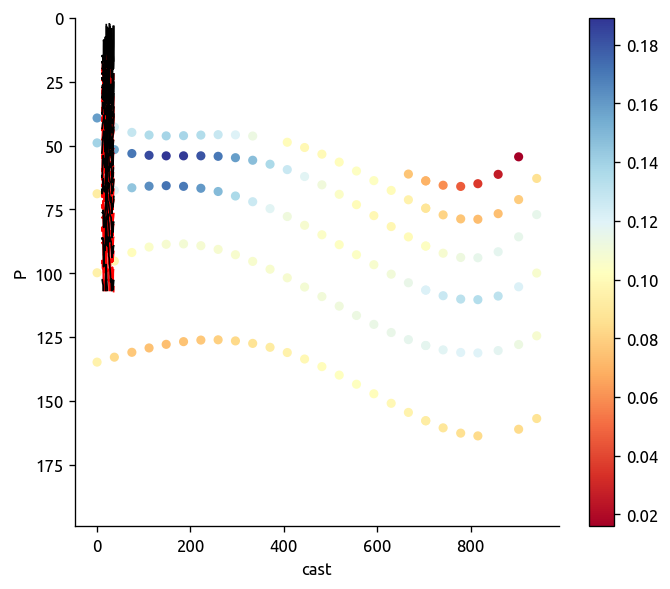
%matplotlib inline
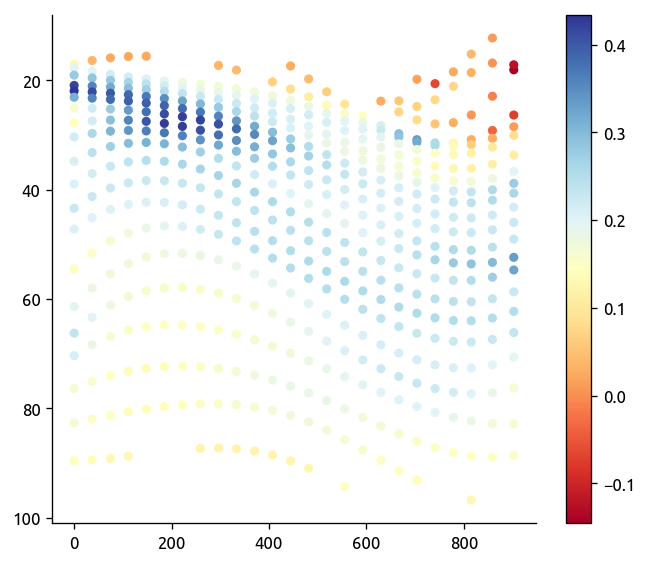
plt.scatter(
xr.broadcast(trdens["dist"], Pdens_i)[0].T, Pdens_i, 20, dTd_i, cmap=mpl.cm.RdYlBu
)
plt.gca().invert_yaxis()
plt.colorbar()
transect["T"].plot.contour(colors="r", levels=30, yincrease=False)
transect["rho"].plot.contour(levels=25, colors="k", yincrease=False)
<matplotlib.contour.QuadContourSet at 0x7f91c0646630>
%matplotlib inline
plt.scatter(
    xr.broadcast(trdens["dist"], Pdens_i)[0].T, Pdens_i, 20, dTd_i, cmap=mpl.cm.RdYlBu
)
plt.gca().invert_yaxis()
plt.colorbar()
<matplotlib.colorbar.Colorbar at 0x7f3310a6c828>
###################################
# sample mean fields along transect
###################################
seltrans = dict(lon=transect.lon, lat=transect.lat, method="nearest")
f, ax = plt.subplots(4, 1)
f.set_size_inches(8, 14)
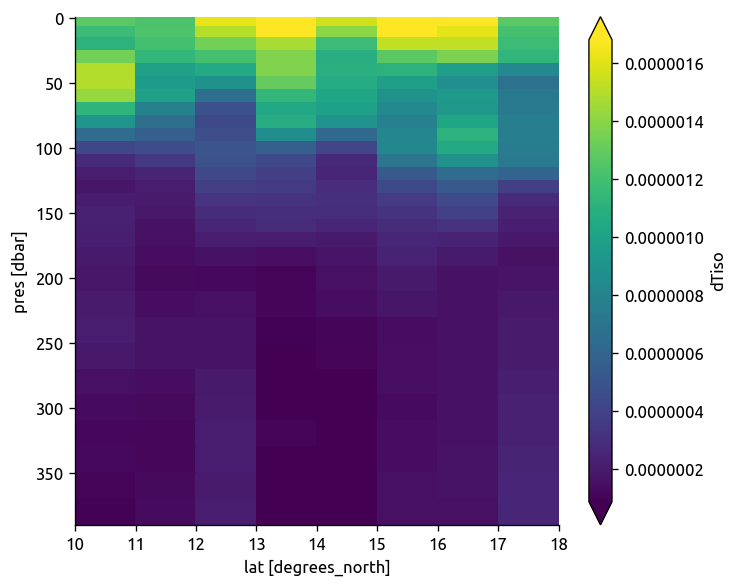
(
eccograd.dTiso.sel(pres=slice(200, 0, -1))
.sel(**seltrans)
.plot(ax=ax[0], cmap=mpl.cm.Reds)
)
(
eccograd.Tmean.sel(pres=slice(200, 0, -1))
.sel(**seltrans)
.plot.contour(ax=ax[0], levels=20, colors="w")
)
ax[0].set_ylim([200, 0])
# plots
Tdens.plot.contourf(levels=50, ax=ax[1], cmap=mpl.cm.RdYlBu_r, yincrease=False)
Tdens_i.plot.contour(levels=50, colors="k", ax=ax[1], yincrease=False)
trdens.P.plot.contour(levels=20, colors="lightgray", ax=ax[1], yincrease=False)
np.abs(dTiso).plot(ax=ax[2], cmap=mpl.cm.Reds, robust=True, yincrease=False)
Tdens_i.plot.contour(levels=50, colors="k", ax=ax[2], yincrease=False)
# trdens.P.plot.contour(levels=20, colors='lightgray', ax=ax[2], yincrease=False)
dTdia.plot(ax=ax[3], robust=True, yincrease=False)
Tdens_i.plot.contour(levels=50, colors="k", ax=ax[3], yincrease=False)
Pdens_i.plot.contour(levels=20, colors="lightgray", ax=ax[3], yincrease=False)
---------------------------------------------------------------------------
TypeError                                 Traceback (most recent call last)
<ipython-input-326-732c21cbdbbf> in <module>()
      7 f.set_size_inches(8, 14)
      8
----> 9 (eccograd.dTiso.sel(pres=slice(200, 0, -1)).sel(**seltrans)
     10  .plot(ax=ax[0], cmap=mpl.cm.Reds))
     11 (eccograd.Tmean.sel(pres=slice(200, 0, -1)).sel(**seltrans)

~/work/python/xarray/xarray/core/dataarray.py in sel(self, indexers, method, tolerance, drop, **indexers_kwargs)
    782         indexers = either_dict_or_kwargs(indexers, indexers_kwargs, 'sel')
    783         ds = self._to_temp_dataset().sel(
--> 784             indexers=indexers, drop=drop, method=method, tolerance=tolerance)
    785         return self._from_temp_dataset(ds)
    786

~/work/python/xarray/xarray/core/dataset.py in sel(self, indexers, method, tolerance, drop, **indexers_kwargs)
   1507         indexers = either_dict_or_kwargs(indexers, indexers_kwargs, 'sel')
   1508         pos_indexers, new_indexes = remap_label_indexers(
-> 1509             self, indexers=indexers, method=method, tolerance=tolerance)
   1510         result = self.isel(indexers=pos_indexers, drop=drop)
   1511         return result._replace_indexes(new_indexes)

~/work/python/xarray/xarray/core/coordinates.py in remap_label_indexers(obj, indexers, method, tolerance, **indexers_kwargs)
    353
    354     pos_indexers, new_indexes = indexing.remap_label_indexers(
--> 355         obj, v_indexers, method=method, tolerance=tolerance
    356     )
    357     # attach indexer's coordinate to pos_indexers

~/work/python/xarray/xarray/core/indexing.py in remap_label_indexers(data_obj, indexers, method, tolerance)
    248         else:
    249             idxr, new_idx = convert_label_indexer(index, label,
--> 250                                                   dim, method, tolerance)
    251             pos_indexers[dim] = idxr
    252             if new_idx is not None:

~/work/python/xarray/xarray/core/indexing.py in convert_label_indexer(index, label, index_name, method, tolerance)
    145
    146     elif is_dict_like(label):
--> 147         is_nested_vals = _is_nested_tuple(tuple(label.values()))
    148         if not isinstance(index, pd.MultiIndex):
    149             raise ValueError('cannot use a dict-like object for selection on '

TypeError: 'numpy.ndarray' object is not callable
f, ax = plt.subplots(2, 1)
f.set_size_inches(8, 6)
trdens["P"].plot.contour(ax=ax[0], yincrease=False, levels=50, colors="k")
Pdens_i.plot.contour(ax=ax[0], yincrease=False, levels=40, cmap=mpl.cm.Blues)
transect["rho"].plot.contour(ax=ax[1], yincrease=False, levels=50)
ax[1].set_ylim([100, 0])
(100, 0)
Ferrari & Polzin (2005) approach#
They average all data on density surfaces, estimate mean depth of isopycnal \(z_n\) and calculate diapycnal gradient. The result is a vertical profile of eddy diffusivity. All spatial variations are averaged over.
They calculate an isopycnal gradient by doing a plane fit along isopycnals to all the data. This is required for the finestructure estimate
transKe
<xarray.Dataset>
Dimensions:  (dist: 26, rho: 14)
Coordinates:
  * dist     (dist) float64 0.0 37.02 74.47 111.3 148.0 185.1 222.2 259.1 ...
  * rho      (rho) float64 1.02e+03 1.02e+03 1.021e+03 1.021e+03 1.022e+03 ...
Data variables:
    Ke       (dist, rho) float64 nan nan nan -293.5 -517.0 -2.837e+03 ...
    KT       (dist, rho) float64 nan nan 0.0003355 6.889e-08 2.743e-08 ...
    KtTz     (dist, rho) float64 nan nan 1.664e-06 4.679e-09 2.365e-09 ...
    dTdz     (dist, rho) float64 nan nan 0.004763 0.06767 0.1226 0.1494 ...
    chi      (dist, rho) float64 nan nan 1.865e-08 6.313e-10 3.188e-10 ...
    dTmdz    (dist, rho) float64 nan nan nan 0.1624 0.3492 0.3736 0.1541 ...
    dTiso    (dist, rho) float64 nan nan -1.973e-06 -1.23e-06 1.135e-06 ...
# def transect_fp(trdens):

trdens = ed.to_density_space(transect)

dTiso = xr.DataArray(
    np.ones_like(trdens.rho) * np.nan, dims=["rho"], coords={"rho": trdens.rho}
)

# fit straight lines to get mean gradients
# FP do a plane fit in 2D
for idx, rr in enumerate(trdens.rho):
    Tvec = trdens["T"].sel(rho=rr)
    mask = ~np.isnan(Tvec)

    if mask.sum() < 3:
        continue

    dTiso[idx], _, _, _, _ = sp.stats.linregress(trdens.dist[mask] * 1000, Tvec[mask])

trmean = trdens.mean(dim="cast")
trmean

Tmean = ed.to_depth_space(
    trmean["T"].expand_dims(["cast"]), Pold=trmean["P"].expand_dims(["cast"])
).mean(dim="cast")
rhomean = ed.to_depth_space(
    trmean["rho"].expand_dims(["cast"]), Pold=trmean["P"].expand_dims(["cast"])
).mean(dim="cast")

_, Tsmooth = ed.fit_spline(Tmean.P, Tmean, k=2)

# Tmean.plot()
dTdz = ed.xgradient(-Tsmooth, dim="P")
dTdz.coords["rho"] = rhomean

dTdz = dTdz.expand_dims(["cast"])
dTdz["rho"] = dTdz.rho.expand_dims(["cast"])

dTmdz = ed.to_density_space(dTdz).mean(dim="cast")

fpKe = xr.Dataset()
fpKe["chi"] = trmean.chi
fpKe["dTmdz"] = trmean.dTdz
fpKe["dTiso"] = dTiso
fpKe["KtTz"] = trmean.KtTz
fpKe["KT"] = trmean.KT
fpKe["dTdz"] = trmean.dTdz

fpKe["Ke"] = np.abs(fpKe.chi / 2 - fpKe.KtTz * fpKe.dTmdz) / fpKe.dTiso**2

ed.plot_bar_Ke(fpKe.to_dataframe())
---------------------------------------------------------------------------
AttributeError                            Traceback (most recent call last)
<ipython-input-323-721f90866cb5> in <module>()
      1 # def transect_fp(trdens):
      2
----> 3 trdens = ed.to_density_space(transect)
      4
      5 dTiso = xr.DataArray(np.ones_like(trdens.rho) * np.nan,

~/work/eddydiff/eddydiff/eddydiff.py in to_density_space(da, rhonew)
    199     in_dens = xr.Dataset()
    200
--> 201     for vv in da.variables:
    202         if vv in da.coords or vv == 'rho':
    203             continue

~/anaconda3/lib/python3.6/site-packages/pandas/core/generic.py in __getattr__(self, name)
   4370             if self._info_axis._can_hold_identifiers_and_holds_name(name):
   4371                 return self[name]
-> 4372             return object.__getattribute__(self, name)
   4373
   4374     def __setattr__(self, name, value):

AttributeError: 'DataFrame' object has no attribute 'variables'
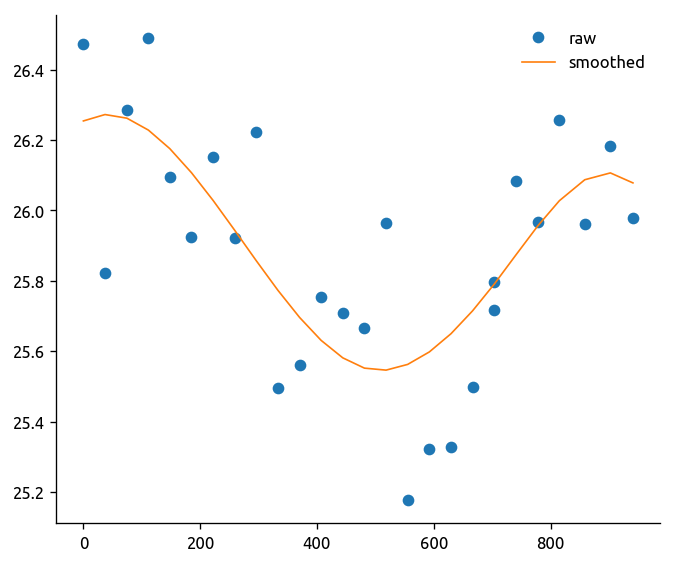
Without interpolating to convert to density space#
mask = ~np.isnan(trmean_rho["T"].isel(rho=5))
ed.fit_spline(
    trmean_rho["dist"][mask].values,
    trmean_rho["T"].isel(rho=5)[mask].values,
    debug=True,
)
(<scipy.interpolate.fitpack2.UnivariateSpline at 0x7f917a7ad6d8>,
 array([26.25453411, 26.27269832, 26.26237948, 26.22850841, 26.17573395,
        26.10729261, 26.02839219, 25.94359928, 25.85682278, 25.77302511,
        25.69583305, 25.63065117, 25.58101885, 25.55179105, 25.54613198,
        25.56238605, 25.59792679, 25.64976453, 25.7146301 , 25.79062798,
        25.79063393, 25.87376963, 25.95664316, 26.02779096, 26.08732754,
        26.10676851, 26.07836197]))
# Run Section 1.3 first
# 2. Generate mean field T, P using cubic splines to smooth
# Calculate Trms as RMS of deviations from smoothed T field
trmean_rho["Tmean"] = ed.smooth_cubic_spline(trmean_rho["T"])
trmean_rho.Tmean.attrs["name"] = "Smoothed temperature"
trmean_rho["Pmean"] = ed.smooth_cubic_spline(trmean_rho["P"])
trmean_rho.Pmean.attrs["name"] = "Smoothed pressure"
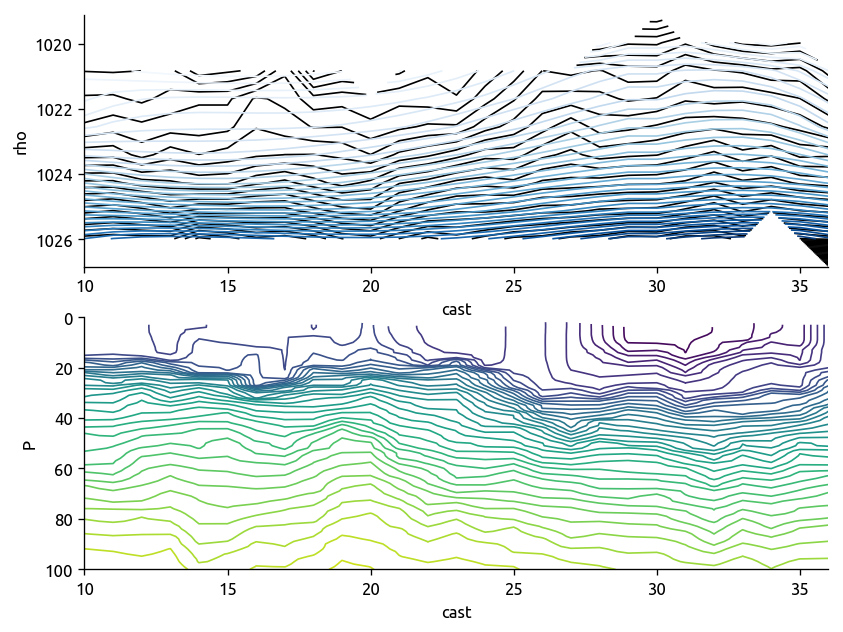
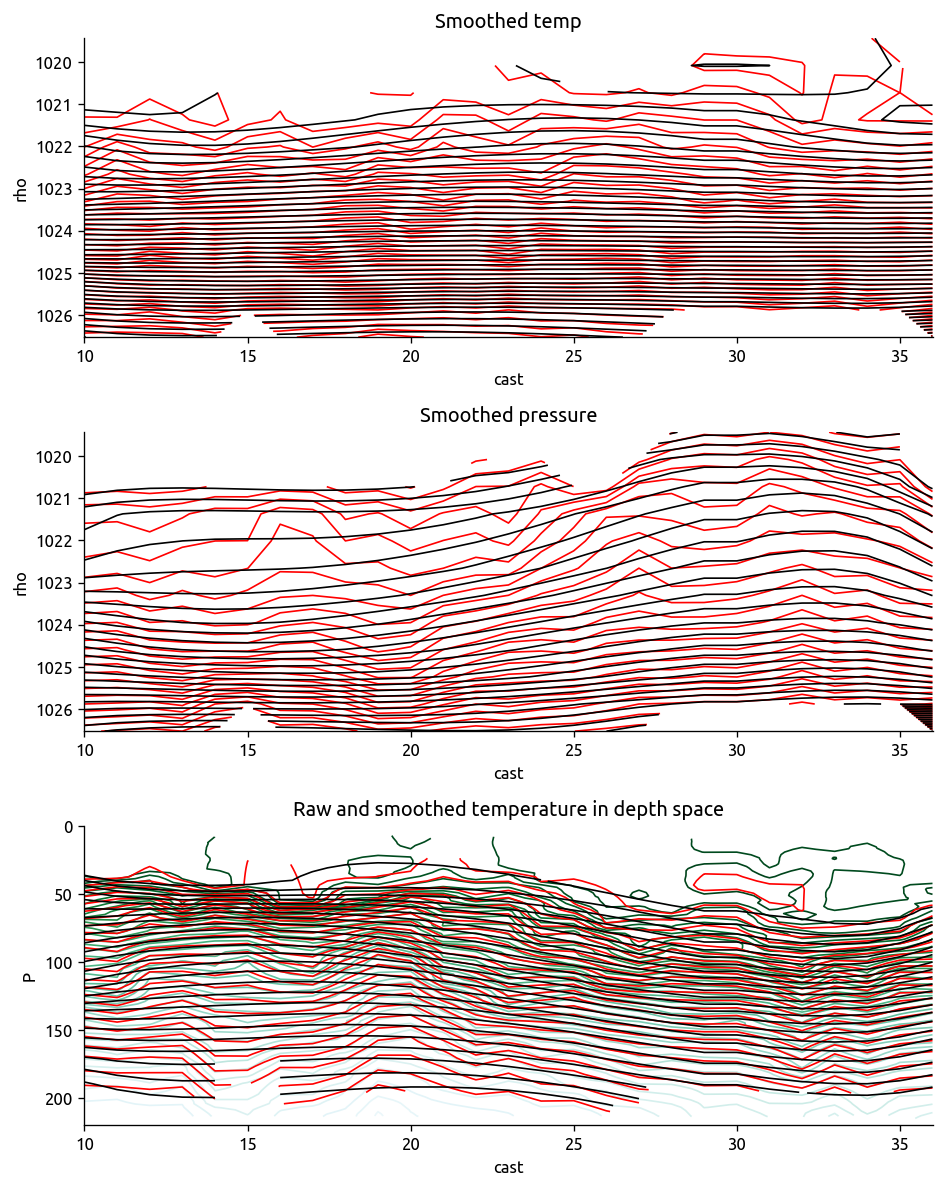
def check_spline_smoothing(T, Ts, P, Ps, Traw, Praw):
f, ax = plt.subplots(3, 1)
T.plot.contour(ax=ax[0], y="rho", levels=50, colors="r")
Ts.plot.contour(ax=ax[0], y="rho", levels=50, colors="k", yincrease=False)
P.plot.contour(ax=ax[1], y="rho", levels=50, colors="r")
Ps.plot.contour(ax=ax[1], y="rho", levels=50, colors="k", yincrease=False)
# cmat, rhomat = xr.broadcast(T.cast, T.rho)
# ax[2].contour(cmat, P, T, levels=50, colors='r')
Tz = ed.to_depth_space(T, P)
Tzs = ed.to_depth_space(Ts, Ps)
ax[2].contour(
xr.broadcast(Traw.cast, Praw)[0], Praw.T, Traw.T, 50, cmap=mpl.cm.BuGn
)
Tz.plot.contour(ax=ax[2], x="cast", levels=30, colors="r")
Tzs.plot.contour(ax=ax[2], x="cast", levels=30, colors="k", yincrease=False)
f.set_size_inches((8, 10))
ax[0].set_title("Smoothed temp")
ax[1].set_title("Smoothed pressure")
ax[2].set_title("Raw and smoothed temperature in depth space")
ax[2].set_ylim([220, 0])
plt.tight_layout()
check_spline_smoothing(
trmean_rho["T"],
trmean_rho["Tmean"],
trmean_rho["P"],
trmean_rho["Pmean"],
transect["T"],
transect["pres"],
)
trmean_rho["Trms"] = np.sqrt(
((trmean_rho["T"] - trmean_rho["Tmean"]) ** 2).mean(dim="cast")
)
trmean_rho.Trms.attrs["name"] = "RMS temp variations"
/home/deepak/anaconda3/lib/python3.6/site-packages/numpy/core/_methods.py:29: RuntimeWarning: invalid value encountered in reduce
  return umr_minimum(a, axis, None, out, keepdims)
/home/deepak/anaconda3/lib/python3.6/site-packages/numpy/core/_methods.py:26: RuntimeWarning: invalid value encountered in reduce
  return umr_maximum(a, axis, None, out, keepdims)
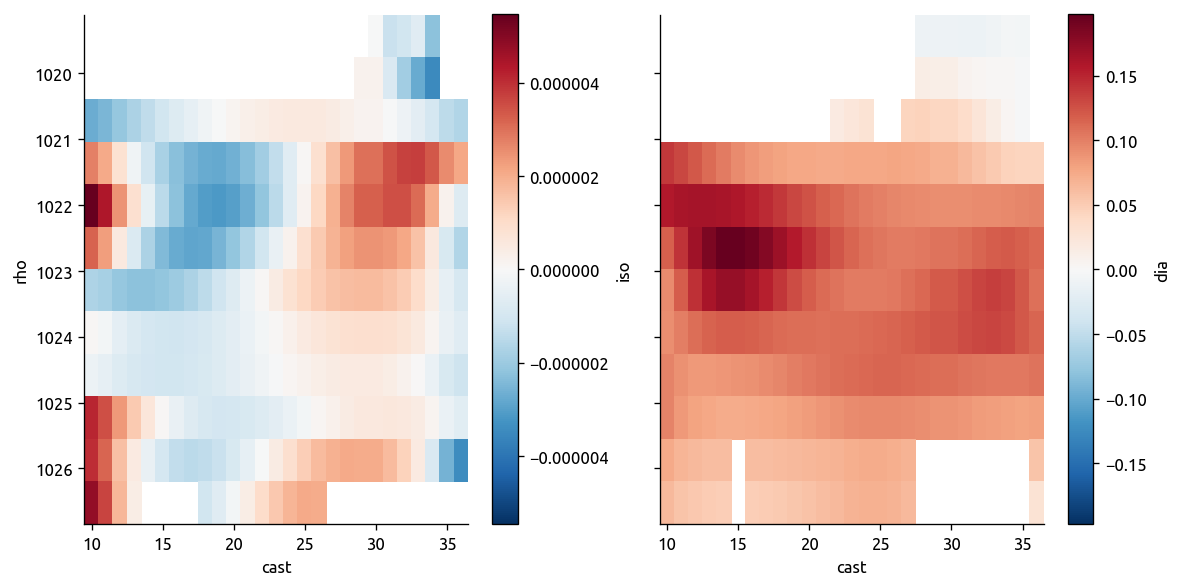
# 3. Calculate isopyncal and diapycnal gradients of the mean field
trmean_rho["dTiso"], trmean_rho["dTdia"] = ed.calc_iso_dia_gradients(
    trmean_rho["Tmean"], trmean_rho["Pmean"], debug=True
)
trmean_rho.dTiso.attrs["name"] = "Isopycnal ∇T"
trmean_rho.dTdia.attrs["name"] = "Diapycnal ∇T"
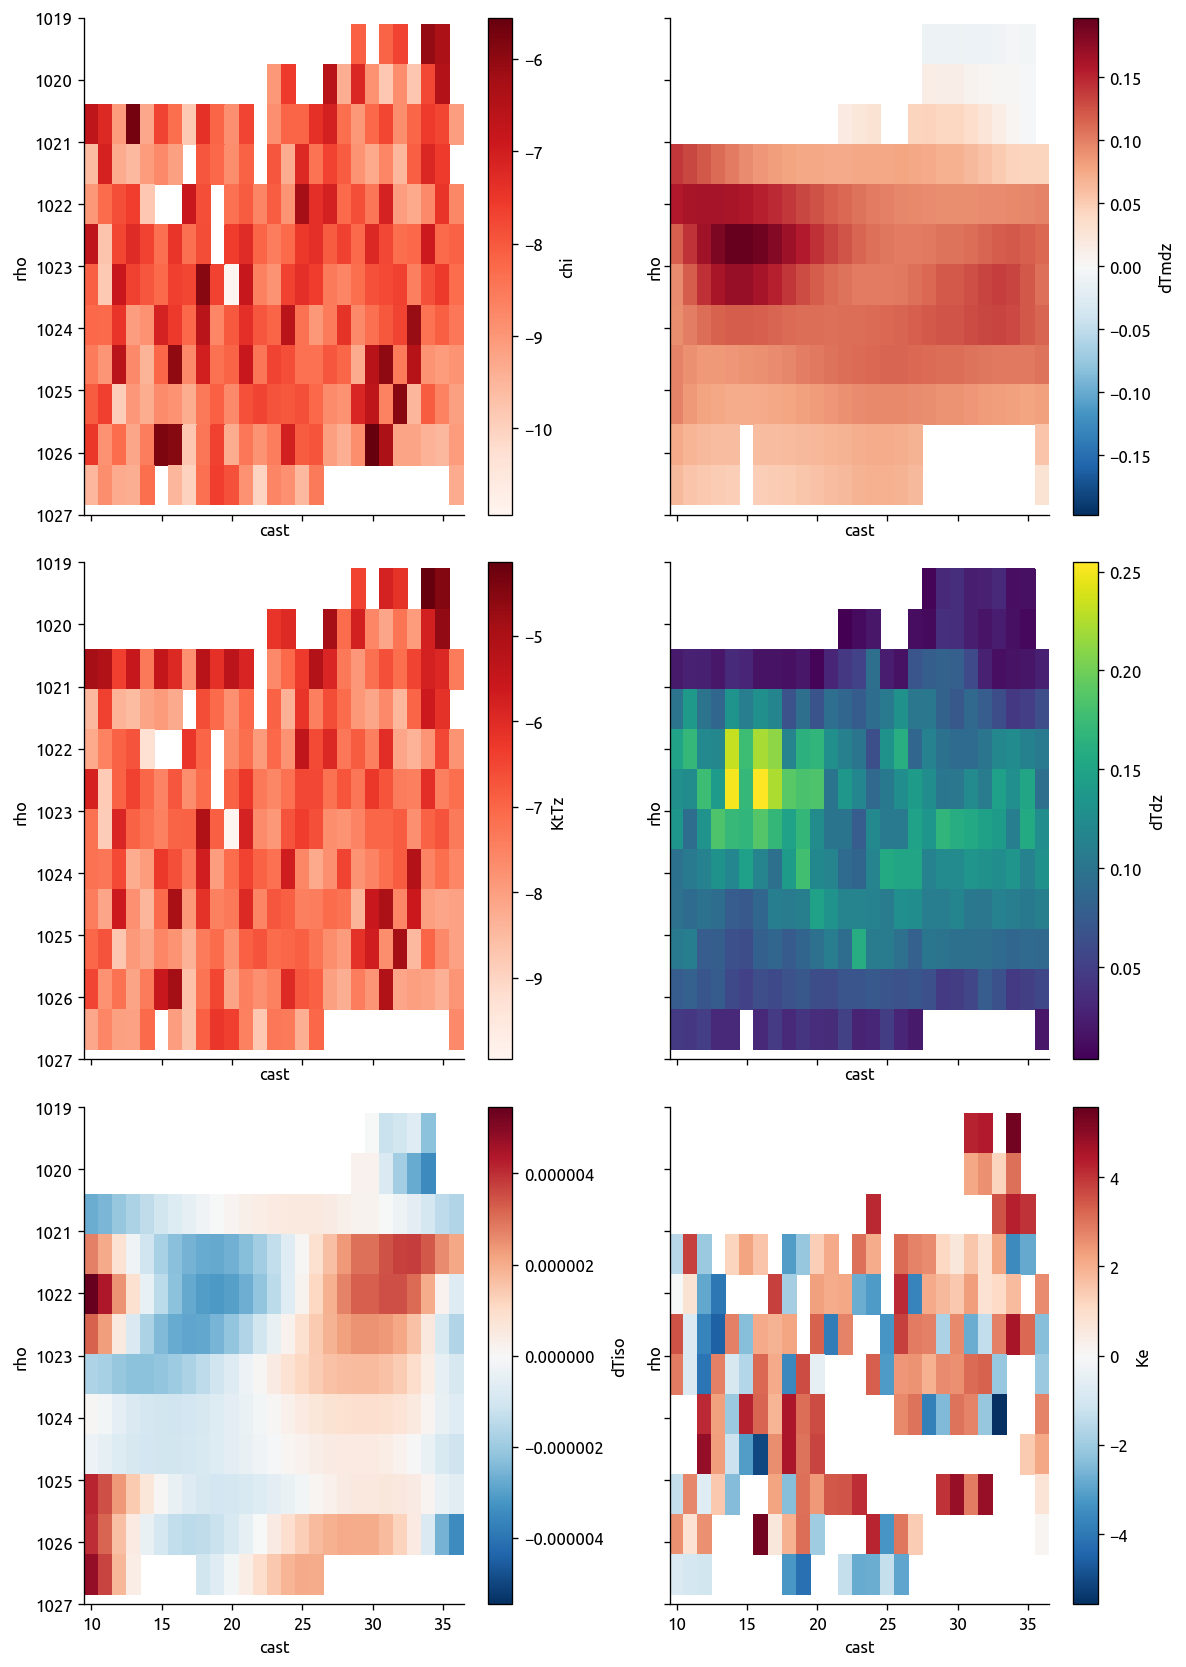
transKe = xr.Dataset()
transKe["KT"] = trmean_rho.KT
transKe["KtTz"] = trmean_rho.KtTz
transKe["dTdz"] = trmean_rho.dTdz
transKe["chi"] = trmean_rho.chi
transKe["dTmdz"] = trmean_rho.dTdia
transKe["dTiso"] = trmean_rho.dTiso
transKe["rho"].values = np.round(transKe.rho.values, decimals=2)
transKe["Tm"] = trmean_rho["Tmean"]
transKe.attrs["name"] = "BoB CTD χpod"


def calc_Ke(transKe, navg=None):

    transKe = transKe.copy()

    if navg is not None and np.isinf(navg):
        transKe = transKe.mean(dim="cast")

    elif navg is not None:
        cbins = np.arange(transKe.cast.min(), transKe.cast.max() + 1, navg)
        transKe = transKe.groupby_bins("cast", cbins, labels=cbins[:-1] + 1).mean(
            dim="cast"
        )

    transKe["Ke"] = (
        transKe.chi / 2 - transKe.KtTz * transKe.dTmdz
    ) / transKe.dTiso**2
    transKe.Ke.values[np.abs(transKe.dTiso.values) < 5e-7] = np.nan
    transKe.Ke["name"] = "$K_e$"

    transKe.attrs["navg"] = navg

    if "cast_bins" in transKe.coords:
        transKe = transKe.rename({"cast_bins": "cast"})

    return transKe


transKe = calc_Ke(transKe)

ed.plot_transect_Ke(transKe)
/home/deepak/anaconda3/lib/python3.6/site-packages/ipykernel_launcher.py:28: RuntimeWarning: invalid value encountered in less
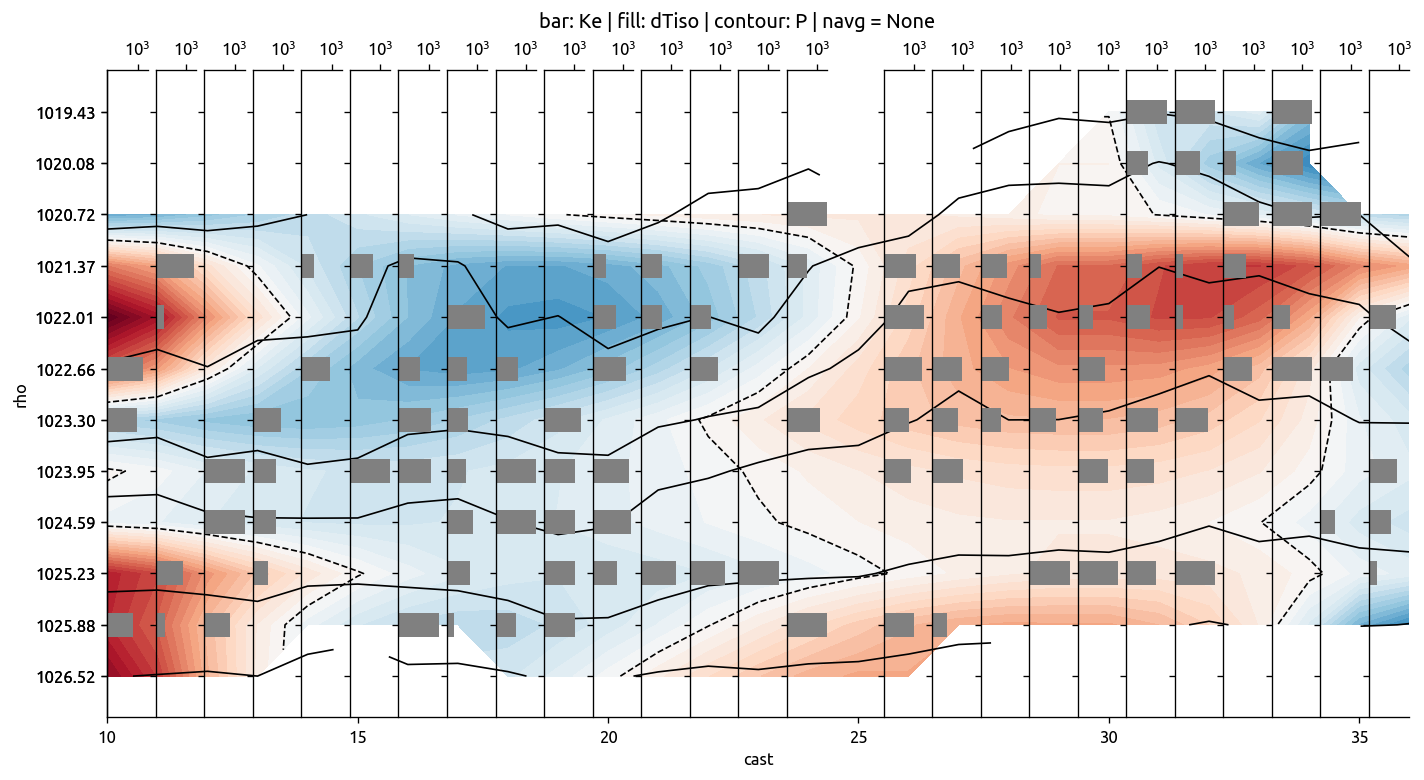
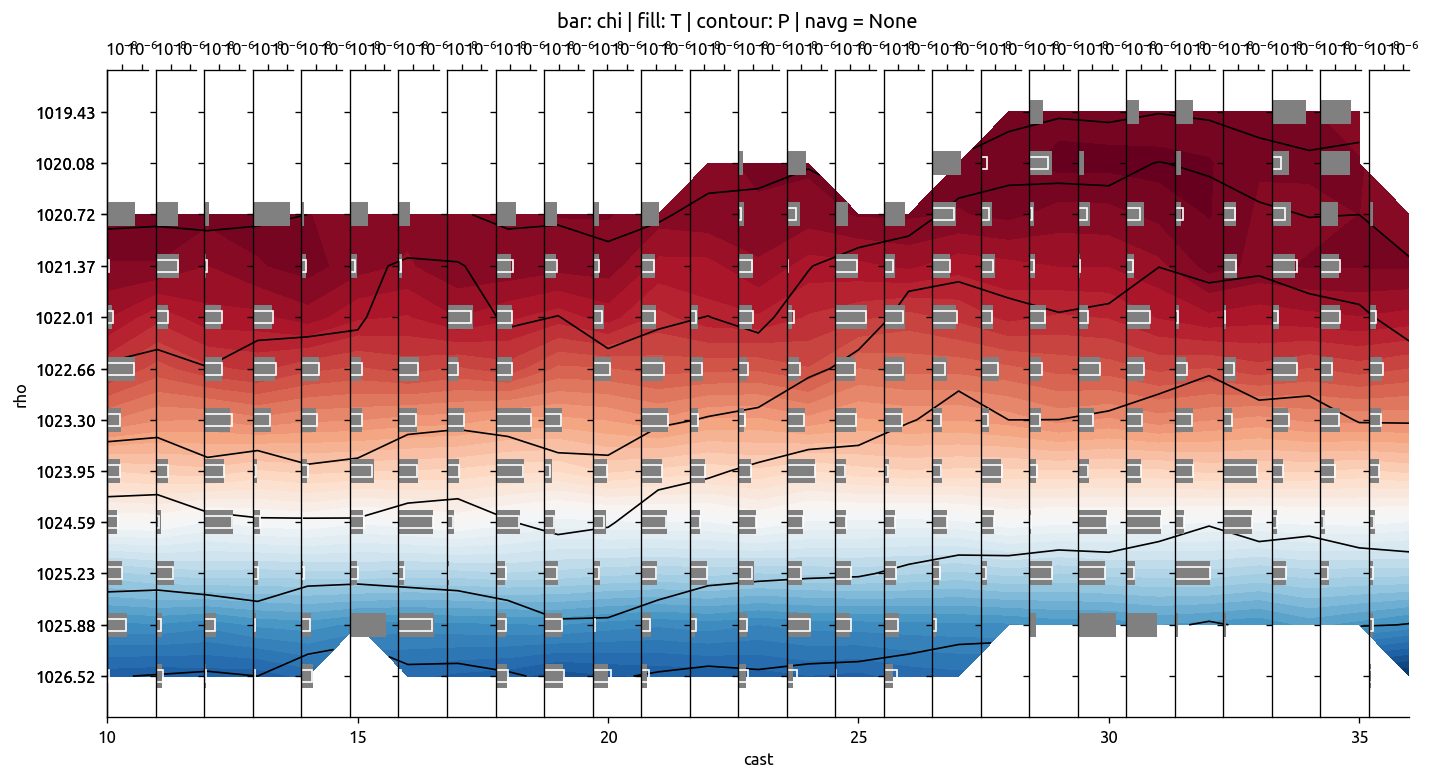
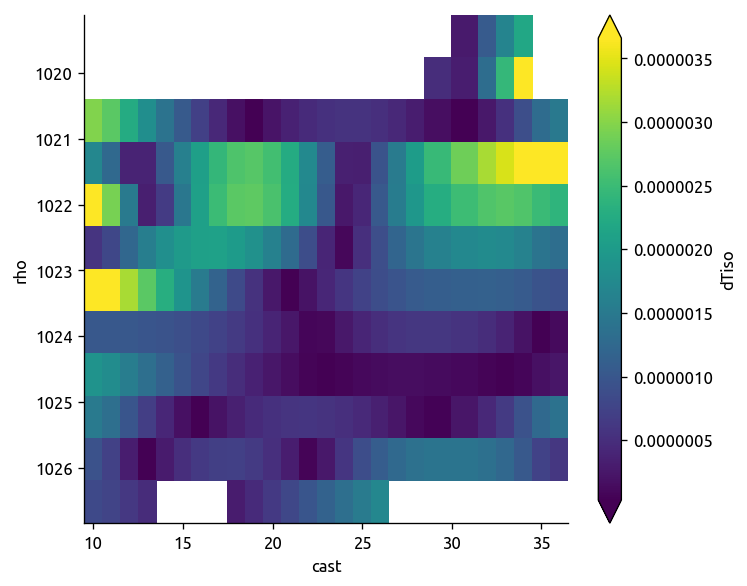
transKe2 = calc_Ke(transKe, navg=None)
ax, axback = ed.plot_transect_var(
    x="cast",
    y="rho",
    data=transKe2.Ke,
    fill=trmean_rho["dTiso"],
    contour=trmean_rho["P"],
    xlim=[1, 1e4],
    xticks=[1e3],
)
ax, axback = ed.plot_transect_var(
    x="cast",
    y="rho",
    data=transKe2.chi / 2,
    bar2=transKe2.KtTz * transKe2.dTmdz,
    fill=trmean_rho["T"],
    contour=trmean_rho["P"],
)
/home/deepak/anaconda3/lib/python3.6/site-packages/ipykernel_launcher.py:28: RuntimeWarning: invalid value encountered in less
/home/deepak/anaconda3/lib/python3.6/site-packages/matplotlib/contour.py:1173: UserWarning: No contour levels were found within the data range.
  warnings.warn("No contour levels were found"
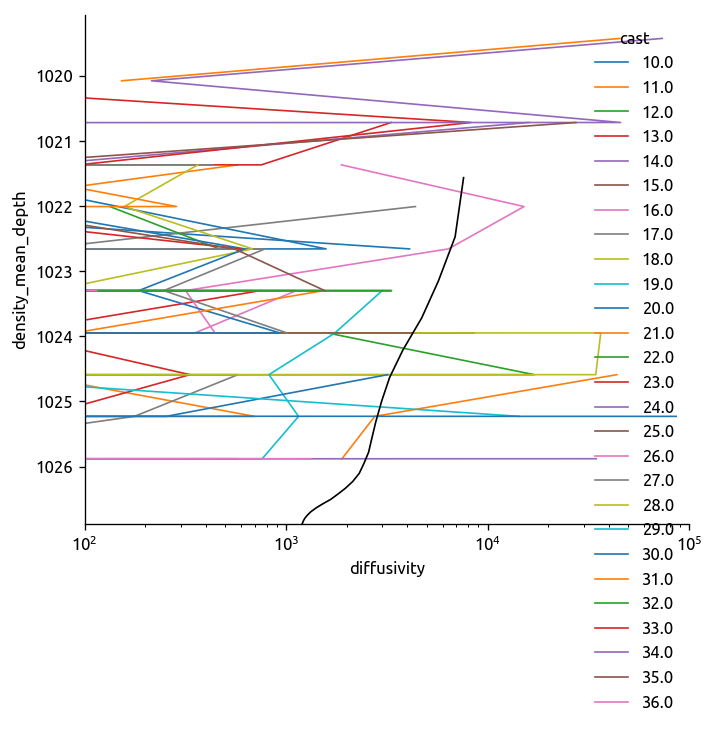
transKe2.Ke.plot.line(y="rho", hue="cast", yincrease=False)
plt.gca().set_xscale("log")
plt.gca().set_xlim([1e2, 1e5])

cole = ed.read_cole()

region = ed.get_region_from_transect(transect)

cole_bay = (cole.sel(lat=region["lat"])).mean(dim="lon").mean(dim="lat")
cole_bay["density_mean_depth"] += 1000
cole_bay = cole_bay.set_coords("density_mean_depth")
cole_bay.diffusivity.plot(y="density_mean_depth", color="k", yincrease=False)
[<matplotlib.lines.Line2D at 0x7f91bf98f860>]
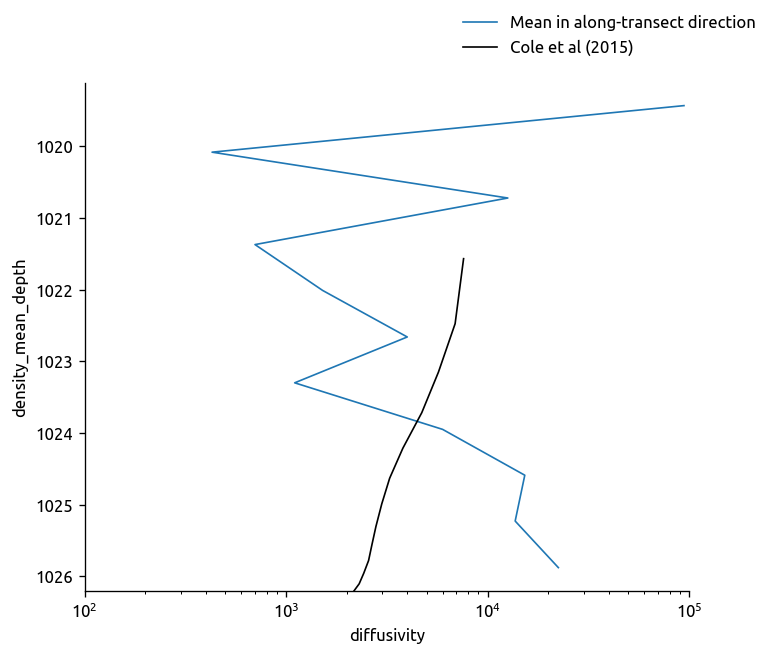
transKe2.Ke.where(transKe2.Ke > 0).mean(dim="cast").plot.line(y="rho")
cole_bay = (cole.sel(lat=region["lat"])).mean(dim="lon").mean(dim="lat")
cole_bay["density_mean_depth"] += 1000
cole_bay = cole_bay.set_coords("density_mean_depth")
cole_bay.diffusivity.plot(y="density_mean_depth", color="k", yincrease=False)

plt.gca().set_xscale("log")
plt.gca().set_xlim([1e2, 1e5])
plt.figlegend(["Mean in along-transect direction", "Cole et al (2015)"])
<matplotlib.legend.Legend at 0x7f91bfb673c8>
Compare various mean fields / gradients#
argo = xr.open_dataset(
    "../datasets/argo_clim_iso_gradients.nc", decode_times=False, autoclose=True
).load()

ecco = xr.open_dataset("../datasets/ecco_annual_iso_gradient.nc", autoclose=True).load()
region = ed.get_region_from_transect(transect)
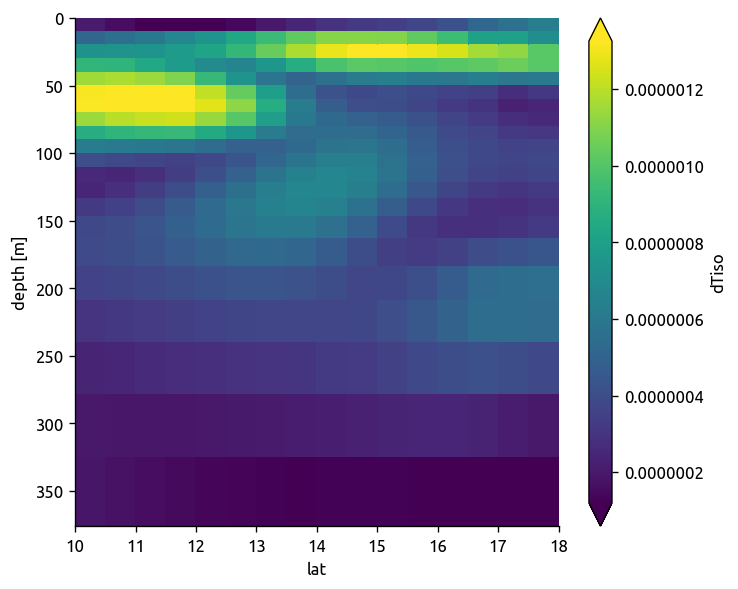
argo.dTiso.sel(**region).mean(dim="lon").plot(robust=True, yincrease=False)
plt.figure()
ecco.dTiso.sel(**region).mean(dim="lon").plot(robust=True, yincrease=False)
plt.figure()
np.abs(trmean_rho.dTiso).plot(robust=True, yincrease=False)
<matplotlib.collections.QuadMesh at 0x7f1c7a70b9e8>
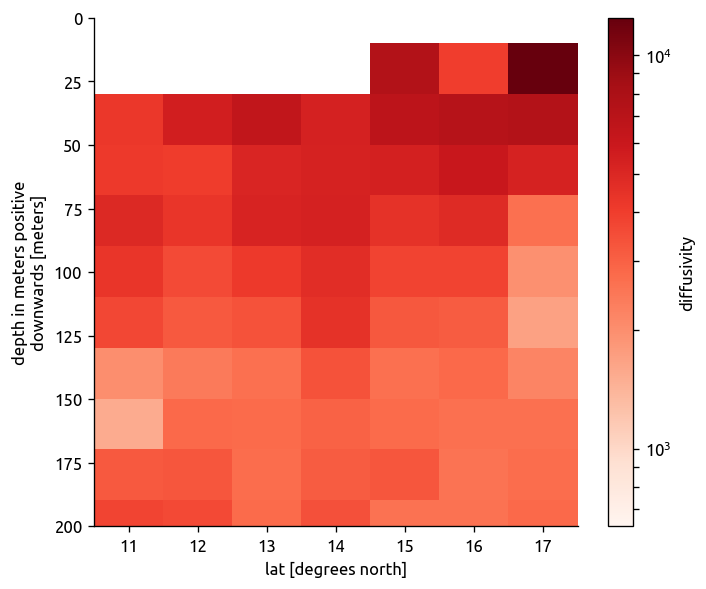
Argo estimate (Cole et al, 2015)#
region = ed.get_region_from_transect(transect)

cole_bay = cole.sel(lat=region["lat"], lon=region["lon"])

(
    cole_bay.diffusivity.mean(dim="lon").plot(
        y="depth", yincrease=False, norm=mpl.colors.LogNorm(), cmap=mpl.cm.Reds
    )
)
plt.gca().set_ylim([200, 0])
(200, 0)
/home/deepak/anaconda3/lib/python3.6/site-packages/matplotlib/colors.py:1031: RuntimeWarning: invalid value encountered in less_equal
  mask |= resdat <= 0
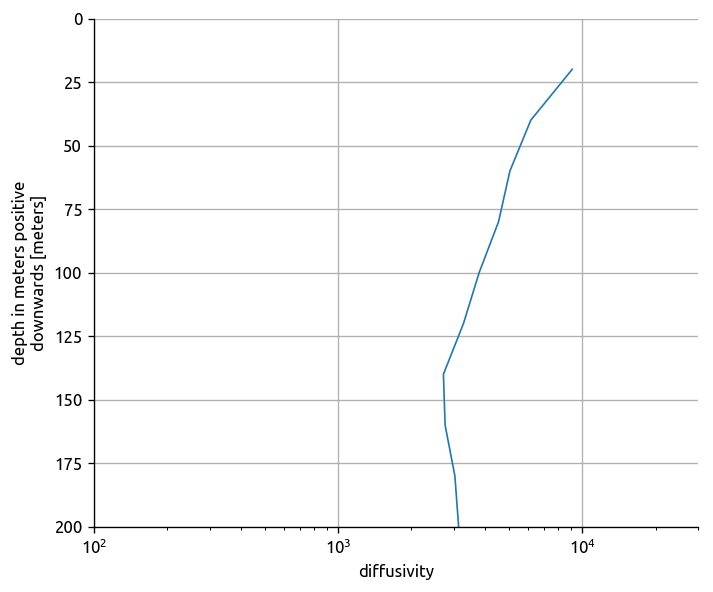
(
    cole_bay.diffusivity.mean(dim="lat")
    .mean(dim="lon")
    .plot.line(y="depth", yincrease=False)
)
plt.gca().set_xscale("log")
plt.gca().set_xlim([1e2, 3e4])
plt.gca().set_ylim([200, 0])
plt.gca().grid(True)
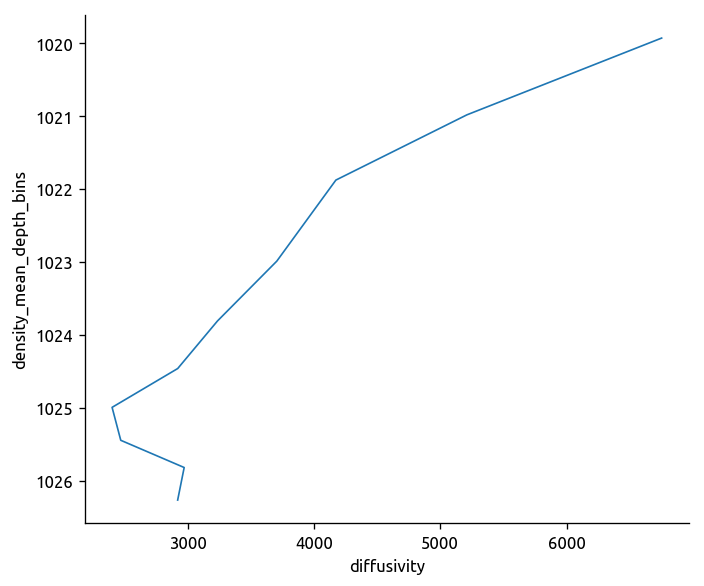
(
    cole_bay.diffusivity.groupby_bins(
        cole_bay.density_mean_depth + 1000, ρbins, labels=(ρbins[:-1] + ρbins[1:]) / 2
    )
    .mean()
    .plot.line(y="density_mean_depth_bins", yincrease=False)
)
[<matplotlib.lines.Line2D at 0x7f91cf175dd8>]
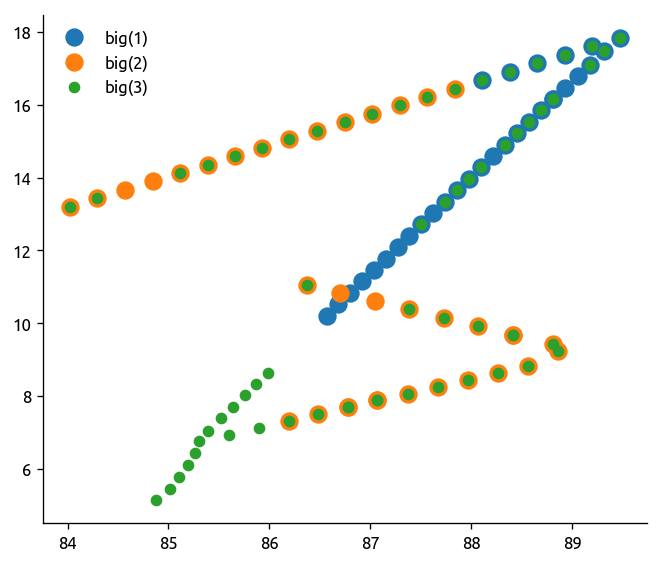
All data combined#
Let’s ignore 3 for now, not sure why that overlaps.
transect1 = xr.open_dataset("../datasets/bob-ctd-chipod/transect_1.nc", autoclose=True)

transect2 = xr.open_dataset("../datasets/bob-ctd-chipod/transect_2.nc", autoclose=True)

transect3 = xr.open_dataset("../datasets/bob-ctd-chipod/transect_3.nc", autoclose=True)

plt.plot(transect1.lon, transect1.lat, ".", ms=20)
plt.plot(transect2.lon, transect2.lat, ".", ms=20)
plt.plot(transect3.lon, transect3.lat, "o")
plt.legend(("big(1)", "big(2)", "big(3)"))
<matplotlib.legend.Legend at 0x7fb11cb45390>
# merge transect 1 and transect2
transect = pd.concat(
[tr.to_dataframe().reset_index() for tr in [transect1.sel(P=slice(0, 120))]]
)
transect["KtTz"] = transect["KT"] * transect["dTdz"]
transect["Jq"] = 1025 * 4200 * transect["KtTz"]
mask = np.logical_or(np.abs(transect["Jq"].values) > 2000, transect["KT"].values > 5e-3)
transect["KtTz"].values[mask] = np.nan
transect["Jq"].values[mask] = np.nan
transect["chi"].values[mask] = np.nan
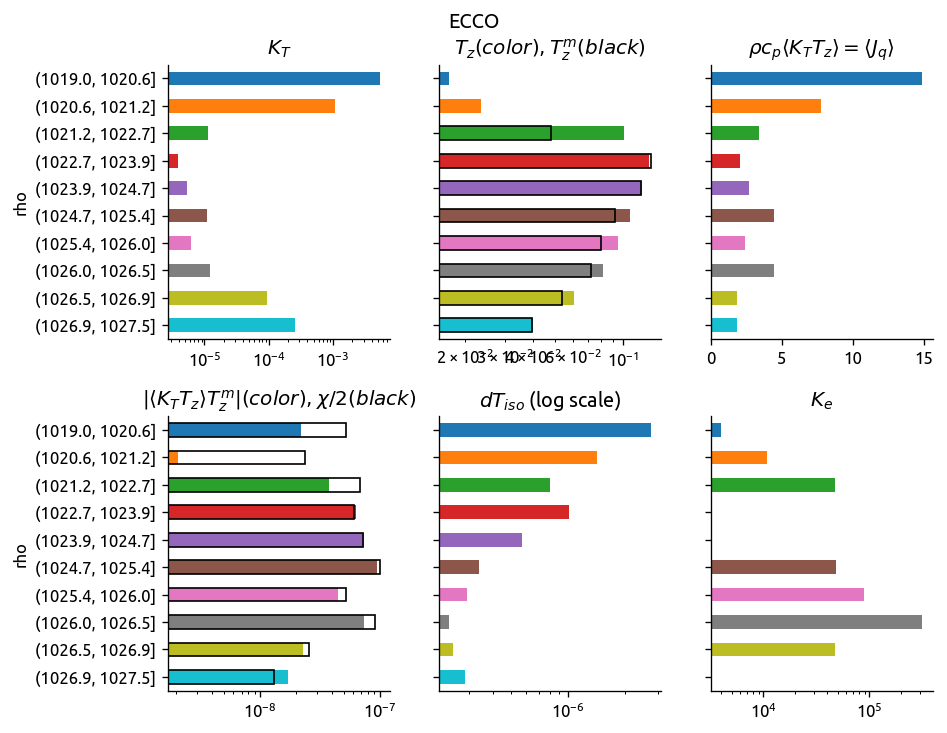
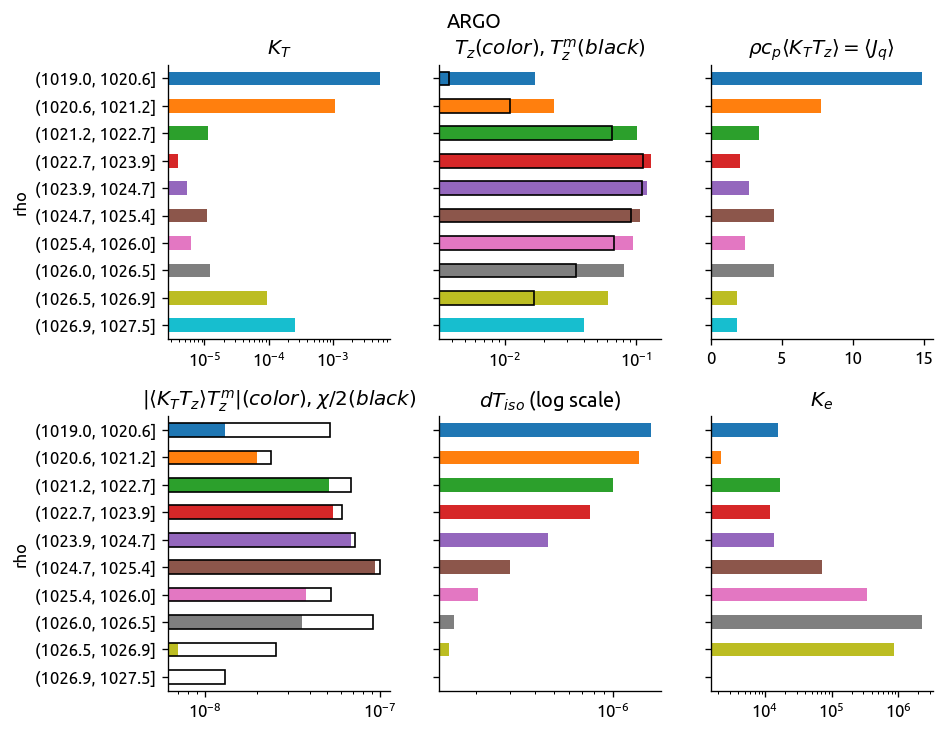
eccoKe2 = ed.process_transect_1d(transect, eccograd, "ECCO")
argoKe2 = ed.process_transect_1d(transect, argograd, "ARGO")
ed.plot_bar_Ke(eccoKe2)
ed.plot_bar_Ke(argoKe2)
eccoKe2.Ke
/home/deepak/anaconda3/lib/python3.6/site-packages/ipykernel_launcher.py:8: RuntimeWarning: invalid value encountered in greater

/home/deepak/anaconda3/lib/python3.6/site-packages/ipykernel_launcher.py:9: RuntimeWarning: invalid value encountered in greater
  if __name__ == '__main__':
rho
(1019.0, 1020.6]      3938.569746
(1020.6, 1021.2]     10729.992555
(1021.2, 1022.7]     46947.664696
(1022.7, 1023.9]     -2230.156607
(1023.9, 1024.7]     -5942.732091
(1024.7, 1025.4]     48277.446666
(1025.4, 1026.0]     89531.725066
(1026.0, 1026.5]    316205.497546
(1026.5, 1026.9]     47694.340619
(1026.9, 1027.5]    -50417.990562
Name: Ke, dtype: float64
transect1["T"].sel(cast=slice(9, 40)).plot(cmap=mpl.cm.RdYlBu_r, yincrease=False)
transect1["rho"].sel(cast=slice(9, 40)).plot.contour(
    colors="k", levels=np.arange(1020, 1028), yincrease=False
)
plt.figure()

(
    eccograd["ρmean"]
    .sel(**ed.get_region_from_transect(transect1))
    .mean(dim="lon")
    .plot.contour(levels=np.arange(1020, 1028), colors="k", yincrease=False)
)
plt.gca().set_ylim([200, 0])
(200, 0)
trmean, ρbins = ed.average_transect_1d(transect)

eccomean = ed.average_clim(eccograd, transect, ρbins)

eccomean
| lat | lon | pres | Tmean | Smean | RHOAnoma | ρmean | dTiso | dTdia | dSiso | dSdia | dTdz_local | dSdz | Pmean | dTdz | |
|---|---|---|---|---|---|---|---|---|---|---|---|---|---|---|---|
| ρmean | |||||||||||||||
| (1019.1, 1020.7] | 16.507143 | 87.464286 | 10.333333 | 28.939016 | 32.836595 | -8.500231 | 1020.499769 | 7.333585e-07 | 0.005335 | 1.824942e-06 | 0.013389 | 0.005335 | -0.013389 | 10.333333 | 0.032508 |
| (1020.7, 1021.2] | 12.984742 | 87.032864 | 14.647887 | 28.798760 | 33.449447 | -7.972470 | 1021.027530 | 6.038192e-07 | 0.011383 | 9.272963e-07 | 0.009727 | 0.011383 | -0.009727 | 14.647887 | 0.032730 |
| (1021.2, 1022.5] | 12.422030 | 86.626856 | 39.381188 | 27.957727 | 33.956771 | -7.209345 | 1021.790655 | 8.870507e-07 | 0.054069 | 5.606805e-07 | 0.020746 | 0.054069 | -0.020746 | 39.381188 | 0.053711 |
| (1022.5, 1023.4] | 12.877078 | 86.702494 | 67.187101 | 25.848192 | 34.483206 | -6.026892 | 1022.973108 | 9.335261e-07 | 0.107467 | 4.611139e-07 | 0.014878 | 0.107467 | -0.014878 | 67.187101 | 0.100398 |
| (1023.4, 1024.2] | 13.092742 | 86.763441 | 84.984611 | 23.781918 | 34.670366 | -5.187314 | 1023.812686 | 7.491000e-07 | 0.123242 | 3.328542e-07 | 0.008024 | 0.123242 | -0.008024 | 84.984611 | 0.126546 |
| (1024.2, 1024.7] | 12.621930 | 86.674561 | 98.163965 | 22.012167 | 34.765387 | -4.548118 | 1024.451882 | 6.128813e-07 | 0.117844 | 2.484168e-07 | 0.004501 | 0.117844 | -0.004500 | 98.163965 | 0.120330 |
| (1024.7, 1025.2] | 12.814516 | 86.855572 | 113.221291 | 20.440335 | 34.814054 | -4.011924 | 1024.988076 | 4.669423e-07 | 0.104717 | 1.765324e-07 | 0.003152 | 0.104717 | -0.003152 | 113.221291 | 0.103577 |
| (1025.2, 1025.7] | 12.620301 | 86.759398 | 127.308123 | 18.991971 | 34.855904 | -3.536118 | 1025.463882 | 3.916333e-07 | 0.093500 | 1.250950e-07 | 0.002424 | 0.093500 | -0.002424 | 127.308123 | 0.111689 |
| (1025.7, 1026.0] | 11.579341 | 86.423653 | 136.347489 | 17.930917 | 34.884922 | -3.205289 | 1025.794711 | 4.132742e-07 | 0.082132 | 9.679136e-08 | 0.001976 | 0.082132 | -0.001976 | 136.347489 | 0.101579 |
| (1026.0, 1026.5] | 12.843915 | 86.653439 | 157.727486 | 16.558279 | 34.917639 | -2.753373 | 1026.246627 | 3.859926e-07 | 0.072626 | 6.896777e-08 | 0.001861 | 0.072626 | -0.001861 | 157.727486 | 0.064202 |
sp, Tsm = ed.fit_spline(eccomean["Pmean"], eccomean["Tmean"], k=3, debug=False)
plt.plot(sp.derivative(1)(eccomean["Pmean"]))
plt.plot(-eccomean.dTdz.values)
---------------------------------------------------------------------------
NameError                                 Traceback (most recent call last)
<ipython-input-22-79acc47f9c17> in <module>()
----> 1 sp, Tsm = ed.fit_spline(eccomean['Pmean'], eccomean['Tmean'], k=3, debug=False)
      2 plt.plot(sp.derivative(1)(eccomean['Pmean']))
      3 plt.plot(-eccomean.dTdz.values)

NameError: name 'eccomean' is not defined
Lessons learned#
Don’t interpolate when converting to density space#
+The fields and gradients are different!+
FALSE ALARM: This is because transect.P and transect.pres are different!
# transform to depth space, calculate gradient and transform back
Tsmooth = ed.to_depth_space(Tdens_i, Pold=Pdens_i, Pnew=None)
dTmdz = -ed.xgradient(Tsmooth, "P")
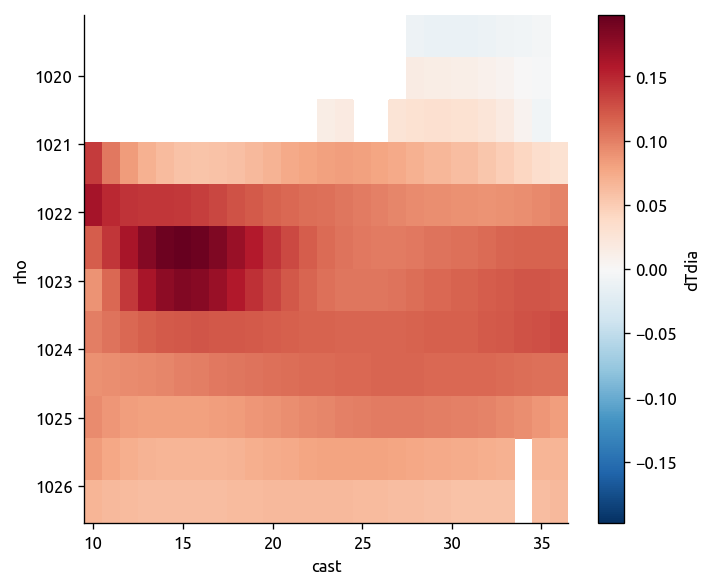
ed.to_density_space(dTmdz).plot(yincrease=False)
# original calculation ΔT and ΔP are estimated in density space
plt.figure()
trmean_rho.dTdia.plot(yincrease=False, x="cast")
<matplotlib.collections.QuadMesh at 0x7fbee9919be0>
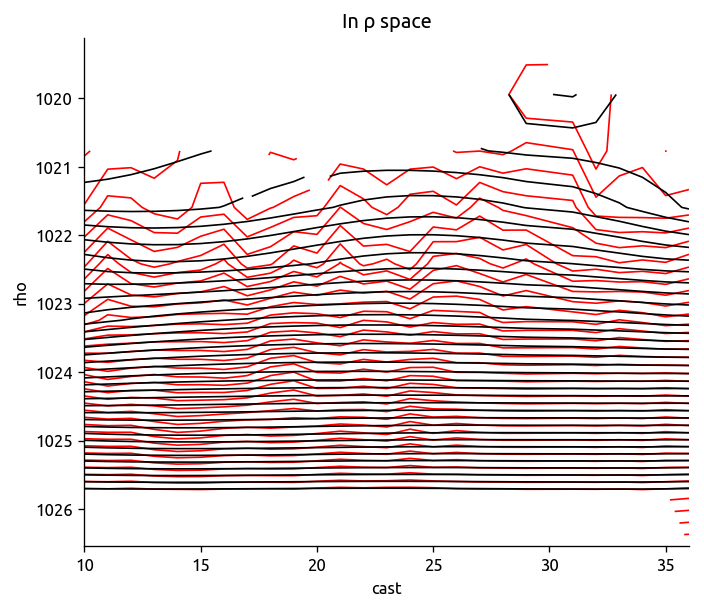
Spline-smooth both temperature and pressure#
Below I calculate dT/dP in density space and compare that to dT/dP calculated by
transforming spline smoothed T to pressure space
differentiate to get dT/dP
convert back to density space and plot.
trdens = ed.to_density_space(transect)
plt.close("all")
Tdens_i = ed.smooth_cubic_spline(trdens["T"], False)
Pdens_i = ed.smooth_cubic_spline(trdens["P"], False)
levels = np.linspace(trdens["T"].min(), trdens["T"].max(), 40)
trdens["T"].plot.contour(colors="r", levels=levels)
Tdens_i.plot.contour(colors="k", levels=levels, yincrease=False)
plt.title("In ρ space")
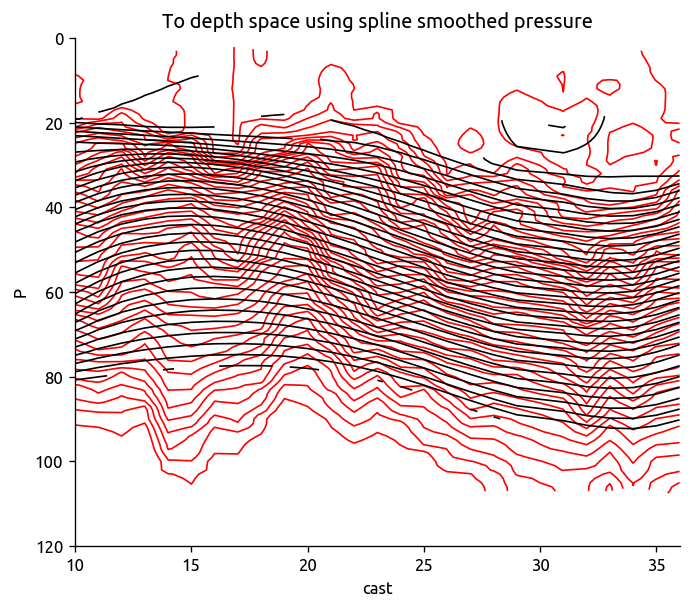
plt.figure()
Tsmooth = ed.to_depth_space(Tdens_i, Pold=Pdens_i, Pnew=None)
transect["T"].plot.contour(colors="r", levels=levels, yincrease=False)
Tsmooth.plot.contour(colors="k", levels=levels, yincrease=False)
plt.title("To depth space using spline smoothed pressure")
plt.ylim([120, 0])
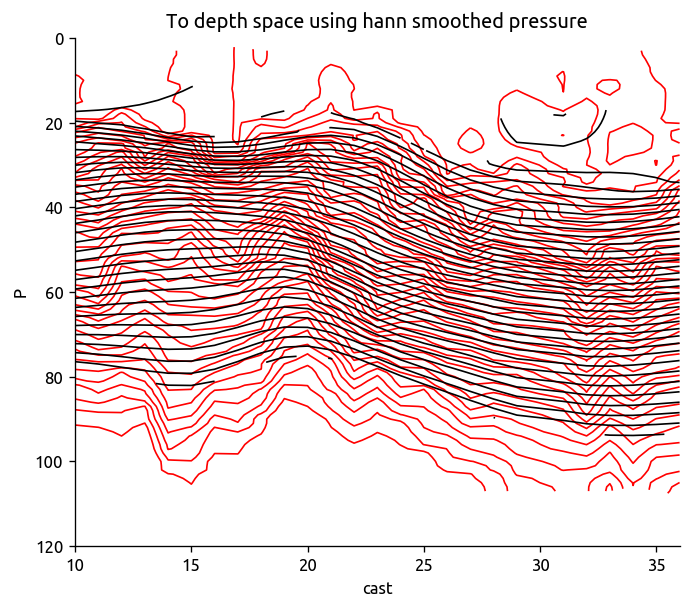
plt.figure()
psmooth = dcpy.ts.xfilter(trdens["P"], dim="cast", flen=10)
Tsmooth = ed.to_depth_space(Tdens_i, Pold=psmooth, Pnew=None)
transect["T"].plot.contour(colors="r", levels=levels, yincrease=False)
Tsmooth.plot.contour(colors="k", levels=levels, yincrease=False)
plt.title("To depth space using hann smoothed pressure")
plt.ylim([120, 0])
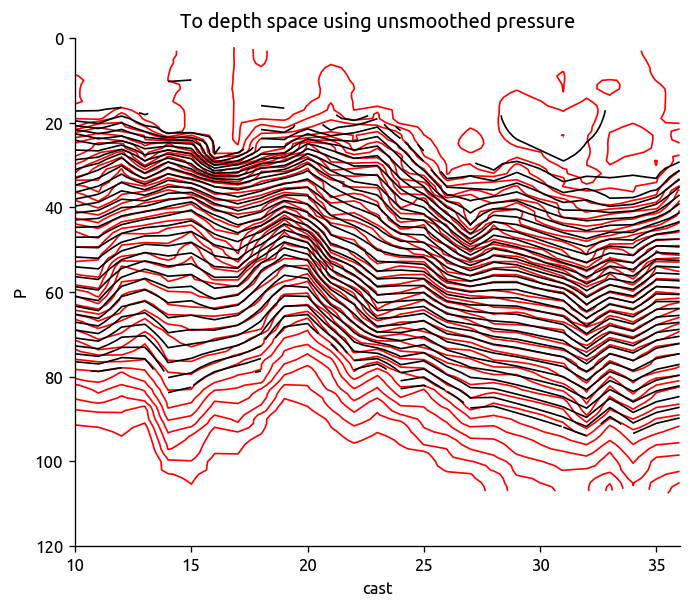
plt.figure()
Tsmooth = ed.to_depth_space(Tdens_i, Pold=trdens["P"], Pnew=None)
transect["T"].plot.contour(colors="r", levels=levels, yincrease=False)
Tsmooth.plot.contour(colors="k", levels=levels, yincrease=False)
plt.title("To depth space using unsmoothed pressure")
plt.ylim([120, 0])
(120, 0)
Groupby on dataframe or xarray consistently#
xarray seems to use a different kind of index with groupby_bins.
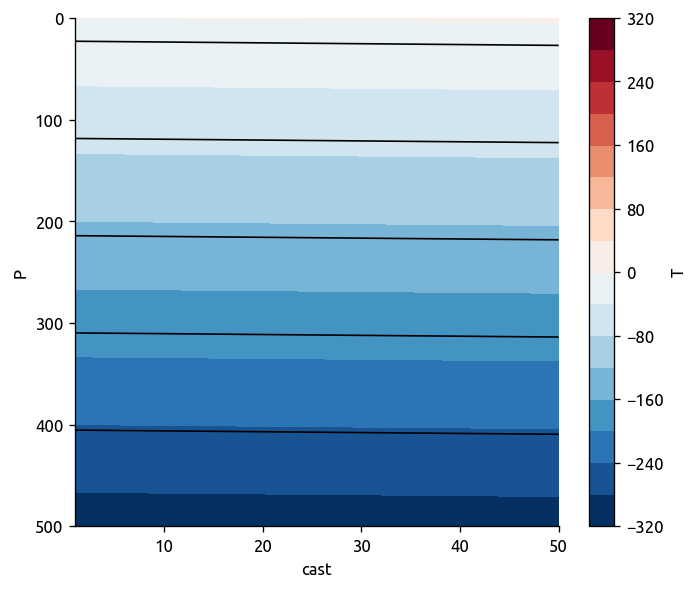
Test gradients in isopycnal planes#
coords = {"cast": np.linspace(1, 50, 50), "P": np.linspace(0, 500, 200)}

T = xr.DataArray(
    np.ones((len(coords["P"]), len(coords["cast"]))) * np.nan,
    dims=["P", "cast"],
    coords=coords,
    name="T",
)

T = -0.6 * T.P + 0.05 * T.cast
T.name = "T"

rho = 1025 * (1 - 1.7e-4 * (T - 15))
rho.name = "$ρ$"

T.plot.contourf(levels=20)
rho.plot.contour(colors="k", yincrease=False)

dT = ed.gradient(T.rename({"P": "z", "cast": "x"}))
dT["dy"] = xr.zeros_like(dT["dx"])
dT.attrs["name"] = "dT"

drho = ed.gradient(rho.rename({"P": "z", "cast": "x"}))
drho["dy"] = xr.zeros_like(drho["dx"])
drho.attrs["name"] = "dρ"

dT
<xarray.Dataset>
Dimensions:  (x: 50, z: 200)
Coordinates:
  * z        (z) float64 0.0 2.513 5.025 7.538 10.05 12.56 15.08 17.59 20.1 ...
  * x        (x) float64 1.0 2.0 3.0 4.0 5.0 6.0 7.0 8.0 9.0 10.0 11.0 12.0 ...
Data variables:
    dz       (z, x) float64 -0.6 -0.6 -0.6 -0.6 -0.6 -0.6 -0.6 -0.6 -0.6 ...
    dx       (z, x) float64 0.05 0.05 0.05 0.05 0.05 0.05 0.05 0.05 0.05 ...
    mag      (z, x) float64 0.6021 0.6021 0.6021 0.6021 0.6021 0.6021 0.6021 ...
    dy       (z, x) float64 0.0 0.0 0.0 0.0 0.0 0.0 0.0 0.0 0.0 0.0 0.0 0.0 ...
Attributes:
    name:     dT
Convert transect .mat to netcdf files#
ed.convert_mat_to_netcdf()
/home/deepak/anaconda3/lib/python3.6/_collections_abc.py:743: FutureWarning: iteration over an xarray.Dataset will change in xarray v0.11 to only include data variables, not coordinates. Iterate over the Dataset.variables property instead to preserve existing behavior in a forwards compatible manner.
  for key in self._mapping:
../eddydiff/eddydiff.py:571: RuntimeWarning: invalid value encountered in less
  mask2d = np.logical_or(transect['T'].values < 1,
../eddydiff/eddydiff.py:572: RuntimeWarning: invalid value encountered in less
  transect['S'].values < 1)