CTD χpod A05 section#
https://cchdo.ucsd.edu/cruise/74EQ20151206
[ ] Plot spiciness to decide how to cut up section into segments
[ ] make sure data is thorpesorted before attempting estimate
[ ] Do finescale \(⟨χ⟩\) with CTD; and Argo finescale \(⟨χ⟩\) for cruise; and compare to CTD-χpod terms?
[ ] Compare \(T_z^m\) for cruise vs climo; should I be using climo values?
[ ] Calculate \(r = (|∇_nT|/T_z^m)^2\) from MIMOC / Argo and plot for cruise line.
[ ] Given \(r\) and \(K_ρ^m\) (Argo/cruise CTD); we know what \(K_e\) or \(χ_e\) must be for it to be dominate vertical stirring by an order of magnitude (assumed). Could compare that to CTD-χpod \(⟨χ⟩\)
[x] Could estimate \(K_T T_z\) for a bigger bin like 10-ish m and then average…
Look more carefully at KtTz~
good results for χ < 1e-6, naive Tz > 2e-4; plus KtTz~ < 1e-5, Tz~ > 3e04
%load_ext watermark
%matplotlib inline
import glob
import os
import cf_xarray as cfxr
import cf_xarray.units
import cmocean as cmo
import datatree
import dcpy
import distributed
import flox
import gsw
import gsw_xarray
import holoviews as hv
import hvplot.xarray
import matplotlib as mpl
import matplotlib.pyplot as plt
import numpy as np
import pandas as pd
import pint_xarray
import scipy as sp
import tqdm
import xfilter
import xgcm
from cf_xarray.units import units
from IPython.display import Image
import eddydiff as ed
import xarray as xr
units.default_format = "~P"
xr.set_options(keep_attrs=True, use_flox=True)
cfxr.set_options(warn_on_missing_variables=False)
plt.rcParams["figure.dpi"] = 140
plt.rcParams["savefig.dpi"] = 200
plt.style.use("ggplot")
profile_hvplot_kwargs = dict(
by="cast",
y="pressure",
ylim=(2000, 0),
logx=True,
muted_alpha=0,
line_width=0.5,
aspect=1 / 2,
frame_width=250,
grid=True,
)
hv.extension("bokeh")
%watermark -iv
xr.DataArray([1.0])
/Users/dcherian/mambaforge/envs/eddydiff/lib/python3.9/site-packages/statsmodels/compat/pandas.py:65: FutureWarning: pandas.Int64Index is deprecated and will be removed from pandas in a future version. Use pandas.Index with the appropriate dtype instead.
from pandas import Int64Index as NumericIndex


matplotlib : 3.5.1
flox : 0.4.2.dev12+gd638cb0.d20220504
gsw : 3.4.0
gsw_xarray : 0.3.0
pint_xarray: 0.2.1
cmocean : 2.0
numpy : 1.22.3
hvplot : 0.7.3
scipy : 1.8.0
xfilter : 0.2.1.dev6+g5fdc006
dcpy : 0.2.1.dev11+gebbbf87.d20220428
cf_xarray : 0.7.1.dev16+g7305fd8
xgcm : 0.6.1
eddydiff : 0.1
distributed: 2022.4.0
pandas : 1.4.2
xarray : 2022.6.0
tqdm : 4.64.0
holoviews : 1.14.8
<xarray.DataArray (dim_0: 1)> array([1.]) Dimensions without coordinates: dim_0
if "client" in locals():
client.cluster.close()
client.close()
client = distributed.Client(
n_workers=6,
threads_per_worker=2,
env={"MKL_NUM_THREADS": 1, "NUMBA_NUM_THREADS": 1, "OMP_NUM_THREADS": 1},
)
client
/Users/dcherian/mambaforge/envs/eddydiff/lib/python3.9/site-packages/distributed/node.py:177: UserWarning: Port 8787 is already in use.
Perhaps you already have a cluster running?
Hosting the HTTP server on port 54496 instead
warnings.warn(
Client
Client-f3cdd81c-e1ec-11ec-8fc9-3af9d394f1c6
| Connection method: Cluster object | Cluster type: distributed.LocalCluster |
| Dashboard: http://127.0.0.1:54496/status |
Cluster Info
LocalCluster
9485a4f1
| Dashboard: http://127.0.0.1:54496/status | Workers: 6 |
| Total threads: 12 | Total memory: 16.00 GiB |
| Status: running | Using processes: True |
Scheduler Info
Scheduler
Scheduler-76478744-c944-451b-8740-ba8bb861c064
| Comm: tcp://127.0.0.1:54498 | Workers: 6 |
| Dashboard: http://127.0.0.1:54496/status | Total threads: 12 |
| Started: Just now | Total memory: 16.00 GiB |
Workers
Worker: 0
| Comm: tcp://127.0.0.1:54533 | Total threads: 2 |
| Dashboard: http://127.0.0.1:54534/status | Memory: 2.67 GiB |
| Nanny: tcp://127.0.0.1:54502 | |
| Local directory: /Users/dcherian/work/eddydiff/notebooks/dask-worker-space/worker-mqxk3tva | |
Worker: 1
| Comm: tcp://127.0.0.1:54532 | Total threads: 2 |
| Dashboard: http://127.0.0.1:54535/status | Memory: 2.67 GiB |
| Nanny: tcp://127.0.0.1:54503 | |
| Local directory: /Users/dcherian/work/eddydiff/notebooks/dask-worker-space/worker-mgnljrfg | |
Worker: 2
| Comm: tcp://127.0.0.1:54545 | Total threads: 2 |
| Dashboard: http://127.0.0.1:54546/status | Memory: 2.67 GiB |
| Nanny: tcp://127.0.0.1:54506 | |
| Local directory: /Users/dcherian/work/eddydiff/notebooks/dask-worker-space/worker-n5cghbro | |
Worker: 3
| Comm: tcp://127.0.0.1:54539 | Total threads: 2 |
| Dashboard: http://127.0.0.1:54542/status | Memory: 2.67 GiB |
| Nanny: tcp://127.0.0.1:54501 | |
| Local directory: /Users/dcherian/work/eddydiff/notebooks/dask-worker-space/worker-vtawtlos | |
Worker: 4
| Comm: tcp://127.0.0.1:54548 | Total threads: 2 |
| Dashboard: http://127.0.0.1:54549/status | Memory: 2.67 GiB |
| Nanny: tcp://127.0.0.1:54505 | |
| Local directory: /Users/dcherian/work/eddydiff/notebooks/dask-worker-space/worker-u2xaoxnj | |
Worker: 5
| Comm: tcp://127.0.0.1:54538 | Total threads: 2 |
| Dashboard: http://127.0.0.1:54540/status | Memory: 2.67 GiB |
| Nanny: tcp://127.0.0.1:54504 | |
| Local directory: /Users/dcherian/work/eddydiff/notebooks/dask-worker-space/worker-gb0j9x0f | |
section_id = "A05_2015"
files = ed.sections.get_filenames(section_id)
a05 = datatree.open_datatree(files["merged"])
a05
<xarray.Dataset>
Dimensions: ()
Data variables:
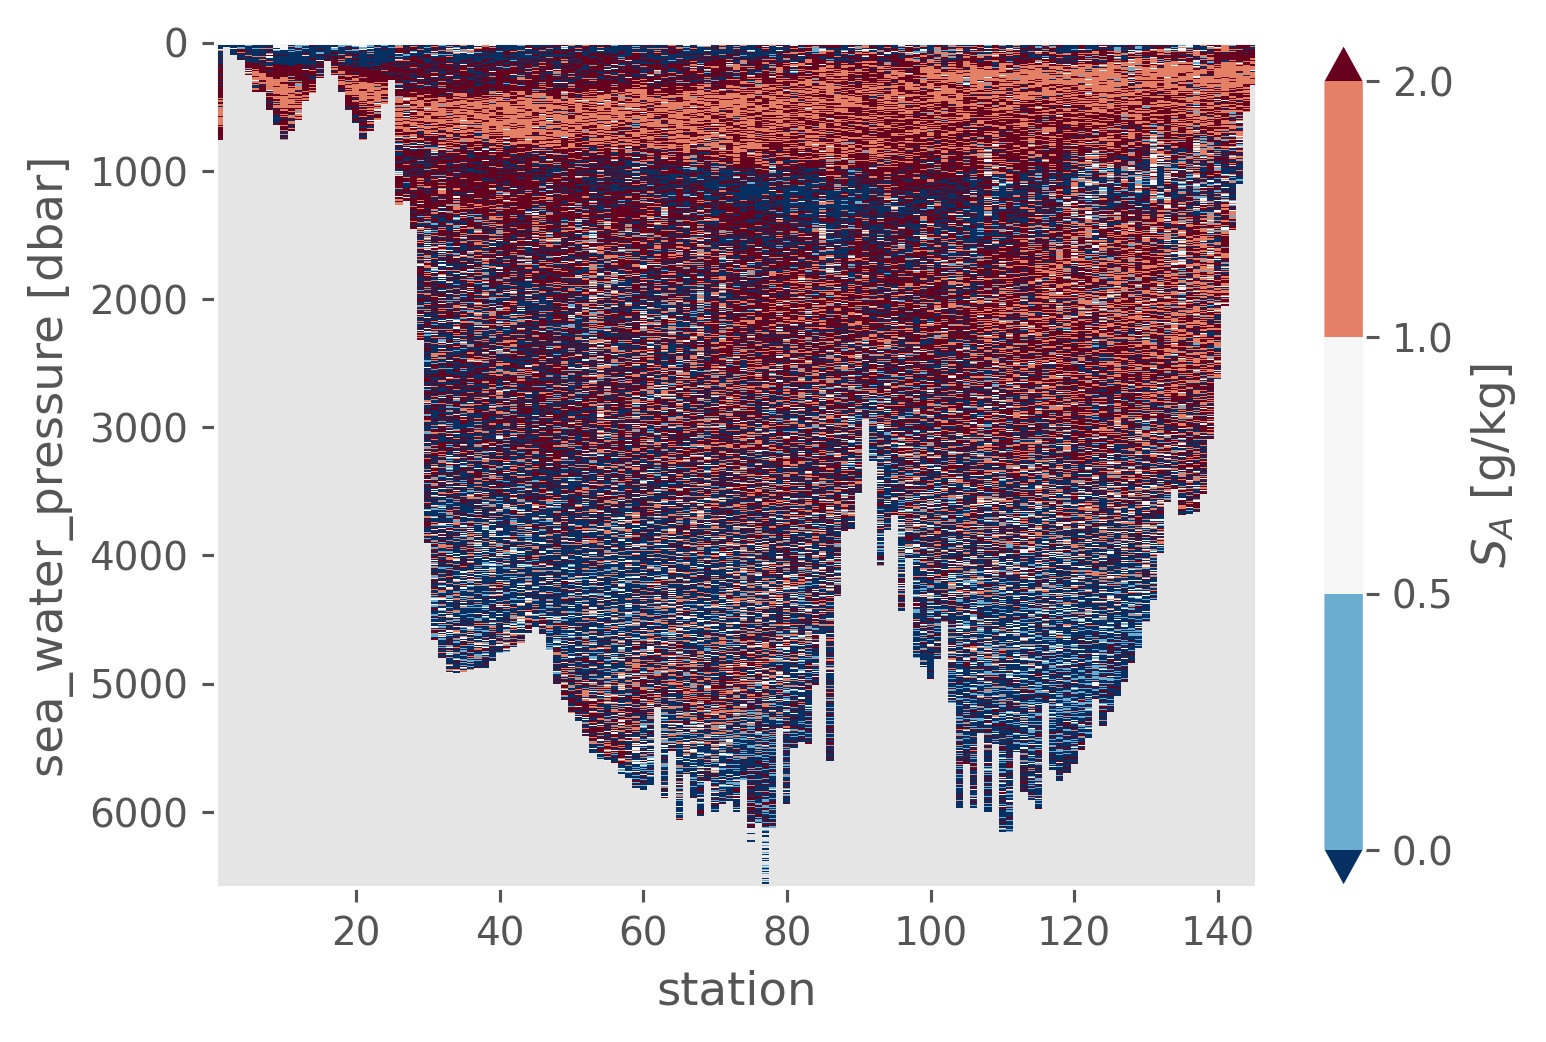
*empty*Density ratio \(R_ρ\)#
ctd = a05["ctd"].ds.load()
slopes = (
ctd[["CT", "SA"]]
.rolling(pressure=10, center=True)
.construct("window")
.polyfit("window", deg=1)
.sel(degree=1, drop=True)
.rename({"CT_polyfit_coefficients": "CT", "SA_polyfit_coefficients": "SA"})
.rolling(pressure=10, center=True)
.mean()
)
/Users/dcherian/work/python/xarray/xarray/core/nputils.py:169: RankWarning: Polyfit may be poorly conditioned
warn_on_deficient_rank(rank, x.shape[1])
/Users/dcherian/work/python/xarray/xarray/core/nputils.py:169: RankWarning: Polyfit may be poorly conditioned
warn_on_deficient_rank(rank, x.shape[1])
_, Rρ_gsw, _ = gsw_xarray.Turner_Rsubrho(
ctd.SA, ctd.CT, ctd.cf["sea_water_pressure"], axis=-1
)
Rρ_gsw = ctd.SA.isel(pressure=slice(-1)).copy(data=Rρ_gsw).reset_coords(drop=True)
Rρ_gsw.cf.plot(levels=[0, 0.5, 1, 2], robust=True)
<matplotlib.collections.QuadMesh at 0x17375faf0>
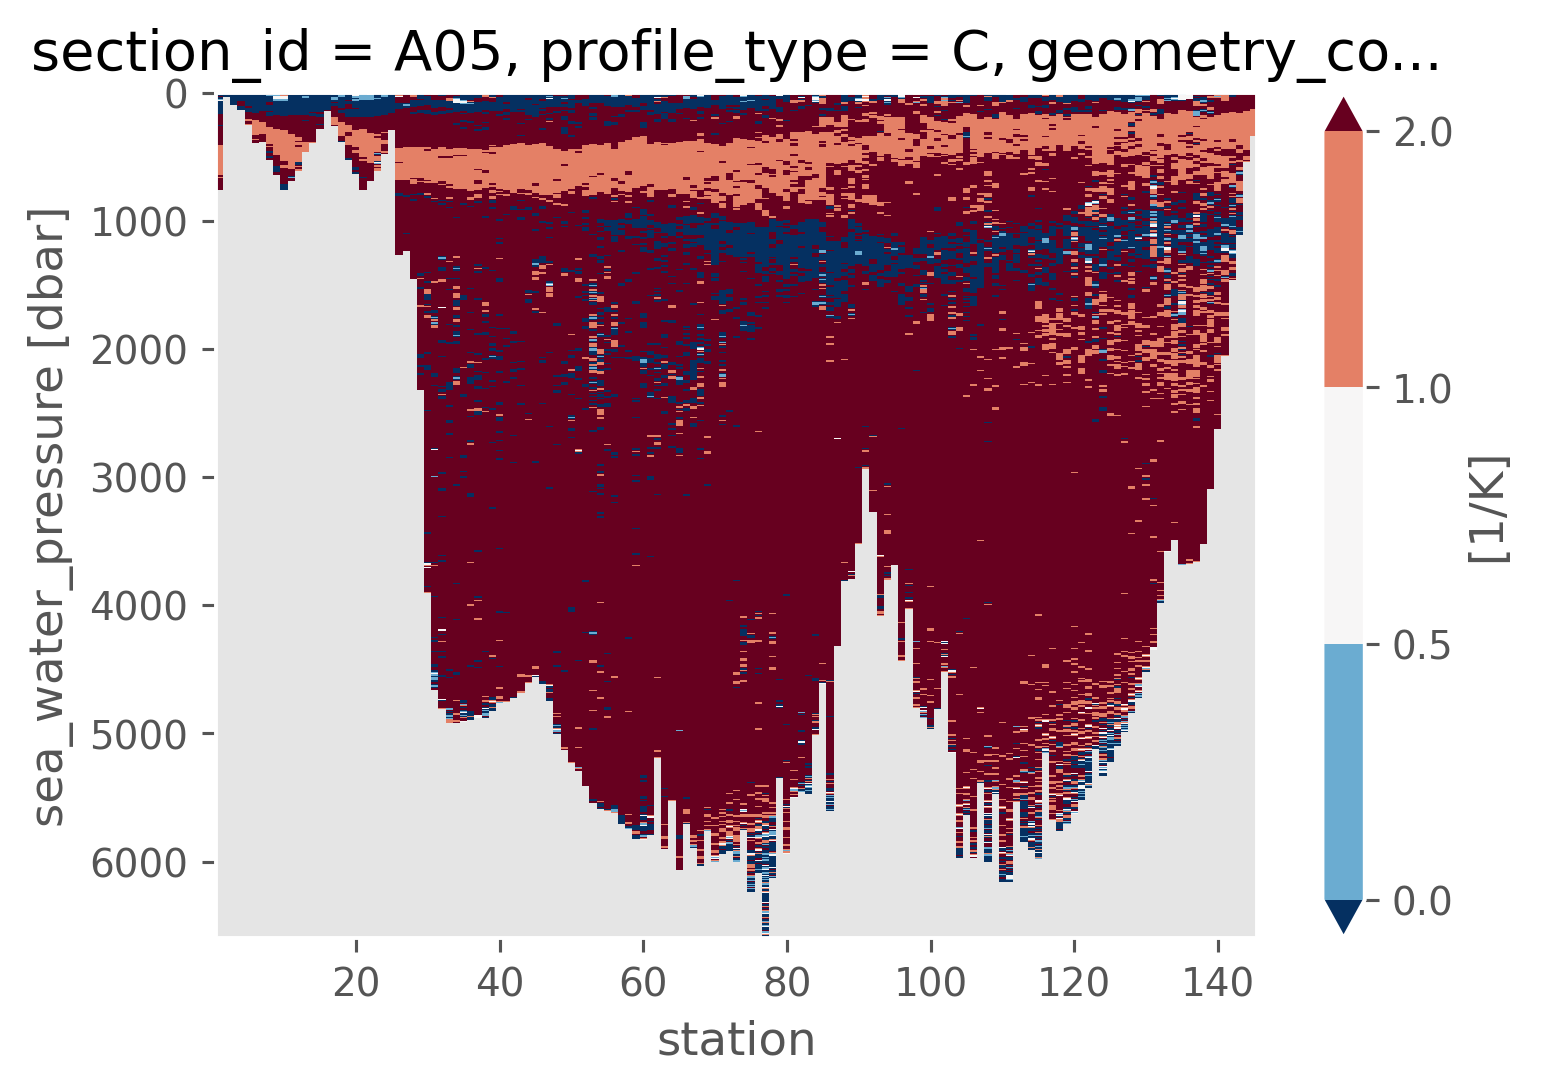
α = gsw_xarray.alpha(ctd.SA, ctd.CT, ctd.cf["sea_water_pressure"])
β = gsw_xarray.beta(ctd.SA, ctd.CT, ctd.cf["sea_water_pressure"])
Rρ = (α * slopes.CT) / (β * slopes.SA)
Rρ.cf.plot(x="profile_id", y="pressure", levels=[0, 0.5, 1, 2], robust=True)
<matplotlib.collections.QuadMesh at 0x168b48910>
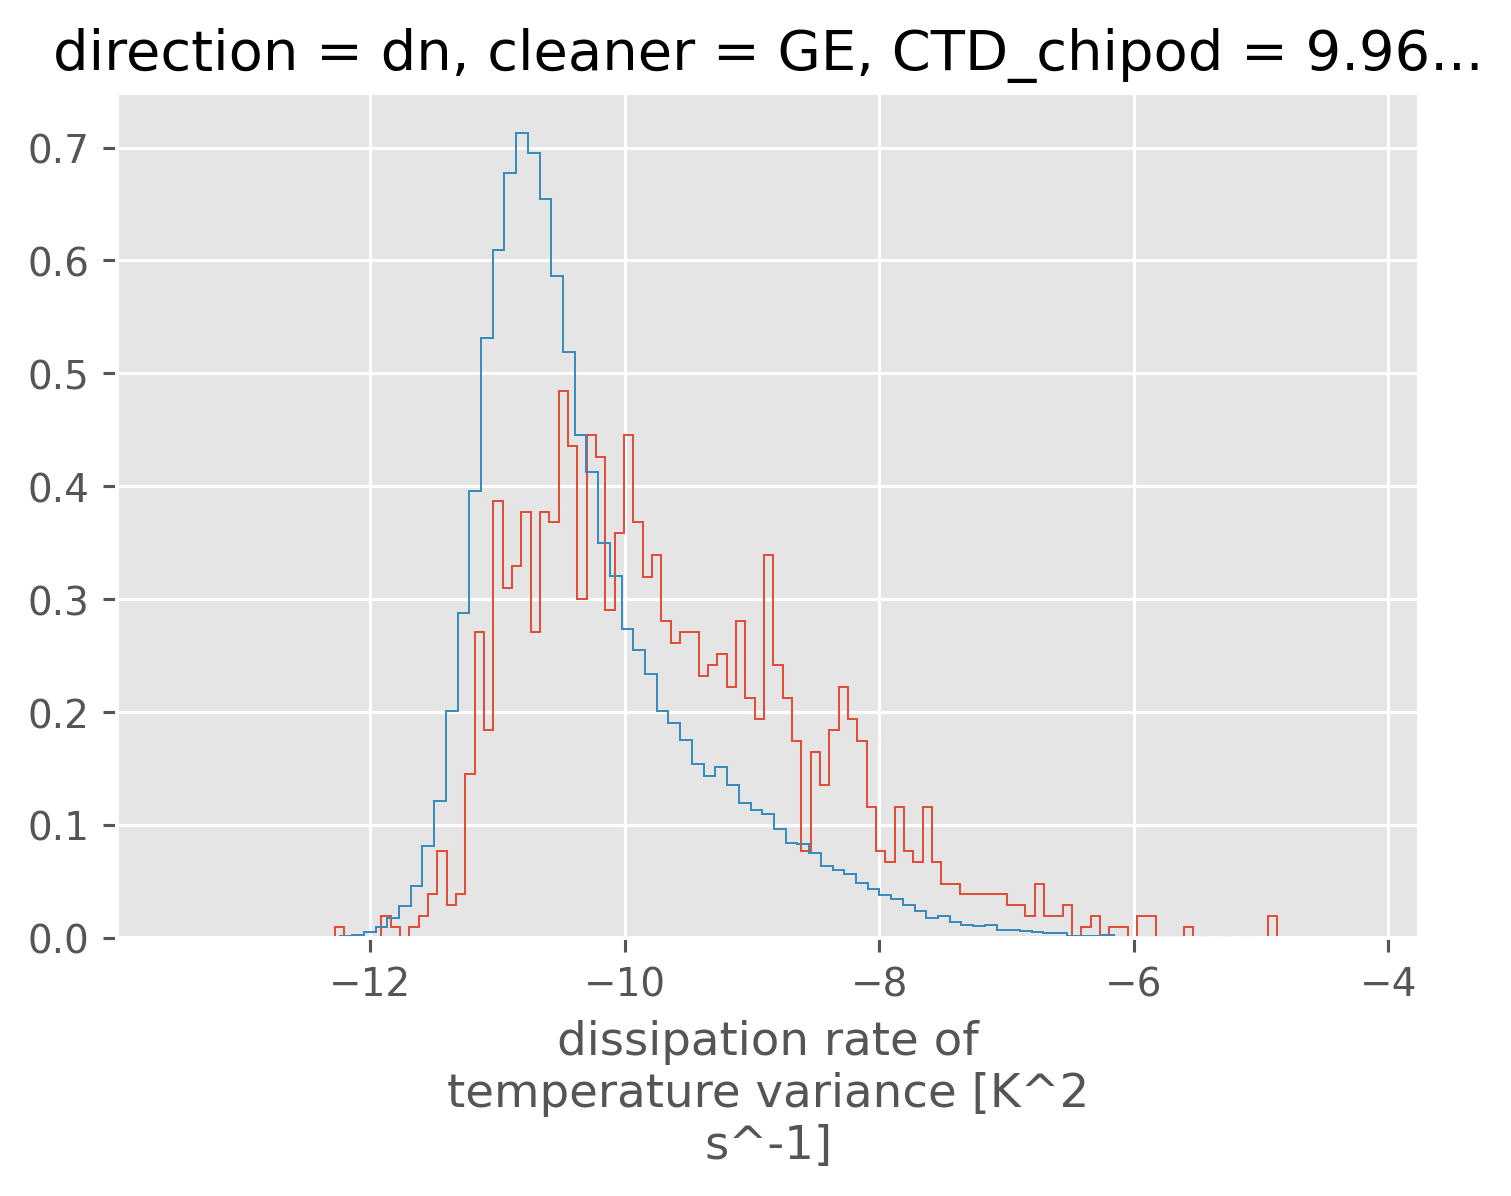
chi = subset["chipod"].ds.chi.sel(direction="dn")
kwargs = dict(bins=101, density=True, histtype="step")
np.log10(chi.where((Rρ > 0) & (Rρ < 2))).plot.hist(**kwargs)
np.log10(chi.where(Rρ < 0)).plot.hist(**kwargs);
chi_all = (
chi.reset_coords(drop=True)
.coarsen({"station": 31, "pressure": 50}, boundary="trim")
.mean()
)
N_all = (
chi.reset_coords(drop=True)
.coarsen({"station": 31, "pressure": 50}, boundary="trim")
.count()
)
N_t = (
chi.where(Rρ < 0)
.reset_coords(drop=True)
.coarsen({"station": 31, "pressure": 50}, boundary="trim")
.count()
)
N_dd = (
chi.where((Rρ > 0.5) & (Rρ < 2))
.reset_coords(drop=True)
.coarsen({"station": 31, "pressure": 50}, boundary="trim")
.count()
)
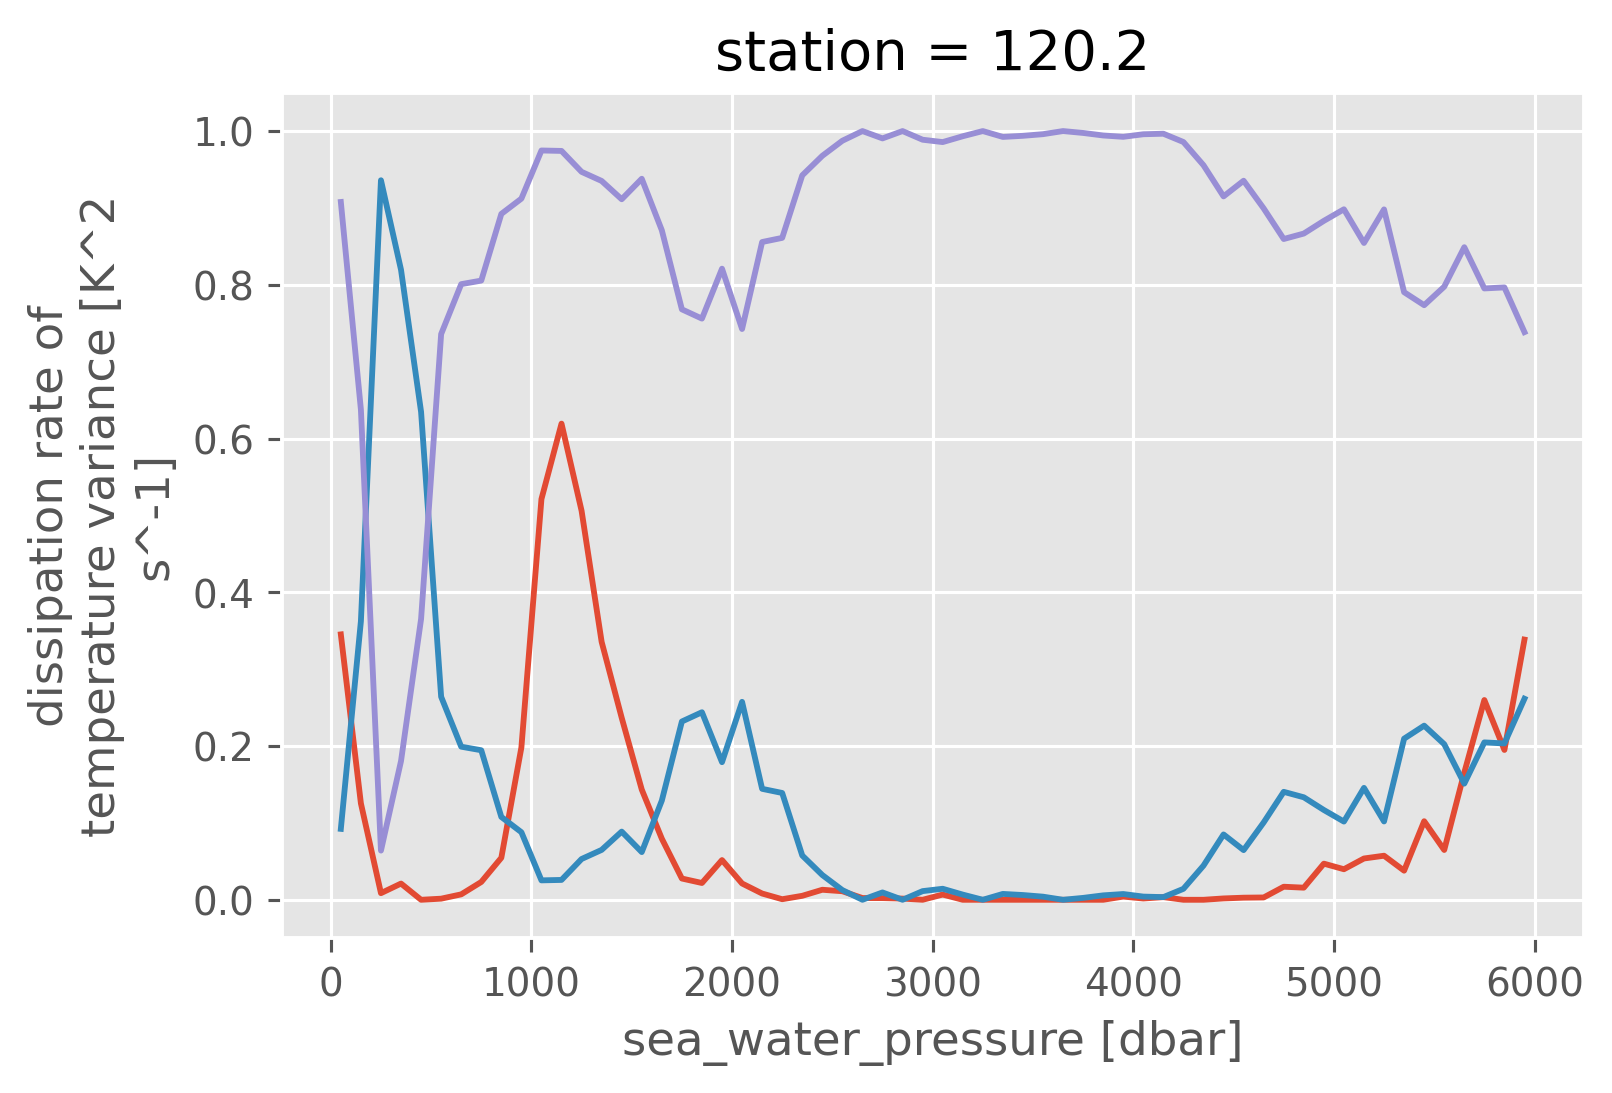
(N_t / N_all).plot()
(N_dd / N_all).plot()
(1 - N_dd / N_all).plot()
[<matplotlib.lines.Line2D at 0x253461880>]
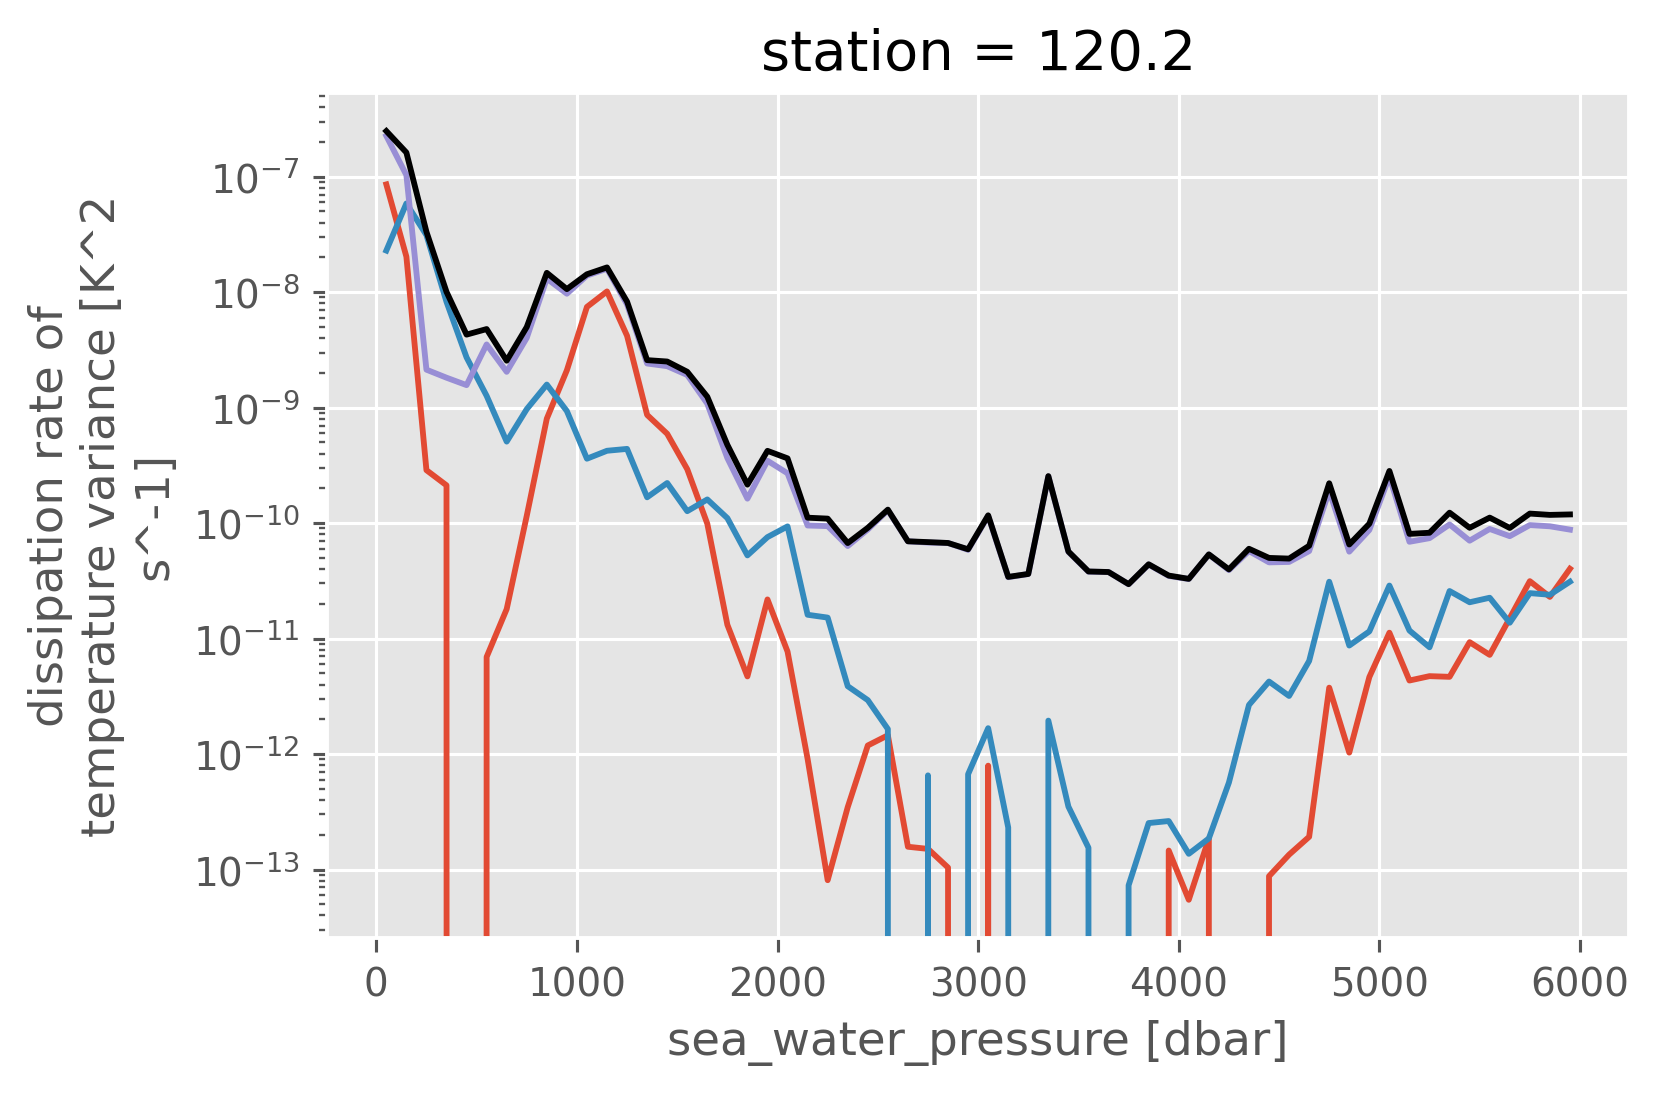
(N_t / N_all * chi_all).plot()
(N_dd / N_all * chi_all).plot()
((1 - N_dd / N_all) * chi_all).plot(yscale="log")
(chi_all).plot(yscale="log", color="k")
[<matplotlib.lines.Line2D at 0x253cf5970>]
Density bin: larger region#
[x] Am I sorting properly
[x] Reduce error in \(h_m\); use CTD \(γ_n\)
fixed by not masking pres by chi
Needs BOTH upcast and downcast to get small error in χ. WHAT
Can’t blindly use a dTdz threshold…, this will throw out a lot of points as we get deeper
Looking at profiles, 108 seems like a good place to start
I’m interpolating T because there are gaps from masking.
subset = a05.sel(station=slice(108, 130)) # .drop_sel(station=131)
copy_over = {
"T": "ctd_temperature",
"CT": "CT",
"SA": "SA",
"S": "ctd_salinity",
"gamma_n": "gamma_n",
}
# for left, right in copy_over.items():
# subset["chipod"].ds[left] = subset["ctd"].ds[right].reset_coords(drop=True)
subset["chipod"] = datatree.DataTree(
dcpy.oceans.thorpesort(
subset["chipod"].ds.sel(cleaner="GE"),
by="gamma_n",
core_dim="pressure",
)
)
bins = ed.sections.choose_bins(
subset["ctd"].ds.cf["neutral_density"],
depth_range=np.arange(150, 2150, 150),
decimals=3,
)
chi = subset["chipod"].ds
chi = chi.where(
(chi.direction == "dn") | ((chi.direction == "up") & (chi.station <= 130))
)
mask = (chi.chi < 1e-6) & (chi.eps < 1e-5) # (np.abs(chi.Tz) > 2e-4) &
vars_to_mask = ["chi", "eps", "KtTz"]
for var in vars_to_mask:
chi[var] = chi[var].where(mask)
assert not (chi.gamma_n.diff("pressure") < 0).any().data
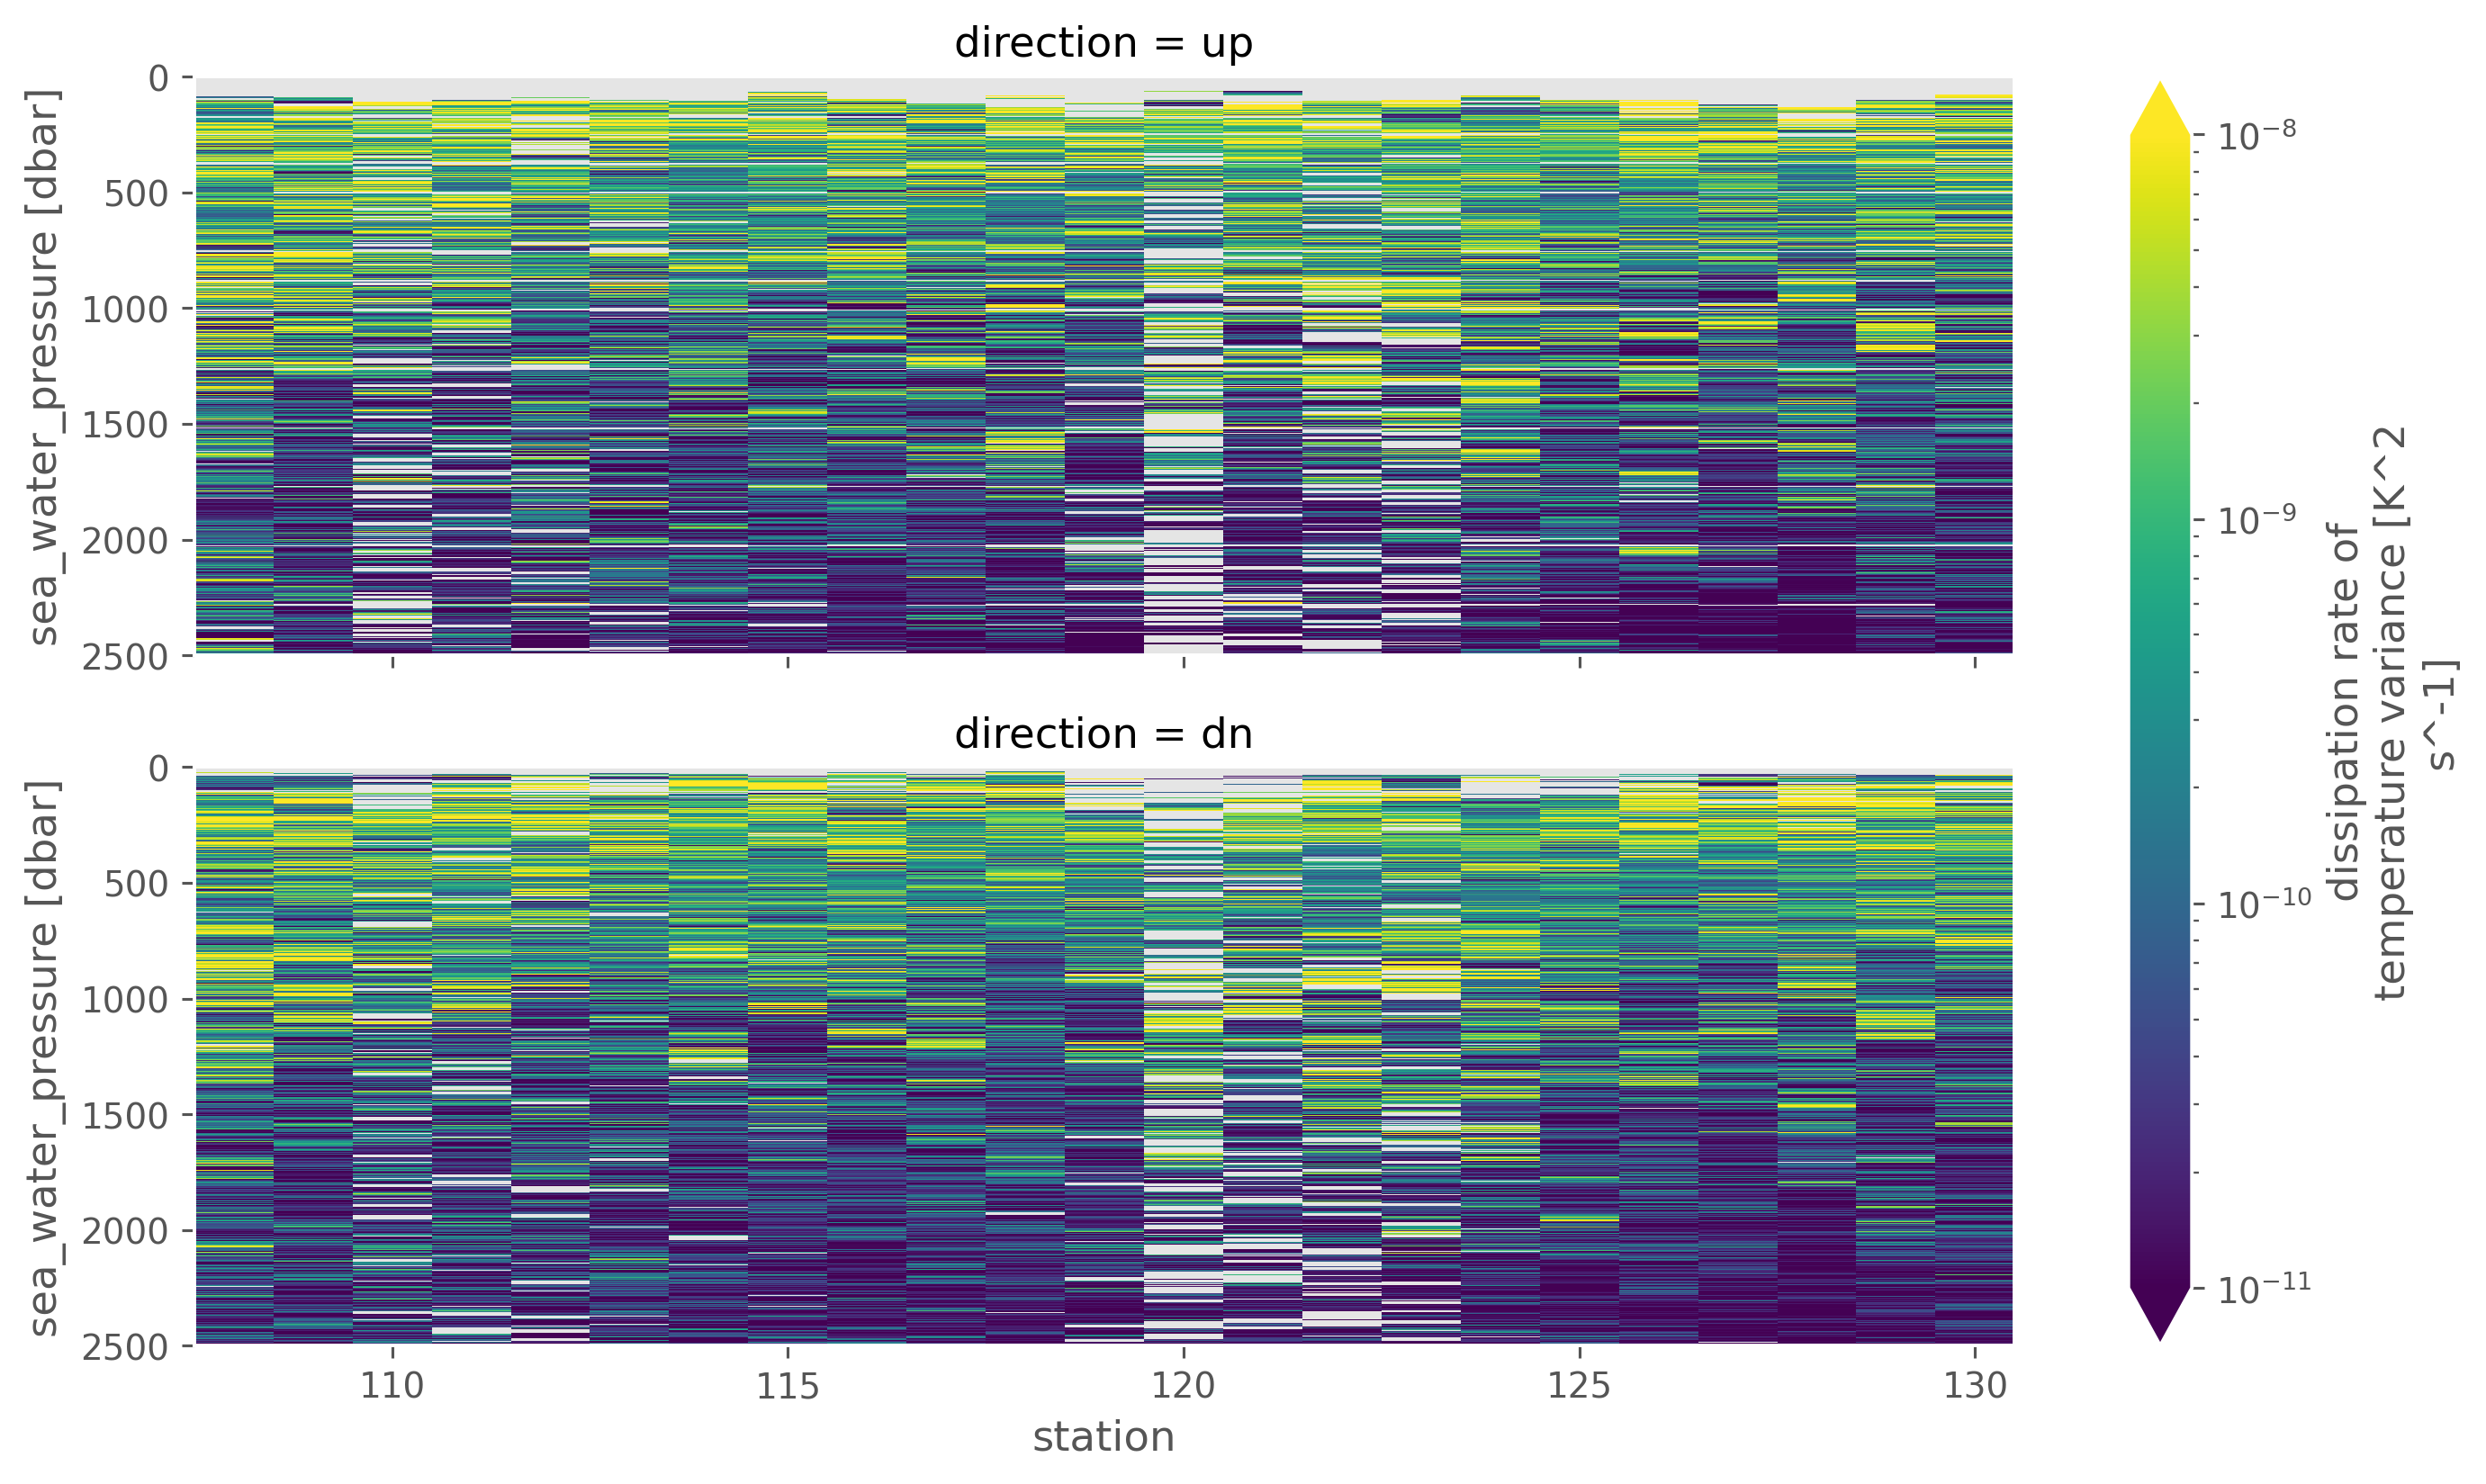
chi.chi.sel(pressure=slice(2500)).cf.plot(
x="profile_id",
row="direction",
norm=mpl.colors.LogNorm(1e-11, 1e-8),
robust=True,
aspect=3,
)
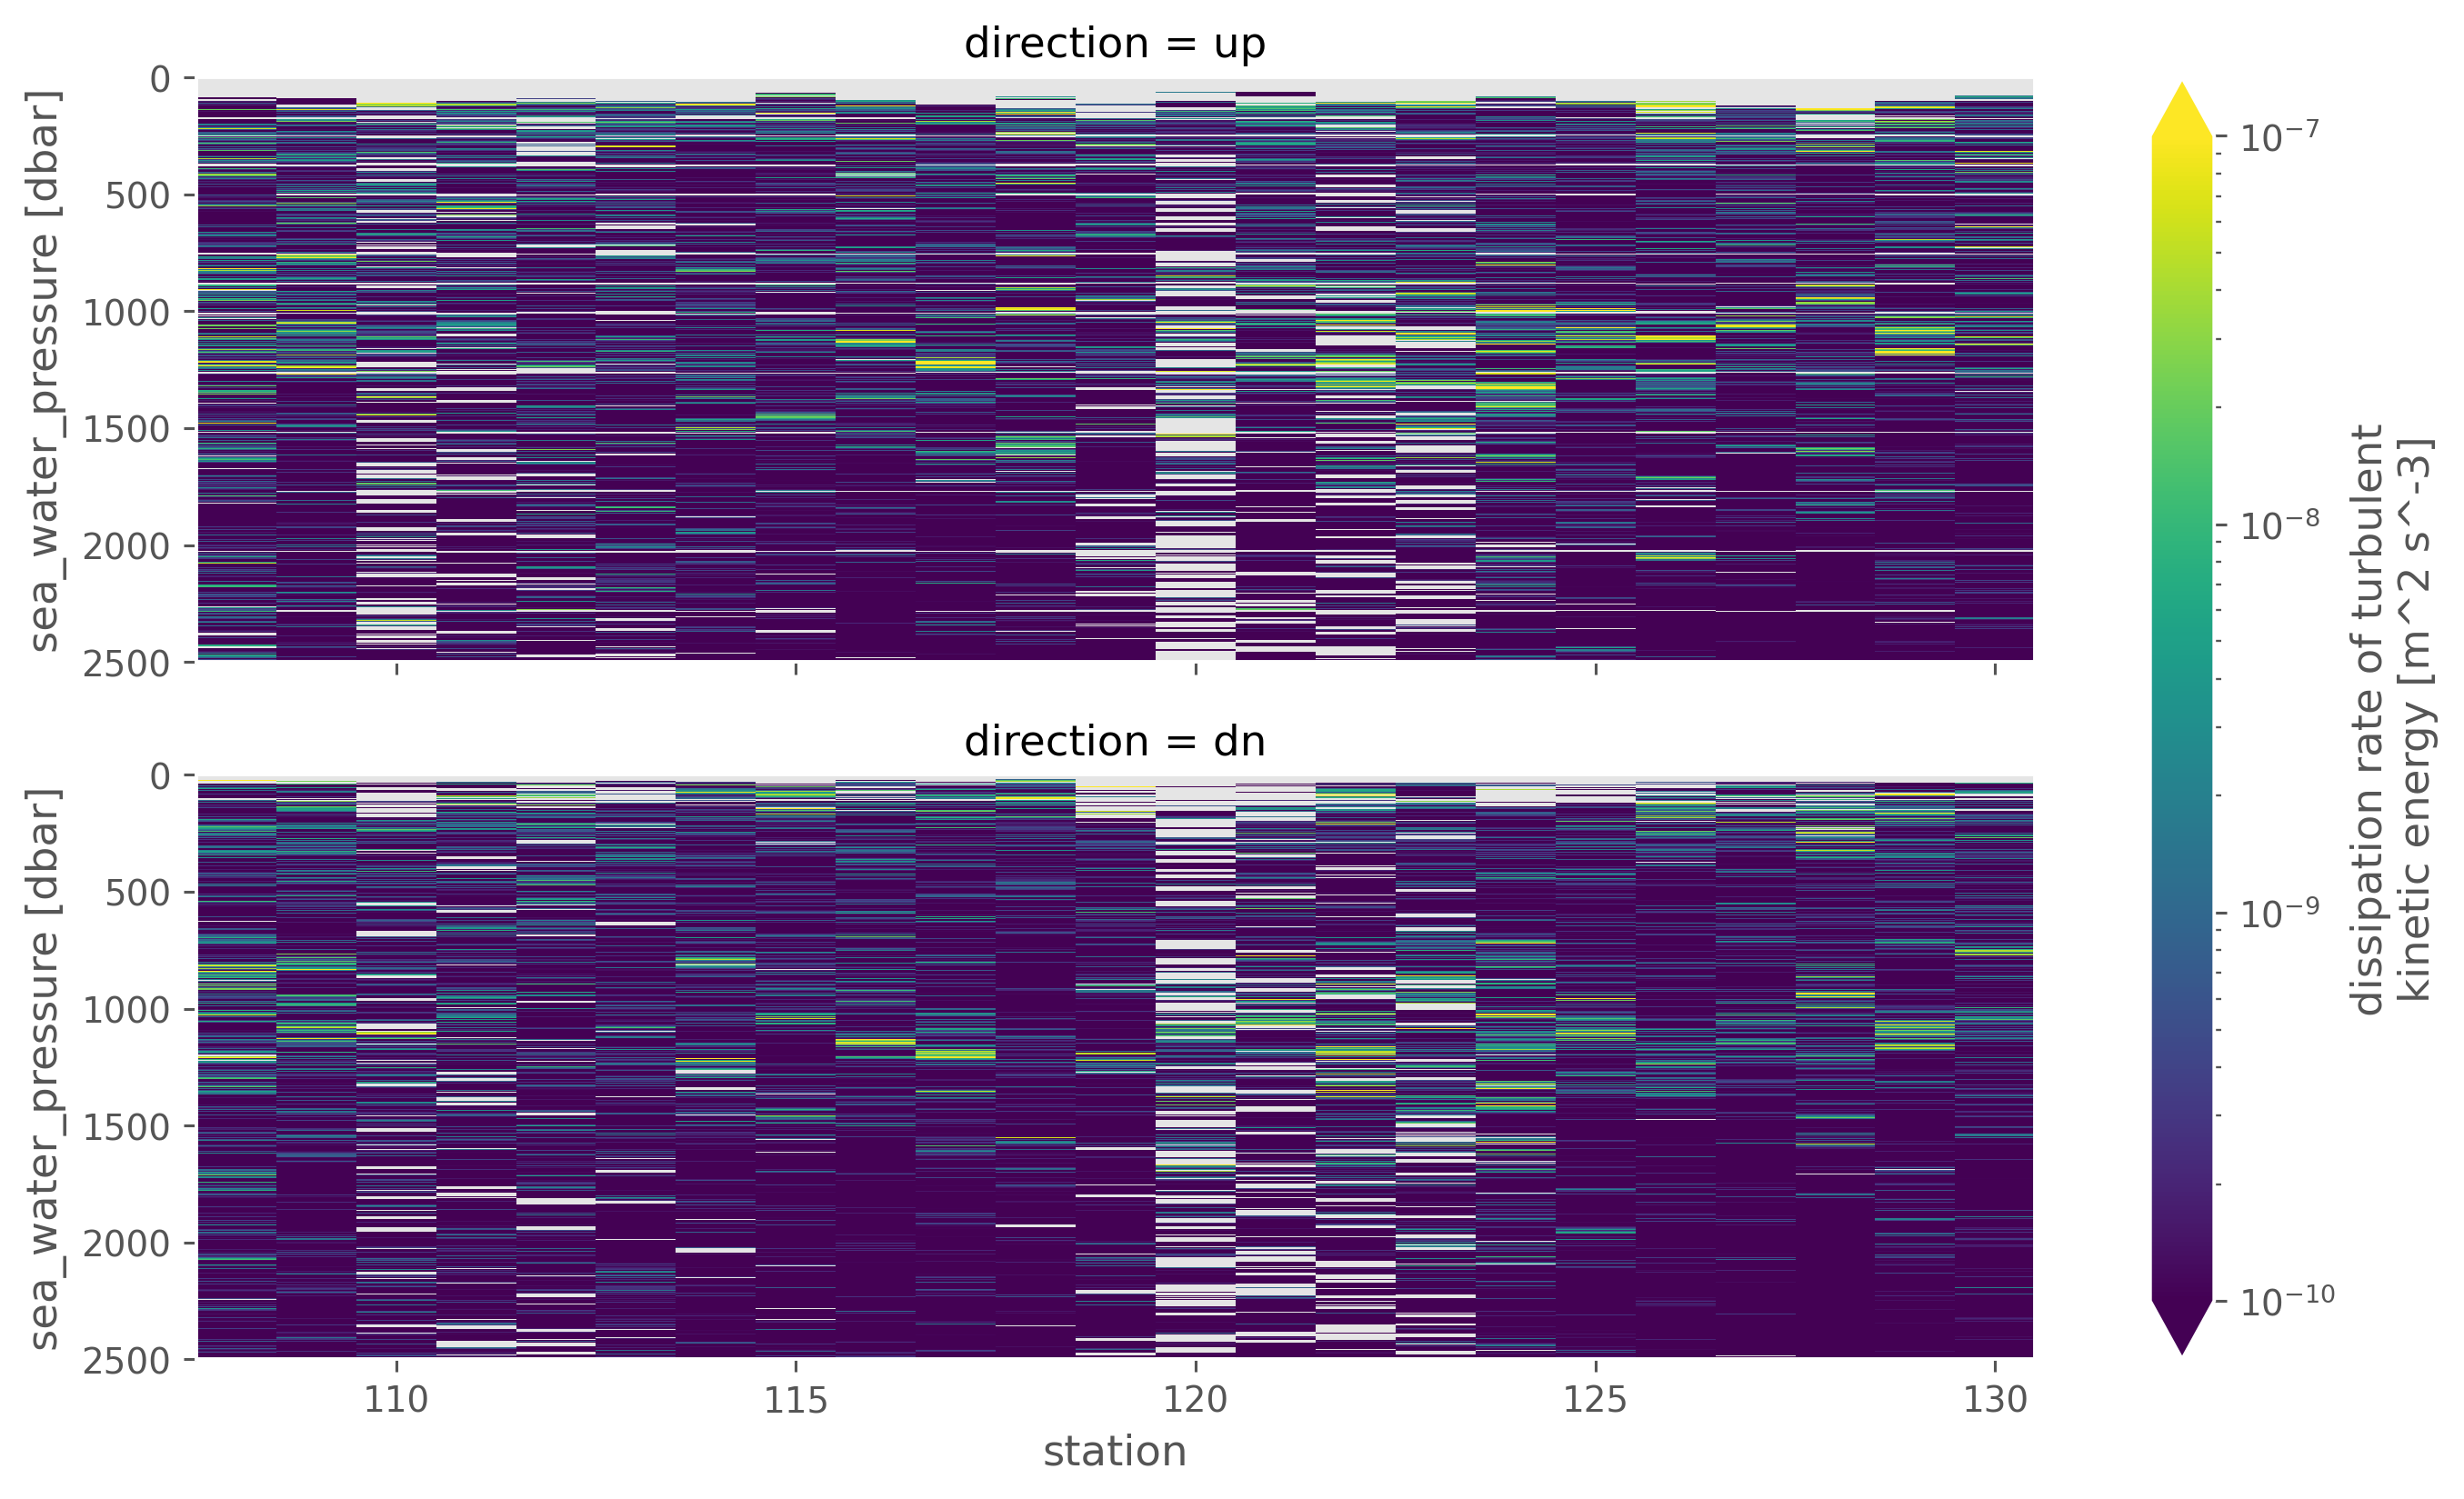
chi.eps.sel(pressure=slice(2500)).cf.plot(
x="profile_id",
row="direction",
norm=mpl.colors.LogNorm(1e-10, 1e-7),
robust=True,
aspect=3,
)
<xarray.plot.facetgrid.FacetGrid at 0x17ab00040>
(chi.chi > 1e-8).sel(pressure=slice(2000)).sum("pressure").plot(hue="direction")
[<matplotlib.lines.Line2D at 0x16d522610>,
<matplotlib.lines.Line2D at 0x16d822400>]
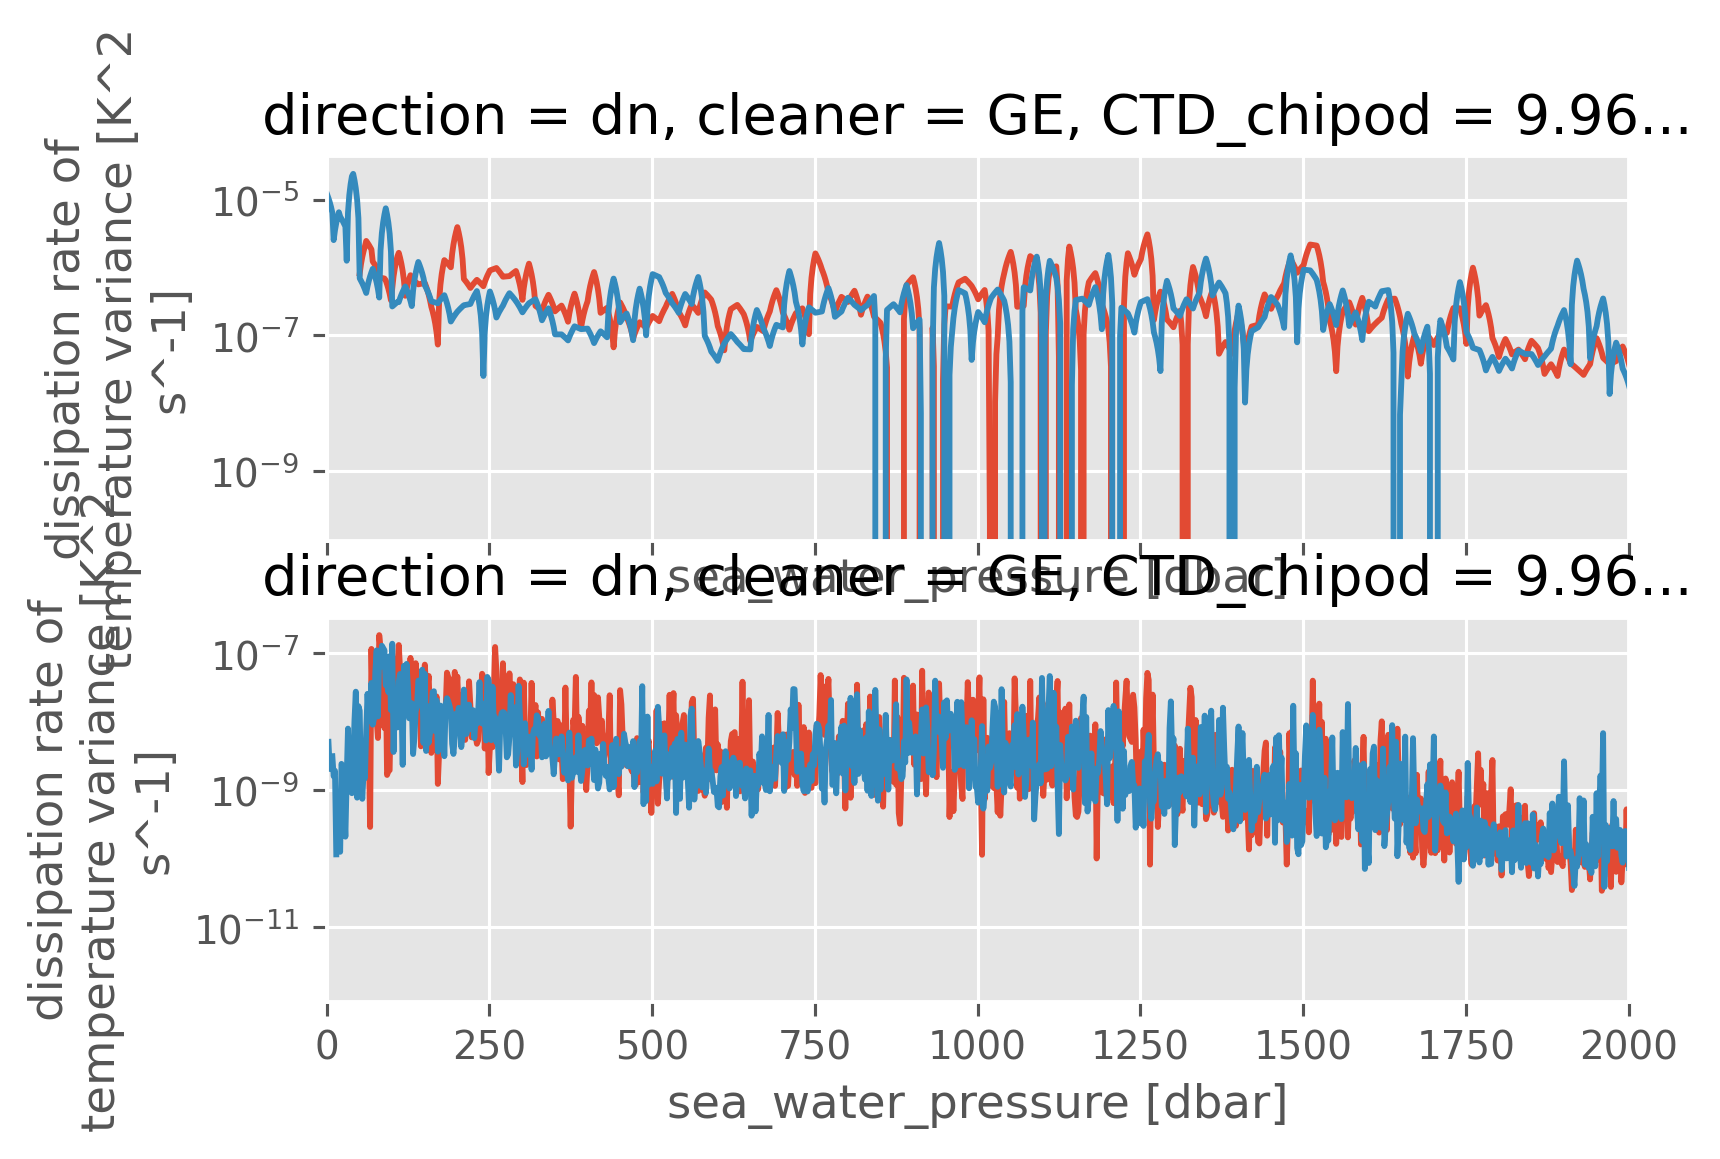
Estimate heat fluxes#
clean = ed.sections.estimate_microscale_stirring_depth_space(
chi.cf.sel(Z=slice(2500)), filter_len=20, segment_len=8, debug=True
)
chi = chi.update(clean)
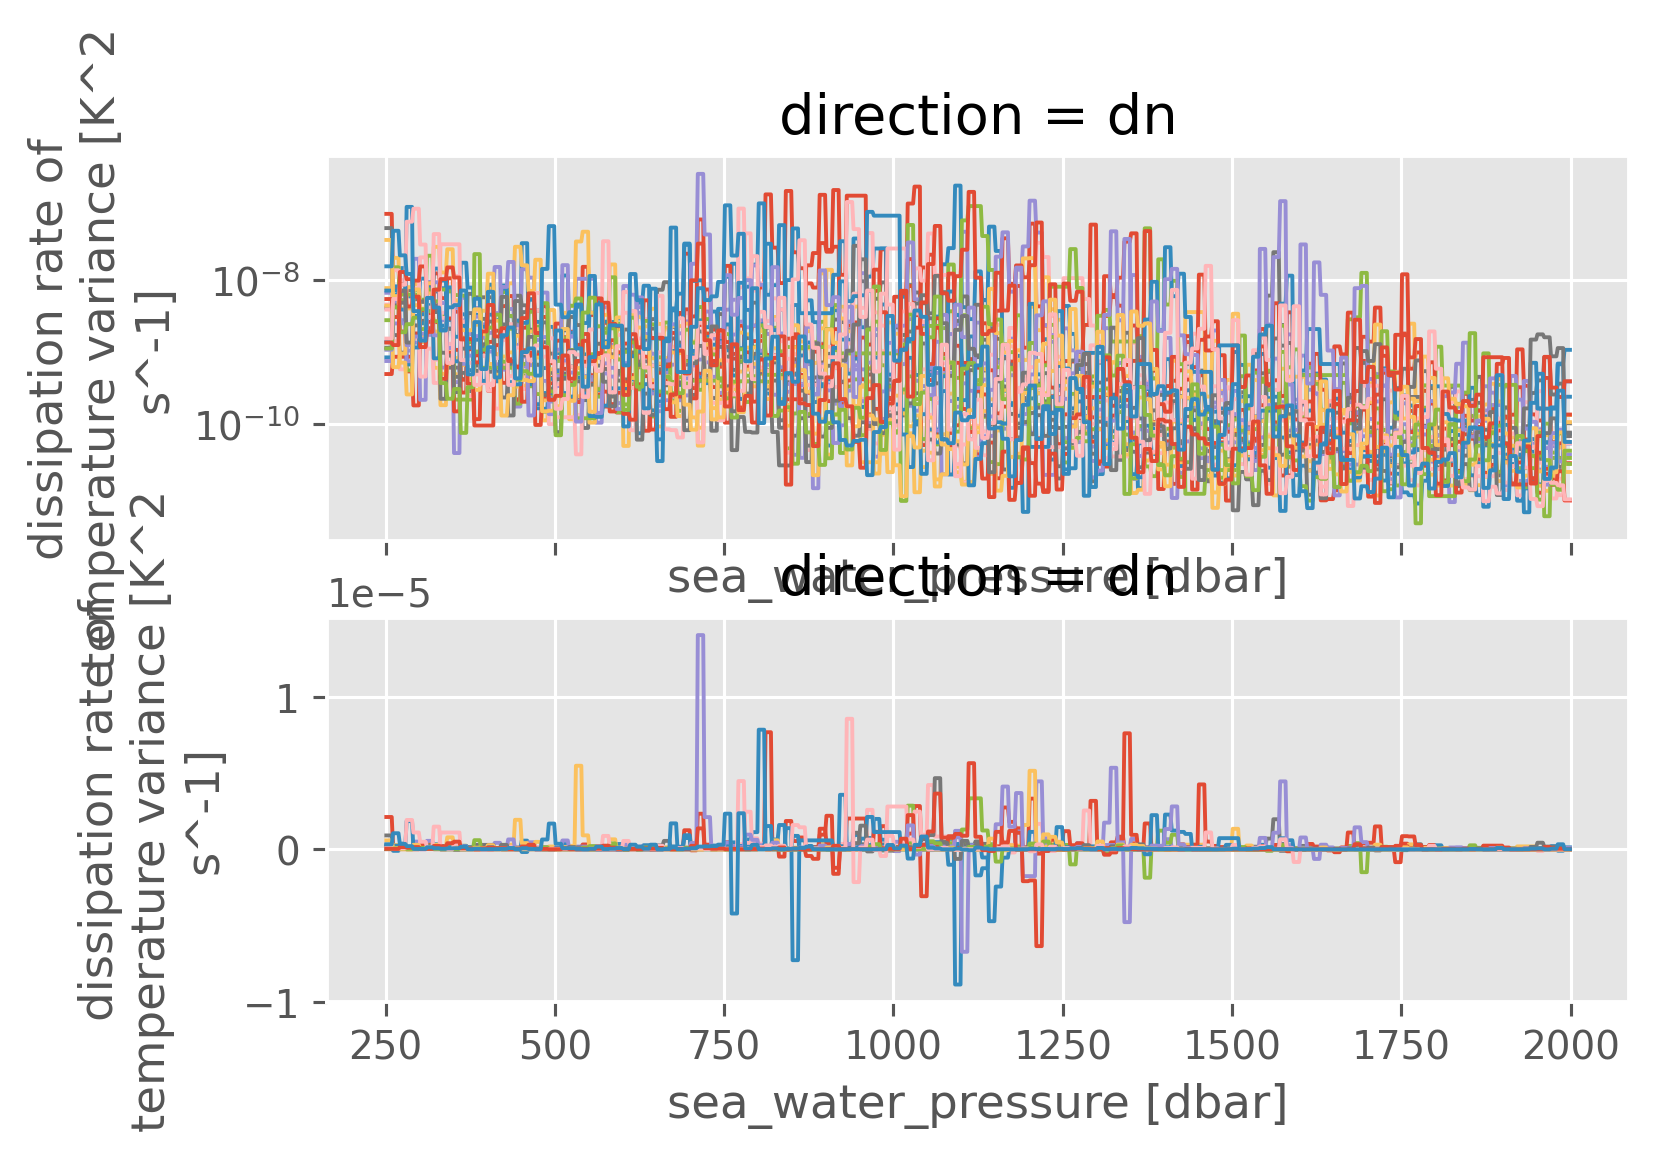
kwargs = dict(hue="station", lw=1, add_legend=False)
f, ax = plt.subplots(2, 1, sharex=True)
clean["chi~"].sel(pressure=slice(250, 2000)).sel(direction="dn").ffill("pressure").plot(
ax=ax[0], yscale="log", **kwargs
)
clean["KtTz~"].sel(pressure=slice(250, 2000)).sel(direction="dn").ffill(
"pressure"
).plot(**kwargs);
5 10
0 values == 0
11220
/Users/dcherian/mambaforge/envs/eddydiff/lib/python3.9/site-packages/numba/np/ufunc/gufunc.py:151: RuntimeWarning: invalid value encountered in get_gradient_sign
return self.ufunc(*args, **kwargs)
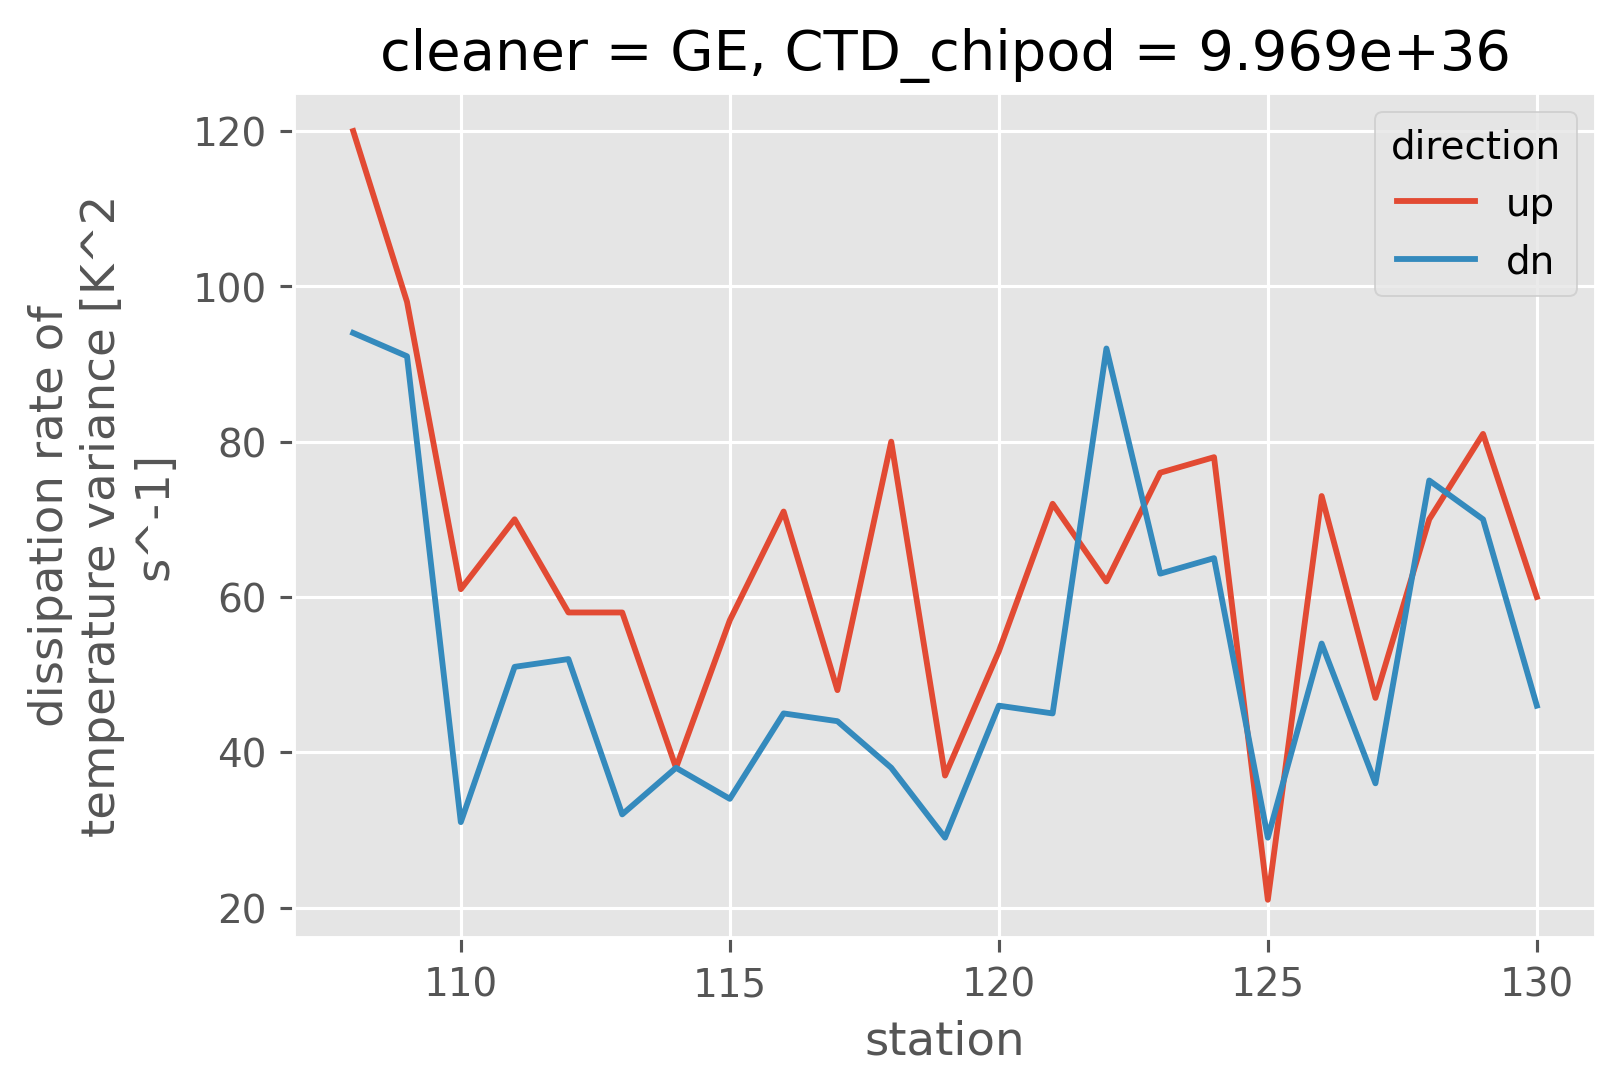
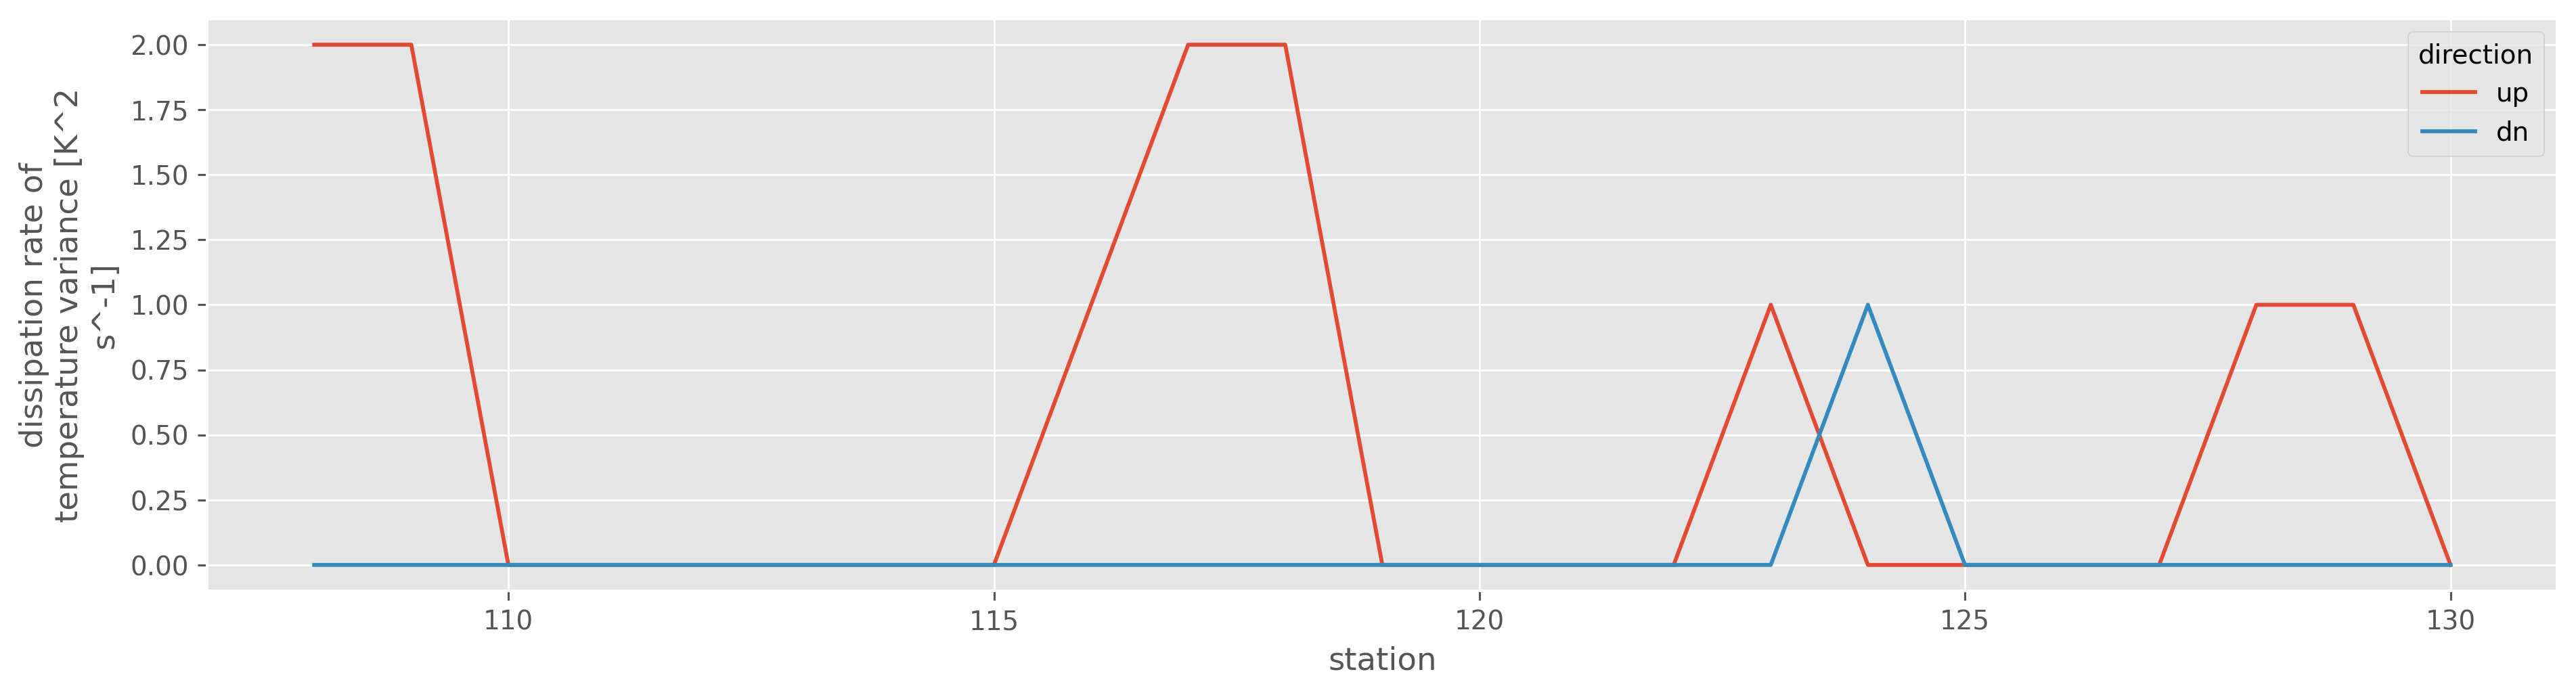
Looking at “large” heat fluxes#
(np.abs(clean["KtTz~"]) > 1e-5).cf.sel(Z=slice(500, 2000)).cf.sum("Z").plot(
hue="direction", aspect=4, size=4
)
# (np.abs(clean["Tz~"]) < 1e-3).cf.sel(Z=slice(500, 2000)).cf.sum("Z").plot(marker='.', hue="direction", aspect=4, size=4)
[<matplotlib.lines.Line2D at 0x17a3e0b20>,
<matplotlib.lines.Line2D at 0x17a3e0490>]
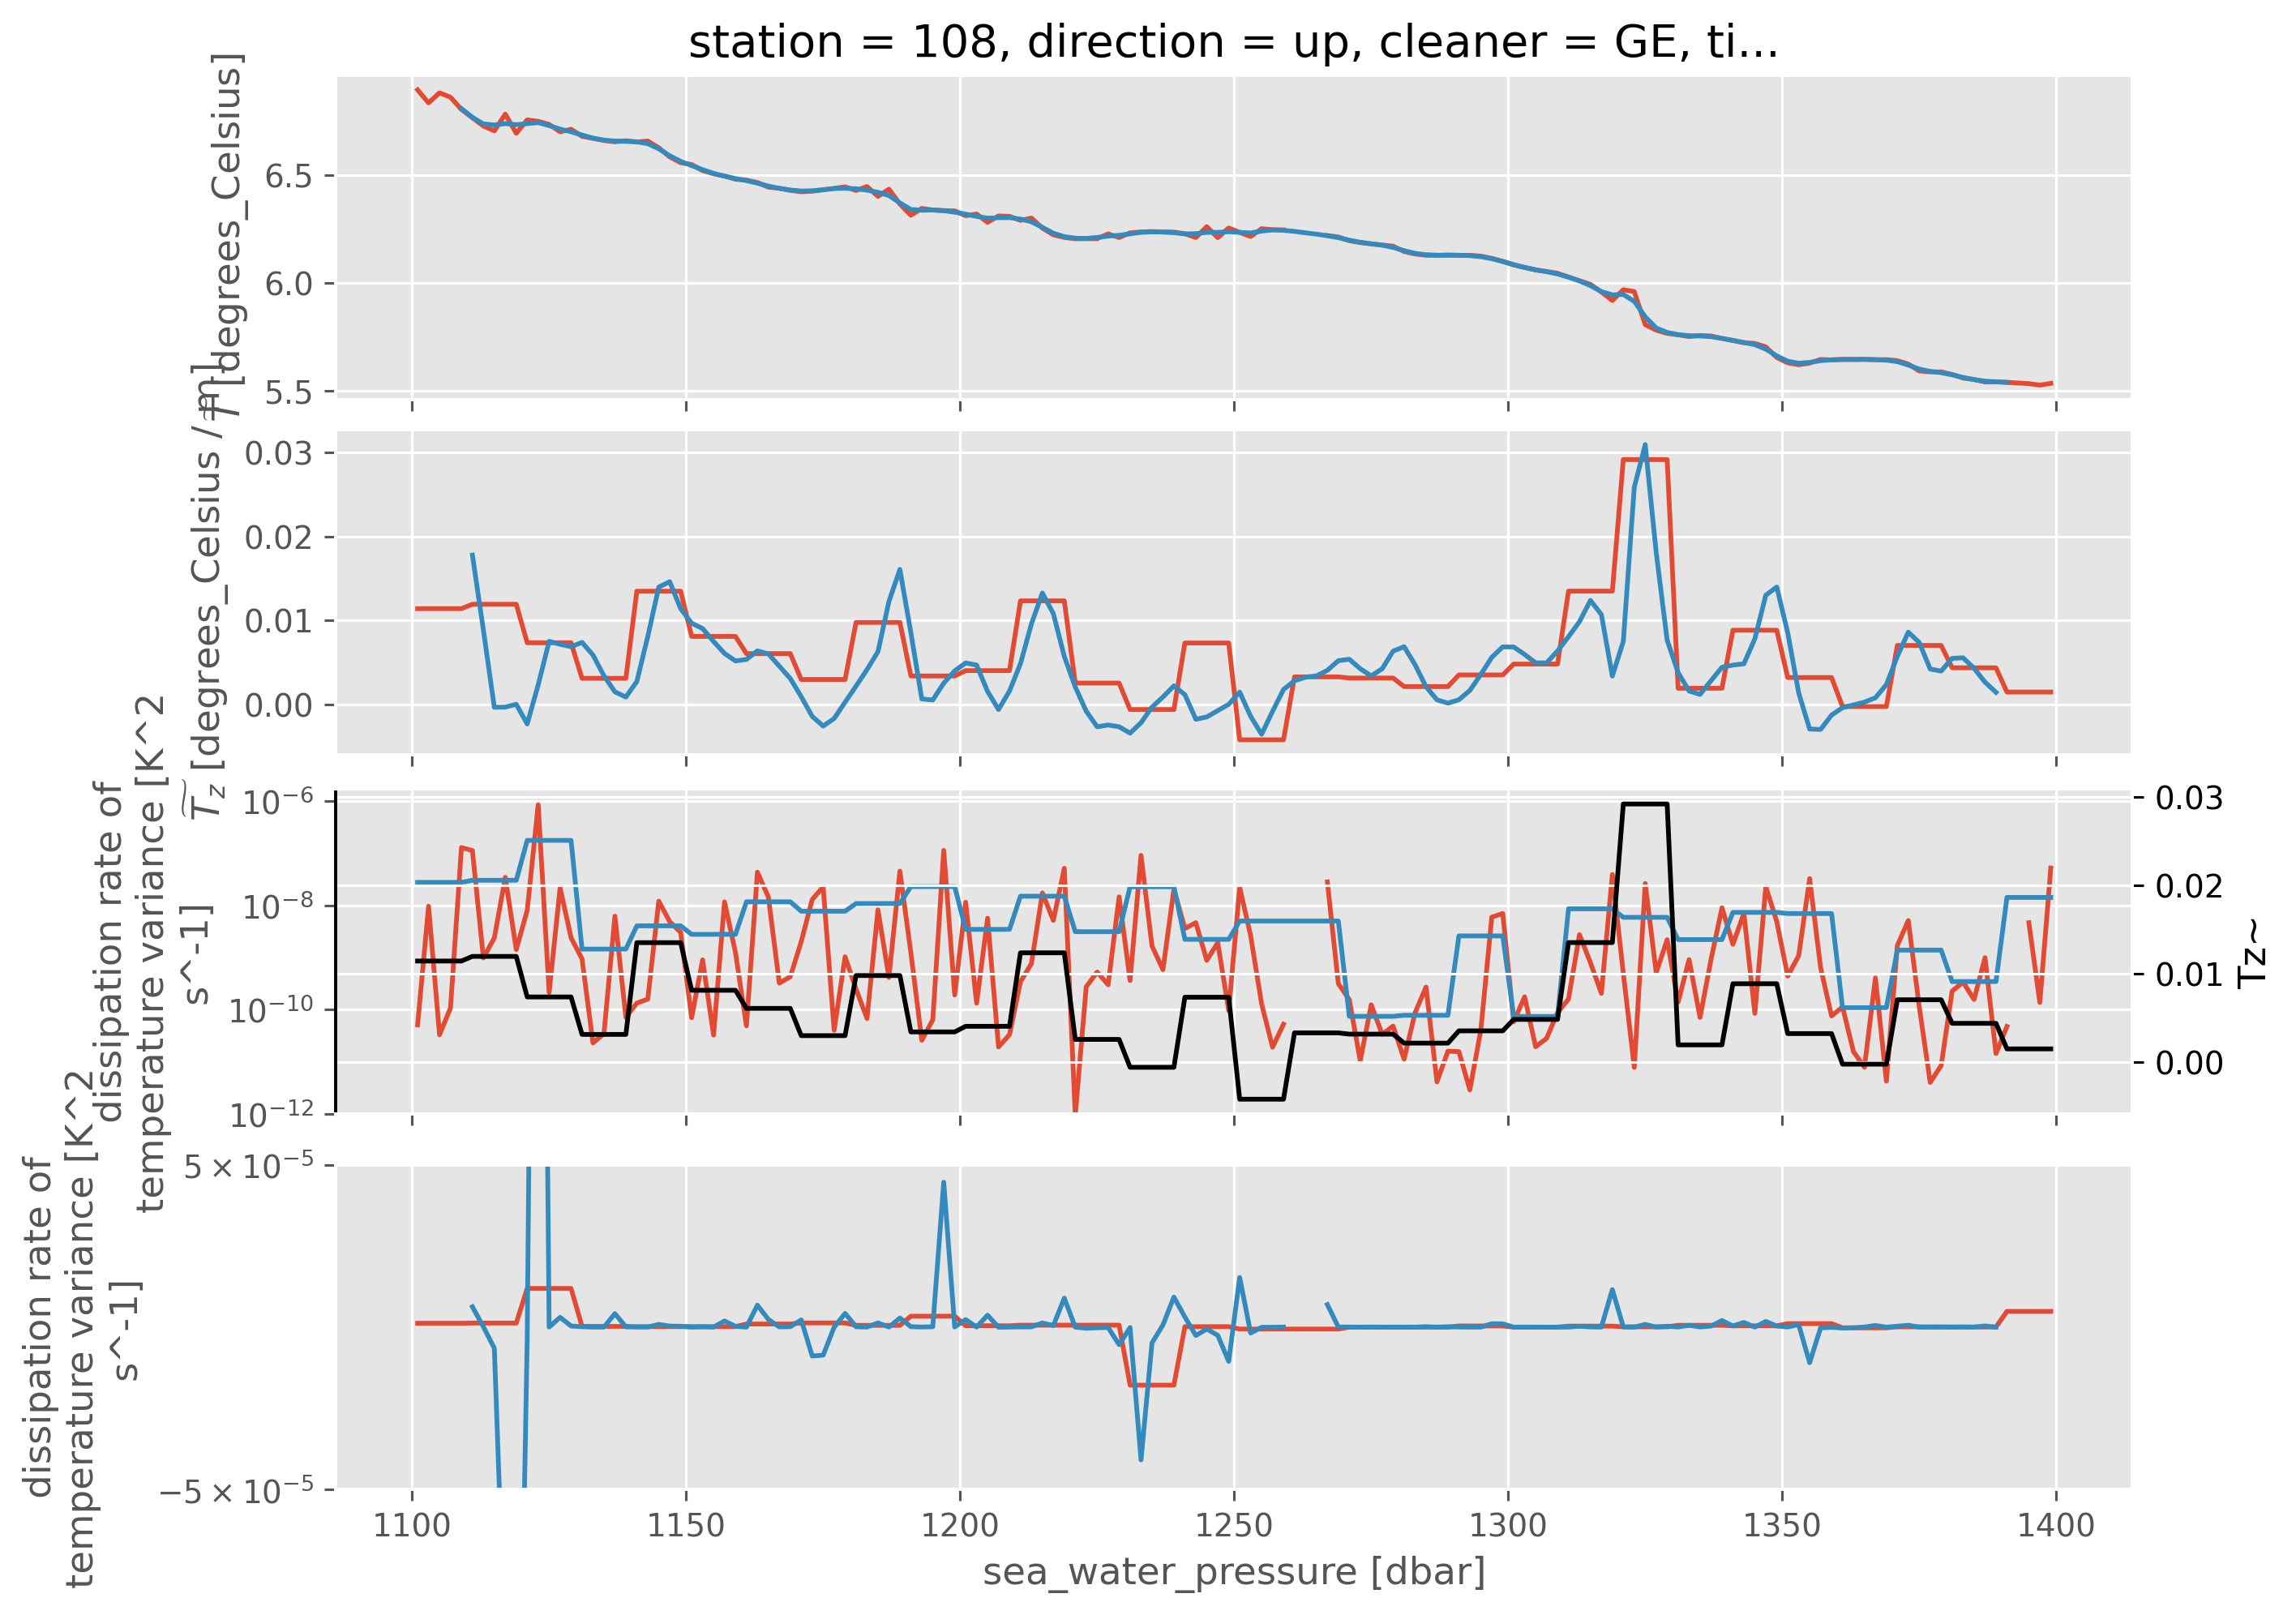
ed.sections.estimate_microscale_stirring_depth_space(
chi.cf.sel(station=108, direction="up", Z=slice(1100, 1400)),
filter_len=20,
segment_len=8,
debug=True,
);
5 10
0 values == 0
30
/Users/dcherian/mambaforge/envs/eddydiff/lib/python3.9/site-packages/numba/np/ufunc/gufunc.py:151: RuntimeWarning: invalid value encountered in get_gradient_sign
return self.ufunc(*args, **kwargs)
clean["KtTz~"].sel(pressure=slice(250, 2000)).sel(direction="dn").ffill(
"pressure"
).rename({"station": "cast"}).hvplot.line(y="pressure", by="cast")
def bin_coarsen(ds, func="mean"):
return getattr(
ds.cf.drop_vars("direction").coarsen(
direction=2,
station=subset["chipod"].ds.sizes["station"],
Z=75,
boundary="trim",
),
func,
)()
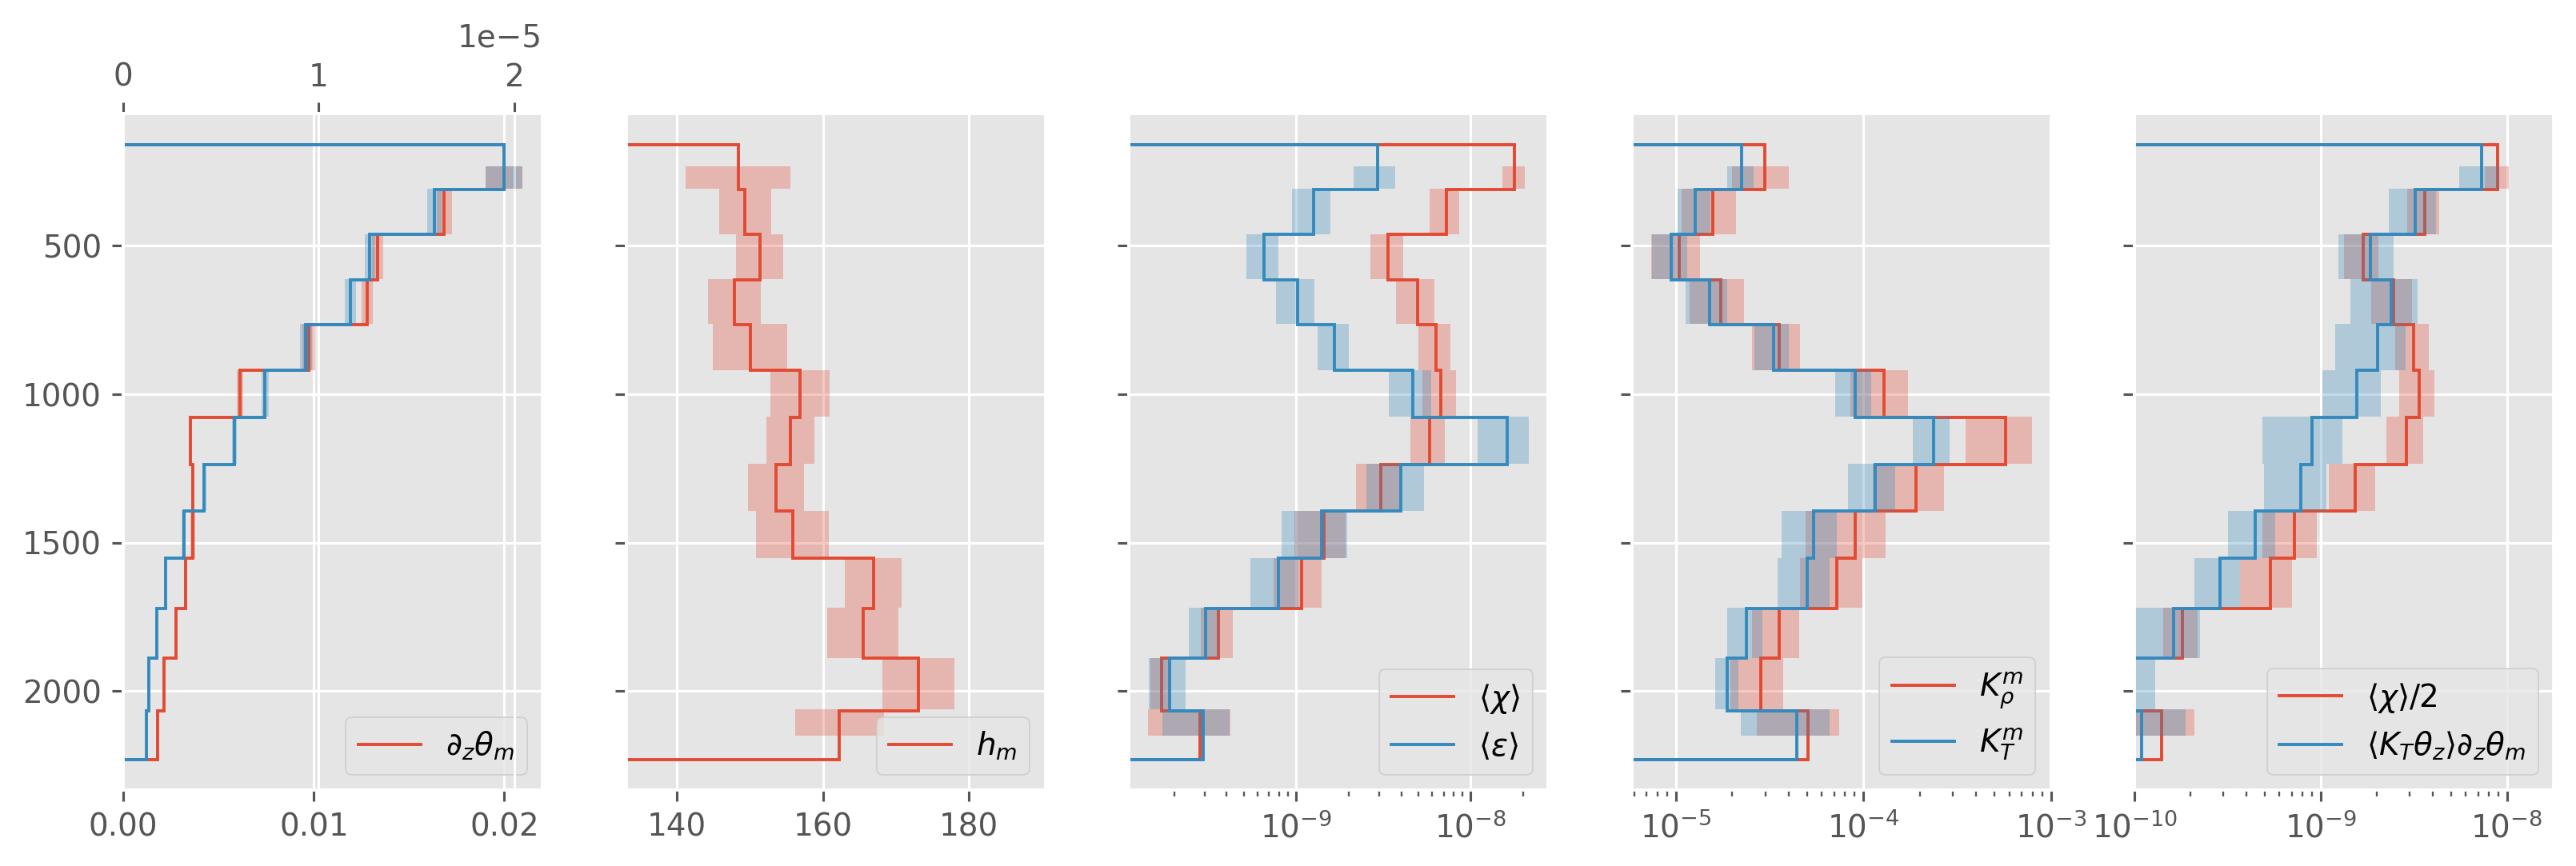
chi_binned = avg
f, ax = plt.subplots(1, 4, sharey=False)
for Tzmin in [1e-3, 5e-3]:
mask = np.abs(chi.Tz) > Tzmin # & (chi.chi < 1e-6)
chib2 = (chi.chi / 2).where(mask)
Kt = chib2 / chi.Tz.where(mask) ** 2
KtTz = chib2 / chi.Tz.where(mask)
bin_coarsen(chib2).squeeze().cf.plot(
y="Z", label=str(Tzmin), ax=ax[0], xscale="log"
)
bin_coarsen(Kt).squeeze().cf.plot(y="Z", label=str(Tzmin), ax=ax[1], xscale="log")
bin_coarsen(KtTz).squeeze().cf.plot(y="Z", label=str(Tzmin), ax=ax[2], xscale="log")
(bin_coarsen(KtTz, func="std") / np.sqrt(100 * 10)).squeeze().cf.plot(
y="Z", label=str(Tzmin), ax=ax[3], xscale="log"
)
# np.log(1025 * 4000 * np.abs(KtTz)).plot.hist(
# bins=np.arange(-10, 10, 0.05), histtype="step", ax=ax[3], density=True
# )
# (chi_binned.chib2).cf.plot(y="pres", ax=ax[0], color="k")
# (chi_binned.KtTzTz / chi_binned.dTdz_m).cf.plot(y="pres", ax=ax[2], _labels=False)
# (chi_binned.chib2 / chi_binned.dTdz_m).cf.plot(
# y="pres", ax=ax[2], color="k", _labels=False
# )
# (chi_binned.Krho_m * chi_binned.dTdz_m).cf.plot(y="pres", ax=ax[2], color="c", _labels=False)
# (chi_binned.δKtTzTz / chi_binned.dTdz_m).cf.plot(y="pres", ax=ax[3], color="k")
# (chi_binned.δKρTz2 / chi_binned.dTdz_m).cf.plot(y="pres", ax=ax[3], color="k")
ax[1].legend()
dcpy.plots.clean_axes(ax)
f.set_size_inches((9, 4))
f, ax = plt.subplots(2, 1, sharex=True)
chi["KtTz~"].sel(direction="up").cf.interpolate_na("Z").mean("station").plot(ax=ax[0])
chi["KtTz~"].sel(direction="dn").cf.interpolate_na("Z").mean("station").plot(
xlim=(0, 2000), ax=ax[0]
)
chi["chi"].sel(direction="up").mean("station").plot(ax=ax[1])
chi["chi"].sel(direction="dn").mean("station").plot(xlim=(0, 2000), ax=ax[1])
ax[0].set_yscale("log")
ax[1].set_yscale("log")
stacked = chi.copy(deep=True).stack(cast=("direction", "station"), create_index=False)
stacked["cast"] = ("cast", np.arange(stacked.sizes["cast"]), {"cf_role": "profile_id"})
stacked
<xarray.Dataset>
Dimensions: (cast: 46, pressure: 3001, sn: 144)
Coordinates:
station (cast) int64 108 109 110 111 112 113 ... 125 126 127 128 129 130
* pressure (pressure) float64 1.0 3.0 5.0 ... 5.997e+03 5.999e+03 6.001e+03
direction (cast) object 'up' 'up' 'up' 'up' 'up' ... 'dn' 'dn' 'dn' 'dn'
cleaner <U2 'GE'
time (cast) datetime64[ns] 2016-01-09T06:22:19.077246976 ... 2016-...
lon (cast) float64 325.1 325.7 326.4 327.0 ... 337.7 338.4 339.0
lat (cast) float64 24.5 24.5 24.5 24.5 ... 24.71 24.92 25.13 25.33
CTD_chipod float64 9.969e+36
* cast (cast) int64 0 1 2 3 4 5 6 7 8 9 ... 37 38 39 40 41 42 43 44 45
Dimensions without coordinates: sn
Data variables: (12/29)
T (pressure, cast) float64 nan nan nan nan nan ... nan nan nan nan
S (pressure, cast) float64 nan nan nan nan nan ... nan nan nan nan
dThdz (pressure, cast) float64 nan nan nan nan nan ... nan nan nan nan
pts2bin (pressure, cast) float64 nan nan nan nan nan ... nan nan nan nan
N2 (pressure, cast) float64 nan nan nan nan nan ... nan nan nan nan
chi (pressure, cast) float64 nan nan nan nan nan ... nan nan nan nan
... ...
SN (sn, cast) float64 2.013e+03 2.013e+03 ... -9.223e+18 -9.223e+18
sn_avail (cast) float64 2.0 2.0 2.0 2.0 2.0 2.0 ... 1.0 1.0 1.0 1.0 1.0
Tz~ (pressure, cast) float64 nan nan nan nan nan ... nan nan nan nan
chi~ (pressure, cast) float64 nan nan nan nan nan ... nan nan nan nan
Kt~ (pressure, cast) float64 nan nan nan nan nan ... nan nan nan nan
KtTz~ (pressure, cast) float64 nan nan nan nan nan ... nan nan nan nan
Attributes: (12/14)
cruise_name: A05
featureType: trajectoryProfile
Conventions: CF-1.8
title: Turbulence quantities measured by CTD-chipods mounted ...
summary: Turbulence data across the ocean basin from 10 m to th...
processing_level: 3: Variables mapped on uniform space-time grid from hi...
... ...
date_created: 2022-05-01T11:21:00866Z
creator_name: Jonathan Nash / Aurelie Moulin
institution: Ocean Mixing Group, College of Earth, Ocean, and Atmos...
project: A05, GO-SHIP (The Global Ocean Ship-Based Hydrographic...
reference1: J.D. Nash et al., Ocean mixing measured by fast-respon...
comment: Expocode: 740H20200119avg = ed.sections.bin_average_vertical(
stacked, "neutral_density", bins=bins, blocksize=10
)
avg.load(scheduler=client)
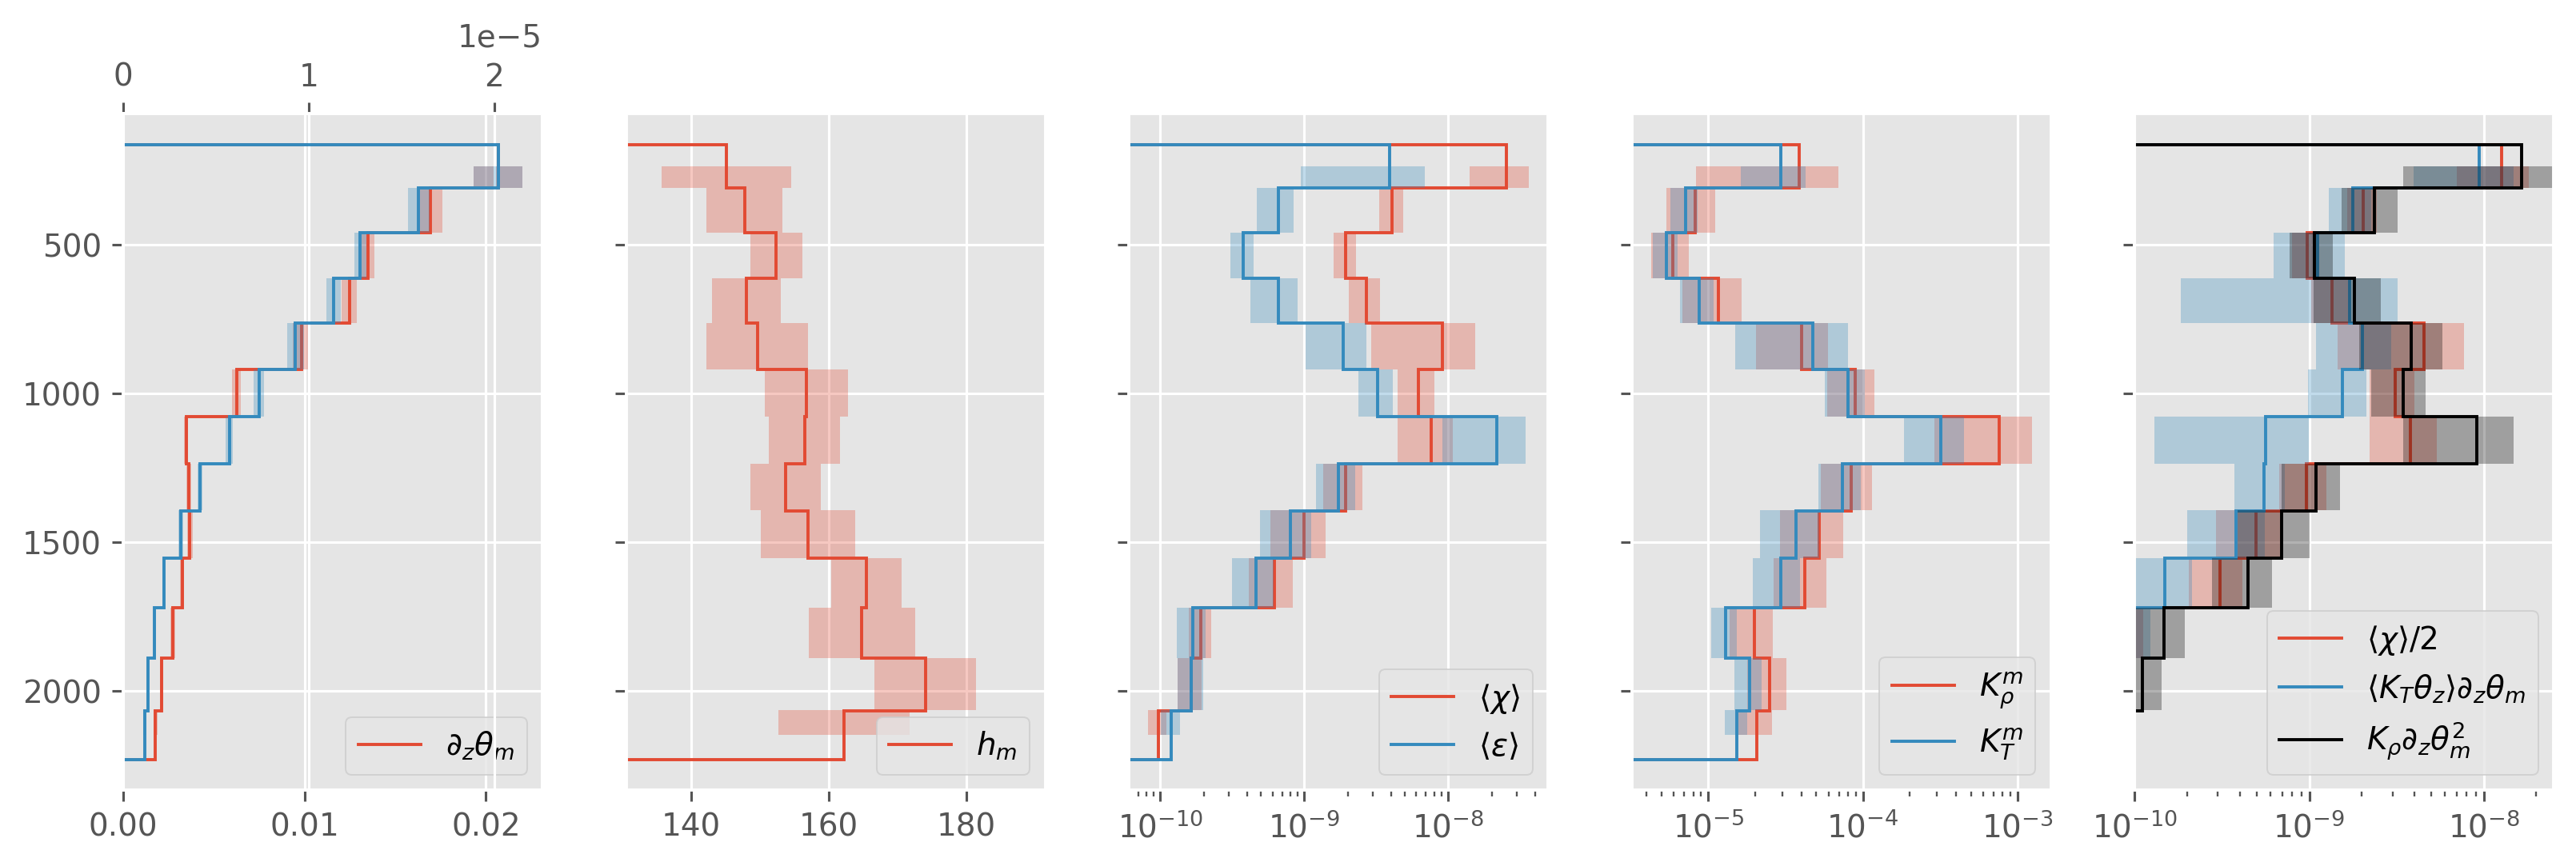
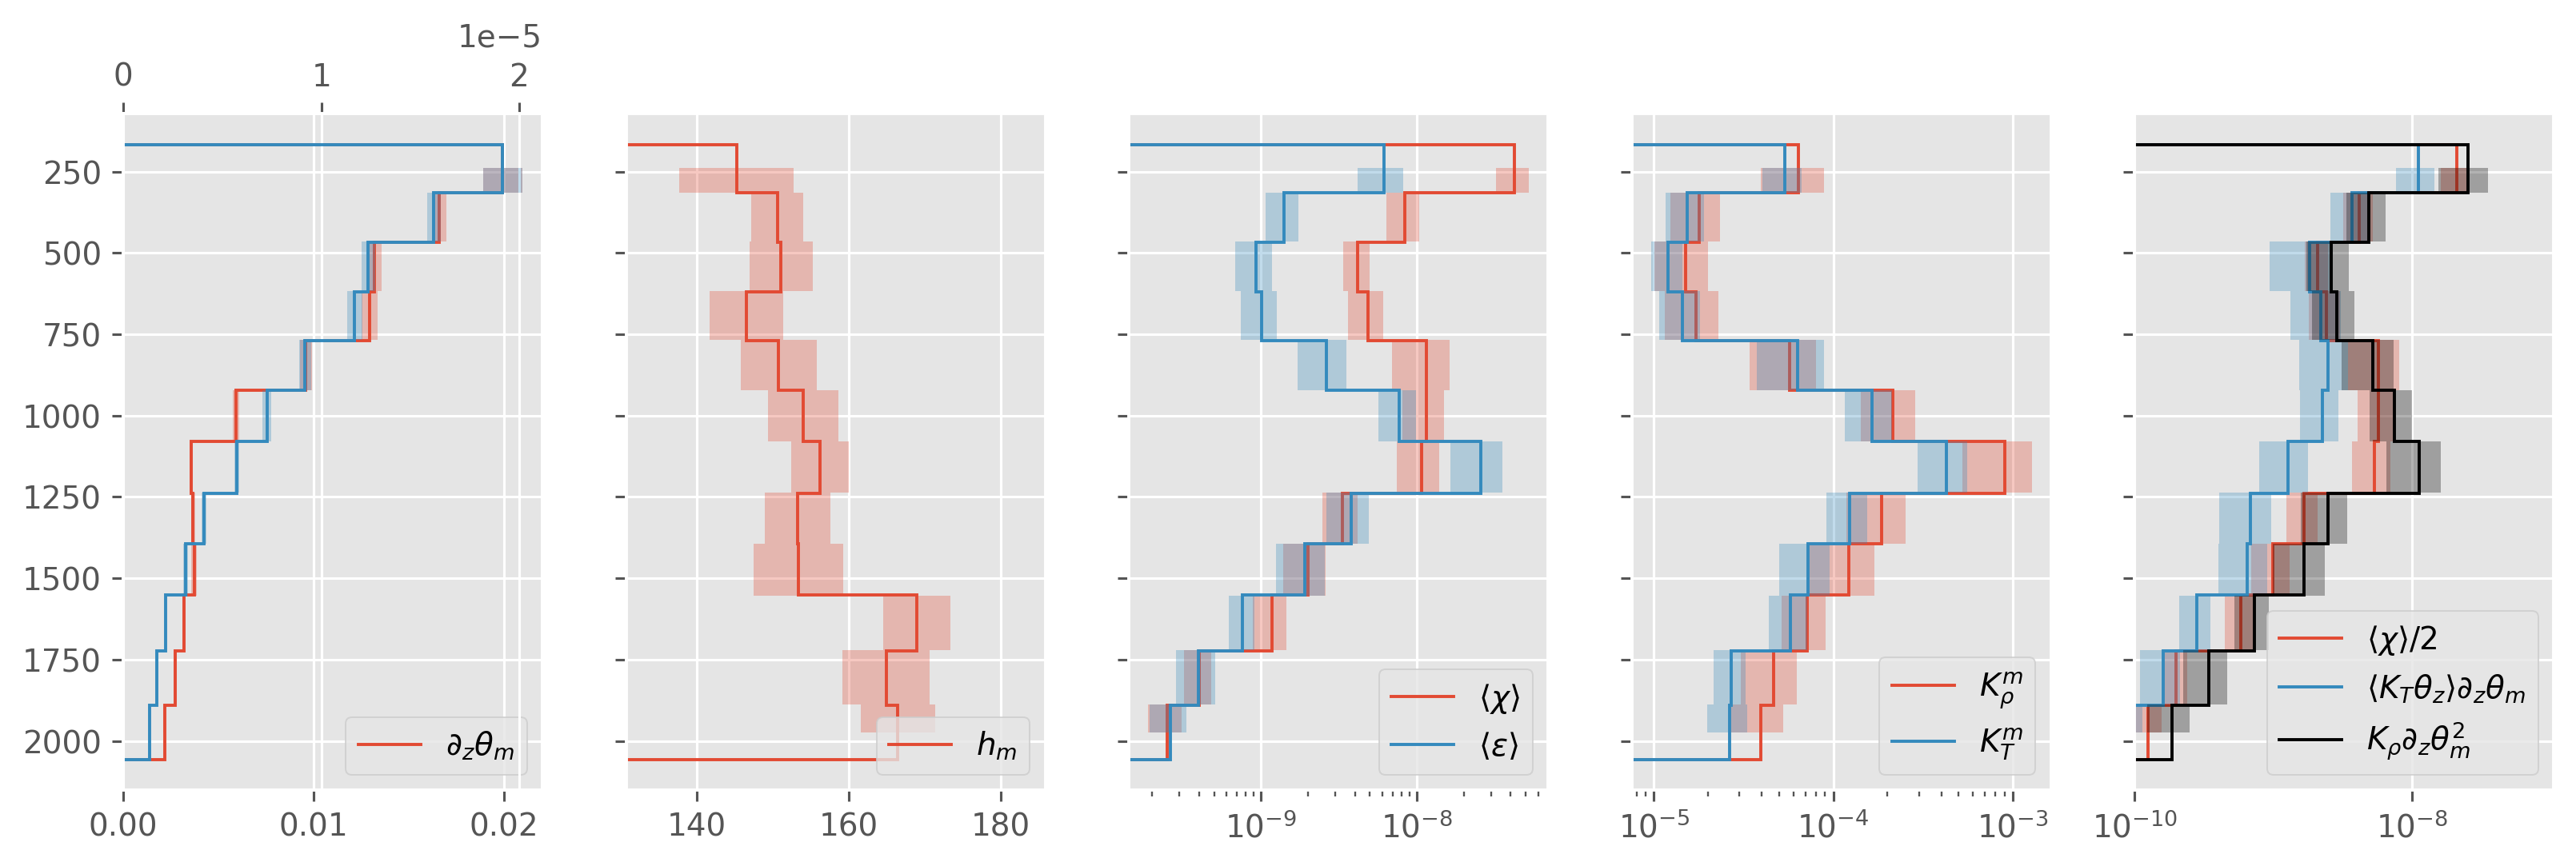
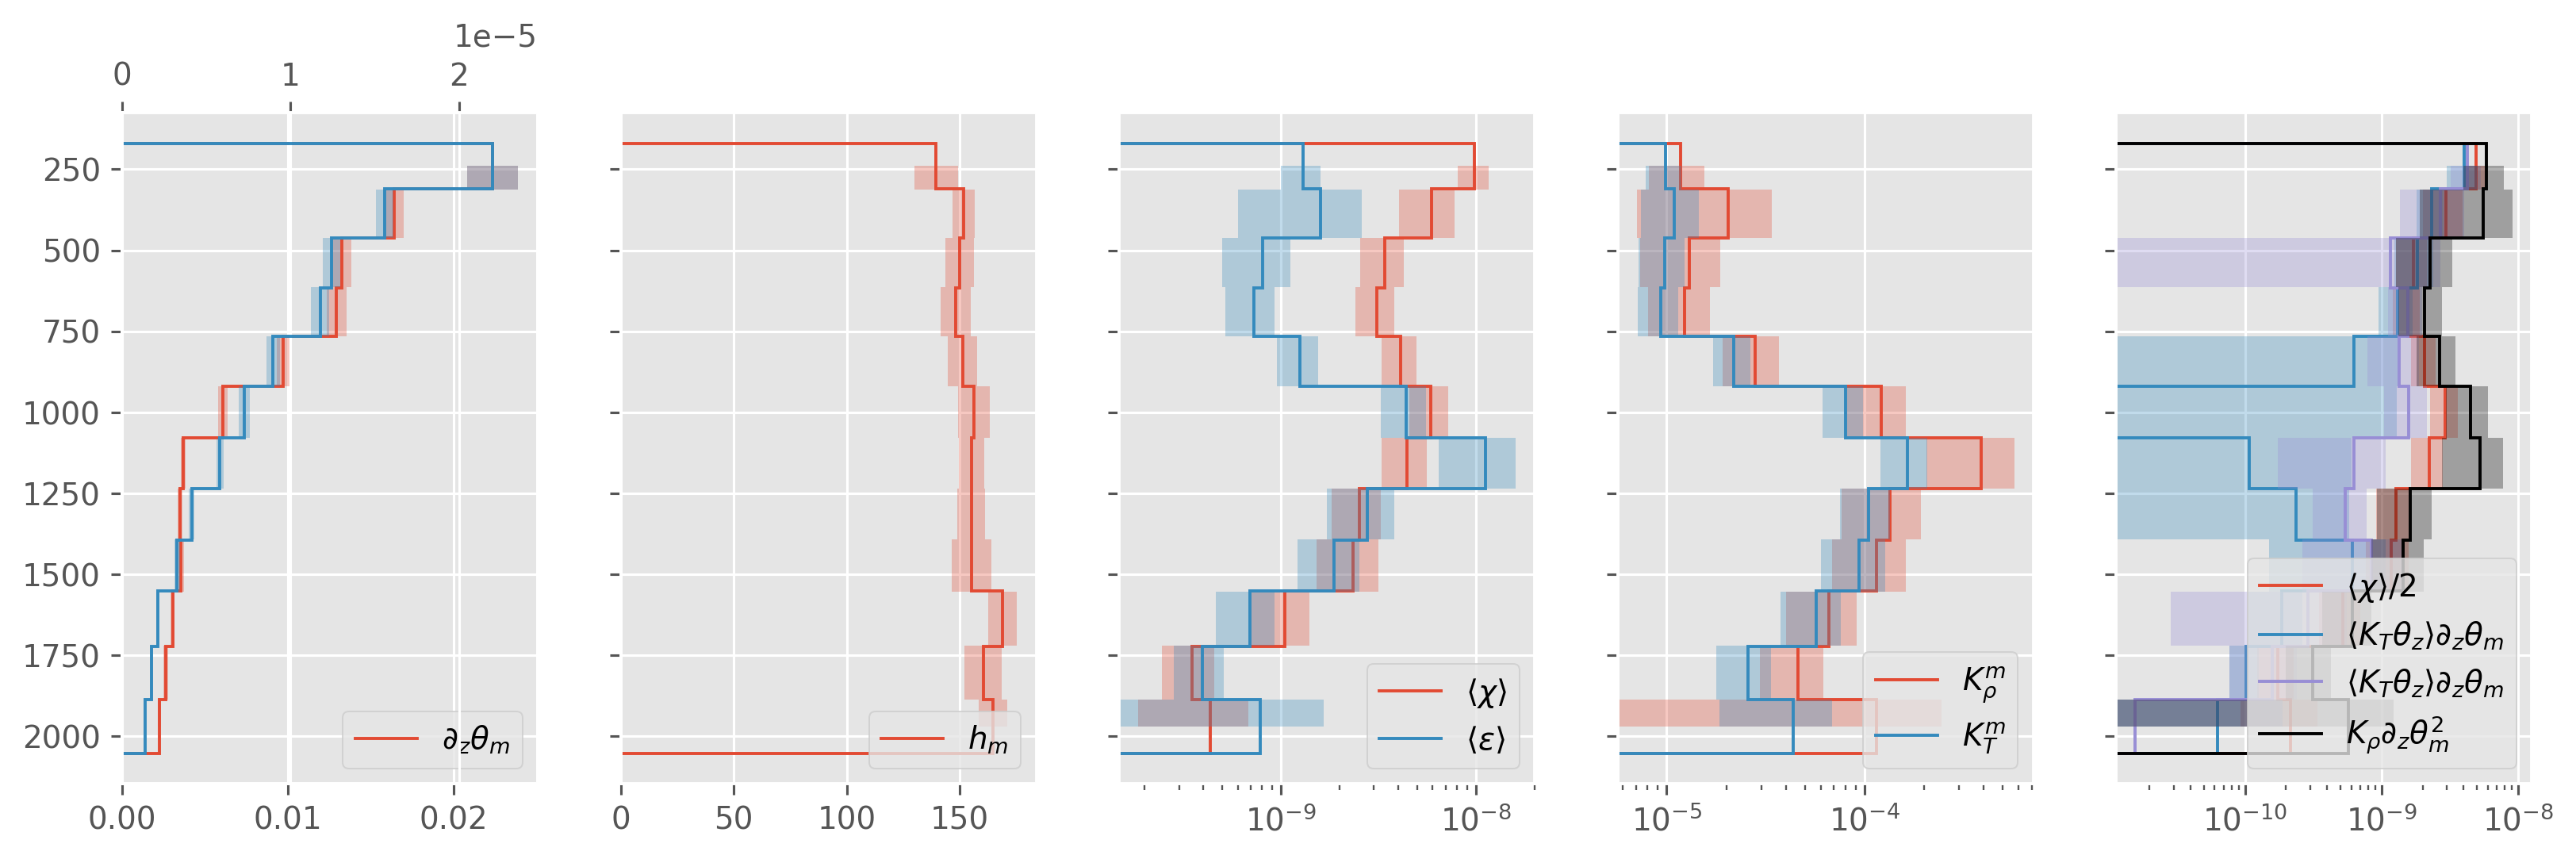
ed.plot.debug_section_estimate(avg)
avg.to_netcdf("../datasets/a05-2015.nc")
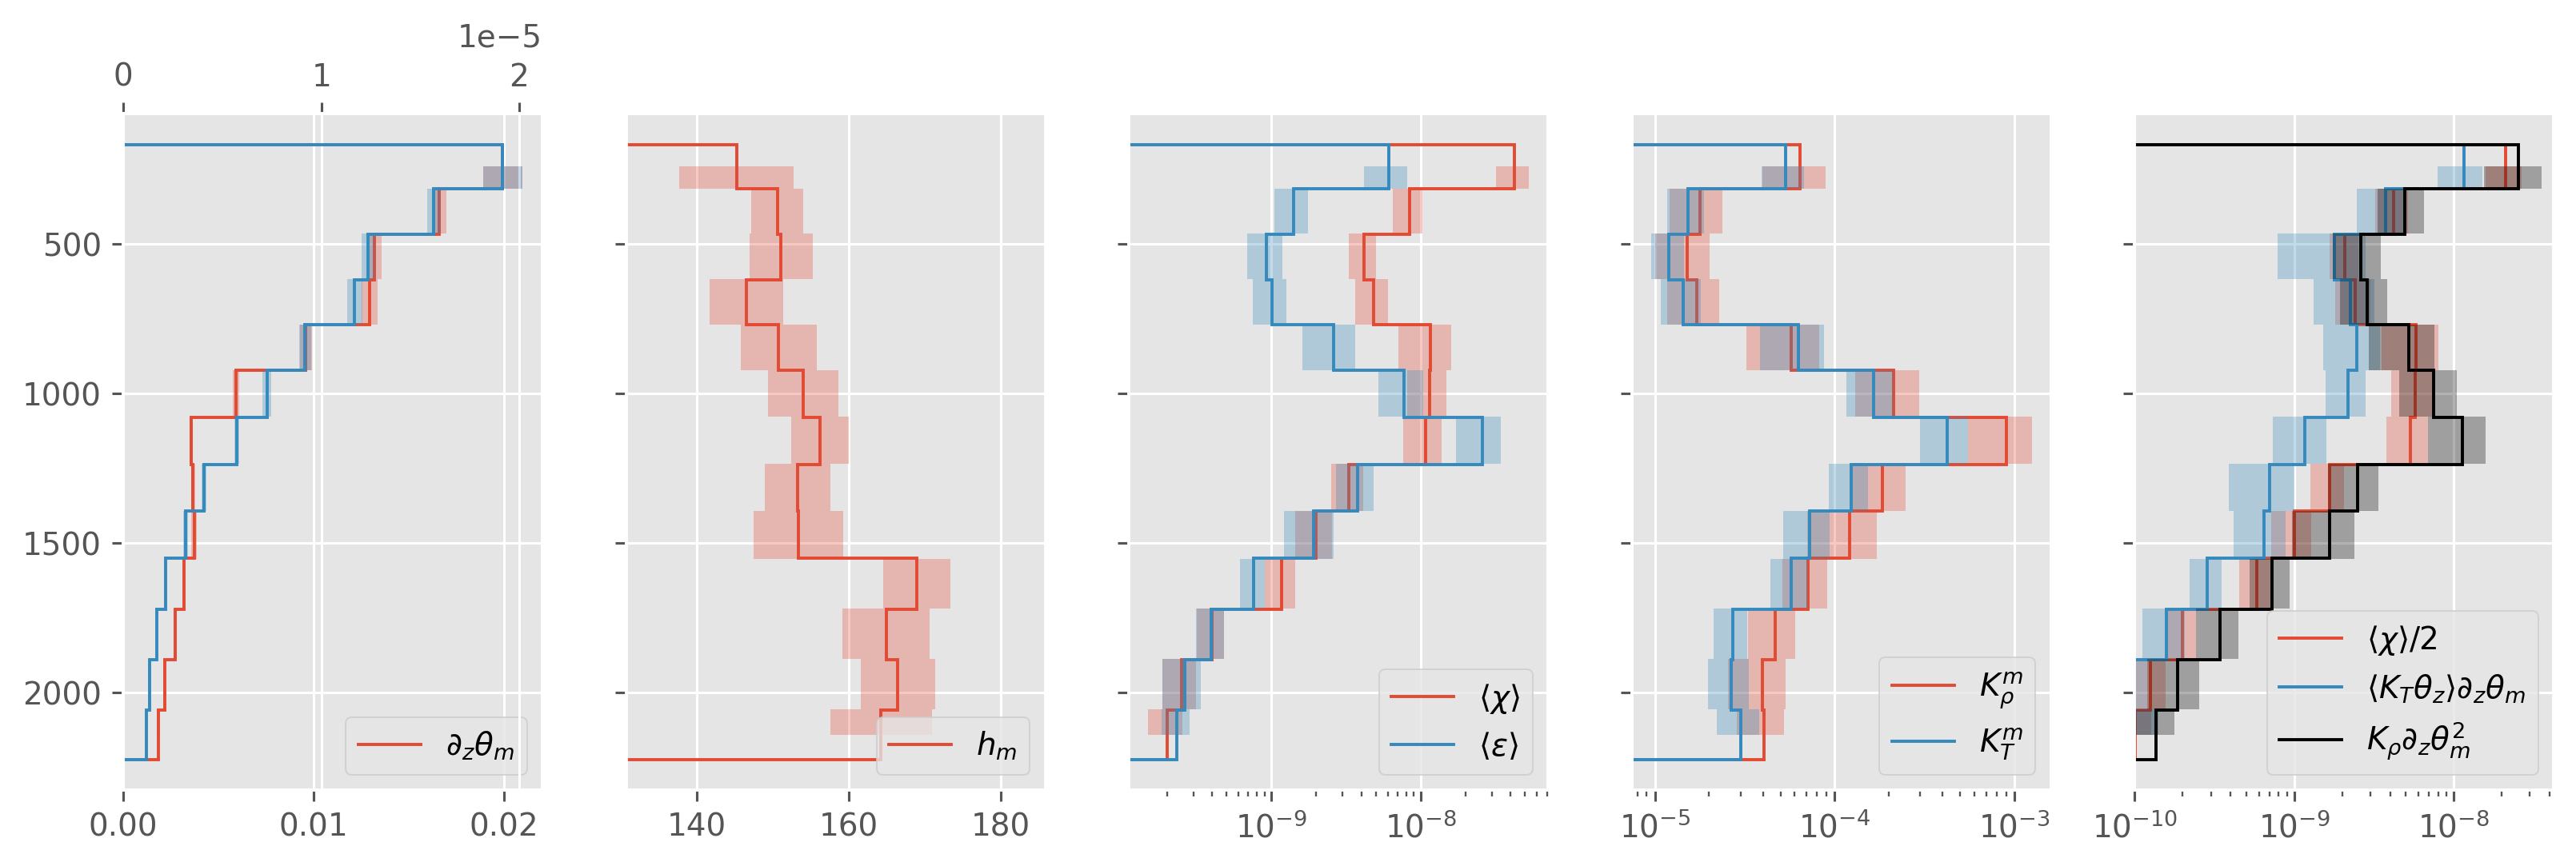
ed.plot.debug_section_estimate(avg)
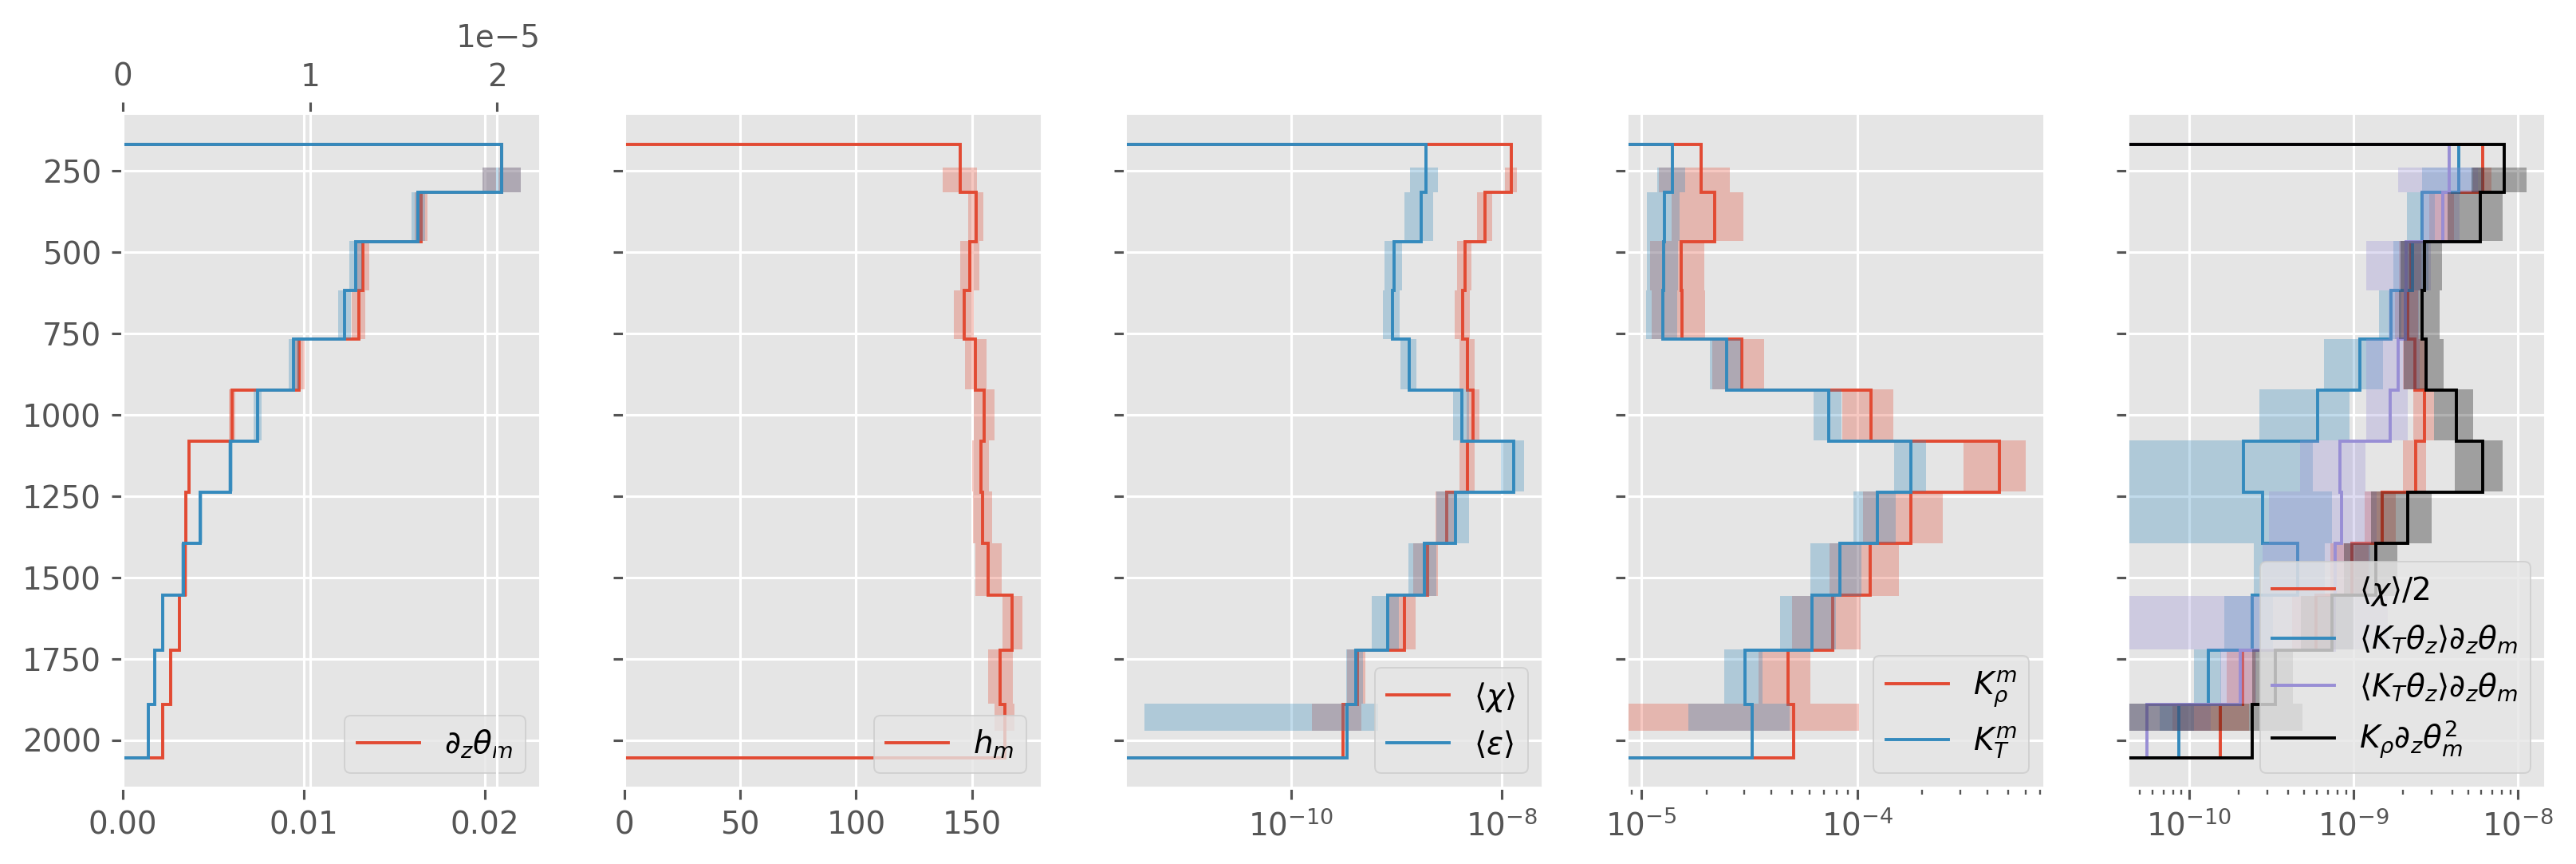
stations 108-130 only dn#
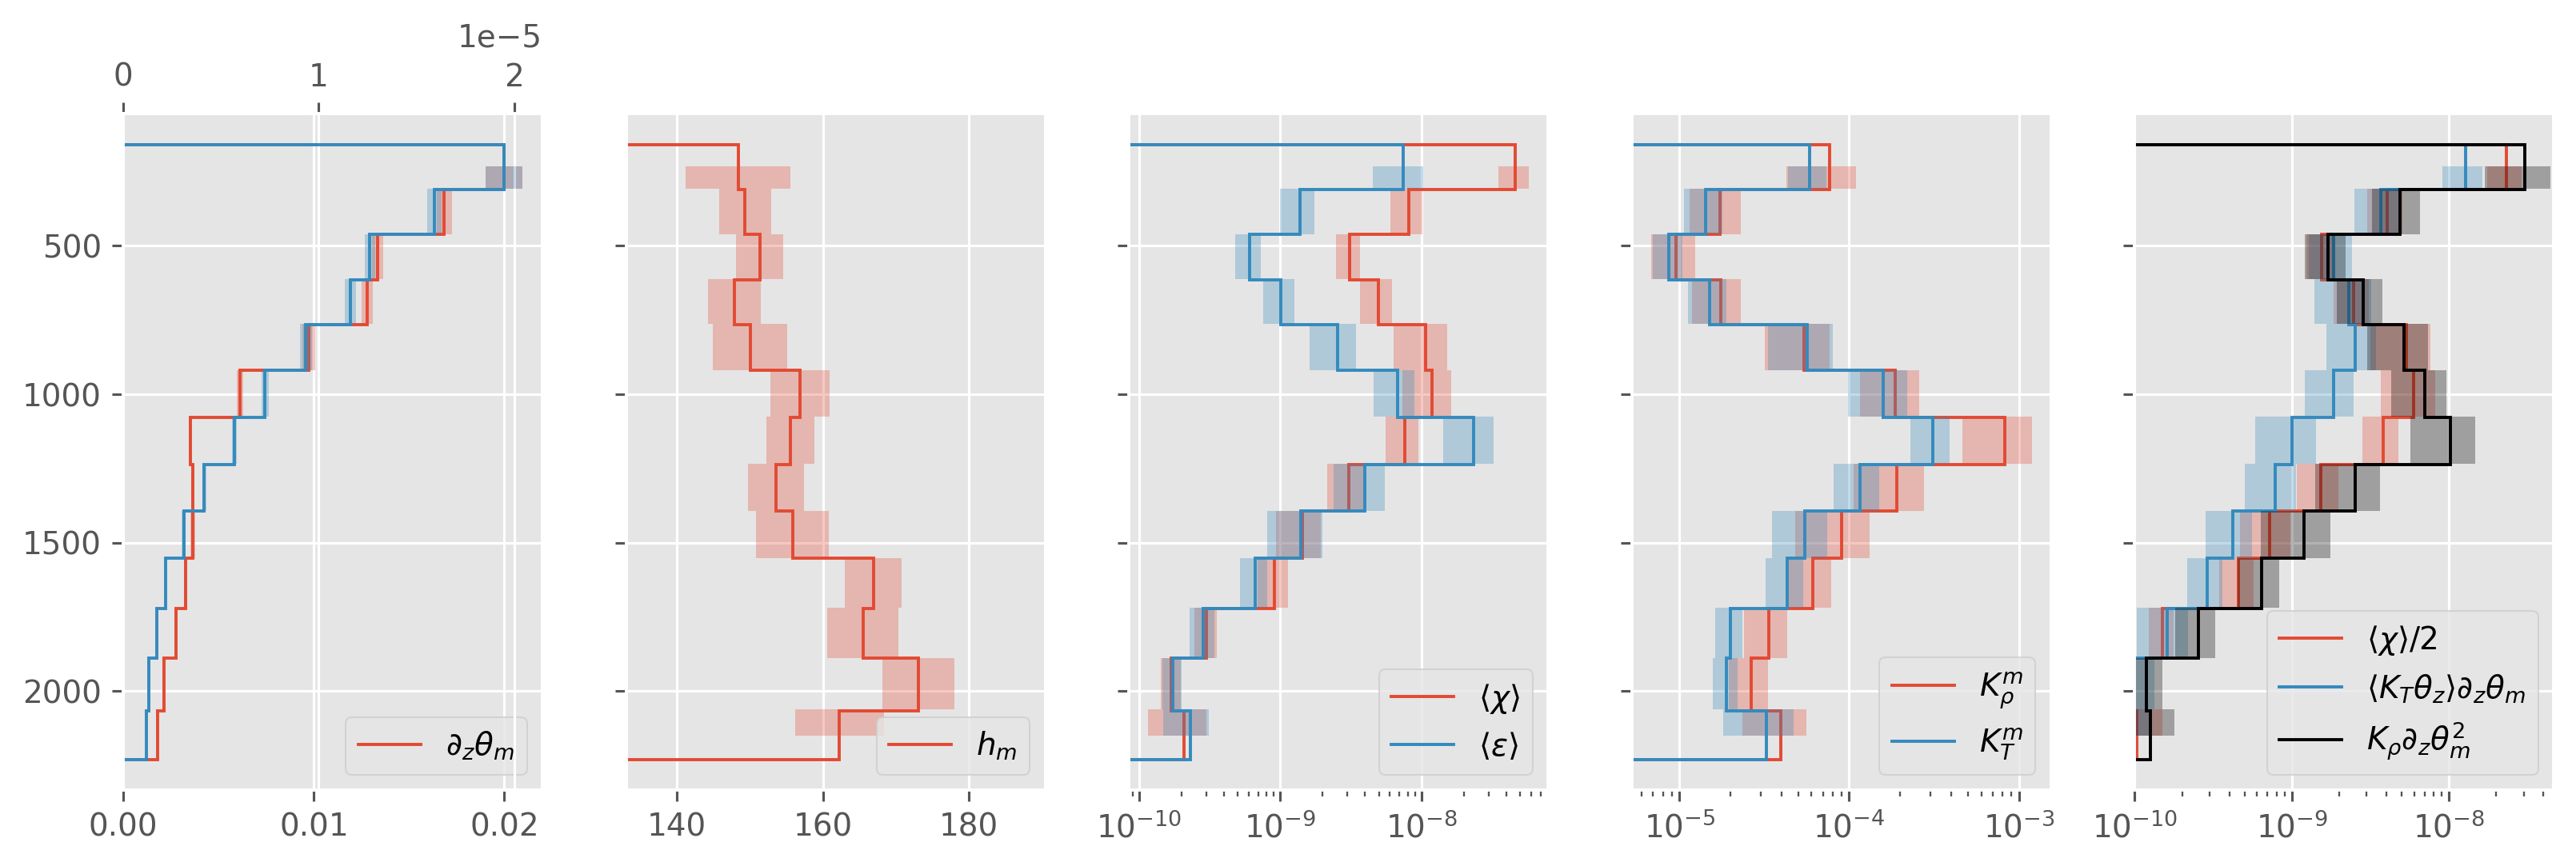
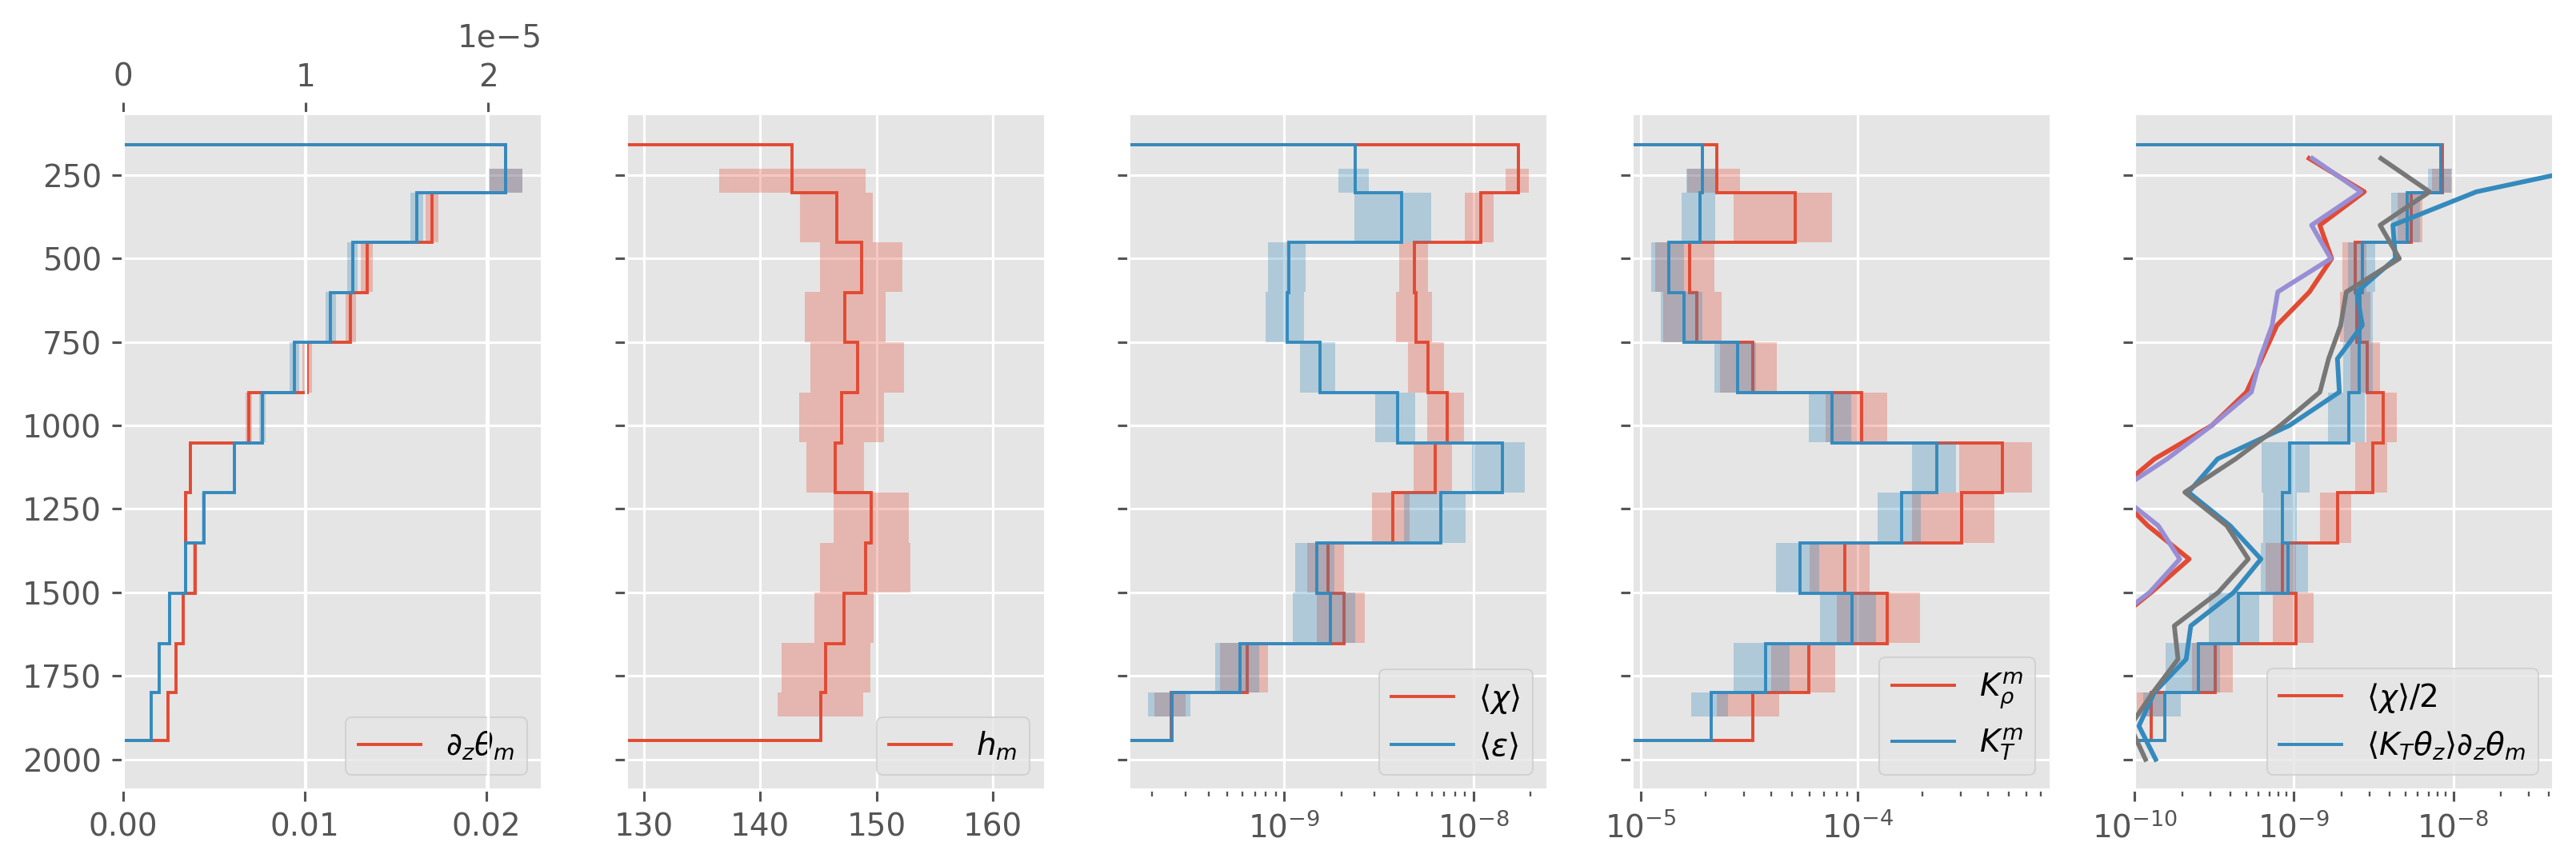
ed.plot.debug_section_estimate(avg)
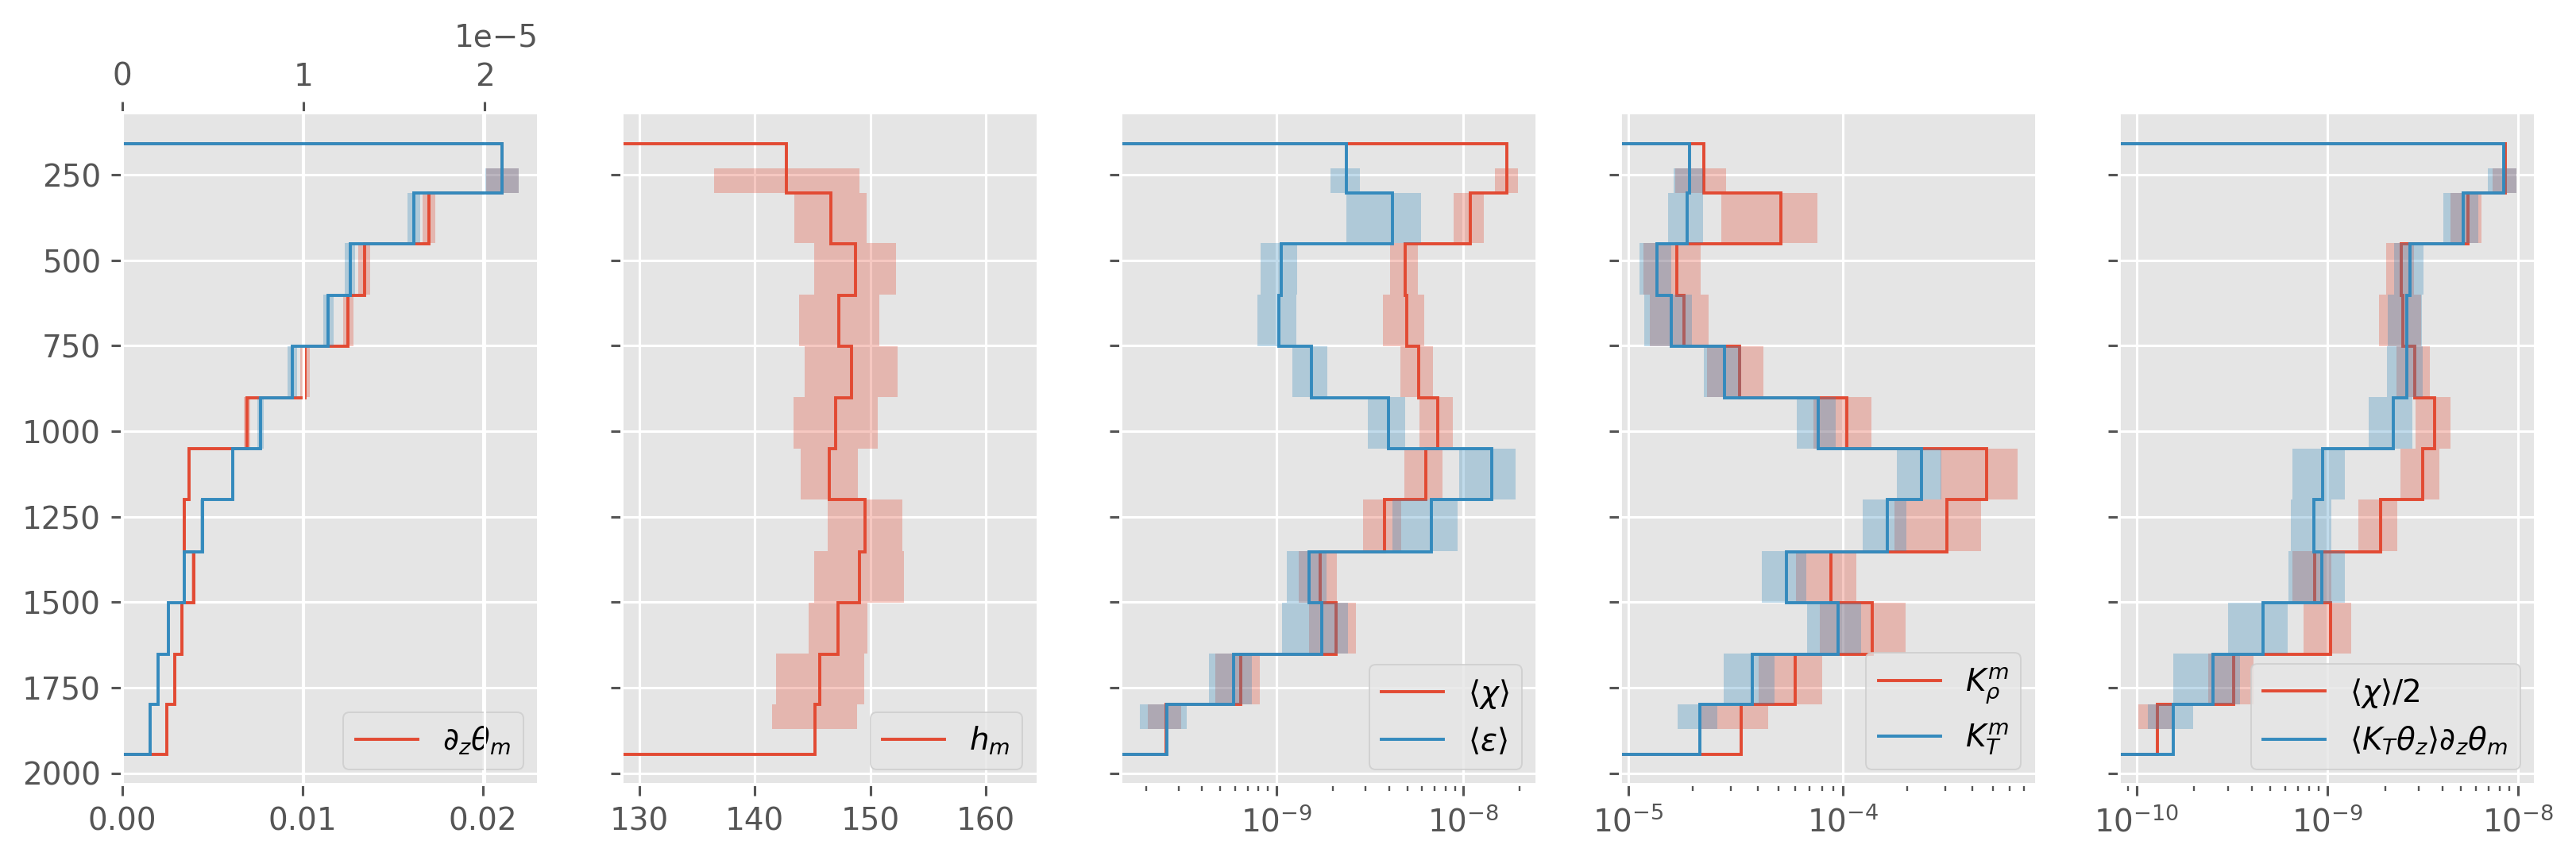
stations 108-130 up+dn#
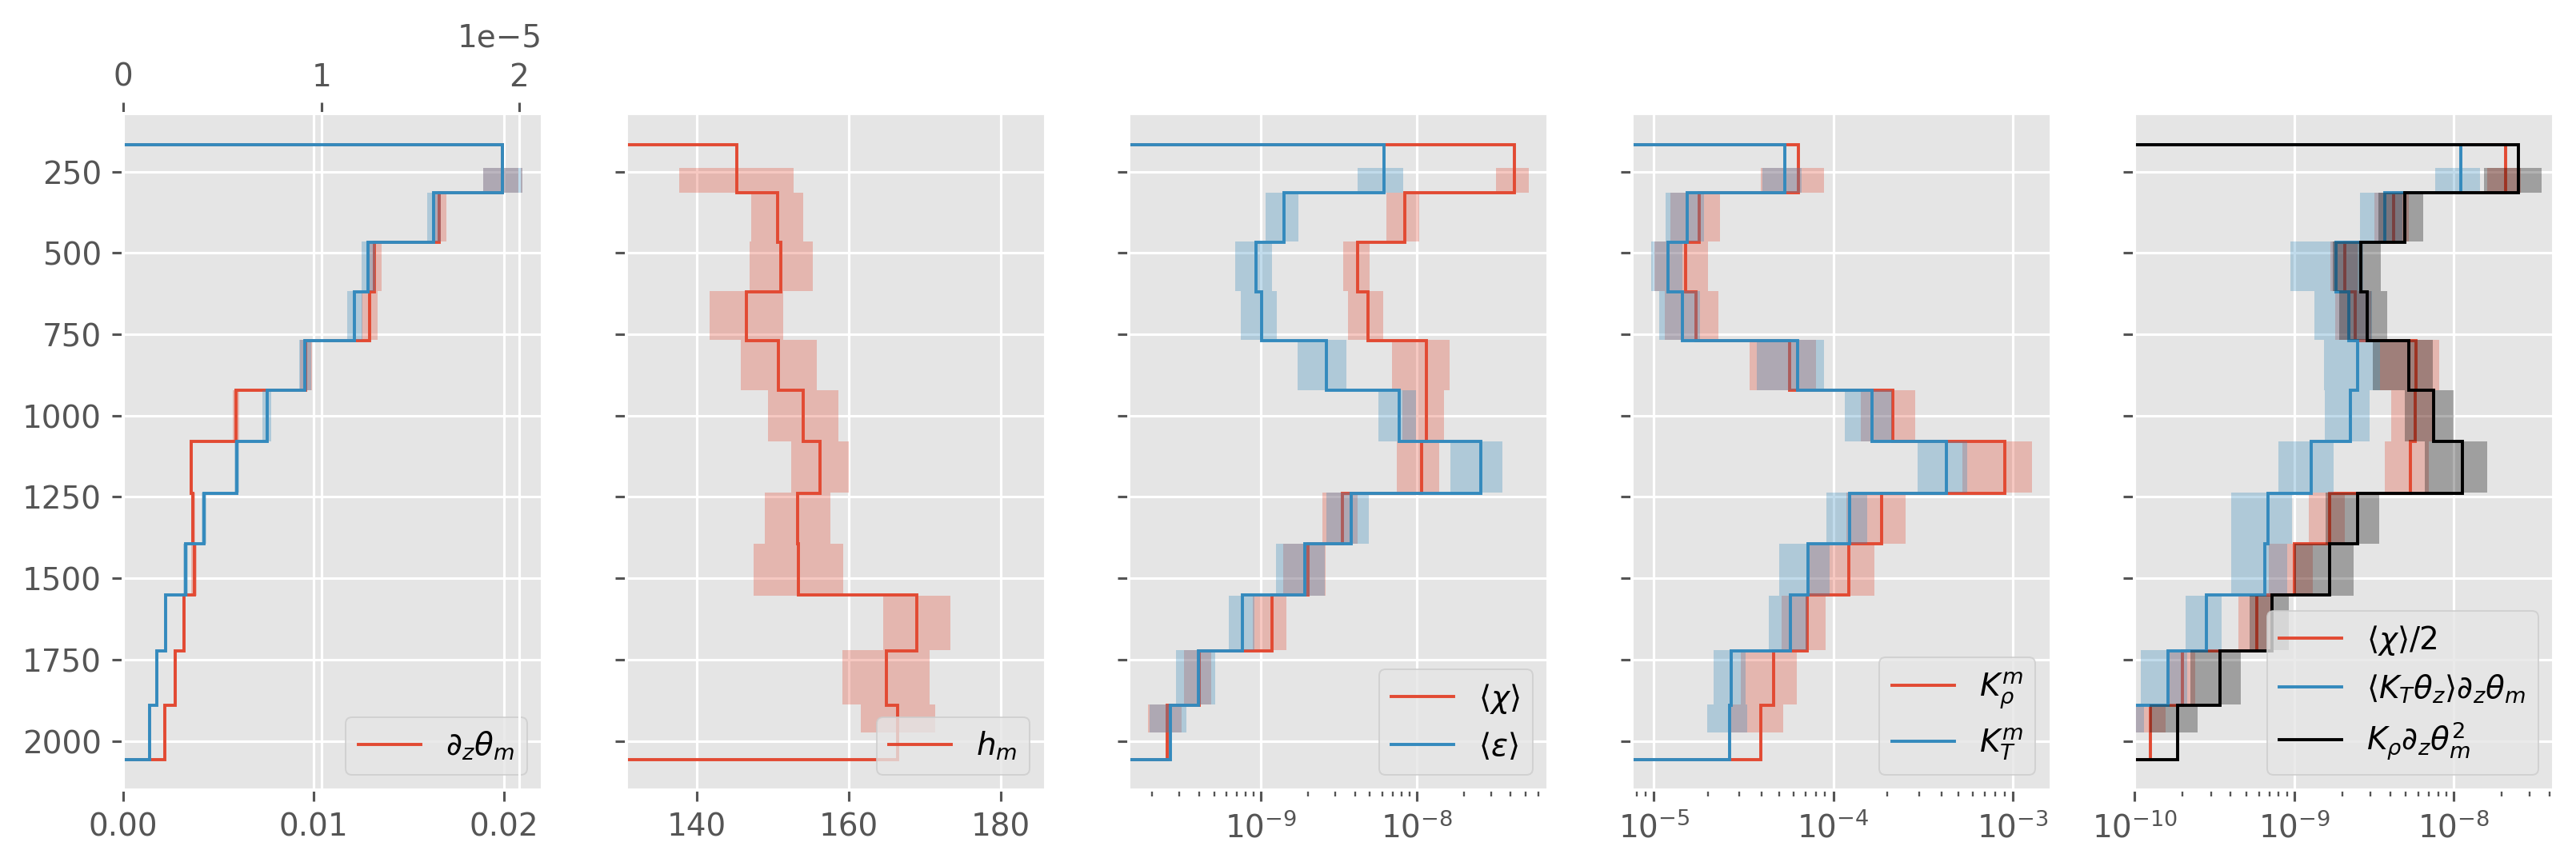
ed.plot.debug_section_estimate(avg)
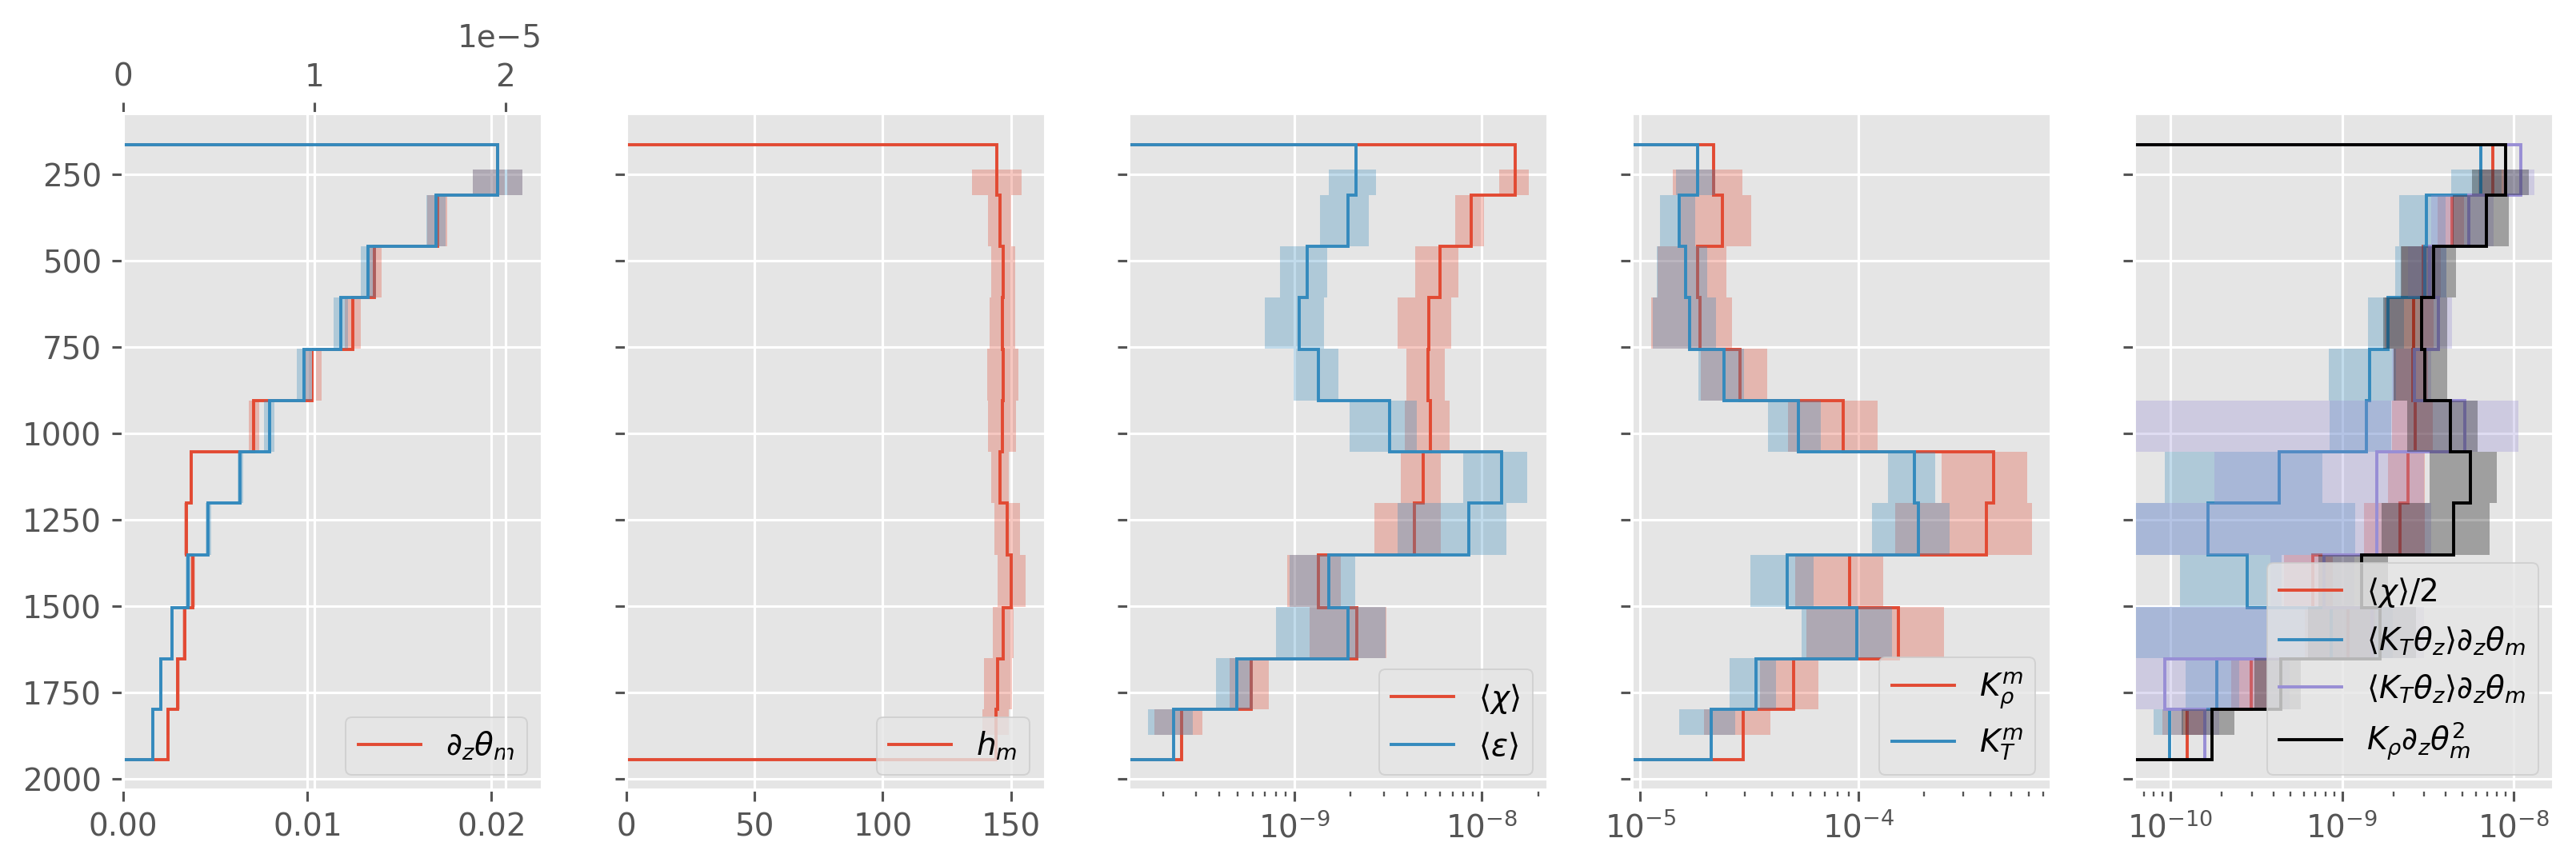
fancy sign#
150m bins
|Tz~| > 1e-4
|KtTz~| < 2e-5
ed.plot.debug_section_estimate(
avg,
# finescale=subset["finescale"].ds.chi.mean("station").cf.sel(Z=slice(2000)) / 2
)
ed.plot.debug_section_estimate(
avg,
# finescale=subset["finescale"].ds.chi.mean("station").cf.sel(Z=slice(2000)) / 2
)
fancy sign: |Tz~| < 1e-5#
also using CTD T for upcast. booo
ed.plot.debug_section_estimate(
avg,
# finescale=subset["finescale"].ds.chi.mean("station").cf.sel(Z=slice(2000)) / 2
)
before fancy sign#
ed.plot.debug_section_estimate(
avg, finescale=subset["finescale"].ds.chi.mean("station").cf.sel(Z=slice(2000)) / 2
)
ed.plot.debug_section_estimate(avg)
direction = “up”#
ed.plot.debug_section_estimate(avg)
direction = “dn”#
ed.plot.debug_section_estimate(avg)
direction = both#
ed.plot.debug_section_estimate(avg)
Single group#
grouped = ed.sections.bin_average_vertical(
stacked, "neutral_density", bins=bins[7:], blocksize=20, return_group=True
)
for label, group in grouped:
break
profiles = group.unstack()
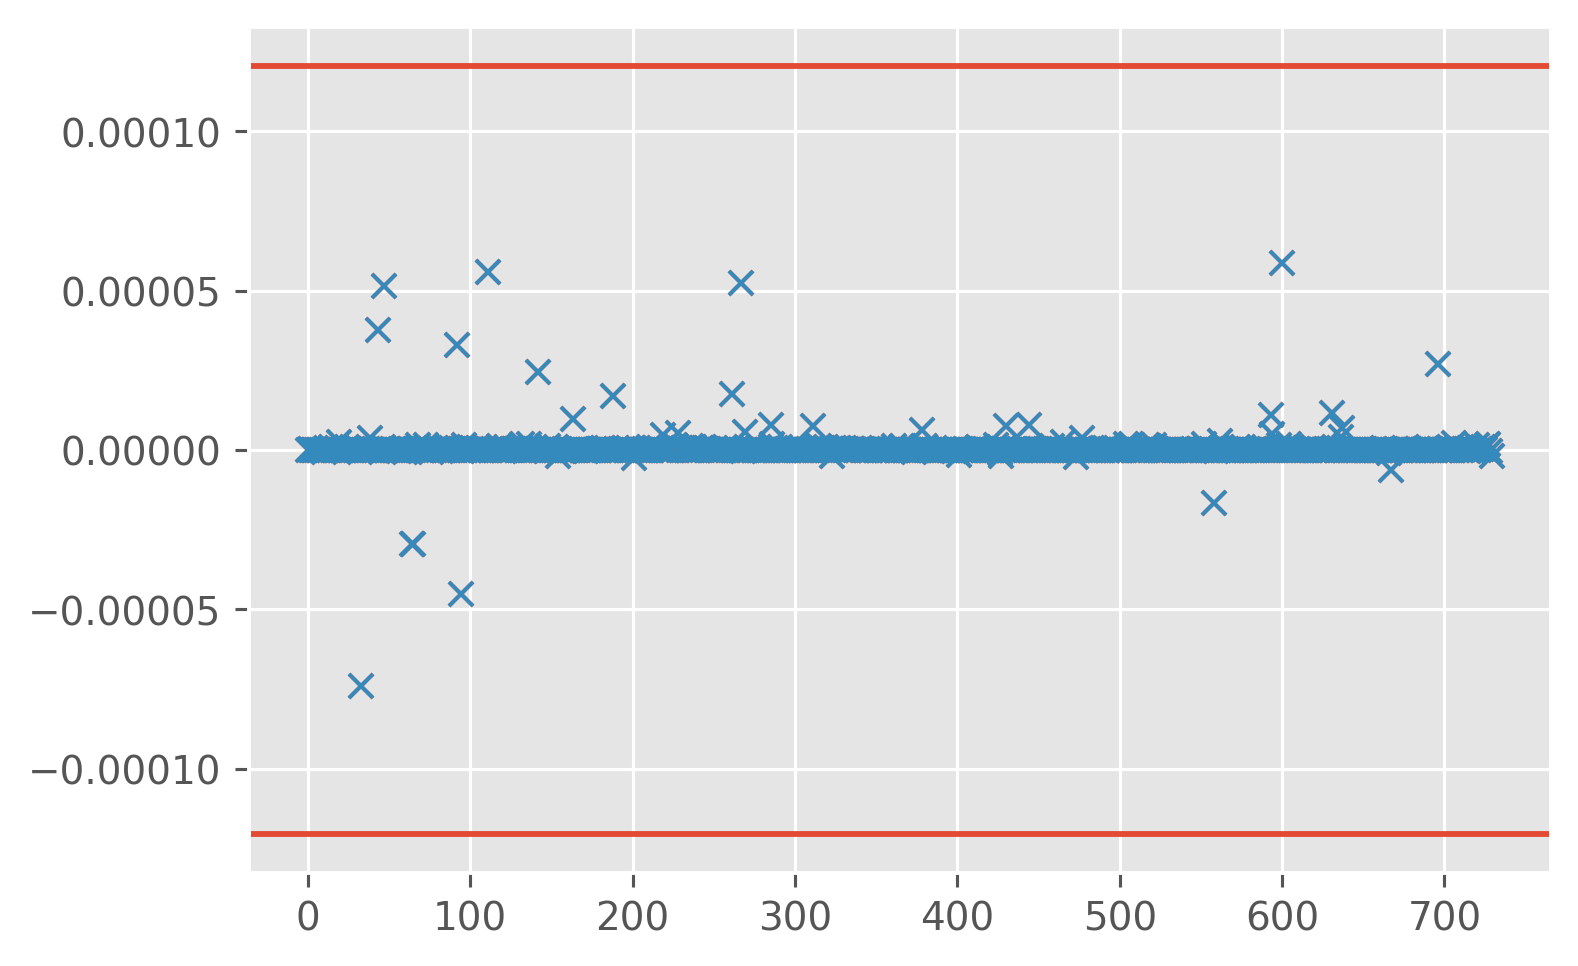
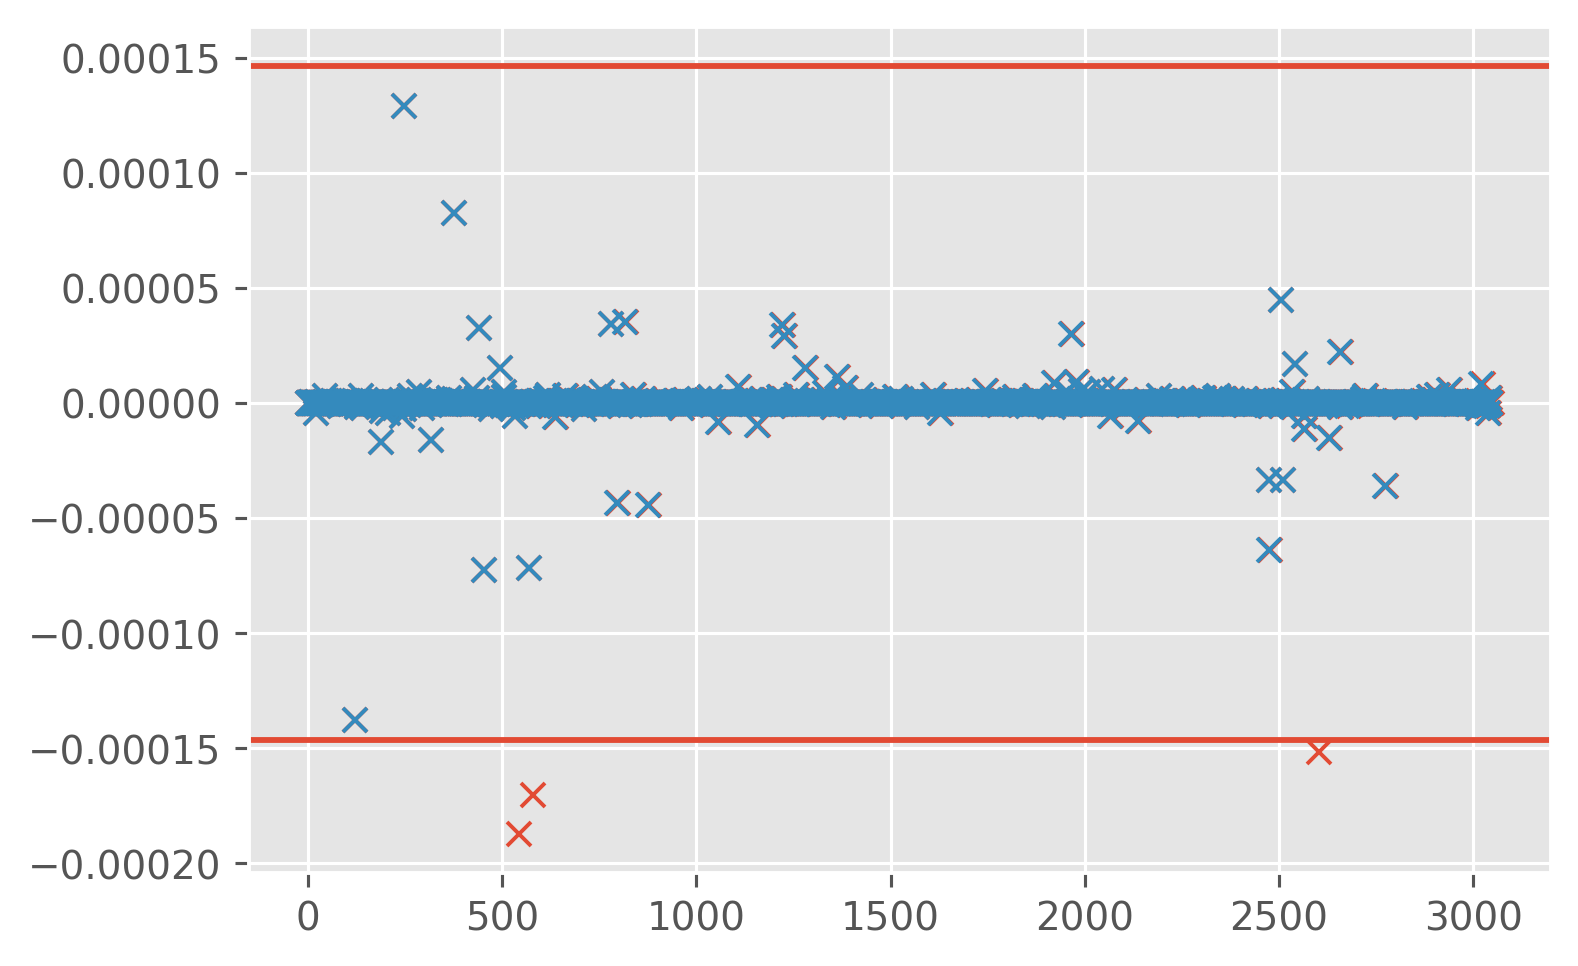
print(
ed.sections.compute_bootstrapped_mean_ci(
profiles["KtTz~"].data.reshape(-1), blocksize=30, clean=True, debug=True
)
)
print(
ed.sections.compute_bootstrapped_mean_ci(
profiles["KtTz"].data.reshape(-1), blocksize=30, clean=True, debug=True
)
)
[1.61517572e-07 5.36654014e-07 8.86430789e-07]
[-1.07734771e-07 6.55157810e-08 2.37830932e-07]
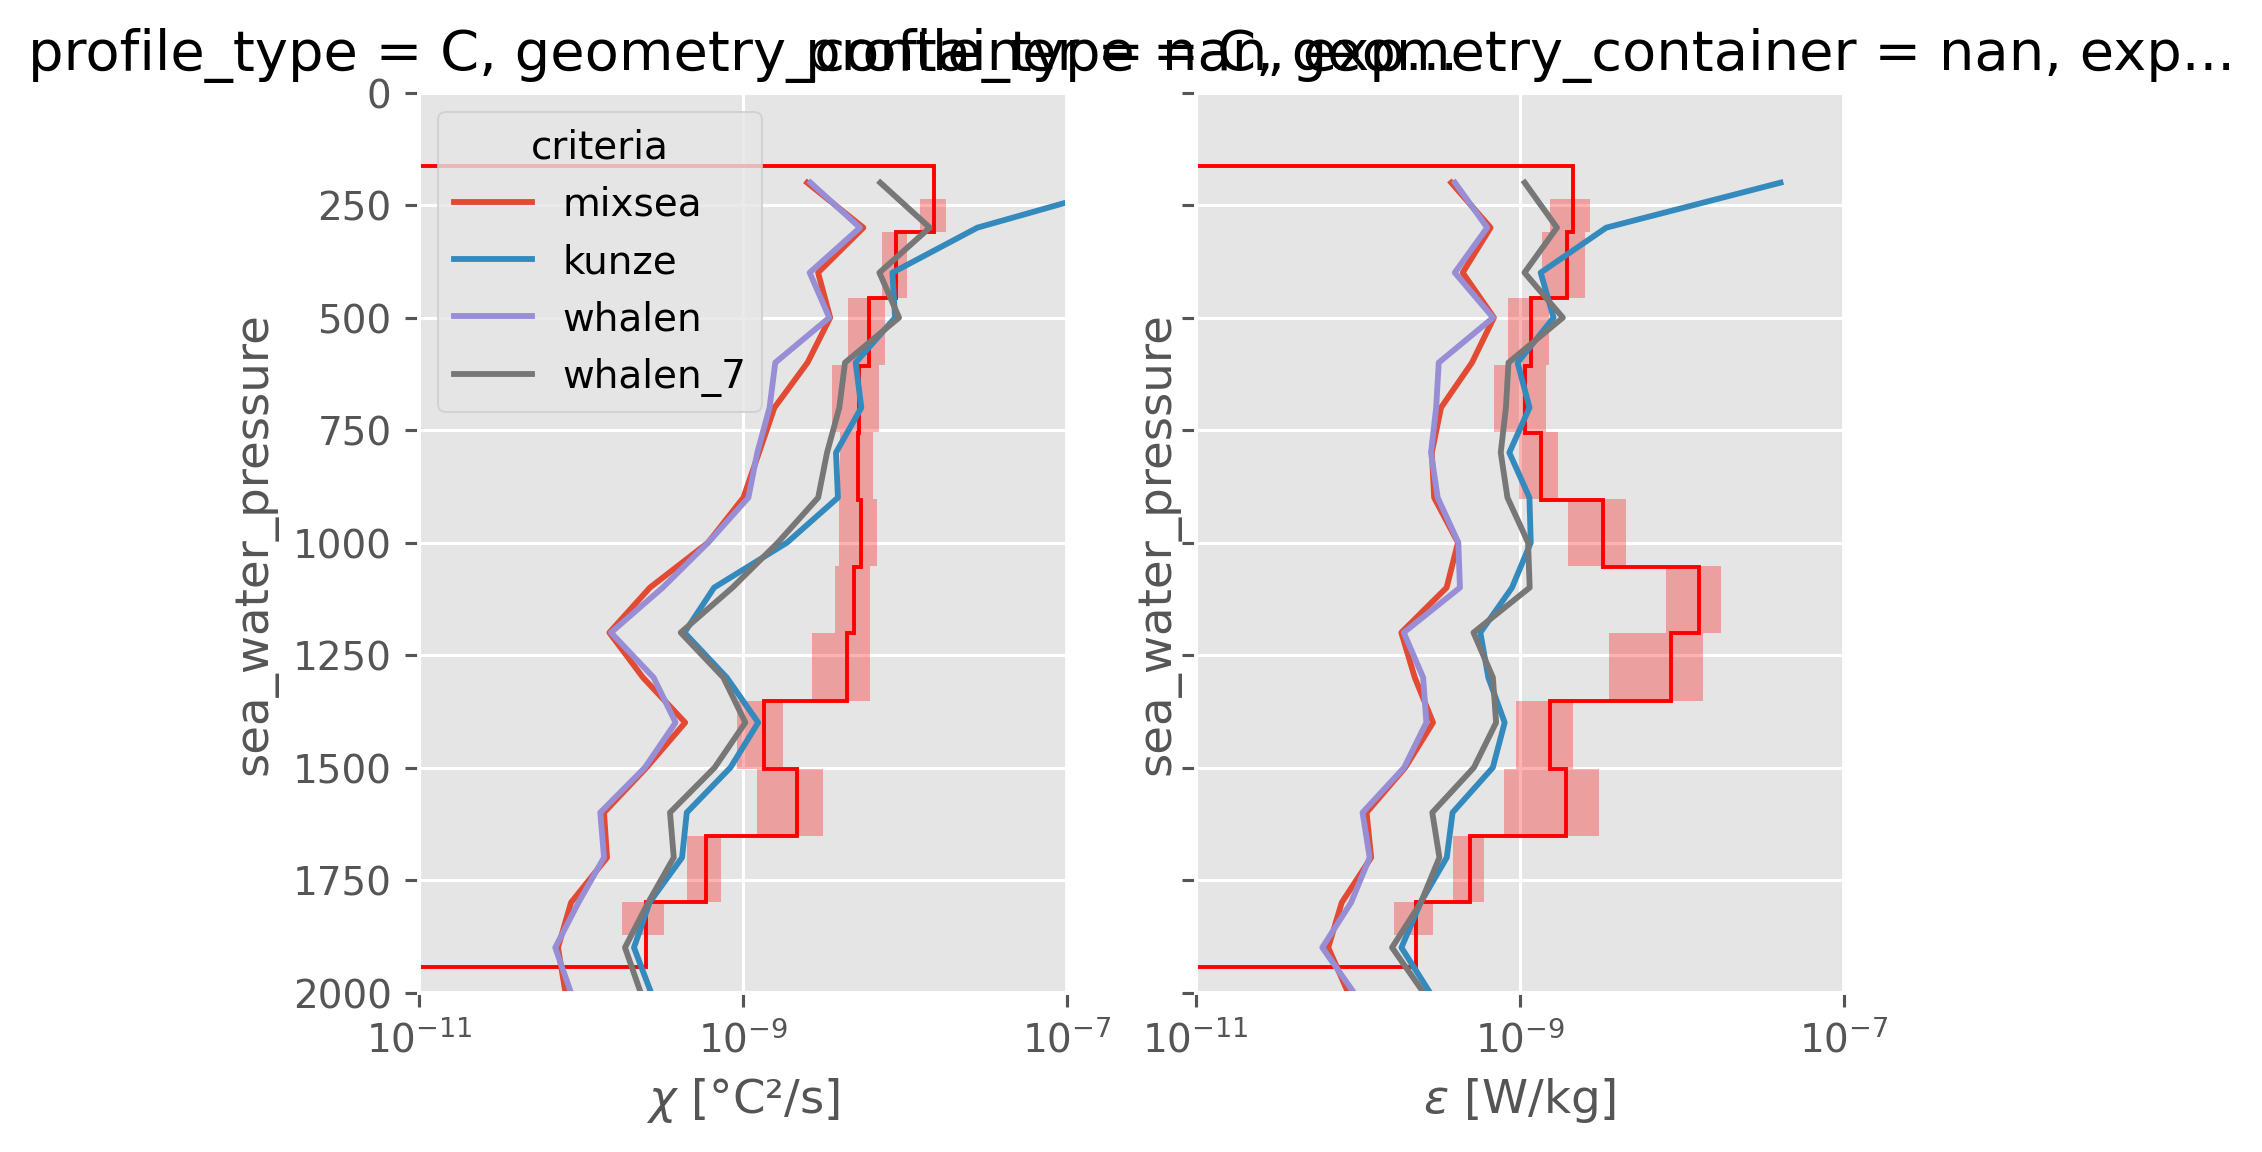
CTD-χpod vs finescale estimates#
fine = subset["finescale"].ds.cf.mean("profile_id")
f, ax = plt.subplots(1, 2, sharex=True, sharey=True, constrained_layout=True)
dcpy.plots.fill_between_bounds(avg, "chi", y="pres", color="r", ax=ax[0])
fine.chi.cf.plot(y="Z", hue="criteria", ax=ax[0])
dcpy.plots.fill_between_bounds(avg, "eps", y="pres", color="r", ax=ax[1])
fine.eps.cf.plot(y="Z", hue="criteria", ax=ax[1], add_legend=False)
plt.xscale("log")
plt.xlim((1e-11, 1e-7))
plt.ylim((2000, 0))
(2000.0, 0.0)
dcpy.plots.fill_between_bounds(avg, "chib2", y="pres")
# dcpy.plots.fill_between_bounds(avg, "KρTz2", y="pres")
dcpy.plots.fill_between_bounds(avg, "KtTzTz", y="pres")
# dcpy.plots.fill_between_bounds(micro, "wTTz", y="pres")
plt.xlim([1e-12, 1e-7])
plt.xscale("log")
Debugging plots for filtering#
natre = ed.natre.read_natre().load()
import panel.widgets as pnw
cast = subset.isel(cast=30)
coarsened = (
cast[["chi", "CT"]]
.coarsen(pressure=4, boundary="trim")
.construct({"pressure": ("p", "window")})
)
coarsened["p"] = coarsened.pressure.mean("window")
coarsened["window"] = np.arange(coarsened.sizes["window"])
coarsened["Tz"] = (
coarsened.CT.polyfit("window", deg=1).sel(degree=1).polyfit_coefficients
)
cast.CT.cf.differentiate("Z", positive_upward=True).plot(lw=1)
(-1 * coarsened.Tz).plot(lw=1, yscale="log")
/Users/dcherian/work/python/xarray/xarray/core/nputils.py:169: RankWarning: Polyfit may be poorly conditioned
warn_on_deficient_rank(rank, x.shape[1])
[<matplotlib.lines.Line2D at 0x18a8bcfa0>]
coarsened["KtTz"] = coarsened.chi.mean("window") / (-1 * coarsened.Tz)
cast.KtTz.rolling(pressure=4, center=True).mean().plot(lw=1)
coarsened.KtTz.plot(yscale="log", lw=1)
[<matplotlib.lines.Line2D at 0x18a86f3d0>]
import panel.widgets as pnw
subset.KtTz.interactive.coarsen(
pressure=pnw.IntSlider(start=1, end=50), boundary="trim"
).mean().hvplot(**profile_hvplot_kwargs, xlim=(1e-11, 1e-5))
Tz = (
sortlo100.cf.differentiate("Z", positive_upward=True).hvplot.line(
y="pressure", color="k"
)
# * unsorted.CT.hvplot.line(y="pressure")
* sortlo.cf.differentiate("Z", positive_upward=True).hvplot.line(
y="pressure", color="r"
)
* chi.CT.cf.differentiate("Z", positive_upward=True)
.sel(direction="dn")
.hvplot.line(y="pressure", color="green")
* clean["Tz~"]
.cf.interpolate_na("Z")
.sel(direction="dn")
.hvplot.line(y="pressure", color="cyan")
) # .opts(ylim=(1500, 600), frame_width=600, frame_height=400)
KtTz = chi.KtTz.sel(direction="dn").hvplot.line(y="pressure", color="green") * clean[
"KtTz~"
].cf.interpolate_na("Z").sel(direction="dn").hvplot.line(y="pressure", color="cyan")
import xfilter
unsorted = subset["ctd"].ds[["CT", "gamma_n"]].reset_coords(drop=True)
sort = dcpy.oceans.thorpesort(unsorted, by="gamma_n")
sortlo = xfilter.lowpass(sort.CT, coord="pressure", freq=1 / 10)
sortlo100 = xfilter.lowpass(sort.CT, coord="pressure", freq=1 / 150)
T = (
sortlo100.hvplot.line(y="pressure", color="k")
# * unsorted.CT.hvplot.line(y="pressure")
* sortlo.hvplot.line(y="pressure", color="r")
* chi.CT.sel(direction="dn").hvplot.line(y="pressure", color="green")
* clean["T~"].sel(direction="dn").hvplot.line(y="pressure", color="cyan")
# * sort.CT.hvplot.line(y="pressure", ylim=(2000, 0))
) # .opts(ylim=(1500, 600), frame_width=600, frame_height=400)
(
T.opts(ylim=(1500, 600), xlim=(4.5, 10.5), width=200, height=400)
+ Tz.opts(ylim=(1500, 600), xlim=(-1e-2, 2e-2), width=200, height=400)
+ KtTz.opts(xlim=(-100e-8, 100e-8), width=400, height=400, ylim=(1500, 600))
)
Initial exploration#
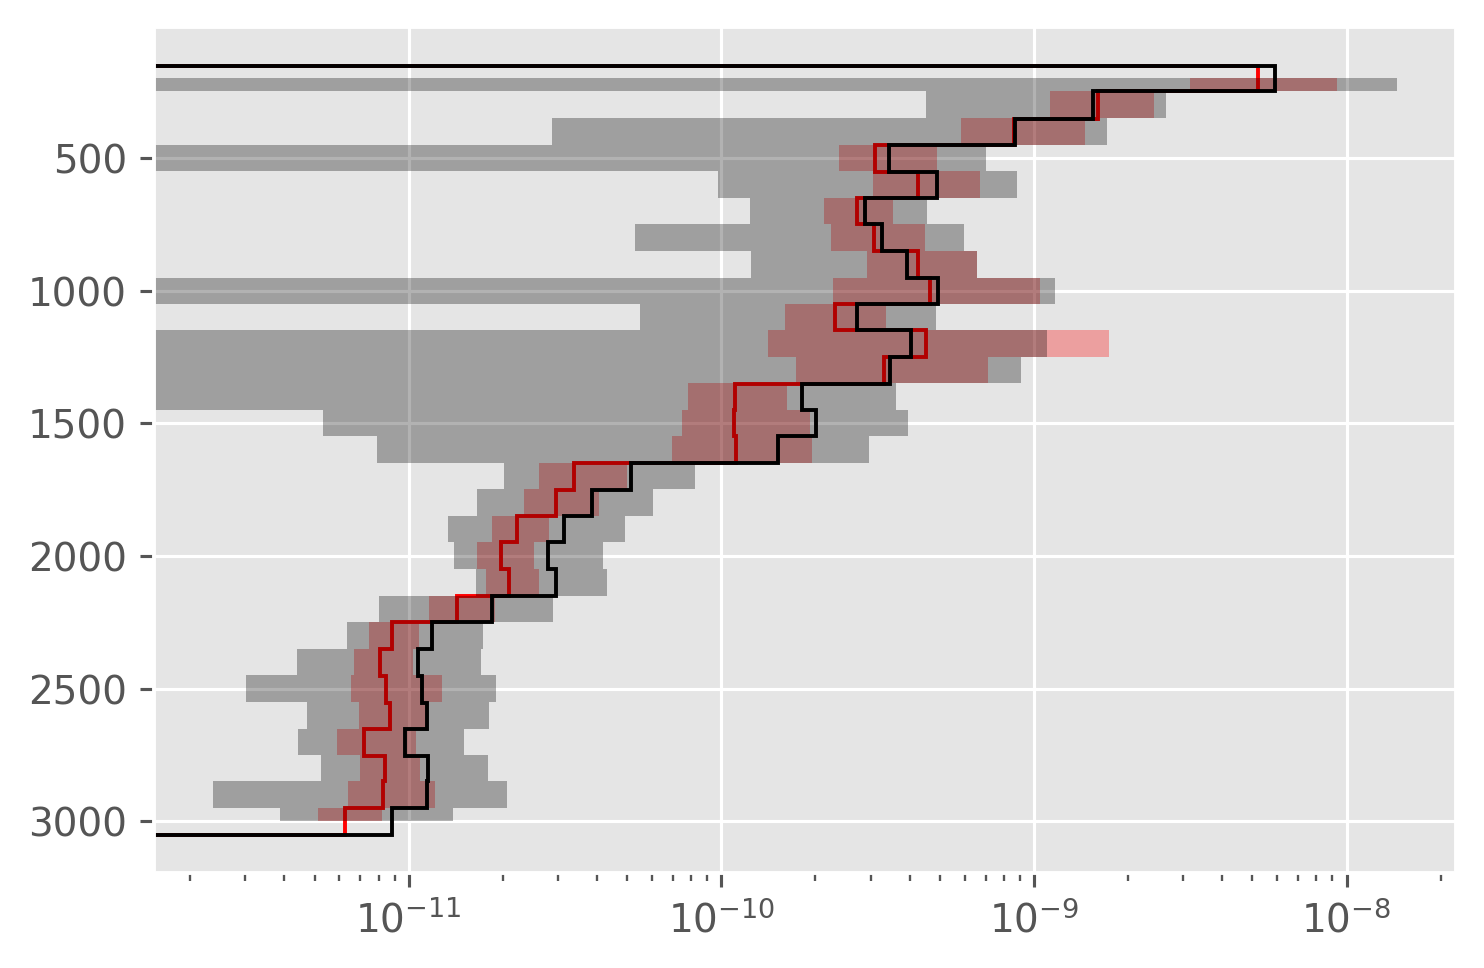
χ error bounds are big!#
Order of magnitude! that’s crazy
Note: The red line in the figure is from before dropping cast 131
avg_older = xr.load_dataset("../datasets/ctd-A05-density-binned.nc")
# avg = xr.load_dataset("../datasets/ctd-A05-density-binned-no-cast-131.nc")
Are there any suspicious profiles?
Cast 131 looks v. suspicious; BUT there’s a funky T-S signal too. I think this cast samples an eddy
Cast 133 is a solid maybe
Cast 138 at 3500ish m though this coule just be a shallow bottom / seamount type thing
(
a05.sel(cast=slice(120, 138))
.chi.reset_coords(drop=True)
.hvplot.line(**profile_hvplot_kwargs)
)
Buoyancy reynolds number#
definitely something to fix but not going to change the picture.
subset = a05.sel(cast=slice(110, 129))
subset = dcpy.oceans.thorpesort(subset, "gamma_n", core_dim="pressure")
subset.load()
<xarray.Dataset>
Dimensions: (cast: 20, pressure: 3001, sensor: 2)
Coordinates:
* pressure (pressure) float64 0.0 2.0 4.0 ... 5.996e+03 5.998e+03 6e+03
* cast (cast) int64 110 111 112 113 114 115 ... 125 126 127 128 129
num_sensors (cast) uint8 2 2 2 2 2 2 2 2 2 2 2 2 2 2 2 2 1 1 2 2
avail_sensors (cast, sensor) uint16 2013 2016 2013 2016 ... 2016 2013 2016
datenum (cast) float64 7.363e+05 7.363e+05 ... 7.363e+05 7.363e+05
pressure_bins (pressure) object nan (1.0, 3.0] ... (5997.0, 5999.0] nan
latitude (cast) float64 24.5 24.5 24.5 24.5 ... 24.5 24.71 24.92 25.13
longitude (cast) float64 -33.64 -33.0 -32.37 ... -22.88 -22.27 -21.65
time (cast) datetime64[ns] 2016-01-09T20:51:00 ... 2016-01-17T0...
expocode (cast) object '74EQ20151206' ... '74EQ20151206'
bottom_depth (pressure, cast) float64 nan nan nan nan ... nan nan nan nan
Dimensions without coordinates: sensor
Data variables: (12/17)
eps (cast, pressure) float64 nan nan nan nan ... nan nan nan nan
chi (cast, pressure) float64 nan nan nan nan ... nan nan nan nan
KT (cast, pressure) float64 nan nan nan nan ... nan nan nan nan
temp (cast, pressure) float64 nan 23.48 23.48 ... nan nan nan
salt (cast, pressure) float64 nan 37.2 37.21 37.21 ... nan nan nan
gamma_n (cast, pressure) float64 nan 25.48 25.48 ... nan nan nan
... ...
chi_masked (cast, pressure) float64 nan nan nan nan ... nan nan nan nan
Krho (cast, pressure) float64 nan nan nan nan ... nan nan nan nan
KrhoTz (cast, pressure) float64 nan nan nan nan ... nan nan nan nan
eps_chi (cast, pressure) float64 nan nan nan nan ... nan nan nan nan
Kt (cast, pressure) float64 nan nan nan nan ... nan nan nan nan
KtTz (cast, pressure) float64 nan nan nan nan ... nan nan nan nansubset["ν"] = dcpy.oceans.visc(subset.salt, subset.temp, subset.pressure)
Reb = subset.eps / subset.ν / subset.N2
Reb.attrs["long_name"] = "$ε/νN^2$"
del Reb.attrs["units"]
%matplotlib widget
Reb.cf.plot(norm=mpl.colors.LogNorm(1, 200 / 0.8), center=16, cmap=cmo.cm.balance)
<matplotlib.collections.QuadMesh at 0x17ae122b0>
%matplotlib widget
kwargs = dict(density=True, histtype="step", lw=2, bins=np.linspace(-2, 6, 101))
np.log10(Reb).cf.sel(Z=slice(0, 1000)).plot.hist(**kwargs)
np.log10(Reb).cf.sel(Z=slice(1000, 2000)).plot.hist(**kwargs)
np.log10(Reb).cf.sel(Z=slice(2000, 3000)).plot.hist(**kwargs)
np.log10(Reb).cf.sel(Z=slice(3000, 4000)).plot.hist(**kwargs)
np.log10(Reb).cf.sel(Z=slice(4000, 5000)).plot.hist(**kwargs)
dcpy.plots.linex(np.log10([16, 200]), zorder=2, color="k")
plt.legend(["0-1000", "1000-2000", "2000-3000", "3000-4000", "4000-5000"])
/Users/dcherian/work/python/xarray/xarray/core/computation.py:734: RuntimeWarning: invalid value encountered in log10
result_data = func(*input_data)
/Users/dcherian/work/python/xarray/xarray/core/computation.py:734: RuntimeWarning: invalid value encountered in log10
result_data = func(*input_data)
/Users/dcherian/work/python/xarray/xarray/core/computation.py:734: RuntimeWarning: invalid value encountered in log10
result_data = func(*input_data)
/Users/dcherian/work/python/xarray/xarray/core/computation.py:734: RuntimeWarning: invalid value encountered in log10
result_data = func(*input_data)
/Users/dcherian/work/python/xarray/xarray/core/computation.py:734: RuntimeWarning: invalid value encountered in log10
result_data = func(*input_data)
<matplotlib.legend.Legend at 0x17d16de50>
subset["κ"] = dcpy.oceans.tdif(subset.salt, subset.temp, subset.pressure)
subset["χmol"] = 2 * subset.κ * subset.Tz**2
_, bins, _ = np.log10(subset.χmol + subset.chi).plot.hist(
bins=101, histtype="step", density=True, lw=2, aspect=3, size=3
)
np.log10(subset.chi).plot.hist(bins=bins, histtype="step", density=True, lw=2)
plt.legend(["χmol + χ", "χ"])
<matplotlib.legend.Legend at 0x17a2623d0>
plt.figure()
_, bins, _ = np.log10(subset.KT).plot.hist(bins=100, histtype="step", lw=2)
np.log10(subset.KT + subset.κ).plot.hist(bins=bins, histtype="step", lw=2);
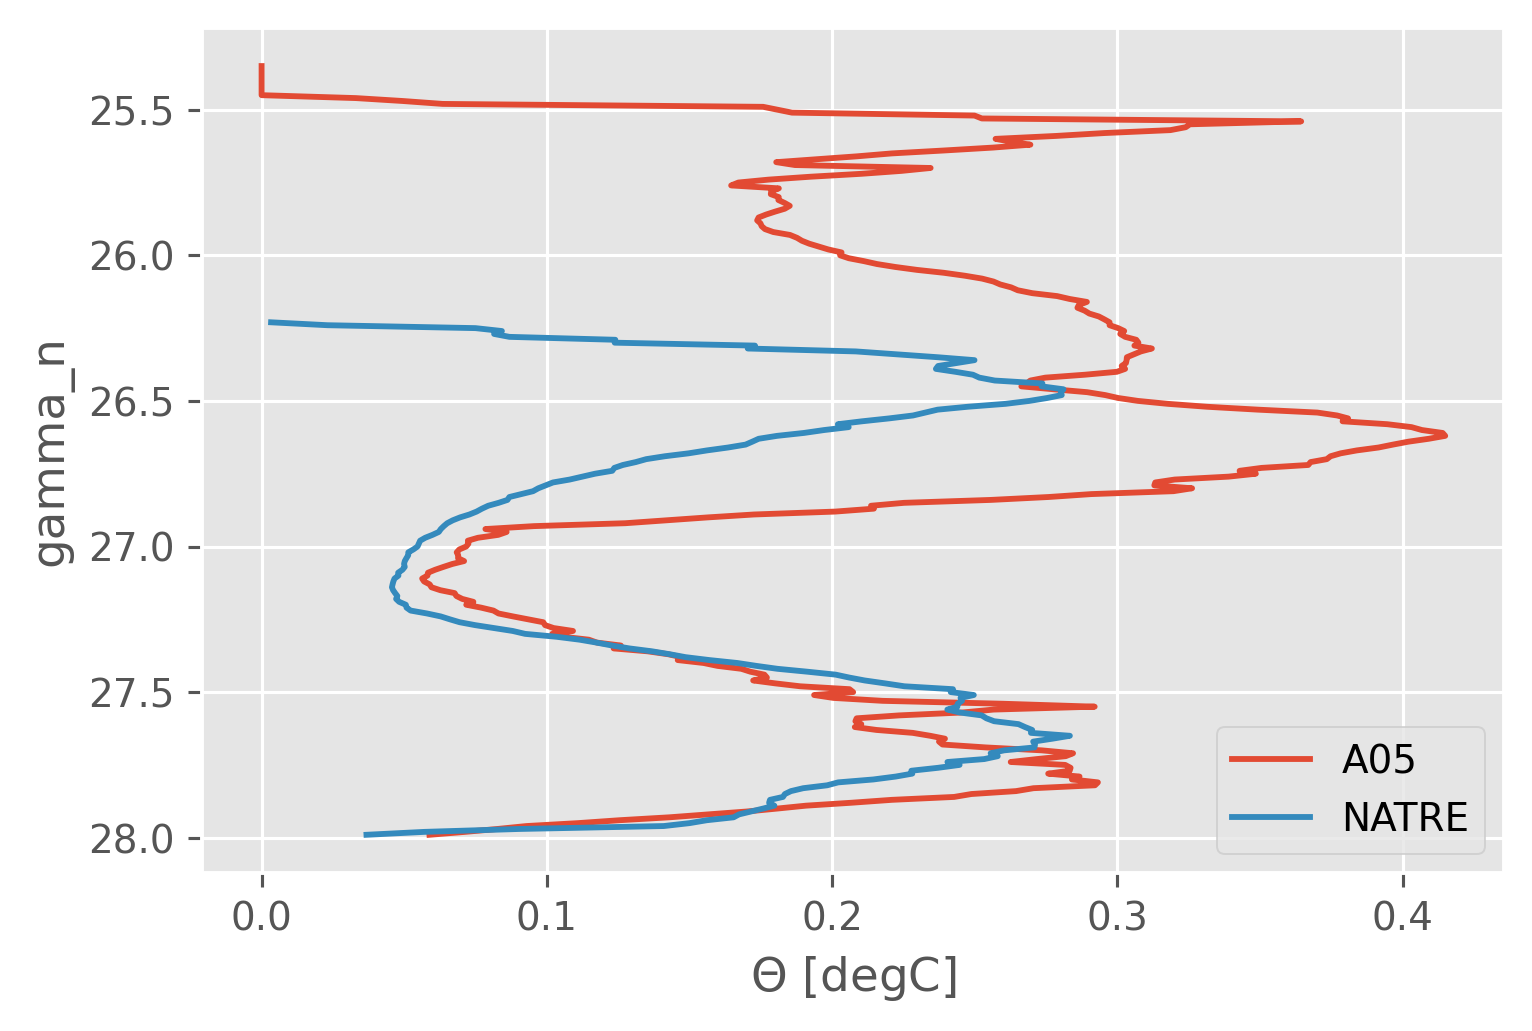
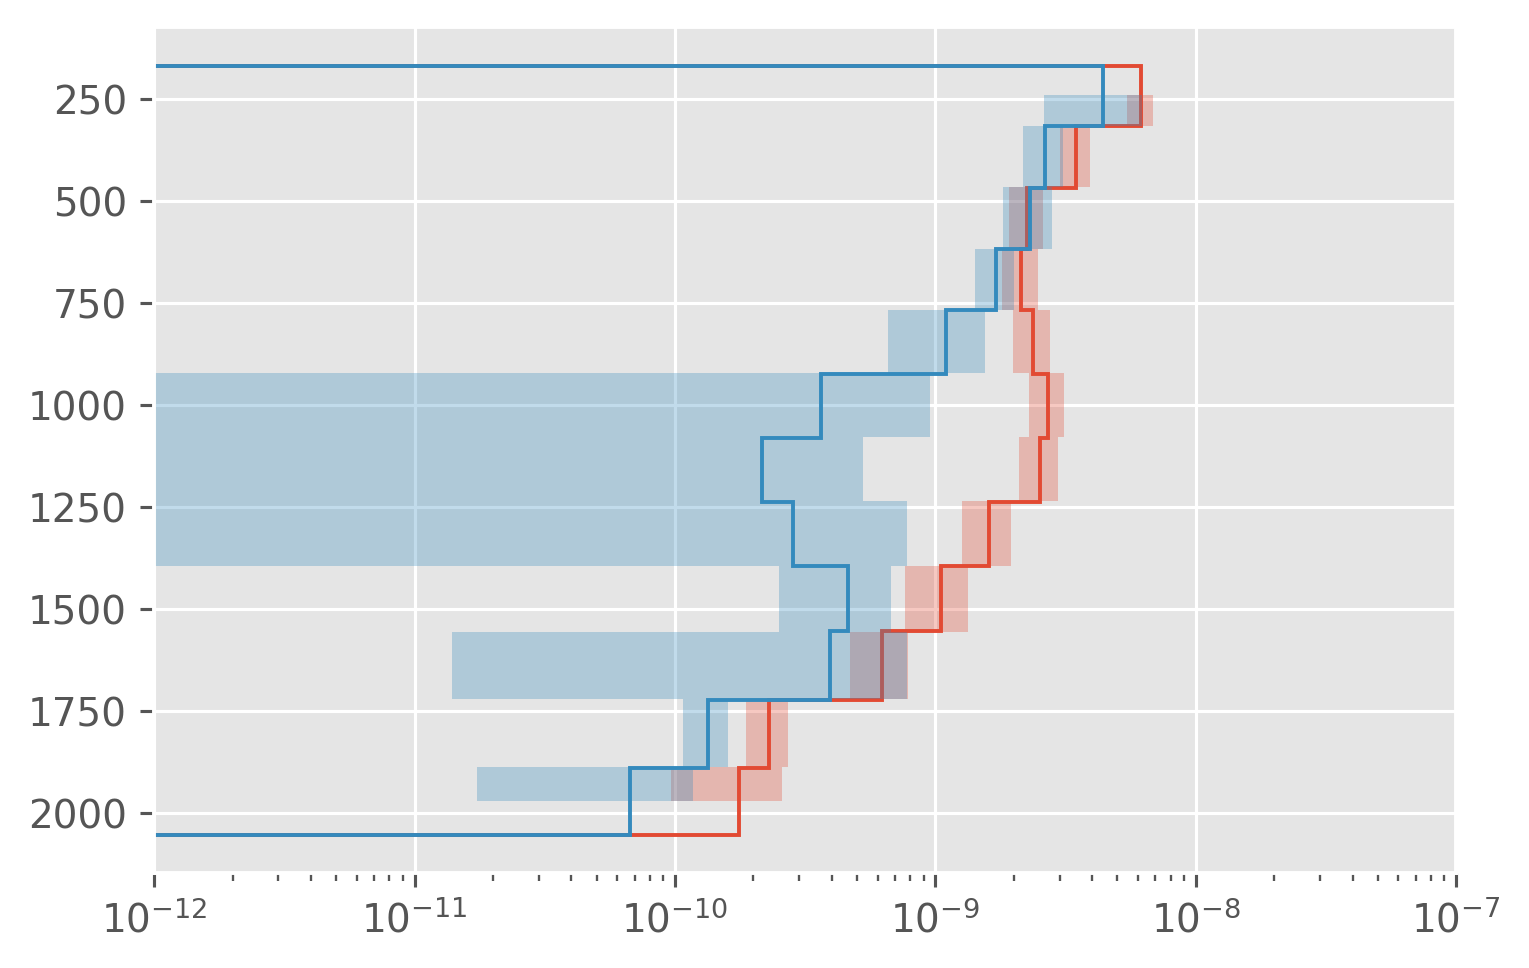
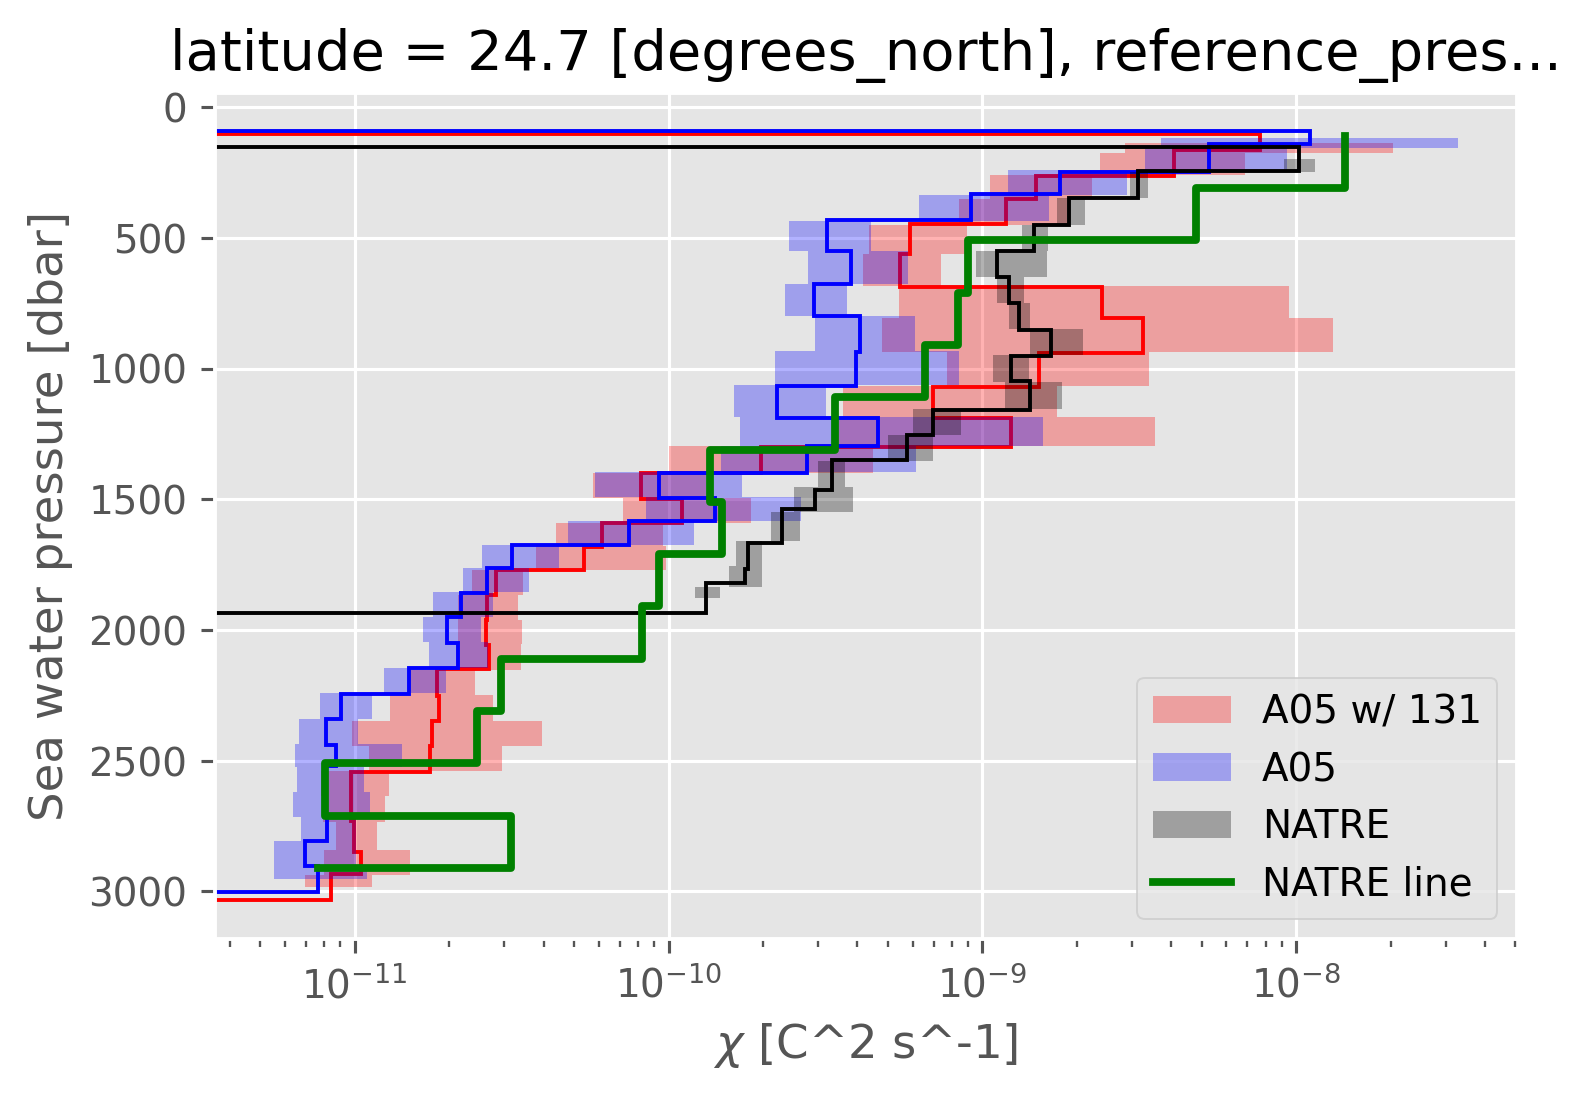
NATRE vs A05#
A05 looks noisy! much more low values (exactly like in the histograms)
kwargs = dict(
ylim=(2000, 0),
logx=True,
muted_alpha=0,
line_width=0.5,
aspect=1 / 2,
frame_width=250,
xlim=(1e-12, 1e-6),
grid=True,
)
a05_casts = subset.chi.hvplot.line(by="cast", y="pressure", title="A05", **kwargs)
natre_casts = natre.chi.hvplot(y="pres", by="longitude", title="NATRE", **kwargs)
(a05_casts + natre_casts).opts(title="")
NATRE along the 24.7 line is lower than the experiment mean. Which is interesting. A05 could have missed the signal, but how can we tell for sure?
There is T-S spread.
Higher χ values are to the east
natre_line = natre.sel(latitude=subset.latitude.mean().data, method="nearest").mean(
"longitude"
)
dcpy.plots.fill_between_bounds(
avg_older, "chib2", y="pres", color="r", label="A05 w/ 131"
)
dcpy.plots.fill_between_bounds(avg, "chib2", y="pres", color="b", label="A05")
dcpy.plots.fill_between_bounds(
natre_binned, "chib2", y="pres", color="k", label="NATRE"
)
(natre_line.chi / 2).cf.coarsen(Z=100, boundary="trim").mean().cf.plot.step(
lw=2, color="g", label="NATRE line"
)
plt.legend()
plt.xscale("log")
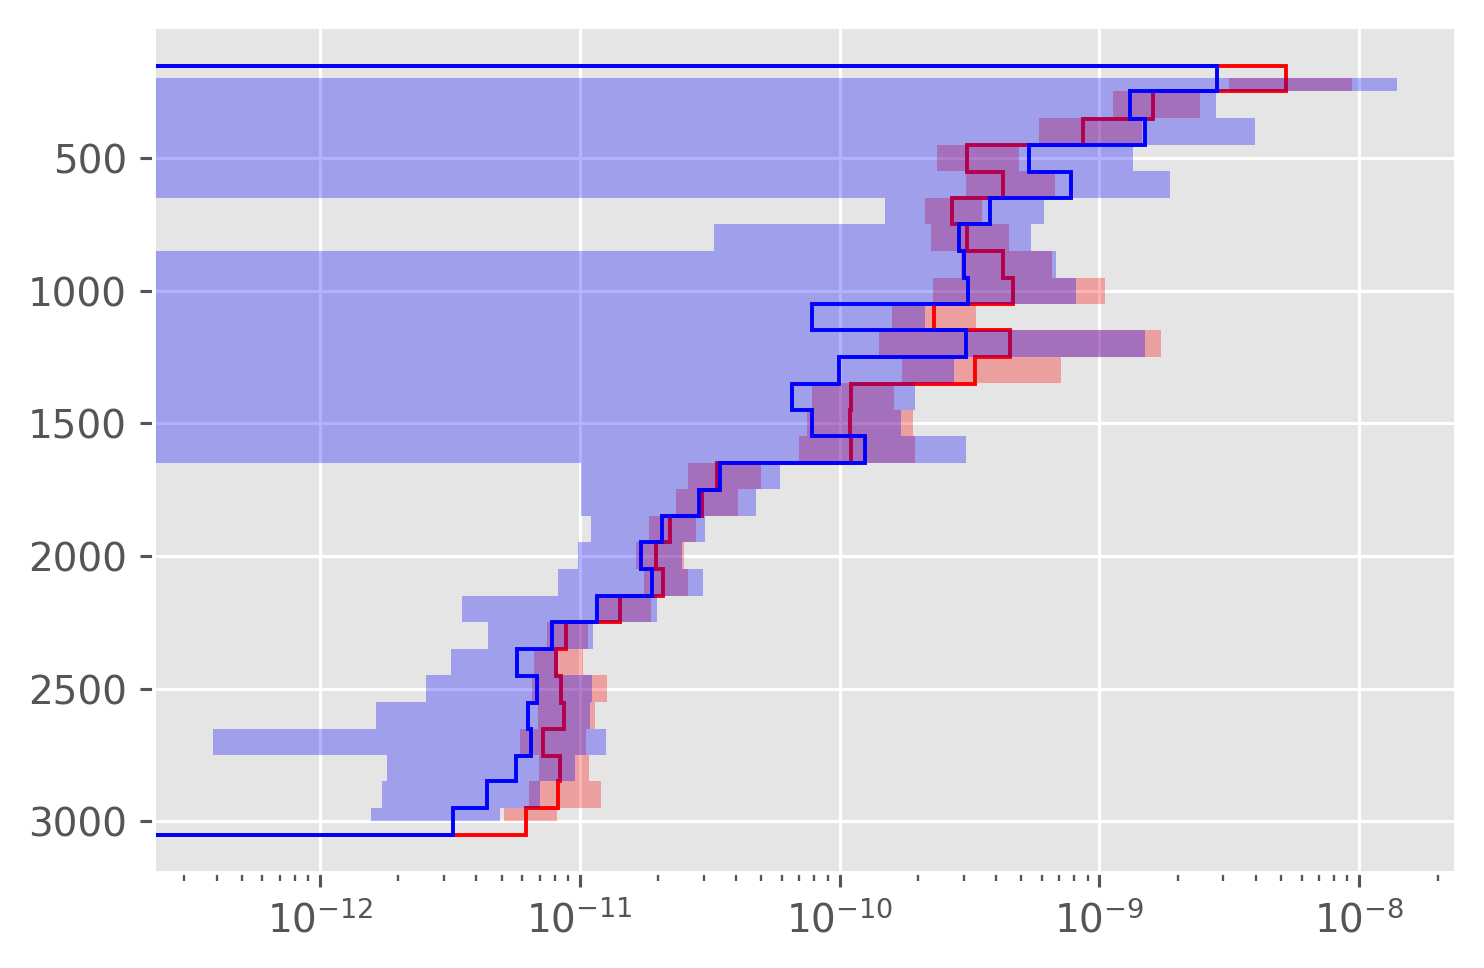
Using \(K_ρ (T_z^m)^2\)#
Note this doesn’t work so well. But is entirely consistent with an equivalent effort using \(⟨ε_χ⟩\) estimated from the NATRE experiment.
dcpy.plots.fill_between_bounds(avg, "chib2", y="pres", color="r")
plt.xscale("log")
dcpy.plots.fill_between_bounds(avg, "KρTz2", y="pres", color="k")
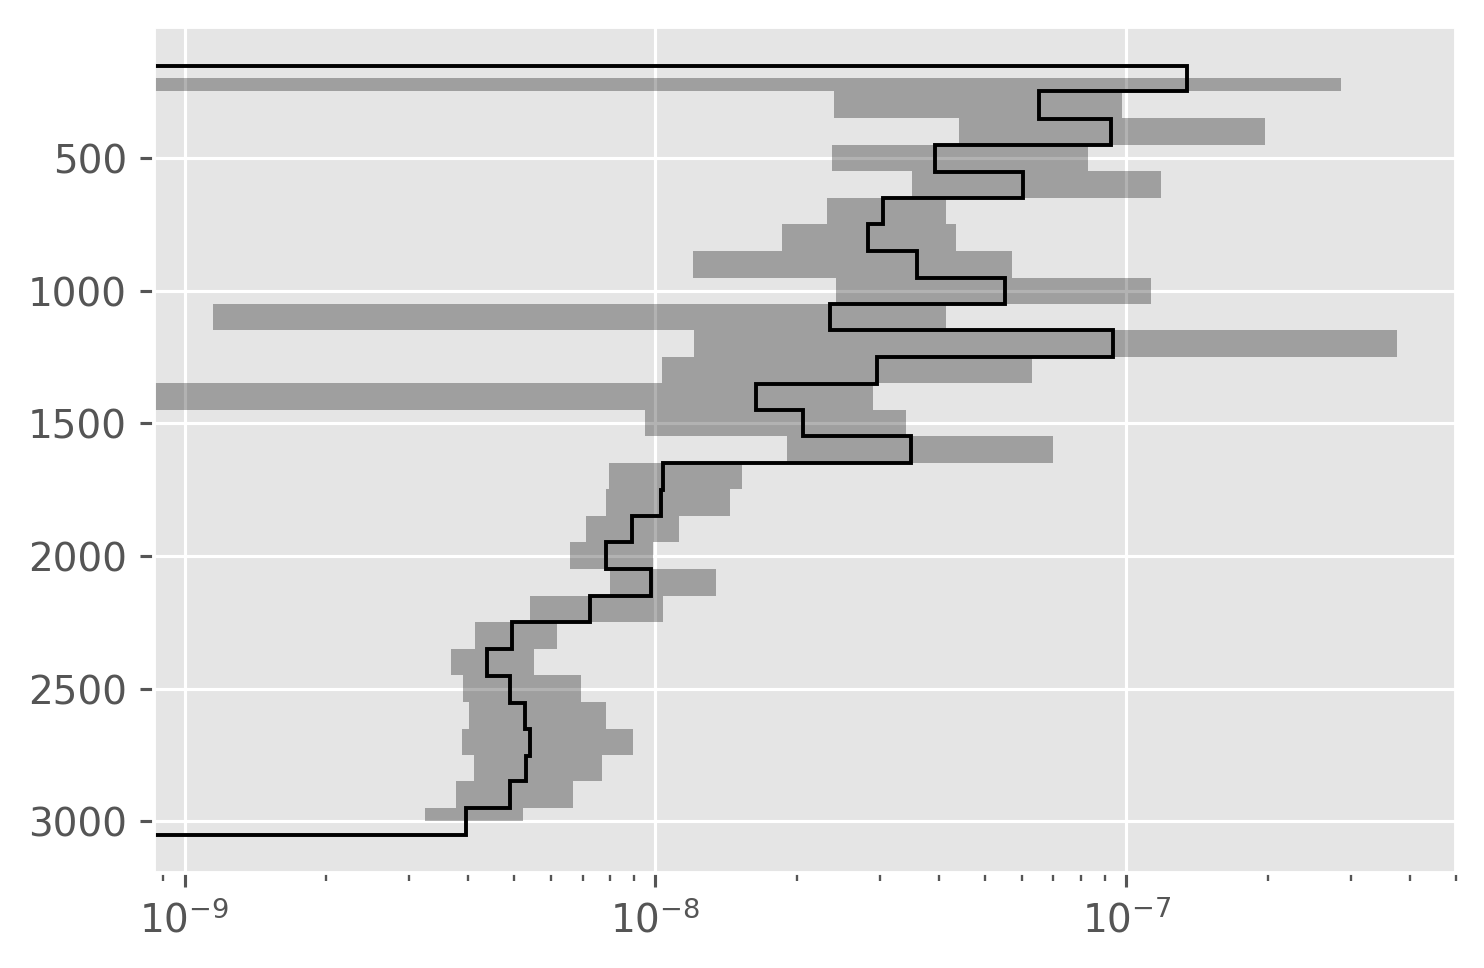
Now with \(⟨K_T θ_z⟩ T_z^m\)#
dcpy.plots.fill_between_bounds(avg, "KtTz", y="pres", color="k")
plt.xscale("log")
Compare all three#
Large error bars relative to NATRE microstructure.
dcpy.plots.fill_between_bounds(avg, "chib2", y="pres", color="r")
plt.xscale("log")
# dcpy.plots.fill_between_bounds(avg, "KρTz2", y="pres", color="k")
dcpy.plots.fill_between_bounds(avg, "KtTzTz", y="pres", color="b")
EKE#
natre = ed.natre.read_natre()
natre_eke = ed.sections.compute_eke(natre).load()
eke = ed.sections.compute_eke(a05).load()
eke["longitude"] = eke.longitude - 360
eke
/Users/dcherian/work/python/flox/flox/aggregations.py:201: RuntimeWarning: invalid value encountered in true_divide
finalize=lambda sum_, count: sum_ / count,
<xarray.Dataset>
Dimensions: (cast: 143)
Coordinates:
latitude (cast) float64 27.0 27.0 27.0 27.01 ... 27.63 27.79 27.87 27.91
longitude (cast) float64 -80.0 -79.97 -79.94 ... -13.78 -13.55 -13.41
* cast (cast) int64 2 3 4 5 6 7 8 9 ... 137 138 139 140 141 142 143 144
Data variables:
cruise (cast) float64 nan nan nan ... 0.003176 0.003215 0.001441
monthly (cast) float64 nan nan nan ... 0.001937 0.001751 0.001637
clim (cast) float64 nan nan nan ... 0.002136 0.001868 0.001776aviso = (
xr.open_dataset(os.path.expanduser("~/datasets/aviso_monthly.zarr"))
.sel(time="2015-12")
.squeeze()
)
/Users/dcherian/work/python/xarray/xarray/backends/plugins.py:117: RuntimeWarning: 'netcdf4' fails while guessing
warnings.warn(f"{engine!r} fails while guessing", RuntimeWarning)
/Users/dcherian/work/python/xarray/xarray/backends/plugins.py:117: RuntimeWarning: 'h5netcdf' fails while guessing
warnings.warn(f"{engine!r} fails while guessing", RuntimeWarning)
/Users/dcherian/work/python/xarray/xarray/backends/plugins.py:117: RuntimeWarning: 'scipy' fails while guessing
warnings.warn(f"{engine!r} fails while guessing", RuntimeWarning)
plt.figure()
aviso.sla.sel(latitude=slice(20, 30), longitude=slice(360 - 80, 360)).plot(
robust=True, cmap=mpl.cm.turbo
)
plt.plot(360 + a05.longitude, a05.latitude)
[<matplotlib.lines.Line2D at 0x182d42ac0>]
plt.figure()
eke.to_array().plot(x="longitude", hue="variable")
# natre_eke.mean("latitude").to_array().plot(hue="variable")
[<matplotlib.lines.Line2D at 0x1834ba790>,
<matplotlib.lines.Line2D at 0x1834ba7f0>,
<matplotlib.lines.Line2D at 0x1834ba910>]
Isopycnal gridding#
grid = xgcm.Grid(a05, periodic=False)
grid
<xgcm.Grid>
Z Axis (not periodic, boundary=None):
* center pressure
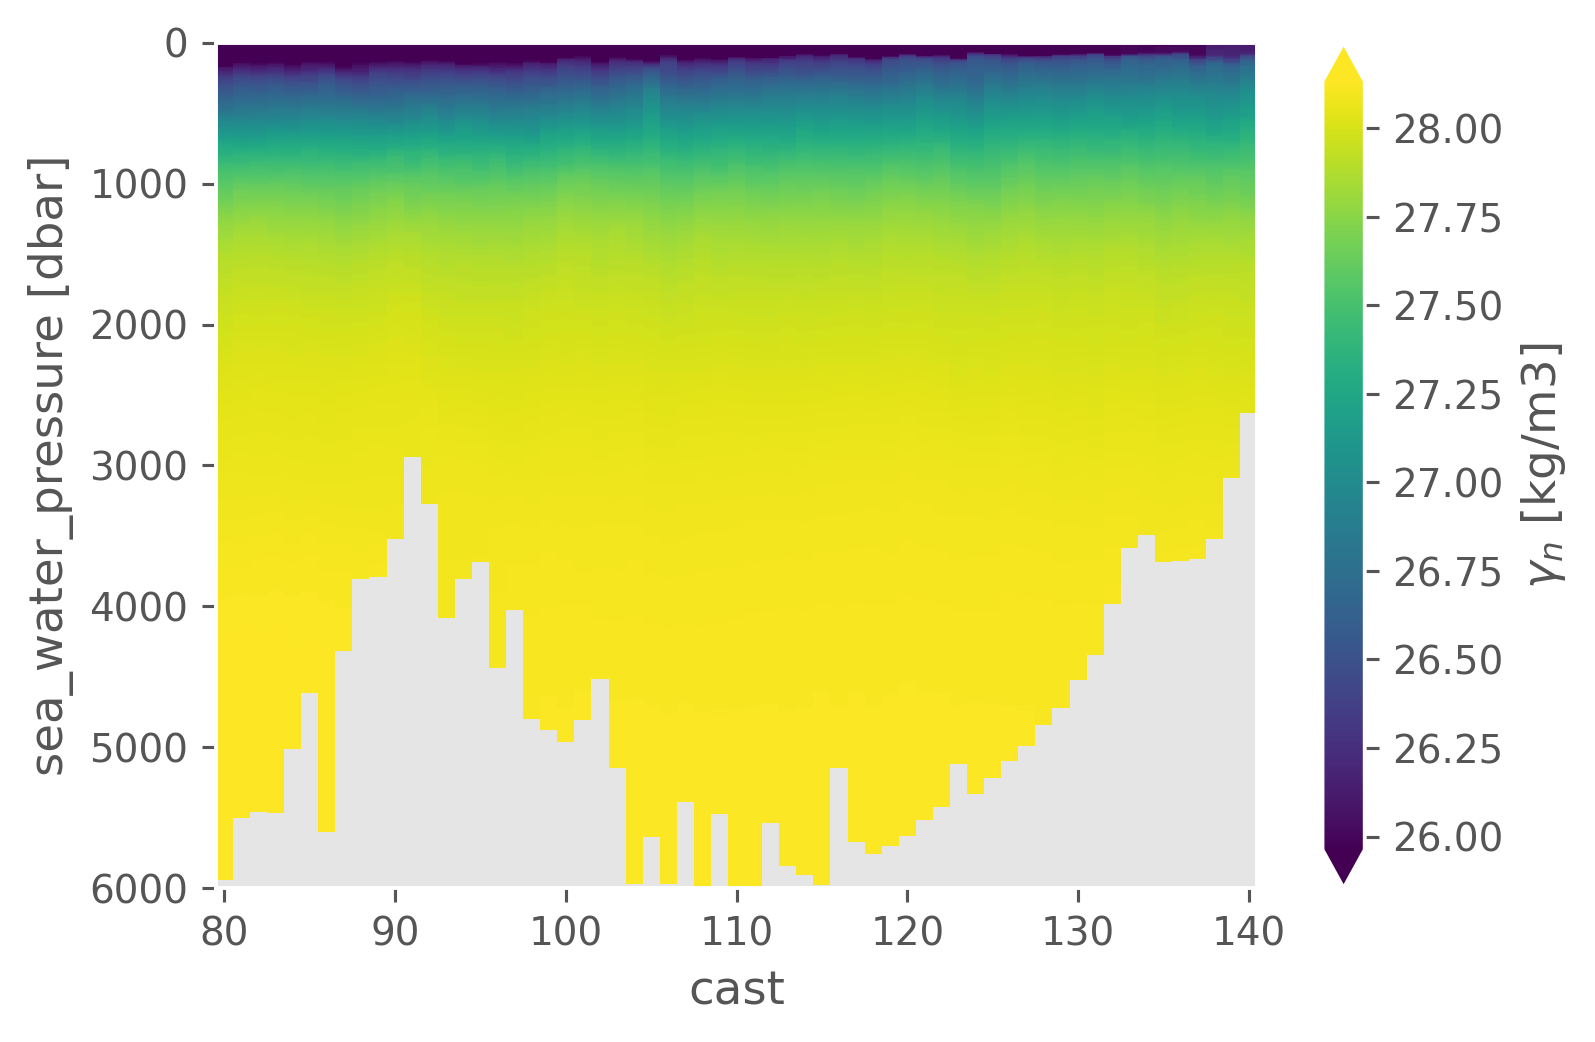
a05.gamma_n.sel(cast=slice(80, 140)).cf.plot(x="cast", robust=True)
<matplotlib.collections.QuadMesh at 0x177df1040>
Along-isopycnal std#
iso = xr.Dataset()
kwargs = dict(axis="Z", target=np.arange(24, 28, 0.01), target_data=a05.gamma_n)
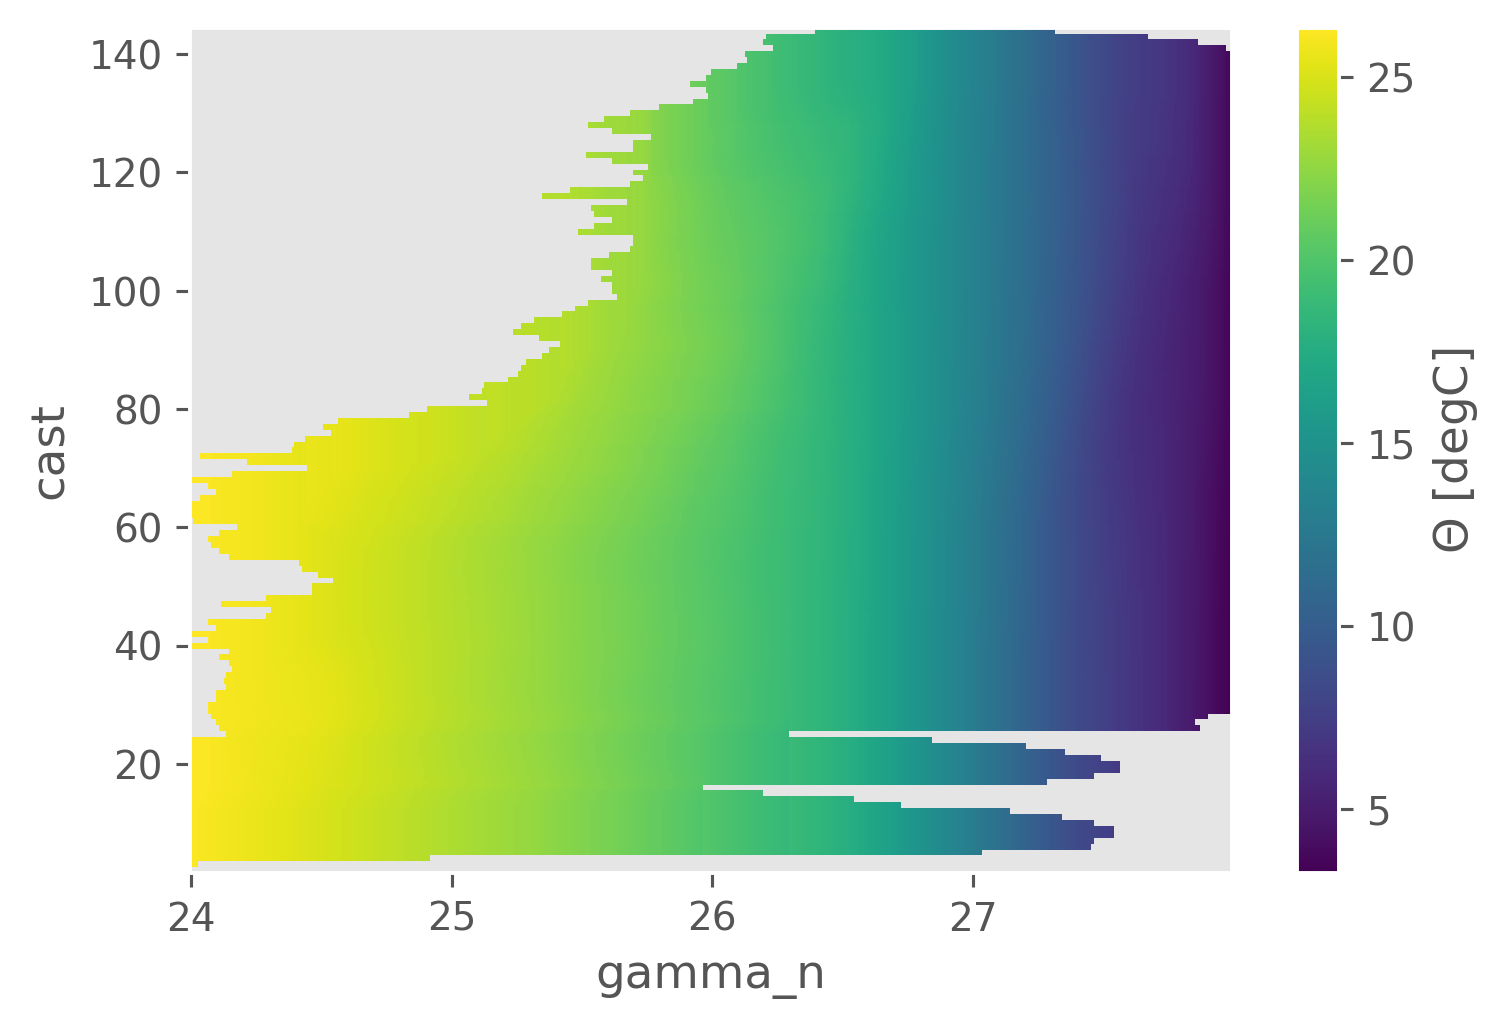
iso["CT"] = grid.transform(a05.CT, **kwargs)
iso["SA"] = grid.transform(a05.SA, **kwargs)
iso.coords["pressure"] = grid.transform(
a05.pressure.broadcast_like(a05.gamma_n), **kwargs
)
iso["gamma_n"].attrs["axis"] = "Z"
iso["gamma_n"].attrs["positive"] = "down"
iso["cast"].attrs["cf_role"] = "profile_id"
isomean = (
iso.cf.rolling(profile_id=17, center=True)
.mean()
.cf.ffill("profile_id")
.cf.bfill("profile_id")
.where(iso.CT.notnull())
)
isomean.CT.plot()
<matplotlib.collections.QuadMesh at 0x193291250>
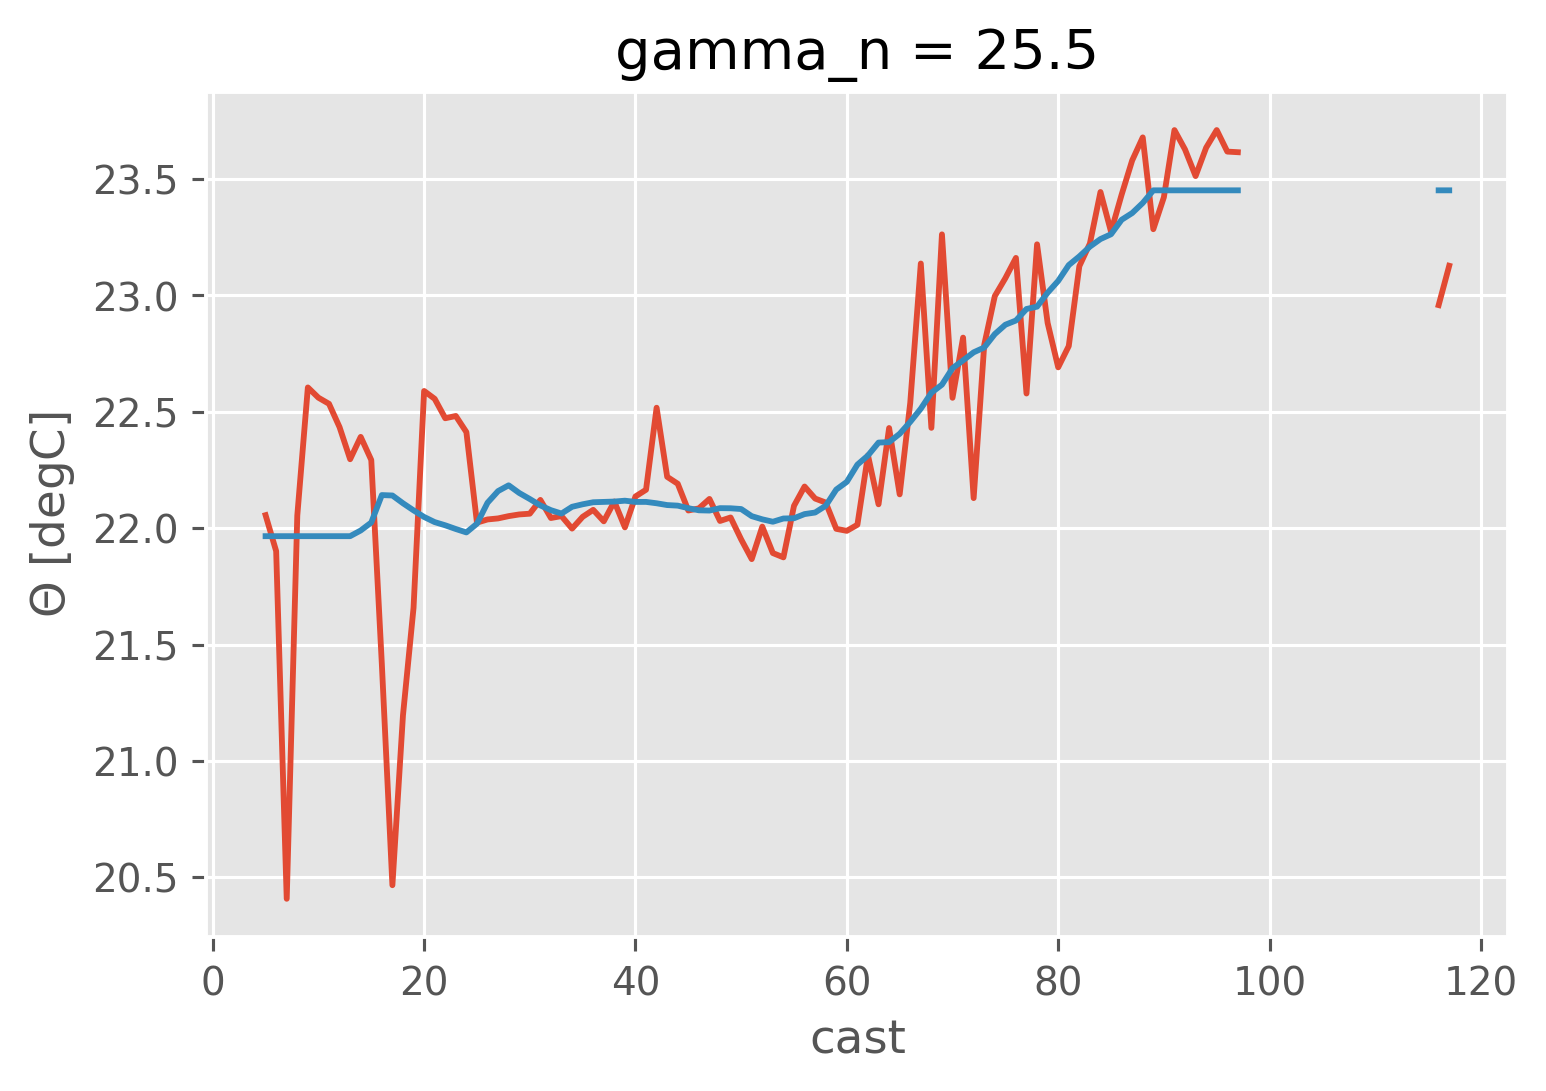
iso.CT.sel(gamma_n=25.5, method="nearest").plot()
isomean.CT.sel(gamma_n=25.5, method="nearest").plot()
[<matplotlib.lines.Line2D at 0x19334e9d0>]
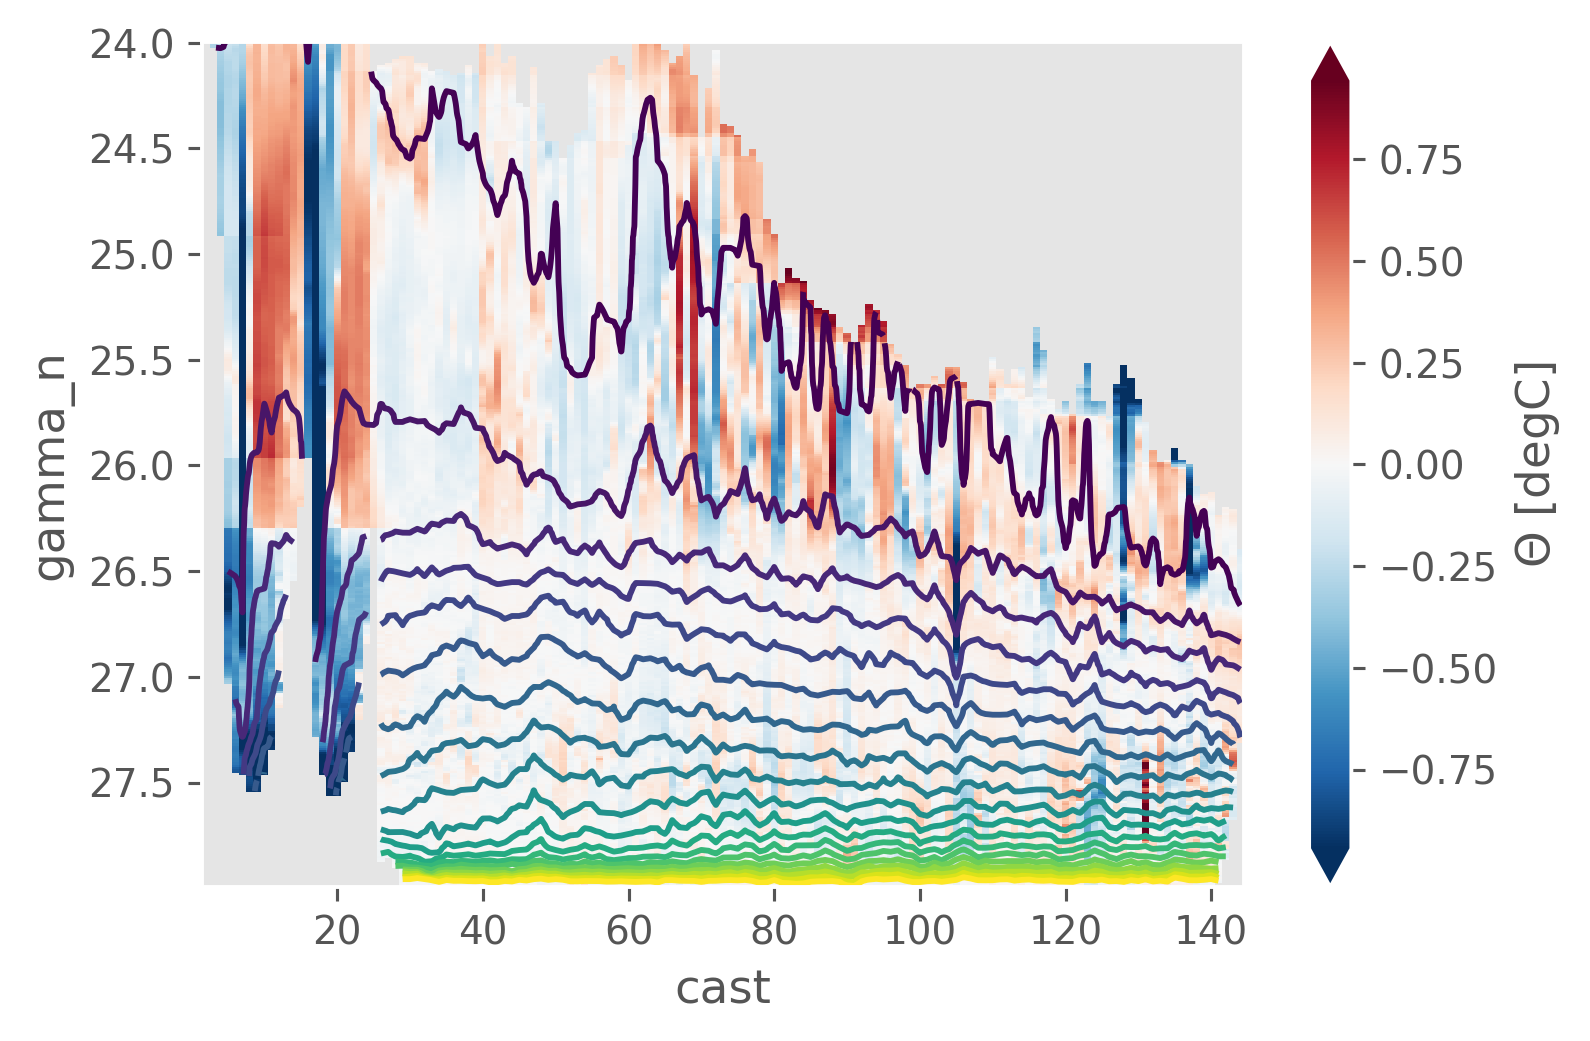
isoanom = iso - isomean
isoanom.CT.cf.plot(x="cast", robust=True)
isoanom.pressure.cf.plot.contour(x="cast", levels=np.arange(100, 2000, 100))
<matplotlib.contour.QuadContourSet at 0x19335abe0>
natre = ed.natre.read_natre().load()
natre
<xarray.Dataset>
Dimensions: (latitude: 10, longitude: 10, pres: 6180)
Coordinates:
* latitude (latitude) float64 27.5 27.1 26.7 26.3 ... 25.1 24.7 24.3 23.9
* longitude (longitude) float64 -30.7 -30.3 -29.8 ... -27.6 -27.2 -26.8
* pres (pres) float64 10.0 10.5 11.0 ... 3.098e+03 3.099e+03 3.1e+03
time (latitude, longitude) datetime64[ns] 1992-03-28T15:28:59.9999...
depth (latitude, longitude, pres) float64 nan nan nan ... nan nan nan
Data variables: (12/17)
chi (latitude, longitude, pres) float64 nan nan nan ... nan nan nan
eps (latitude, longitude, pres) float64 nan nan nan ... nan nan nan
salt (latitude, longitude, pres) float64 nan nan nan ... nan nan nan
temp (latitude, longitude, pres) float64 nan nan nan ... nan nan nan
gamma_n (latitude, longitude, pres) float64 nan nan nan ... nan nan nan
SA (latitude, longitude, pres) float64 nan nan nan ... nan nan nan
... ...
chi_masked (latitude, longitude, pres) float64 nan nan nan ... nan nan nan
Krho (latitude, longitude, pres) float64 nan nan nan ... nan nan nan
KrhoTz (latitude, longitude, pres) float64 nan nan nan ... nan nan nan
eps_chi (latitude, longitude, pres) float64 nan nan nan ... nan nan nan
Kt (latitude, longitude, pres) float64 nan nan nan ... nan nan nan
KtTz (latitude, longitude, pres) float64 nan nan nan ... nan nan nan
Attributes: (12/13)
Conventions: CF-1.6
netcdf_version: 4
project: North Atlantic Tracer Release Experiment (NATRE)
expocode: 32OC250_4
cast_number: 3.0
title: Microstructure profiler data from the ship Oceanus...
... ...
latitude: 27.533166666666666
longitude: -30.723333333333333
chief_scientist: Raymond W. Schmitt
data_originator: Polzin
institution: WHOI
data_assembly_center: CCHDOnatre_grid = xgcm.Grid(natre, periodic=False)
natre_grid
<xgcm.Grid>
Z Axis (not periodic, boundary=None):
* center pres
def regrid_to_density(grid, ds, bins):
iso = xr.Dataset()
kwargs = dict(axis="Z", target=bins, target_data=ds.gamma_n.cf.interpolate_na("Z"))
iso["CT"] = grid.transform(natre.CT.cf.interpolate_na("Z"), **kwargs)
iso["SA"] = grid.transform(natre.SA.cf.interpolate_na("Z"), **kwargs)
iso.coords["pressure"] = grid.transform(
ds.cf["sea_water_pressure"].broadcast_like(ds.gamma_n), **kwargs
)
iso["gamma_n"].attrs["axis"] = "Z"
iso["gamma_n"].attrs["positive"] = "down"
if "cast" in iso:
iso["cast"].attrs["cf_role"] = "profile_id"
return iso
natre_iso = regrid_to_density(natre_grid, natre, np.arange(24, 28, 0.01))
natre_iso
/Users/dcherian/mambaforge/envs/eddydiff/lib/python3.9/site-packages/numba/np/ufunc/gufunc.py:151: RuntimeWarning: invalid value encountered in _interp_1d_linear
return self.ufunc(*args, **kwargs)
/Users/dcherian/mambaforge/envs/eddydiff/lib/python3.9/site-packages/numba/np/ufunc/gufunc.py:151: RuntimeWarning: invalid value encountered in _interp_1d_linear
return self.ufunc(*args, **kwargs)
<xarray.Dataset>
Dimensions: (latitude: 10, longitude: 10, gamma_n: 400)
Coordinates:
* latitude (latitude) float64 27.5 27.1 26.7 26.3 ... 25.1 24.7 24.3 23.9
* longitude (longitude) float64 -30.7 -30.3 -29.8 -29.4 ... -27.6 -27.2 -26.8
time (latitude, longitude) datetime64[ns] 1992-03-28T15:28:59.99999...
* gamma_n (gamma_n) float64 24.0 24.01 24.02 24.03 ... 27.97 27.98 27.99
pressure (latitude, longitude, gamma_n) float64 nan nan ... 2.047e+03
Data variables:
CT (latitude, longitude, gamma_n) float64 nan nan nan ... 3.801 3.68
SA (latitude, longitude, gamma_n) float64 nan nan ... 35.22 35.21var = "CT"
sub = iso[var].query({"cast": "longitude > -40 & longitude < -23"})
sub.cf.std("profile_id").cf.plot()
natre_iso[var].cf.std(["latitude", "longitude"]).cf.plot()
plt.legend(["A05", "NATRE"])
/Users/dcherian/mambaforge/envs/eddydiff/lib/python3.9/site-packages/numpy/lib/nanfunctions.py:1879: RuntimeWarning: Degrees of freedom <= 0 for slice.
var = nanvar(a, axis=axis, dtype=dtype, out=out, ddof=ddof,
<matplotlib.legend.Legend at 0x19726dd90>