Argo finescale estimates#
%load_ext watermark

import argopy
import cf_xarray as cfxr
import dask
import dcpy
import gsw
import matplotlib as mpl
import matplotlib.pyplot as plt
import mixsea
import numpy as np
import pandas as pd
import scipy
import scipy.integrate
import seawater as sw
from dcpy.finestructure import estimate_turb_segment, process_argo_profile
from scipy import signal
from scipy.io import loadmat

import xarray as xr

plt.style.use("bmh")
mpl.rcParams["figure.dpi"] = 140
mpl.rcParams["lines.linewidth"] = 1
dirname = "/home/deepak/datasets/finestructure/"

%watermark -iv
seawater  : 3.3.4
gsw       : 3.4.0
numpy     : 1.20.2
mixsea    : 0.1.0
scipy     : 1.5.3
xarray    : 0.17.1.dev3+g48378c4b1
argopy    : 0.1.7
eddydiff  : 0.1
dask      : 2021.6.2
pandas    : 1.2.3
dcpy      : 0.1
matplotlib: 3.4.1
cf_xarray : 0.4.1.dev21+gab9dc66
from distributed import Client

client = Client(threads_per_worker=7, memory_limit="24GB", processes=False)
client
Client
Client-fe7fad73-e442-11eb-b83d-0028f8270ea7
| Connection method: Cluster object | Cluster type: LocalCluster |
| Dashboard: http://192.168.0.10:8787/status |
Cluster Info
LocalCluster
b08d7d51
| Status: running | Using processes: False |
| Dashboard: http://192.168.0.10:8787/status | Workers: 1 |
| Total threads: 7 | Total memory: 22.35 GiB |
Scheduler Info
Scheduler
Scheduler-b14b4c2d-4960-4ff7-8f07-3768f7e30757
| Comm: inproc://192.168.0.10/1554493/1 | Workers: 1 |
| Dashboard: http://192.168.0.10:8787/status | Total threads: 7 |
| Started: Just now | Total memory: 22.35 GiB |
Workers
Worker: 0
| Comm: inproc://192.168.0.10/1554493/3 | Total threads: 7 |
| Dashboard: http://192.168.0.10:35059/status | Memory: 22.35 GiB |
| Nanny: None | |
| Local directory: /tmp/dask-worker-space/worker-appvqnjj | |
NATRE region#
import glob

dsets = [xr.open_dataset(file) for file in glob.glob("./argo_natre_*.nc")]
argo = (
    xr.concat(dsets, dim="N_POINTS").load().argo.point2profile().set_coords("PRES")
)  # .isel(N_POINTS=slice(10000))
argo.PRES.attrs["standard_name"] = "sea_water_pressure"
argo.PRES.attrs["positive"] = "down"
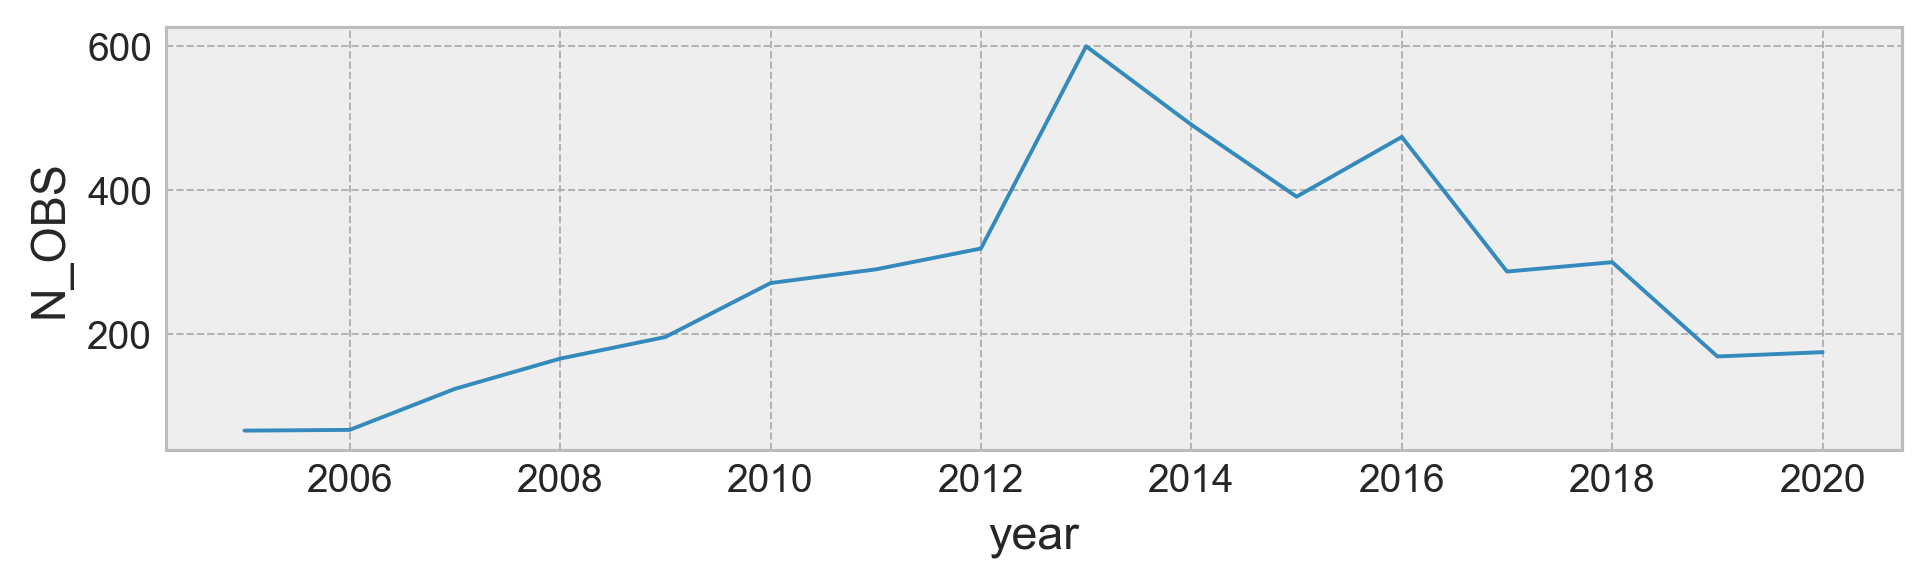
argo.TIME.groupby(argo.TIME.dt.year).count().plot()
plt.gcf().set_size_inches((8, 2))
plt.gca().set_ylabel("N_OBS")
Text(0, 0.5, 'N_OBS')
import dask

argo_good = argo.query({"N_PROF": "DIRECTION == 'A' & DATA_MODE == 'D'"})

# doesn't do anything
# too_coarse = (argo_good.PRES.diff("N_LEVELS") > 20).all("N_LEVELS")
# argo_good = argo_good.isel(N_PROF=~too_coarse)

tasks = [
    dask.delayed(argomix.process_profile)(argo_good.isel(N_PROF=idx))
    for idx in range(argo_good.sizes["N_PROF"])
]
len(tasks)
results = dask.compute(tasks, scheduler=client)
distributed.comm.inproc - WARNING - Closing dangling queue in <InProc  local=inproc://192.168.0.10/1554493/1 remote=inproc://192.168.0.10/1554493/8>
/home/deepak/work/python/dcpy/dcpy/finestructure.py:86: RuntimeWarning: invalid value encountered in sqrt
  N = np.sqrt(N2fit.mean()).item()
def set_index(ds, dim):
    ds = ds.assign_coords({dim: np.arange(ds.sizes[dim])})
    ds["pressure"] = ds.variables["pressure"].to_base_variable()
    return ds


renamed = [
    ds.rename_dims({"pressure": "pressure_"})
    .pipe(set_index, "pressure_")
    .expand_dims("profile")
    for ds in results[0]
    if isinstance(ds, xr.Dataset)
]
combined = xr.concat(renamed, dim="profile", join="outer")
combined.pressure.attrs["positive"] = "down"
combined
<xarray.Dataset>
Dimensions:                (pressure_: 20, profile: 3583, nbnds: 2)
Coordinates: (12/13)
  * pressure_              (pressure_) int64 0 1 2 3 4 5 6 ... 14 15 16 17 18 19
    flag                   (profile, pressure_) float64 -1.0 -1.0 ... -1.0 nan
    pressure               (profile, pressure_) float64 nan nan nan ... nan nan
    npts                   (profile, pressure_) float64 0.0 0.0 0.0 ... 0.0 nan
    γmean                  (profile, pressure_) float64 nan nan nan ... nan nan
    latitude               (profile) float64 23.08 23.79 23.11 ... 26.0 27.96
    ...                     ...
    γ_bounds               (profile, pressure_, nbnds) float64 nan nan ... nan
    p_bounds               (profile, pressure_, nbnds) float64 nan nan ... nan
    CONFIG_MISSION_NUMBER  (profile) int64 1 1 1 1 1 1 1 1 1 ... 5 4 2 5 2 2 5 2
    PLATFORM_NUMBER        (profile) int64 1900073 1900072 ... 4901585 6902572
    CYCLE_NUMBER           (profile) int64 103 104 104 105 ... 180 181 229 182
    DIRECTION              <U1 'A'
Dimensions without coordinates: profile, nbnds
Data variables: (12/14)
    ε                      (profile, pressure_) float64 nan nan nan ... nan nan
    Kρ                     (profile, pressure_) float64 nan nan nan ... nan nan
    N2mean                 (profile, pressure_) float64 nan nan nan ... nan nan
    ξvar                   (profile, pressure_) float64 nan nan nan ... nan nan
    ξvargm                 (profile, pressure_) float64 nan nan nan ... nan nan
    Tzlin                  (profile, pressure_) float64 nan nan nan ... nan nan
    ...                     ...
    Tmld                   (profile) float64 112.4 95.1 112.3 ... 77.88 89.6
    σmld                   (profile) float64 92.4 95.1 112.3 ... 80.2 77.88 89.6
    Tmode                  (profile) float64 132.5 135.3 132.2 ... 79.96 99.7
    σmode                  (profile) float64 132.5 115.1 132.2 ... 79.96 99.7
    χ                      (profile, pressure_) float64 nan nan nan ... nan nan
KtTz (profile, pressure_) float64 nan nan nan ... nan nan- pressure_: 20
- profile: 3583
- nbnds: 2
- pressure_(pressure_)int640 1 2 3 4 5 6 ... 14 15 16 17 18 19
array([ 0, 1, 2, 3, 4, 5, 6, 7, 8, 9, 10, 11, 12, 13, 14, 15, 16, 17, 18, 19]) - flag(profile, pressure_)float64-1.0 -1.0 -1.0 ... -1.0 -1.0 nan
- flag_values :
- [-2, -1, 1, 2, 3, 4, 5]
- flag_meanings :
- too_coarse too_short N²_variance_too_high too_unstratified too_little_bandwidth no_internal_waves good_data
array([[-1., -1., -1., ..., -1., nan, nan], [-1., -1., -1., ..., -1., nan, nan], [-1., -1., -1., ..., -1., nan, nan], ..., [ 5., 5., -1., ..., -1., -1., -1.], [ 5., 5., 5., ..., nan, nan, nan], [ 5., 5., -1., ..., -1., -1., nan]]) - pressure(profile, pressure_)float64nan nan nan nan ... nan nan nan nan
- axis :
- Z
- standard_name :
- sea_water_pressure
- positive :
- down
- bounds :
- p_bounds
array([[ nan, nan, nan, ..., nan, nan, nan], [ nan, nan, nan, ..., nan, nan, nan], [ nan, nan, nan, ..., nan, nan, nan], ..., [209.99999619, 285.05000305, nan, ..., nan, nan, nan], [200.97999954, 302. , 400. , ..., nan, nan, nan], [209.79999542, 280.04999542, nan, ..., nan, nan, nan]]) - npts(profile, pressure_)float640.0 0.0 0.0 0.0 ... 0.0 0.0 0.0 nan
- description :
- number of points in segment
array([[ 0., 0., 0., ..., 0., nan, nan], [ 0., 0., 0., ..., 0., nan, nan], [ 0., 0., 0., ..., 0., nan, nan], ..., [ 19., 14., 4., ..., 0., 0., 0.], [100., 99., 99., ..., nan, nan, nan], [ 19., 15., 4., ..., 0., 0., nan]]) - γmean(profile, pressure_)float64nan nan nan nan ... nan nan nan nan
- bounds :
- γ_bounds
- long_name :
- $γ_n$
- standard_name :
- neutral_density
- units :
- kg/m3
- valid_min :
- 0.0
- valid_max :
- 43.0
- resolution :
- 0.001
- casted :
- 1
array([[ nan, nan, nan, ..., nan, nan, nan], [ nan, nan, nan, ..., nan, nan, nan], [ nan, nan, nan, ..., nan, nan, nan], ..., [26.48515563, 26.65522995, nan, ..., nan, nan, nan], [26.36340187, 26.65571826, 26.86758021, ..., nan, nan, nan], [26.46223804, 26.63708881, nan, ..., nan, nan, nan]]) - latitude(profile)float6423.08 23.79 23.11 ... 26.0 27.96
array([23.079 , 23.785 , 23.115 , ..., 27.692 , 26.00449, 27.961 ])
- longitude(profile)float64-34.05 -25.58 ... -32.41 -27.37
array([-34.046 , -25.578 , -34.184 , ..., -27.586 , -32.41227, -27.371 ]) - γ_bounds(profile, pressure_, nbnds)float64nan nan nan nan ... nan nan nan nan
array([[[ nan, nan], [ nan, nan], [ nan, nan], ..., [ nan, nan], [ nan, nan], [ nan, nan]], [[ nan, nan], [ nan, nan], [ nan, nan], ..., [ nan, nan], [ nan, nan], [ nan, nan]], [[ nan, nan], [ nan, nan], [ nan, nan], ..., ... ..., [ nan, nan], [ nan, nan], [ nan, nan]], [[26.01802761, 26.67128058], [26.37578484, 26.86517511], [26.67407304, 27.01725056], ..., [ nan, nan], [ nan, nan], [ nan, nan]], [[26.18965179, 26.68132286], [26.48551074, 26.79334891], [ nan, nan], ..., [ nan, nan], [ nan, nan], [ nan, nan]]]) - p_bounds(profile, pressure_, nbnds)float64nan nan nan nan ... nan nan nan nan
array([[[ nan, nan], [ nan, nan], [ nan, nan], ..., [ nan, nan], [ nan, nan], [ nan, nan]], [[ nan, nan], [ nan, nan], [ nan, nan], ..., [ nan, nan], [ nan, nan], [ nan, nan]], [[ nan, nan], [ nan, nan], [ nan, nan], ..., ... ..., [ nan, nan], [ nan, nan], [ nan, nan]], [[101.95999908, 300. ], [204. , 400. ], [302. , 498. ], ..., [ nan, nan], [ nan, nan], [ nan, nan]], [[119.69999695, 299.8999939 ], [209.69999695, 350.3999939 ], [ nan, nan], ..., [ nan, nan], [ nan, nan], [ nan, nan]]]) - CONFIG_MISSION_NUMBER(profile)int641 1 1 1 1 1 1 1 ... 5 4 2 5 2 2 5 2
array([1, 1, 1, ..., 2, 5, 2])
- PLATFORM_NUMBER(profile)int641900073 1900072 ... 4901585 6902572
array([1900073, 1900072, 1900073, ..., 6902572, 4901585, 6902572])
- CYCLE_NUMBER(profile)int64103 104 104 105 ... 180 181 229 182
array([103, 104, 104, ..., 181, 229, 182])
- DIRECTION()<U1'A'
array('A', dtype='<U1')
- ε(profile, pressure_)float64nan nan nan nan ... nan nan nan nan
- long_name :
- $ε$
- units :
- W/kg
array([[ nan, nan, nan, ..., nan, nan, nan], [ nan, nan, nan, ..., nan, nan, nan], [ nan, nan, nan, ..., nan, nan, nan], ..., [3.88852199e-10, 1.51102548e-10, nan, ..., nan, nan, nan], [1.97608548e-09, 2.68533632e-10, 2.89201090e-10, ..., nan, nan, nan], [1.00190030e-09, 4.46281609e-10, nan, ..., nan, nan, nan]]) - Kρ(profile, pressure_)float64nan nan nan nan ... nan nan nan nan
- long_name :
- $K_ρ$
- units :
- m²/s
array([[ nan, nan, nan, ..., nan, nan, nan], [ nan, nan, nan, ..., nan, nan, nan], [ nan, nan, nan, ..., nan, nan, nan], ..., [3.59037654e-06, 1.43011102e-06, nan, ..., nan, nan, nan], [1.28061120e-05, 2.24881020e-06, 3.34742500e-06, ..., nan, nan, nan], [7.85027337e-06, 4.29463023e-06, nan, ..., nan, nan, nan]]) - N2mean(profile, pressure_)float64nan nan nan nan ... nan nan nan nan
- long_name :
- $N²$
- description :
- mean of quadratic fit of N² with pressure
array([[ nan, nan, nan, ..., nan, nan, nan], [ nan, nan, nan, ..., nan, nan, nan], [ nan, nan, nan, ..., nan, nan, nan], ..., [2.20933756e-05, 2.15535867e-05, nan, ..., nan, nan, nan], [3.14779142e-05, 2.43592211e-05, 1.76240853e-05, ..., nan, nan, nan], [2.60349795e-05, 2.11982850e-05, nan, ..., nan, nan, nan]]) - ξvar(profile, pressure_)float64nan nan nan nan ... nan nan nan nan
- long_name :
- $ξ$
- description :
- strain variance
array([[ nan, nan, nan, ..., nan, nan, nan], [ nan, nan, nan, ..., nan, nan, nan], [ nan, nan, nan, ..., nan, nan, nan], ..., [0.09462641, 0.05380143, nan, ..., nan, nan, nan], [0.21496643, 0.21644211, 0.21566597, ..., nan, nan, nan], [0.13632284, 0.10018238, nan, ..., nan, nan, nan]]) - ξvargm(profile, pressure_)float64nan nan nan nan ... nan nan nan nan
- long_name :
- $ξ_{gm}$
- description :
- GM strain variance
array([[ nan, nan, nan, ..., nan, nan, nan], [ nan, nan, nan, ..., nan, nan, nan], [ nan, nan, nan, ..., nan, nan, nan], ..., [0.10710723, 0.09636968, nan, ..., nan, nan, nan], [0.12808864, 0.30392183, 0.24419597, ..., nan, nan, nan], [0.10559203, 0.10383195, nan, ..., nan, nan, nan]]) - Tzlin(profile, pressure_)float64nan nan nan nan ... nan nan nan nan
- long_name :
- $T_z^{lin}$
- description :
- linear fit of T vs pressure
array([[ nan, nan, nan, ..., nan, nan, nan], [ nan, nan, nan, ..., nan, nan, nan], [ nan, nan, nan, ..., nan, nan, nan], ..., [0.02004671, 0.01860232, nan, ..., nan, nan, nan], [0.02470548, 0.02164925, 0.01549148, ..., nan, nan, nan], [0.02100139, 0.01878803, nan, ..., nan, nan, nan]]) - Tzmean(profile, pressure_)float64nan nan nan nan ... nan nan nan nan
- long_name :
- $T_z^{quad}$
- description :
- mean of quadratic fit of Tz with pressure; like N² fitting for strain
array([[ nan, nan, nan, ..., nan, nan, nan], [ nan, nan, nan, ..., nan, nan, nan], [ nan, nan, nan, ..., nan, nan, nan], ..., [0.02031759, 0.01885456, nan, ..., nan, nan, nan], [0.02481122, 0.02162229, 0.0155682 , ..., nan, nan, nan], [0.02120085, 0.01871869, nan, ..., nan, nan, nan]]) - mean_dTdz_seg(profile, pressure_)float64nan nan nan nan ... nan nan nan nan
- description :
- mean of dTdz values in segment
- long_name :
- $⟨T_z⟩$
array([[ nan, nan, nan, ..., nan, nan, nan], [ nan, nan, nan, ..., nan, nan, nan], [ nan, nan, nan, ..., nan, nan, nan], ..., [0.02099382, 0.01903718, nan, ..., nan, nan, nan], [0.02480703, 0.02181404, 0.0155757 , ..., nan, nan, nan], [0.02209709, 0.01862588, nan, ..., nan, nan, nan]]) - Tmld(profile)float64112.4 95.1 112.3 ... 77.88 89.6
- units :
- m
- description :
- ΔT criterion applied first time
array([112.40000153, 95.09999847, 112.30000305, ..., 80.19999695, 77.87999725, 89.59999847]) - σmld(profile)float6492.4 95.1 112.3 ... 80.2 77.88 89.6
- units :
- m
- description :
- Δσ criterion applied first time
array([ 92.40000153, 95.09999847, 112.30000305, ..., 80.19999695, 77.87999725, 89.59999847]) - Tmode(profile)float64132.5 135.3 132.2 ... 79.96 99.7
- units :
- m
- description :
- ΔT criterion applied second time
array([132.5 , 135.30000305, 132.19999695, ..., 90.19999695, 79.95999908, 99.69999695]) - σmode(profile)float64132.5 115.1 132.2 ... 79.96 99.7
- units :
- m
- description :
- Δσ criterion applied second time
array([132.5 , 115.09999847, 132.19999695, ..., 90.19999695, 79.95999908, 99.69999695]) - χ(profile, pressure_)float64nan nan nan nan ... nan nan nan nan
- long_name :
- $χ$
- units :
- °C²/s
array([[ nan, nan, nan, ..., nan, nan, nan], [ nan, nan, nan, ..., nan, nan, nan], [ nan, nan, nan, ..., nan, nan, nan], ..., [2.96424817e-09, 1.01679314e-09, nan, ..., nan, nan, nan], [1.57667951e-08, 2.10274220e-09, 1.62262331e-09, ..., nan, nan, nan], [7.05701851e-09, 3.00958698e-09, nan, ..., nan, nan, nan]]) - KtTz(profile, pressure_)float64nan nan nan nan ... nan nan nan nan
- long_name :
- $K_ρθ_z$
- units :
- °Cm/s
array([[           nan,            nan,            nan, ...,
                   nan,            nan,            nan],
       [           nan,            nan,            nan, ...,
                   nan,            nan,            nan],
       [           nan,            nan,            nan, ...,
                   nan,            nan,            nan],
       ...,
       [7.29478138e-08, 2.69641156e-08,            nan, ...,
                   nan,            nan,            nan],
       [3.17735223e-07, 4.86244183e-08, 5.21133852e-08, ...,
                   nan,            nan,            nan],
       [1.66432455e-07, 8.03898726e-08,            nan, ...,
                   nan,            nan,            nan]])
combined.to_zarr("./argomix_natre.zarr")
distributed.utils_perf - WARNING - full garbage collections took 29% CPU time recently (threshold: 10%)
distributed.utils_perf - WARNING - full garbage collections took 30% CPU time recently (threshold: 10%)
distributed.utils_perf - WARNING - full garbage collections took 30% CPU time recently (threshold: 10%)
distributed.utils_perf - WARNING - full garbage collections took 30% CPU time recently (threshold: 10%)
distributed.utils_perf - WARNING - full garbage collections took 30% CPU time recently (threshold: 10%)
distributed.utils_perf - WARNING - full garbage collections took 30% CPU time recently (threshold: 10%)
distributed.utils_perf - WARNING - full garbage collections took 30% CPU time recently (threshold: 10%)
distributed.utils_perf - WARNING - full garbage collections took 30% CPU time recently (threshold: 10%)
distributed.utils_perf - WARNING - full garbage collections took 30% CPU time recently (threshold: 10%)
<xarray.backends.zarr.ZarrStore at 0x7f91ccb2d6d0>
distributed.utils_perf - WARNING - full garbage collections took 30% CPU time recently (threshold: 10%)
combined.to_netcdf("argomix_natre_all_latest.nc")
# combined = xr.open_dataset("argomix_natre_all.nc")
combined = xr.open_zarr("./argomix_natre.zarr").load()
bins = [
    26.692,
    26.876,
    27.039,
    27.163,
    27.288,
    27.406,
    27.516,
    27.605,
    27.683,
    27.742,
    27.794,
    27.835,
    27.872,
    27.898,
    27.921,
    27.94,
    27.958,
    29,
]
combined.coords["γ_vertices"] = cfxr.bounds_to_vertices(
    combined.γ_bounds, bounds_dim="nbnds", core_dims=["pressure_"]
)
combined.coords["p_vertices"] = cfxr.bounds_to_vertices(
    combined.p_bounds, bounds_dim="nbnds", core_dims=["pressure_"]
)
good_data = combined.npts > 40
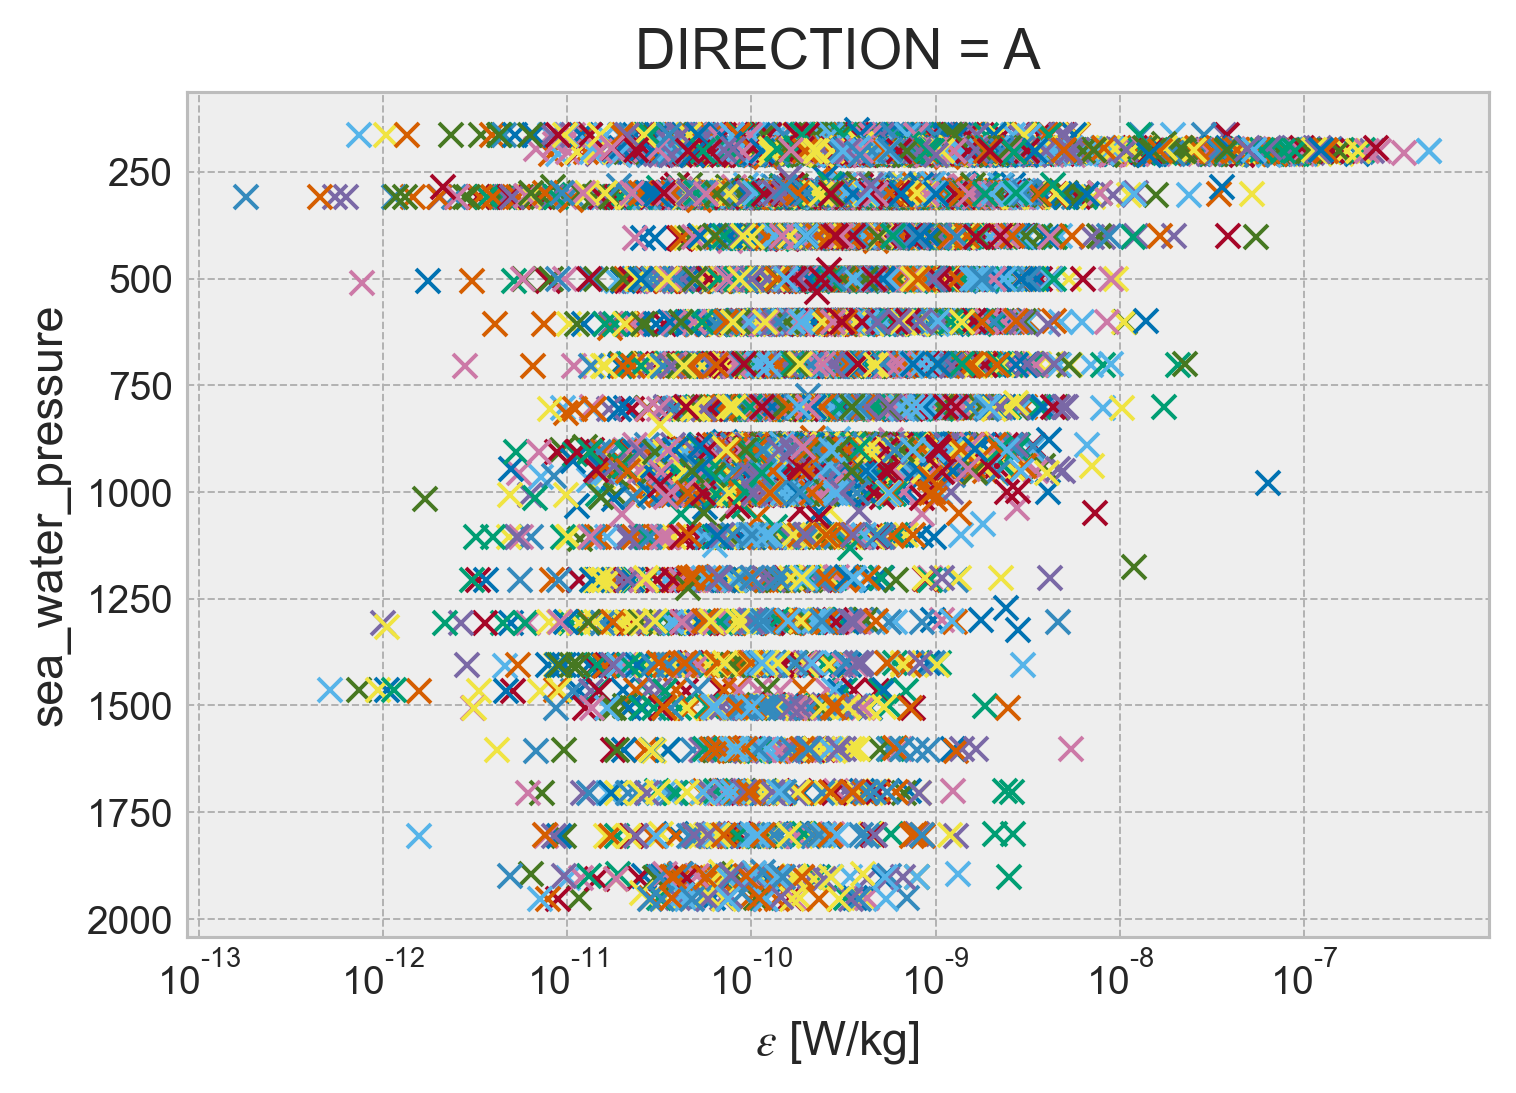
combined.ε.cf.plot(
hue="profile",
y="pressure",
xscale="log",
ls="none",
marker="x",
add_legend=False,
yincrease=False,
);
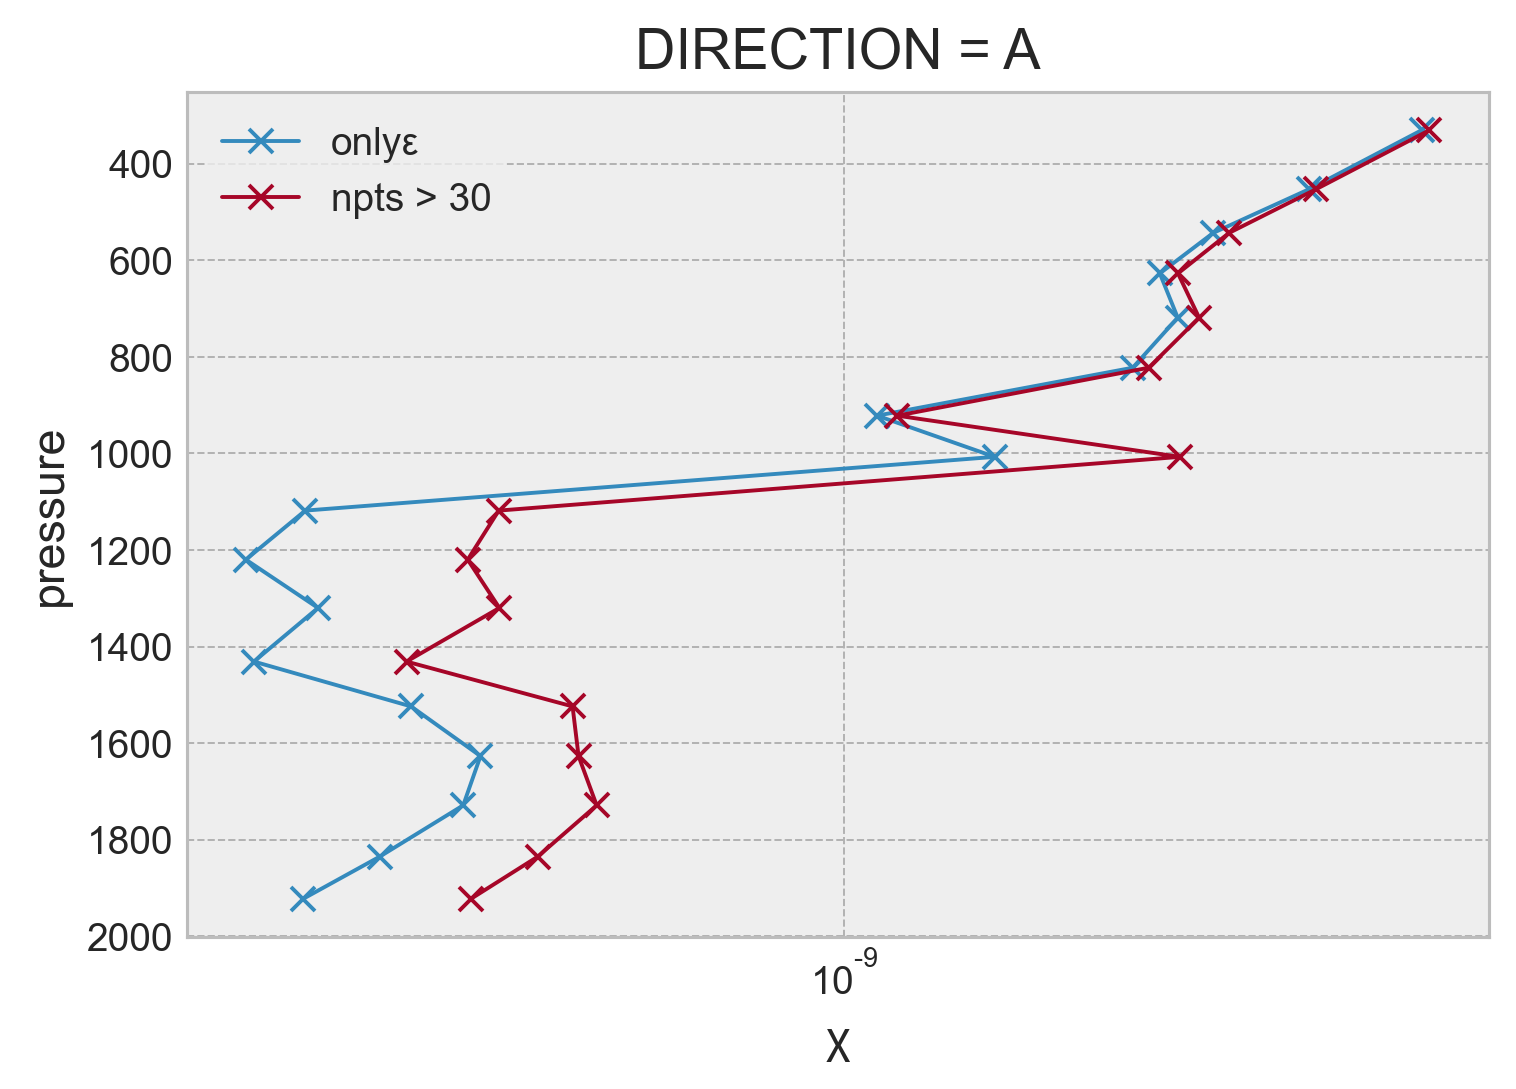
combined.reset_coords("pressure").groupby_bins("γmean", bins=bins).mean().set_coords(
    "pressure"
).χ.plot(y="pressure", marker="x", xscale="log", yincrease=False)
combined.where(combined.npts > 20).reset_coords("pressure").groupby_bins(
    "γmean",
    bins=bins,
).mean().set_coords("pressure").χ.plot(
    y="pressure", marker="x", xscale="log", yincrease=False
)
plt.legend(["onlyε", "npts > 30"])
plt.grid(True)
Experiment with conservative interpolation of ε#
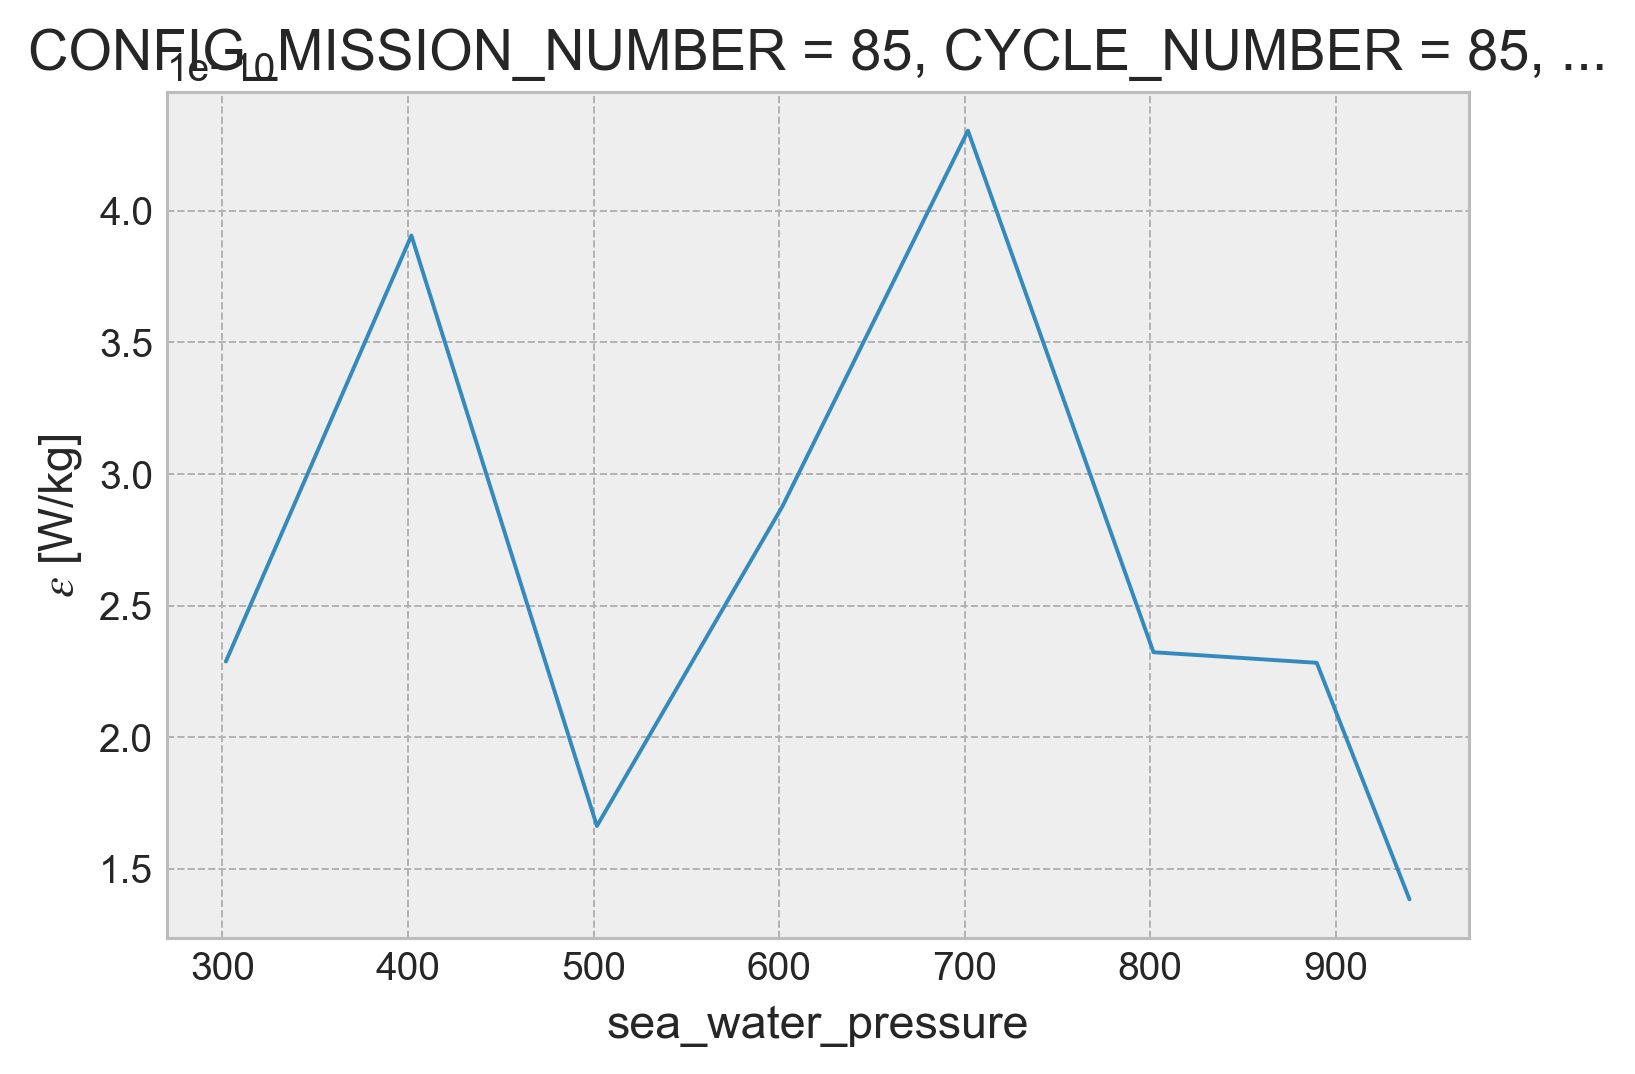
profile = combined.isel(profile=1950)
profile.ε.plot(x="pressure")
[<matplotlib.lines.Line2D at 0x7f1f4b11ddf0>]
mask = profile.ε.notnull().data
mask_outer = profile.γ_vertices.notnull().data
bins = np.array(bins)

eps_ext = transform.interp_1d_conservative(
    (profile.ε * profile.γmean * profile.pressure).data[mask][:-1],
    profile.γ_vertices.data[mask_outer],
    target_theta_bins=np.asarray(bins),
)
mass_ext = transform.interp_1d_conservative(
    (profile.γmean * profile.pressure).data[mask][:-1],
    profile.γ_vertices.data[mask_outer],
    target_theta_bins=bins,
)

plt.plot((bins[:-1] + bins[1:]) / 2, eps_ext / mass_ext)
plt.plot(profile.γmean, profile.ε)
---------------------------------------------------------------------------
NameError                                 Traceback (most recent call last)
<ipython-input-78-d6bce3b0d837> in <module>
      1 bins = np.array(bins)
      2
----> 3 eps_ext = transform.interp_1d_conservative(
      4     (profile.ε * profile.γmean * profile.pressure).data[mask][:-1],
      5     profile.γ_vertices.data[mask_outer],

NameError: name 'transform' is not defined
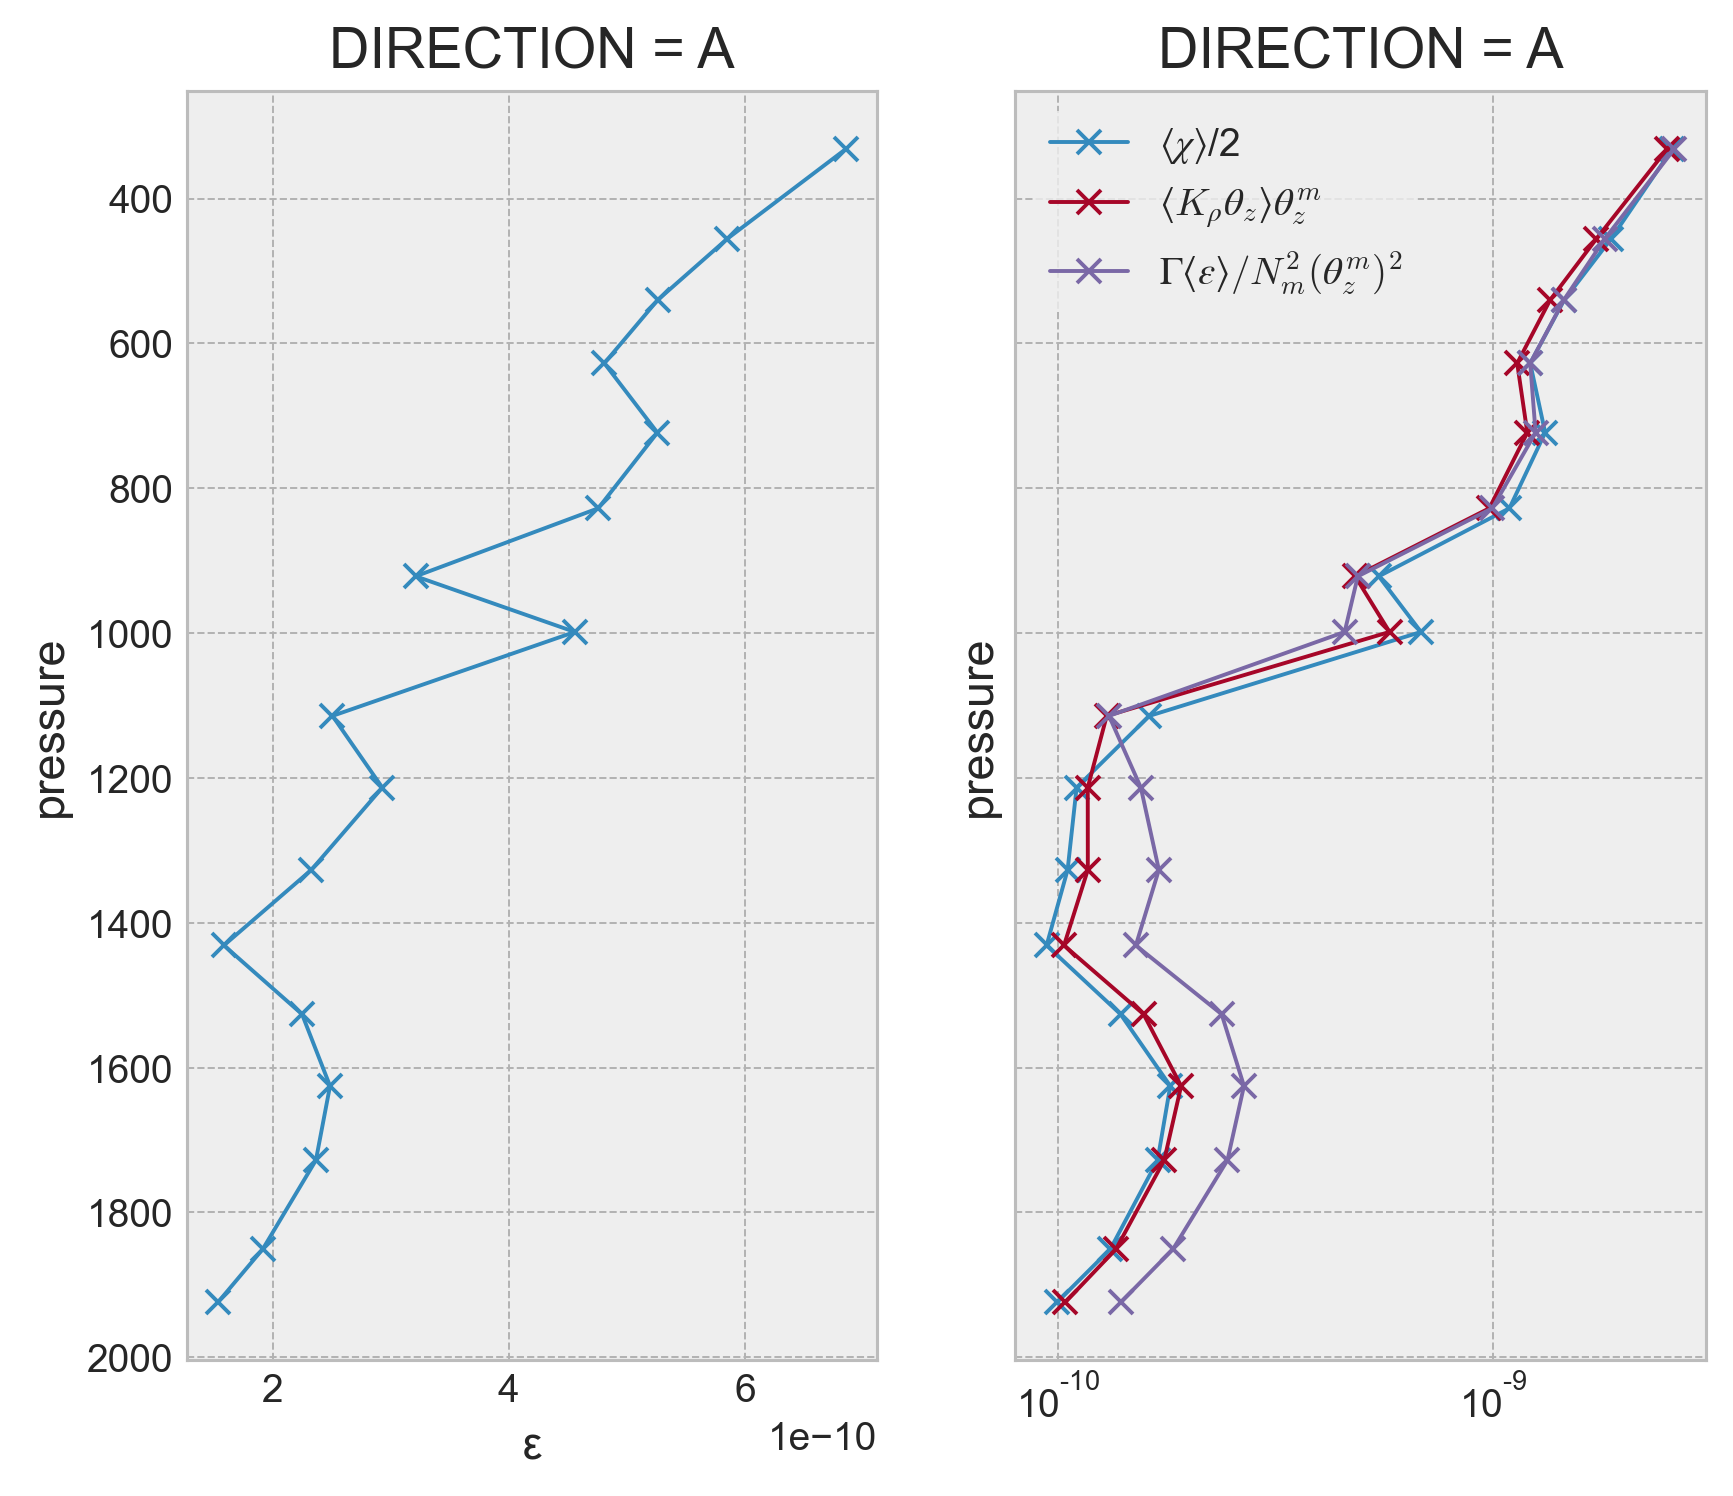
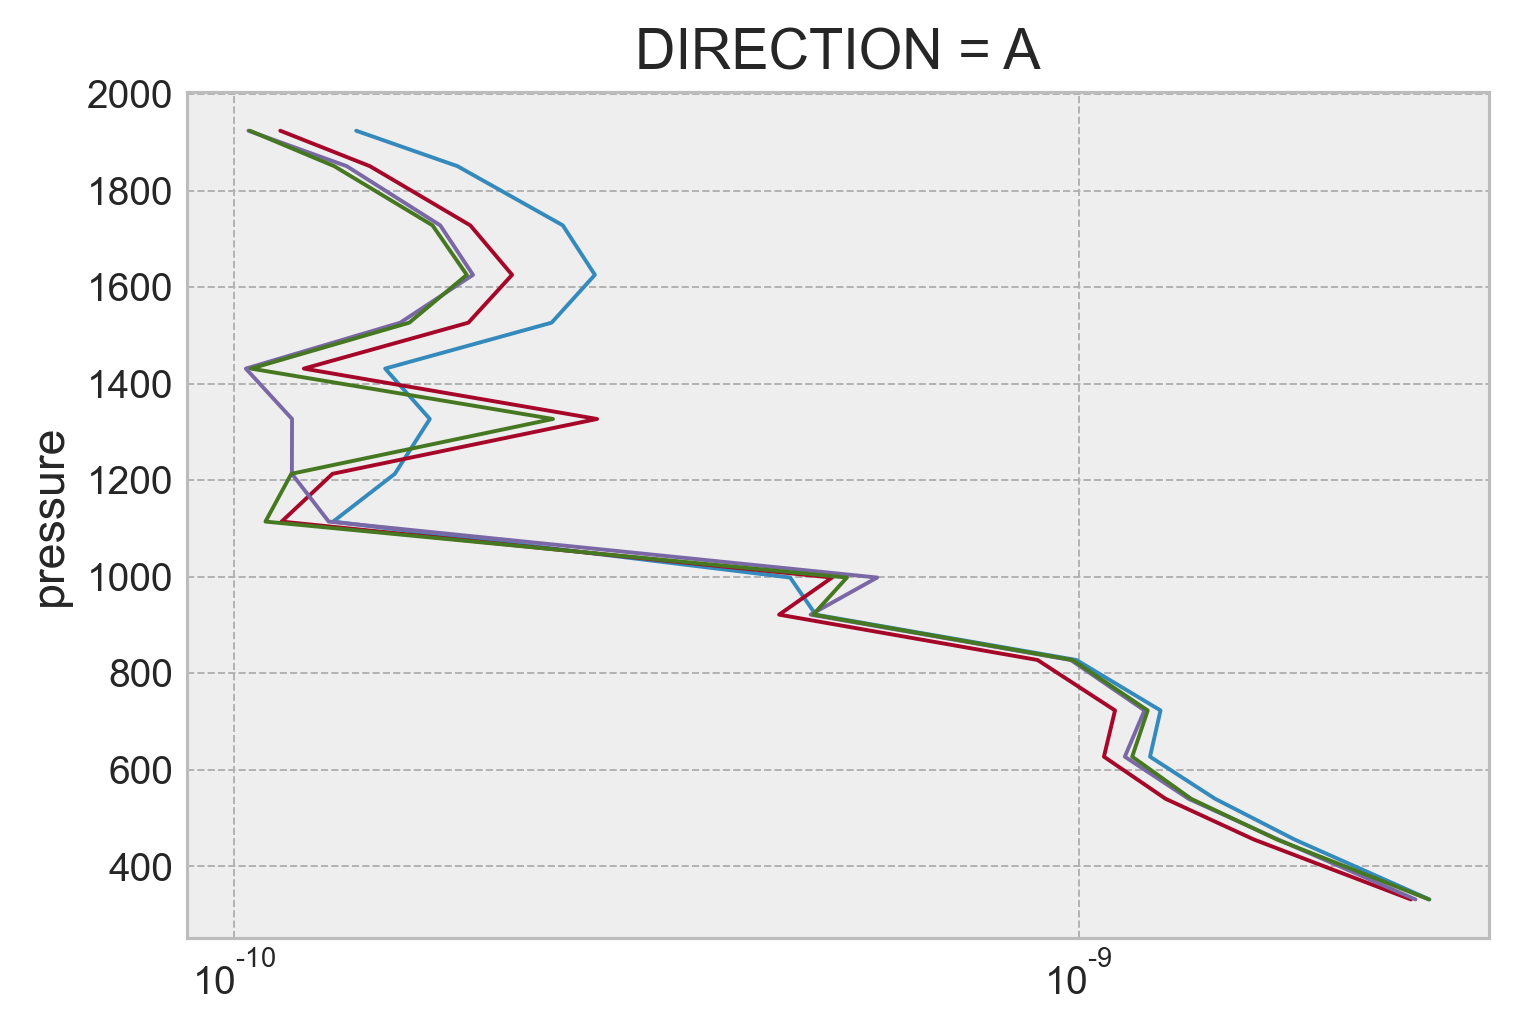
Do variance budget terms#
This does not work so well or too well actually. It looks like χ/2 matches the local turbulent stirring production exactly!
I think the 200m averaging scale in the finestructure estimate is the problem. It matches the vertical scale for our ‘large-scale’ vertical bins (I think the spacing between γ surfaces, but should check).
Another option is to do the Ferrari & Polzin (2005) thing where they set microscale stirring production \(= Γ⟨ε⟩/N^2_m θ^m_z\); so I could bin-average fine structure ε to get \(⟨ε⟩\) and use the climatology to get the gradient terms.
Another option is to calculate the estimates in 200m bins and then average all estimates in those bins; this would avoid some extra averaging I think (!)
Why has no one done this before?
import cf_xarray
import dcpy

argoclim = dcpy.oceans.read_argo_clim().sel(
    lat=slice(24, 28), lon=slice(360 - 31, 360 - 26)
)
argoclim["γ"] = dcpy.oceans.neutral_density(argoclim[["Tmean", "Smean"]])
argoclim.load()
argoclim.cf
Coordinates:
- CF Axes: * X: ['lon']
           * Y: ['lat']
           * Z: ['pres']
           * T: ['time']

- CF Coordinates: * longitude: ['lon']
                  * latitude: ['lat']
                  * vertical: ['pres']
                  * time: ['time']

- Cell Measures:   area, volume: n/a

- Standard Names: * sea_water_pressure: ['pres']

- Bounds:   n/a

Data Variables:
- Cell Measures:   area, volume: n/a

- Standard Names:   neutral_density: ['γ']
                    sea_water_potential_temperature: ['theta_mean']
                    sea_water_salinity: ['S', 'Smean']
                    sea_water_temperature: ['T', 'Tmean']

- Bounds:   n/a
density bin averaged#
bins = np.array(
    [
        26.69,
        26.88,
        27.04,
        27.16,
        27.29,
        27.41,
        27.52,
        27.6,
        27.68,
        27.74,
        27.79,
        27.84,
        27.87,
        27.9,
        27.92,
        27.94,
        27.96,
        27.97,
    ]
)
# bins = np.arange(26.5, 28.1, 0.15)

combined["KtTz_seg"] = combined.Kρ * combined.mean_dTdz_seg
binned_argo_fs = (
    combined.reset_coords("pressure")  # .where(good_data & (combined.npts > 30))
    .groupby_bins(
        "γmean",
        bins=bins,
    )
    .mean()
    .set_coords("pressure")
)


# totally fine
Tz_m_argo = (
    argoclim.theta_mean.cf.differentiate("pres", positive_upward=True)
    .compute()
    .mean(["lat", "lon"])
    .interp(pres=binned_argo_fs.pressure)
)
N2_m_argo = (
    -9.81
    / 1025
    * (
        argoclim.γ.cf.differentiate("pres", positive_upward=True)
        .compute()
        .mean(["lat", "lon"])
        .interp(pres=binned_argo_fs.pressure)
    )
)


f, ax = plt.subplots(1, 2, sharey=True)

binned_argo_fs.ε.cf.plot(marker="x", y="pressure", ax=ax[0])

(binned_argo_fs.χ / 2).plot(
    ax=ax[1], y="pressure", marker="x", xscale="log", yincrease=False
)
(binned_argo_fs.KtTz * Tz_m_argo).plot(ax=ax[1], y="pressure", marker="x")
# (binned_argo_fs.KtTz_seg * Tz_m_argo).plot(ax=ax[1], y="pressure", marker="o")
(0.2 * binned_argo_fs.ε / N2_m_argo * Tz_m_argo**2).plot(
    ax=ax[1], y="pressure", marker="x"
)
plt.legend(["$⟨χ⟩$/2", "$⟨K_ρ θ_z⟩ θ_z^m$", "$Γ⟨ε⟩/N^2_m (θ^m_z)^2$"])
plt.gcf().set_size_inches((7, 6))
plt.grid(True)
(0.2 * binned_argo_fs.ε / N2_m_argo * Tz_m_argo**2).plot(y="pressure")
(binned_argo_fs.Kρ * Tz_m_argo**2).plot(y="pressure", xscale="log")
(binned_argo_fs.KtTz * Tz_m_argo).plot(y="pressure", xscale="log")
(binned_argo_fs.Kρ * binned_argo_fs.Tzmean * Tz_m_argo).plot(y="pressure", xscale="log")
[<matplotlib.lines.Line2D at 0x7f1f4a81b1c0>]
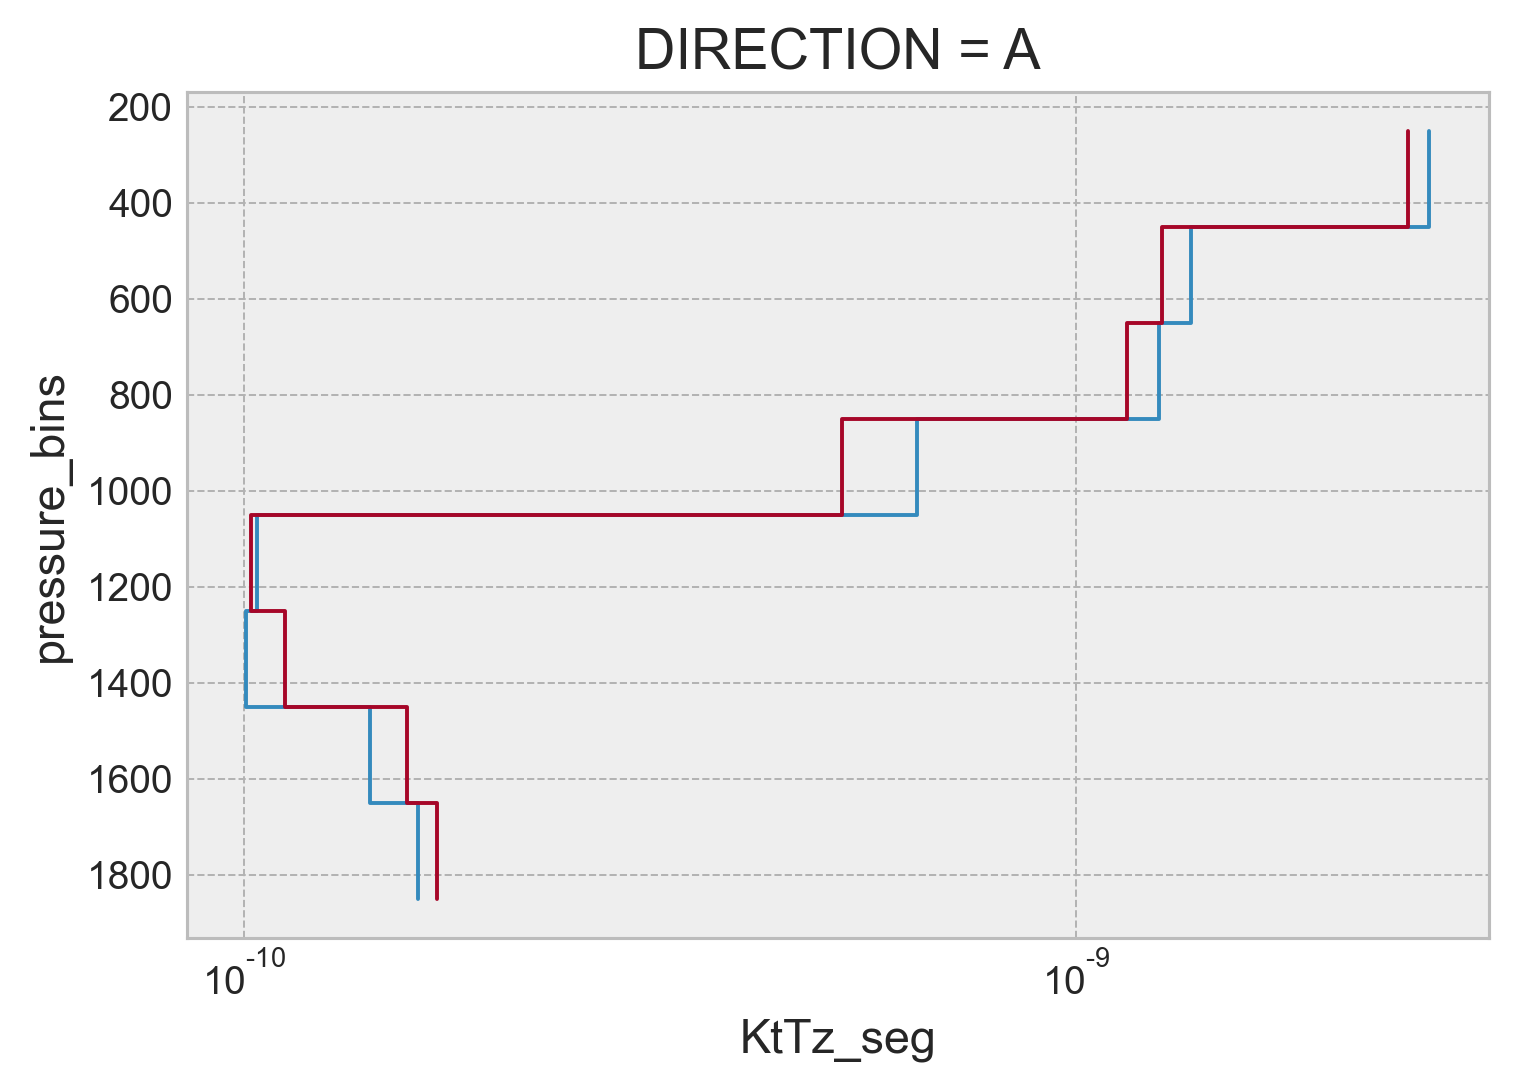
pressure bin averaged#
binned = combined.groupby_bins("pressure", np.arange(250, 2050, 200)).mean()
centers = [p.data.item().mid for p in binned.pressure_bins]
Tz_m_argo = (
    argoclim.theta_mean.cf.differentiate("pres", positive_upward=True)
    .compute()
    .mean(["lat", "lon"])
    .interp(pres=centers)
    .rename(pres="pressure_bins")
)

(binned.χ / 2).plot.step(y="pressure_bins", xscale="log", yincrease=False)
(binned.KtTz_seg * Tz_m_argo.data).plot.step(
    y="pressure_bins", xscale="log", yincrease=False
)
[<matplotlib.lines.Line2D at 0x7f1f4821d370>]
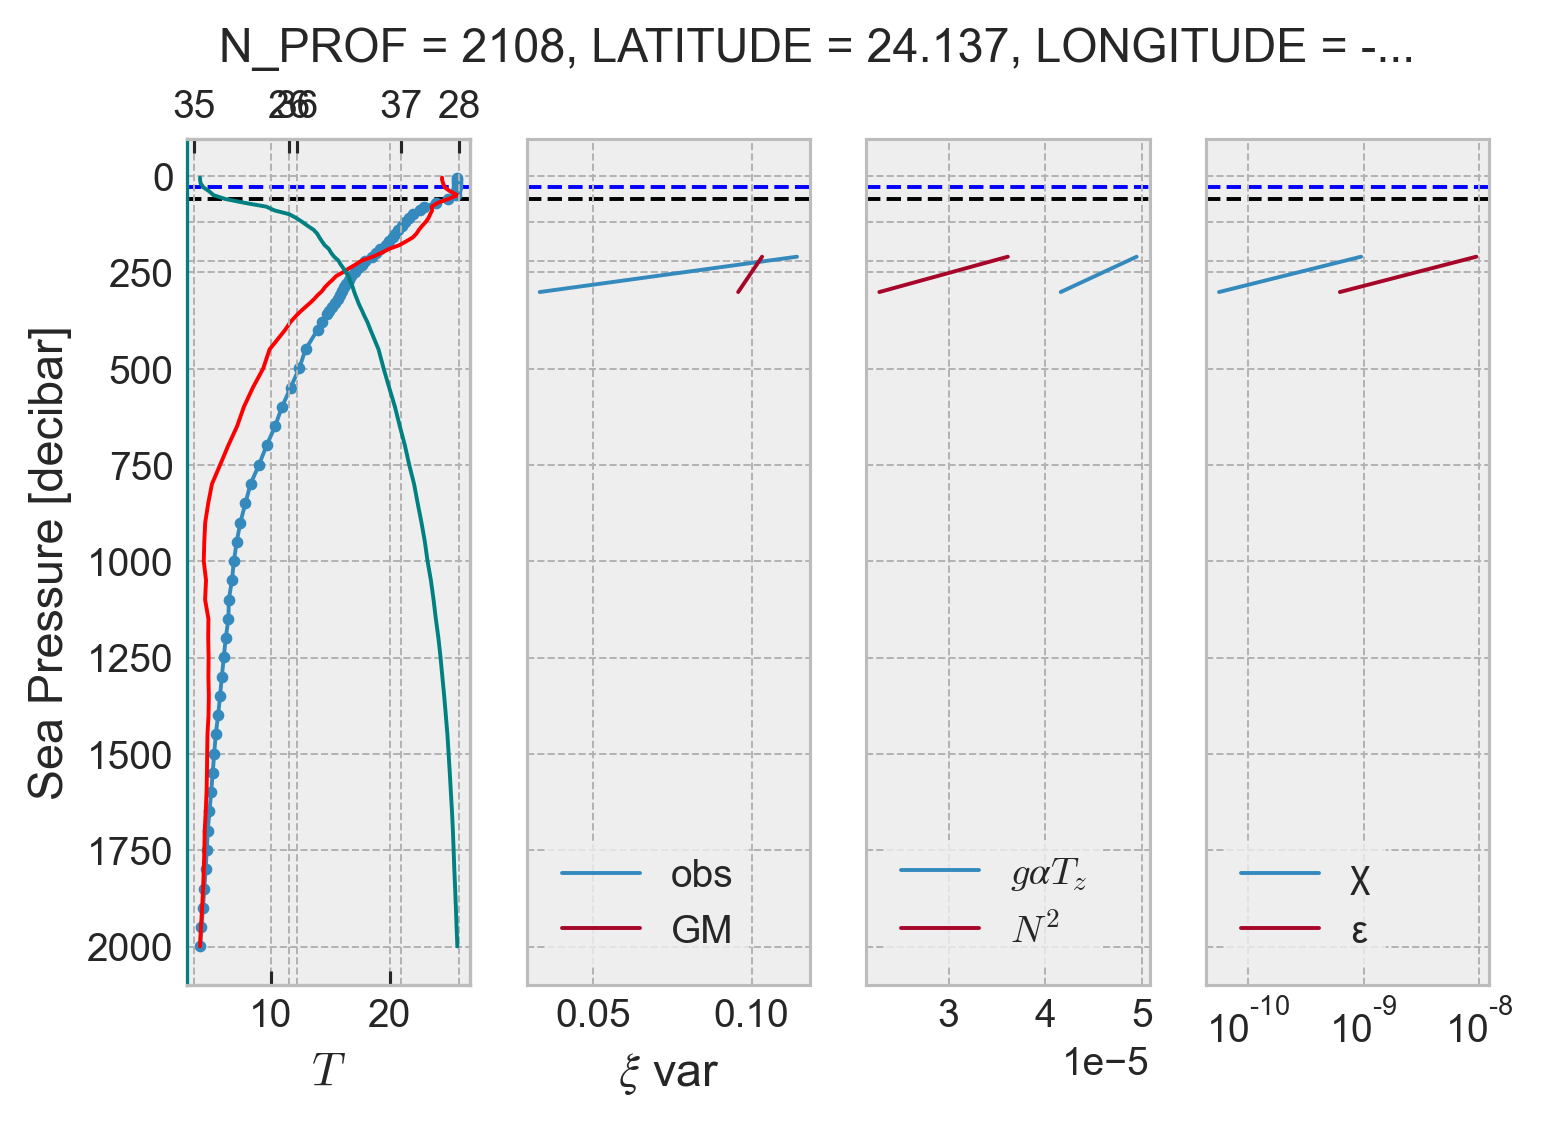
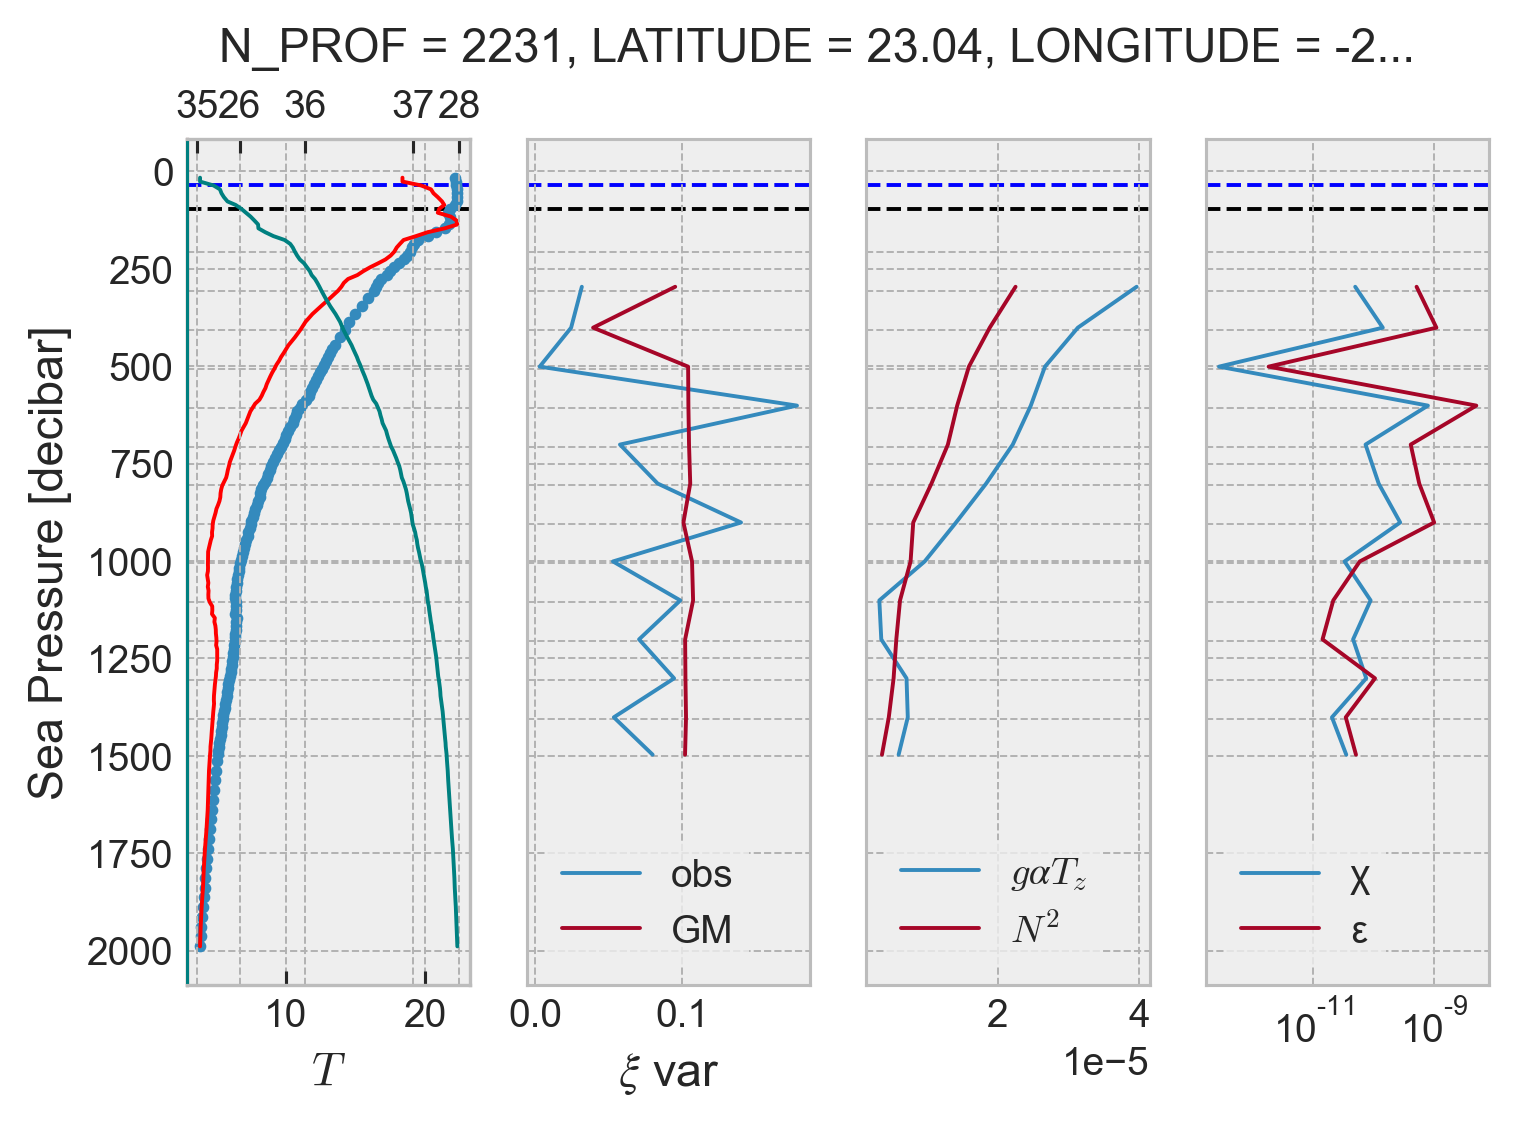
Debugging profile estimates#
[x] check MLD for N_PROF=100
[ ] change axes tick colors for T,S,γ
[ ] Throw out estimates when number of points is small. This is causing the drop near 1000m; below this data spacing is usually coarse. I need to be more careful about bins near 1000m
profile = argo.isel(N_PROF=120)
result = process_argo_profile(profile, debug=True)
 104 —  294dbar: ξgmvar: 0.103, ξvar: 0.114, N2: 3.61e-05 K: 5.33e-06, ε: 9.45e-10
 204 —  385dbar: ξgmvar: 0.096, ξvar: 0.033, N2: 2.28e-05 K: 4.97e-07, ε: 5.56e-11
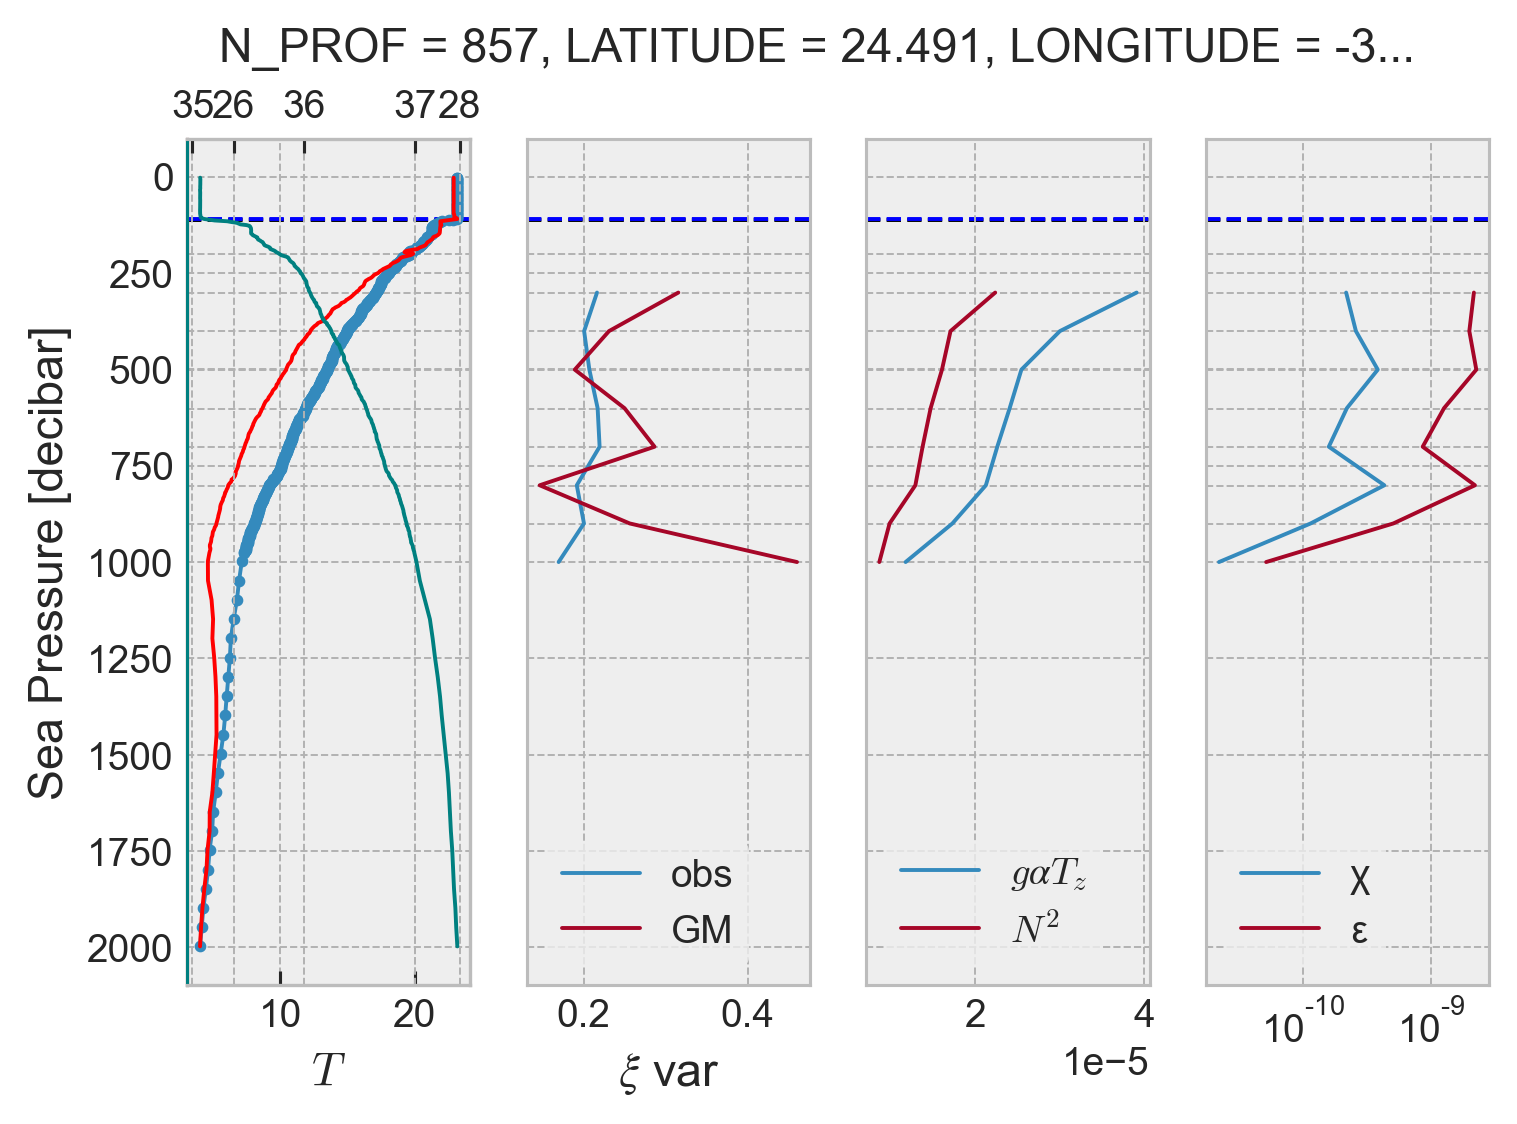
profile = argo.query(
    {"N_PROF": "PLATFORM_NUMBER == 6900695 & CYCLE_NUMBER == 160"}
).squeeze()
result = process_argo_profile(profile, debug=True)
 211 —  371dbar: ξgmvar: 0.095, ξvar: 0.032, N2: 2.25e-05 K: 4.48e-07, ε: 4.94e-11
 316 —  476dbar: ξgmvar: 0.039, ξvar: 0.025, N2: 1.88e-05 K: 1.52e-06, ε: 1.41e-10
 416 —  586dbar: ξgmvar: 0.104, ξvar: 0.003, N2: 1.59e-05 K: 3.60e-09, ε: 2.81e-13
 511 —  691dbar: ξgmvar: 0.104, ξvar: 0.178, N2: 1.42e-05 K: 1.12e-05, ε: 7.80e-10
 611 —  791dbar: ξgmvar: 0.105, ξvar: 0.058, N2: 1.29e-05 K: 1.16e-06, ε: 7.31e-11
 711 —  891dbar: ξgmvar: 0.105, ξvar: 0.083, N2: 1.06e-05 K: 2.32e-06, ε: 1.20e-10
 811 —  991dbar: ξgmvar: 0.101, ξvar: 0.140, N2: 7.99e-06 K: 6.95e-06, ε: 2.72e-10
 911 — 1091dbar: ξgmvar: 0.107, ξvar: 0.053, N2: 7.61e-06 K: 8.85e-07, ε: 3.30e-11
1012 — 1191dbar: ξgmvar: 0.107, ξvar: 0.099, N2: 6.11e-06 K: 2.96e-06, ε: 8.87e-11
1111 — 1291dbar: ξgmvar: 0.102, ξvar: 0.071, N2: 5.59e-06 K: 1.67e-06, ε: 4.56e-11
1211 — 1391dbar: ξgmvar: 0.102, ξvar: 0.095, N2: 5.20e-06 K: 2.94e-06, ε: 7.50e-11
1311 — 1492dbar: ξgmvar: 0.103, ξvar: 0.054, N2: 4.52e-06 K: 9.23e-07, ε: 2.04e-11
1411 — 1571dbar: ξgmvar: 0.102, ξvar: 0.080, N2: 3.55e-06 K: 2.02e-06, ε: 3.52e-11
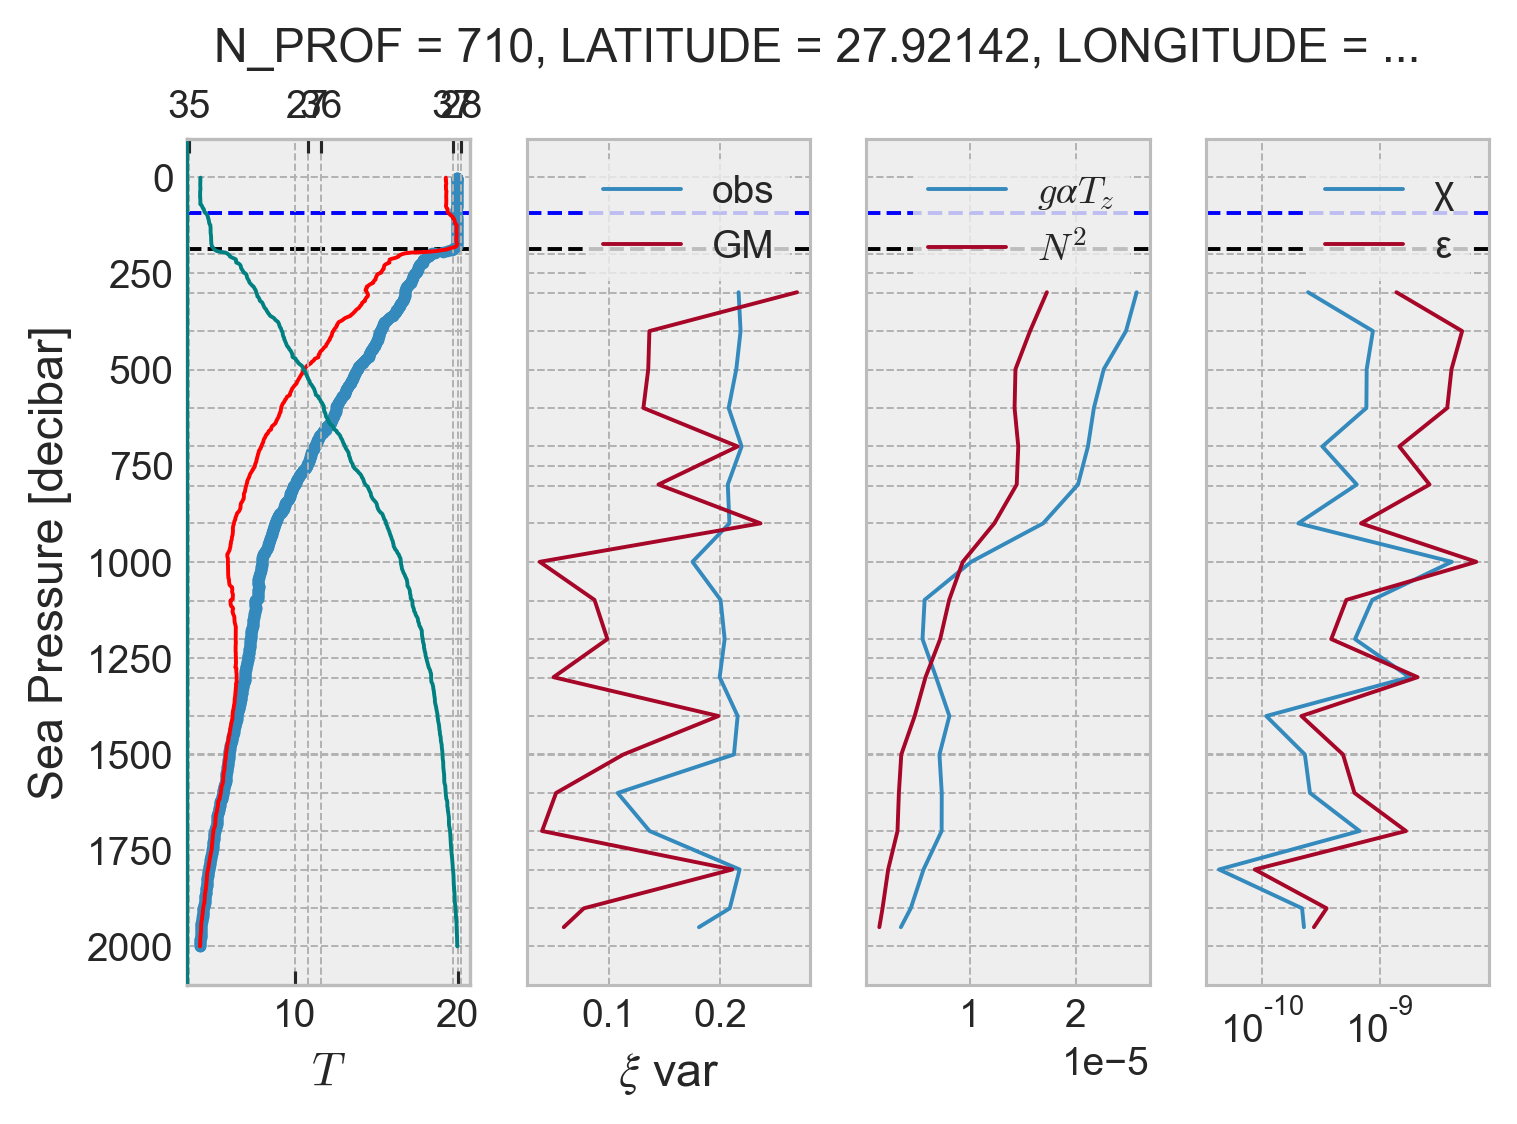
profile = argo.isel(N_PROF=2100)
result = process_argo_profile(profile, debug=True)
 203 —  399dbar: ξgmvar: 0.315, ξvar: 0.216, N2: 2.23e-05 K: 1.97e-06, ε: 2.16e-10
 303 —  499dbar: ξgmvar: 0.231, ξvar: 0.200, N2: 1.71e-05 K: 3.08e-06, ε: 2.58e-10
 403 —  599dbar: ξgmvar: 0.189, ξvar: 0.207, N2: 1.60e-05 K: 4.87e-06, ε: 3.83e-10
 503 —  699dbar: ξgmvar: 0.250, ξvar: 0.217, N2: 1.47e-05 K: 3.04e-06, ε: 2.19e-10
 603 —  799dbar: ξgmvar: 0.286, ξvar: 0.219, N2: 1.37e-05 K: 2.35e-06, ε: 1.58e-10
 703 —  899dbar: ξgmvar: 0.146, ξvar: 0.191, N2: 1.29e-05 K: 6.82e-06, ε: 4.31e-10
 803 —  987dbar: ξgmvar: 0.256, ξvar: 0.200, N2: 9.84e-06 K: 2.36e-06, ε: 1.14e-10
 903 — 1073dbar: ξgmvar: 0.460, ξvar: 0.169, N2: 8.63e-06 K: 5.15e-07, ε: 2.18e-11
profile = argo.query(
    {"N_PROF": "PLATFORM_NUMBER == 4901588 & CYCLE_NUMBER == 23"}
).squeeze()
result = process_argo_profile(profile, debug=True)
 201 —  397dbar: ξgmvar: 0.269, ξvar: 0.217, N2: 1.73e-05 K: 2.92e-06, ε: 2.47e-10
 303 —  497dbar: ξgmvar: 0.137, ξvar: 0.219, N2: 1.57e-05 K: 1.14e-05, ε: 8.78e-10
 401 —  597dbar: ξgmvar: 0.136, ξvar: 0.215, N2: 1.43e-05 K: 1.11e-05, ε: 7.77e-10
 501 —  699dbar: ξgmvar: 0.131, ξvar: 0.208, N2: 1.42e-05 K: 1.11e-05, ε: 7.72e-10
 601 —  799dbar: ξgmvar: 0.216, ξvar: 0.219, N2: 1.46e-05 K: 4.58e-06, ε: 3.27e-10
 701 —  897dbar: ξgmvar: 0.145, ξvar: 0.207, N2: 1.44e-05 K: 9.05e-06, ε: 6.40e-10
 803 —  997dbar: ξgmvar: 0.236, ξvar: 0.209, N2: 1.23e-05 K: 3.38e-06, ε: 2.04e-10
 901 — 1099dbar: ξgmvar: 0.038, ξvar: 0.175, N2: 9.35e-06 K: 8.93e-05, ε: 4.09e-09
1001 — 1197dbar: ξgmvar: 0.087, ξvar: 0.201, N2: 8.07e-06 K: 2.19e-05, ε: 8.66e-10
1103 — 1299dbar: ξgmvar: 0.099, ξvar: 0.204, N2: 7.22e-06 K: 1.75e-05, ε: 6.19e-10
1201 — 1399dbar: ξgmvar: 0.051, ξvar: 0.200, N2: 5.85e-06 K: 6.25e-05, ε: 1.79e-09
1303 — 1499dbar: ξgmvar: 0.199, ξvar: 0.216, N2: 4.83e-06 K: 4.62e-06, ε: 1.09e-10
1403 — 1599dbar: ξgmvar: 0.113, ξvar: 0.213, N2: 3.57e-06 K: 1.33e-05, ε: 2.33e-10
1503 — 1699dbar: ξgmvar: 0.053, ξvar: 0.108, N2: 3.34e-06 K: 1.57e-05, ε: 2.57e-10
1601 — 1799dbar: ξgmvar: 0.040, ξvar: 0.137, N2: 3.21e-06 K: 4.29e-05, ε: 6.76e-10
1701 — 1899dbar: ξgmvar: 0.211, ξvar: 0.218, N2: 2.33e-06 K: 3.80e-06, ε: 4.35e-11
1803 — 1999dbar: ξgmvar: 0.078, ξvar: 0.209, N2: 1.81e-06 K: 2.49e-05, ε: 2.20e-10
1901 — 1999dbar: ξgmvar: 0.060, ξvar: 0.181, N2: 1.51e-06 K: 3.09e-05, ε: 2.28e-10
Bad profiles#
I found some bad profiles; all for the same float 6900695; and cycle numbers 160, 170 ,171, 175.
Changing from the mixsea psd to my psd fixed it :/. The input data were fine; whatever funny interpolation is done with mixsea screws things
mask = (combined.ε > 1).any("pressure_")
combined.isel(profile=mask)
<xarray.Dataset>
Dimensions:                (pressure_: 19, profile: 4, nbnds: 2)
Coordinates: (12/13)
  * pressure_              (pressure_) int64 0 1 2 3 4 5 6 ... 13 14 15 16 17 18
    flag                   (profile, pressure_) float64 5.0 5.0 5.0 ... -2.0 nan
    pressure               (profile, pressure_) float64 282.7 414.5 ... nan nan
    npts                   (profile, pressure_) float64 15.0 13.0 ... 4.0 nan
    γmean                  (profile, pressure_) float64 26.71 26.92 ... nan nan
    latitude               (profile) float64 23.04 23.05 23.17 23.56
    ...                     ...
    γ_bounds               (profile, pressure_, nbnds) float64 26.5 ... nan
    p_bounds               (profile, pressure_, nbnds) float64 206.0 ... nan
    CONFIG_MISSION_NUMBER  (profile) int64 2 2 2 2
    PLATFORM_NUMBER        (profile) int64 6900695 6900695 6900695 6900695
    CYCLE_NUMBER           (profile) int64 160 170 171 175
    DIRECTION              (profile) <U1 'A' 'A' 'A' 'A'
Dimensions without coordinates: profile, nbnds
Data variables: (12/13)
    ε                      (profile, pressure_) float64 2.364e-11 ... nan
    Kρ                     (profile, pressure_) float64 2.215e-07 ... nan
    N2mean                 (profile, pressure_) float64 2.177e-05 ... nan
    ξvar                   (profile, pressure_) float64 0.03379 ... nan
    ξvargm                 (profile, pressure_) float64 0.1436 0.05839 ... nan
    Tzlin                  (profile, pressure_) float64 0.02425 0.01908 ... nan
    ...                     ...
    Tmld                   (profile) float64 96.0 56.0 46.0 45.0
    σmld                   (profile) float64 36.0 46.0 46.0 36.0
    Tmode                  (profile) float64 146.0 66.0 56.0 55.0
    σmode                  (profile) float64 106.0 66.0 56.0 55.0
    χ                      (profile, pressure_) float64 2.333e-10 ... nan
KtTz (profile, pressure_) float64 5.082e-09 ... nan- pressure_: 19
- profile: 4
- nbnds: 2
- pressure_(pressure_)int640 1 2 3 4 5 6 ... 13 14 15 16 17 18
array([ 0, 1, 2, 3, 4, 5, 6, 7, 8, 9, 10, 11, 12, 13, 14, 15, 16, 17, 18]) - flag(profile, pressure_)float645.0 5.0 5.0 5.0 ... -2.0 -2.0 nan
- flag_values :
- [-2, -1, 1, 2, 3, 4, 5]
- flag_meanings :
- too_coarse too_short N²_variance_too_high too_unstratified too_little_bandwidth no_internal_waves good_data
array([[ 5., 5., 5., 5., 5., 5., 5., 5., 5., 5., 5., 5., 5., -2., -2., -2., -2., -2., nan], [ 5., 5., 5., 5., 5., 5., 5., 5., 5., 5., 5., 5., 5., -2., -2., -2., -1., -1., nan], [ 5., 5., 5., 5., 5., 5., 5., 5., 5., 5., 5., 5., 5., -2., -2., -2., -2., -2., nan], [ 5., 5., 5., 5., 5., 5., 5., 5., 5., 5., 5., 5., 5., -2., -2., -2., -2., -2., nan]]) - pressure(profile, pressure_)float64282.7 414.5 509.3 ... nan nan nan
- axis :
- Z
- standard_name :
- sea_water_pressure
- positive :
- down
- bounds :
- p_bounds
array([[ 282.66666667, 414.46153846, 509.33333333, 600.9 , 700.95 , 801.05 , 901. , 1001.05 , 1101.05 , 1201. , 1301. , 1401.05 , 1479.5 , nan, nan, nan, nan, nan, nan], [ 310.38888889, 400.9 , 500.8 , 592.5 , 687.53846154, 819.4 , 901.05 , 1001. , 1101. , 1201. , 1301.05 , 1401.1 , 1479.57142857, nan, nan, nan, nan, nan, nan], [ 301. , 401. , 501.05 , 601.05 , 701. , 801. , 901. , 1001.05 , 1087.3125 , 1209.07692308, 1314.29411765, 1401.05 , 1479.71428571, nan, nan, nan, nan, nan, nan], [ 320.14285714, 397.76470588, 487.61538462, 619.33333333, 701.05 , 801. , 900.95 , 1001. , 1101. , 1201. , 1301.05 , 1401.05 , 1479.5 , nan, nan, nan, nan, nan, nan]]) - npts(profile, pressure_)float6415.0 13.0 18.0 20.0 ... 8.0 4.0 nan
- description :
- number of points in segment
array([[15., 13., 18., 20., 20., 20., 20., 20., 20., 20., 20., 20., 14., 8., 8., 8., 8., 4., nan], [18., 20., 20., 18., 13., 15., 20., 20., 20., 20., 20., 20., 14., 8., 8., 8., 8., 4., nan], [20., 20., 20., 20., 20., 20., 20., 20., 16., 13., 17., 20., 14., 8., 8., 8., 8., 4., nan], [14., 17., 13., 15., 20., 20., 20., 20., 20., 20., 20., 20., 14., 8., 8., 8., 8., 4., nan]]) - γmean(profile, pressure_)float6426.71 26.92 27.09 ... nan nan nan
- bounds :
- γ_bounds
- standard_name :
- neutral_density
- units :
- kg/m3
- long_name :
- $γ_n$
array([[26.70727758, 26.92163483, 27.09017929, 27.24200566, 27.37606026, 27.48960307, 27.57617697, 27.64916837, 27.71189223, 27.76403431, 27.81077869, 27.85031009, 27.88082515, nan, nan, nan, nan, nan, nan], [26.76088094, 26.9425281 , 27.08418426, 27.21359268, 27.34542263, 27.46176361, 27.55969803, 27.64158084, 27.70956612, 27.76537164, 27.81587768, 27.85716215, 27.88443869, nan, nan, nan, nan, nan, nan], [26.7666857 , 26.94958959, 27.09293974, 27.22997919, 27.34926735, 27.46213334, 27.56217554, 27.64340815, 27.70858312, 27.76643944, 27.81779601, 27.84894116, 27.8738884 , nan, nan, nan, nan, nan, nan], [26.75044662, 26.9431894 , 27.09185618, 27.21408612, 27.32488993, 27.43806899, 27.54212184, 27.62103016, 27.68560784, 27.74986758, 27.8038331 , 27.84443544, 27.87717005, nan, nan, nan, nan, nan, nan]]) - latitude(profile)float6423.04 23.05 23.17 23.56
array([23.04 , 23.049, 23.17 , 23.563])
- longitude(profile)float64-26.74 -26.79 -27.26 -29.41
array([-26.742, -26.793, -27.258, -29.41 ])
- γ_bounds(profile, pressure_, nbnds)float6426.5 26.89 26.74 ... nan nan nan
array([[[26.50348193, 26.89389732], [26.7446015 , 27.08041898], [26.94419658, 27.21653313], [27.10958415, 27.3658585 ], [27.25821569, 27.49112198], [27.37838172, 27.57053787], [27.5026038 , 27.64626874], [27.57542286, 27.71019121], [27.65660674, 27.76214378], [27.71398915, 27.8072677 ], [27.76748342, 27.85096196], [27.81369033, 27.88336041], [27.85381254, 27.90366062], [ nan, nan], [ nan, nan], [ nan, nan], [ nan, nan], [ nan, nan], [ nan, nan]], ... [[26.57815168, 26.92046926], [26.77644627, 27.08640296], [26.95354157, 27.2028318 ], [27.11891194, 27.30446138], [27.22036625, 27.42950204], [27.33629464, 27.54575826], [27.44042784, 27.61698732], [27.55655176, 27.6776193 ], [27.62390475, 27.74723026], [27.68606461, 27.80544632], [27.75448963, 27.84271065], [27.81122621, 27.87825614], [27.84489736, 27.90660547], [ nan, nan], [ nan, nan], [ nan, nan], [ nan, nan], [ nan, nan], [ nan, nan]]]) - p_bounds(profile, pressure_, nbnds)float64206.0 386.0 306.0 ... nan nan nan
array([[[ 206., 386.], [ 306., 496.], [ 406., 596.], [ 506., 696.], [ 606., 796.], [ 706., 896.], [ 806., 996.], [ 906., 1096.], [1006., 1196.], [1106., 1296.], [1206., 1396.], [1306., 1496.], [1406., 1588.], [ nan, nan], [ nan, nan], [ nan, nan], [ nan, nan], [ nan, nan], [ nan, nan]], ... [[ 216., 396.], [ 316., 496.], [ 406., 596.], [ 516., 696.], [ 606., 796.], [ 707., 896.], [ 806., 996.], [ 906., 1096.], [1006., 1196.], [1106., 1296.], [1206., 1396.], [1306., 1496.], [1406., 1589.], [ nan, nan], [ nan, nan], [ nan, nan], [ nan, nan], [ nan, nan], [ nan, nan]]]) - CONFIG_MISSION_NUMBER(profile)int642 2 2 2
array([2, 2, 2, 2])
- PLATFORM_NUMBER(profile)int646900695 6900695 6900695 6900695
array([6900695, 6900695, 6900695, 6900695])
- CYCLE_NUMBER(profile)int64160 170 171 175
array([160, 170, 171, 175])
- DIRECTION(profile)<U1'A' 'A' 'A' 'A'
array(['A', 'A', 'A', 'A'], dtype='<U1')
- ε(profile, pressure_)float642.364e-11 2.536e+52 ... nan nan
- long_name :
- $ε$
- units :
- W/kg
array([[2.36385164e-11, 2.53638804e+52, 1.23612355e-11, 4.08093165e-10, 2.36616530e-11, 6.50976550e-11, 8.69888698e-11, 4.64418643e-12, 3.21800384e-11, 3.56068119e-11, 3.55175343e-11, 7.65259693e-12, 1.18291866e-12, nan, nan, nan, nan, nan, nan], [2.93738809e-12, 1.22175185e-11, 2.31770481e-11, 8.45151757e-11, 2.11869020e+52, 1.88155668e-10, 4.64722296e-12, 3.89930855e-12, 4.19837460e-12, 1.23313837e-12, 6.34953474e-11, 2.32685471e-12, 1.38265182e-11, nan, nan, nan, nan, nan, nan], [3.47038376e-10, 1.10320801e-11, 2.94295925e-11, 1.89775072e-12, 9.00782340e-12, 7.32797440e-11, 9.90698382e-11, 1.18106877e-10, 3.76628714e-12, 6.65098375e+51, 1.10526817e-12, 2.45299491e-12, 8.12042775e-12, nan, nan, nan, nan, nan, nan], [1.60908109e-11, 3.42018225e-10, 3.29671581e+52, 1.93007839e-11, 1.38595097e-11, 4.31023998e-12, 6.20413072e-12, 1.48967278e-11, 9.64215180e-11, 1.40548101e-11, 2.64787087e-11, 4.92849828e-12, 3.49601816e-11, nan, nan, nan, nan, nan, nan]]) - Kρ(profile, pressure_)float642.215e-07 2.794e+56 ... nan nan
- long_name :
- $K_ρ$
- units :
- m²/s
array([[2.21481263e-07, 2.79426456e+56, 1.58740710e-07, 5.86463821e-06, 3.69868264e-07, 1.24050139e-06, 2.16741063e-06, 1.26512261e-07, 1.03158438e-06, 1.31715118e-06, 1.38149761e-06, 3.34096735e-07, 6.80082760e-08, nan, nan, nan, nan, nan, nan], [3.00772589e-08, 1.50085966e-07, 3.45879416e-07, 1.17311252e-06, 3.18836823e+56, 3.57639036e-06, 9.93323487e-08, 9.83019024e-08, 1.26529792e-07, 4.15103435e-08, 2.36654222e-06, 1.09929853e-07, 8.63170289e-07, nan, nan, nan, nan, nan, nan], [3.46817295e-06, 1.40389577e-07, 4.27083804e-07, 2.76038608e-08, 1.48267596e-07, 1.32948125e-06, 2.09503837e-06, 2.96121480e-06, 1.09023681e-07, 2.26911052e+56, 4.83317493e-08, 1.51448779e-07, 4.82523438e-07, nan, nan, nan, nan, nan, nan], [1.51039081e-07, 3.72209964e-06, 4.89649546e+56, 3.40675492e-07, 2.47247423e-07, 7.33711176e-08, 1.27141126e-07, 4.28507732e-07, 2.75056629e-06, 3.99599666e-07, 9.74240908e-07, 2.26886525e-07, 1.67037261e-06, nan, nan, nan, nan, nan, nan]]) - N2mean(profile, pressure_)float642.177e-05 1.852e-05 ... nan nan
- long_name :
- $N²$
- description :
- mean of quadratic fit of N² with pressure
array([[2.17721210e-05, 1.85167895e-05, 1.58851412e-05, 1.41950069e-05, 1.30501507e-05, 1.07049736e-05, 8.18728677e-06, 7.48849494e-06, 6.36354784e-06, 5.51461224e-06, 5.24457360e-06, 4.67255177e-06, 3.54822076e-06, nan, nan, nan, nan, nan, nan], [1.99223511e-05, 1.66058241e-05, 1.36694462e-05, 1.46964535e-05, 1.35555299e-05, 1.07322283e-05, 9.54377778e-06, 8.09176374e-06, 6.76870999e-06, 6.06000523e-06, 5.47324843e-06, 4.31788561e-06, 3.26763742e-06, nan, nan, nan, nan, nan, nan], [2.04124094e-05, 1.60302411e-05, 1.40568710e-05, 1.40244826e-05, 1.23934190e-05, 1.12439586e-05, 9.64643819e-06, 8.13622201e-06, 7.04709457e-06, 5.97926429e-06, 4.66501090e-06, 3.30406348e-06, 3.43303323e-06, nan, nan, nan, nan, nan, nan], [2.17323210e-05, 1.87447118e-05, 1.37345258e-05, 1.15571718e-05, 1.14349326e-05, 1.19837801e-05, 9.95433837e-06, 7.09168986e-06, 7.15104254e-06, 7.17492523e-06, 5.54431573e-06, 4.43122110e-06, 4.26950803e-06, nan, nan, nan, nan, nan, nan]]) - ξvar(profile, pressure_)float640.03379 4.918e+29 ... nan nan
- long_name :
- $ξ$
- description :
- strain variance
array([[3.37863187e-02, 4.91759220e+29, 8.64574714e-02, 1.79437817e-01, 4.53377531e-02, 8.42185820e-02, 1.13460103e-01, 2.75849191e-02, 7.96765524e-02, 9.09414010e-02, 9.34650052e-02, 4.63372655e-02, 2.37349253e-02, nan, nan, nan, nan, nan, nan], [1.25319622e-02, 2.83743395e-02, 4.36897630e-02, 1.88550831e-01, 5.36451233e+29, 2.12286299e-01, 2.40237579e-02, 2.41796852e-02, 2.77797403e-02, 1.60355872e-02, 1.21946244e-01, 2.67238247e-02, 8.50321763e-02, nan, nan, nan, nan, nan, nan], [1.34059905e-01, 2.74593187e-02, 4.83548459e-02, 1.22953552e-02, 2.87514953e-02, 8.66988759e-02, 1.10031269e-01, 1.86350995e-01, 2.70558728e-02, 4.77094126e+29, 1.85391159e-02, 3.19040819e-02, 1.40087732e-01, nan, nan, nan, nan, nan, nan], [2.92010325e-02, 1.55071396e-01, 6.58739166e+29, 4.59072870e-02, 3.71099590e-02, 2.01475619e-02, 2.68769105e-02, 5.05433365e-02, 1.27979368e-01, 4.87684743e-02, 7.75454101e-02, 3.80177342e-02, 1.61830563e-01, nan, nan, nan, nan, nan, nan]]) - ξvargm(profile, pressure_)float640.1436 0.05839 0.4274 ... nan nan
- long_name :
- $ξ_{gm}$
- description :
- GM strain variance
array([[0.1436376 , 0.05838999, 0.42740113, 0.14510577, 0.14536194, 0.14592727, 0.14661366, 0.14682351, 0.14718433, 0.14747948, 0.1475783 , 0.14779683, 0.16510516, nan, nan, nan, nan, nan, nan], [0.14396642, 0.14460049, 0.14522194, 0.34157336, 0.05870487, 0.21669462, 0.1462318 , 0.14664177, 0.14705078, 0.14728735, 0.14749445, 0.1479394 , 0.16523592, nan, nan, nan, nan, nan, nan], [0.14387774, 0.14471732, 0.14513608, 0.14514321, 0.14551436, 0.14579191, 0.14620411, 0.20637409, 0.15493213, 0.05933913, 0.15577253, 0.14838449, 0.36586065, nan, nan, nan, nan, nan, nan], [0.15160309, 0.16099273, 0.05869254, 0.15368172, 0.14574478, 0.14561162, 0.14612198, 0.1469473 , 0.14692856, 0.14692104, 0.14746877, 0.1478932 , 0.23151288, nan, nan, nan, nan, nan, nan]]) - Tzlin(profile, pressure_)float640.02425 0.01908 0.01521 ... nan nan
- long_name :
- $T_z^{lin}$
- description :
- linear fit of T vs pressure
array([[0.02424582, 0.01908242, 0.01520965, 0.01514095, 0.01320212, 0.01088167, 0.00833459, 0.00593619, 0.00140954, 0.00232504, 0.00431977, 0.00417473, 0.00347198, nan, nan, nan, nan, nan, nan], [0.02351858, 0.01774396, 0.01220679, 0.01522098, 0.01229364, 0.01136993, 0.00910831, 0.00674722, 0.00436391, 0.00256962, 0.00364311, 0.00374324, 0.00266813, nan, nan, nan, nan, nan, nan], [0.02477181, 0.01552286, 0.01448086, 0.01336647, 0.01197526, 0.01197241, 0.00871052, 0.00731158, 0.00464031, 0.00242667, 0.0028439 , 0.00283291, 0.00261213, nan, nan, nan, nan, nan, nan], [0.02173839, 0.02071713, 0.01306682, 0.01126987, 0.01223761, 0.01187599, 0.01004565, 0.00507414, 0.00488105, 0.00303271, 0.00362758, 0.00337928, 0.00371936, nan, nan, nan, nan, nan, nan]]) - Tzmean(profile, pressure_)float640.02295 0.01879 0.016 ... nan nan
- long_name :
- $T_z^{quad}$
- description :
- mean of quadratic fit of Tz with pressure; like N² fitting for strain
array([[0.02294775, 0.01879253, 0.01599978, 0.01469202, 0.0133505 , 0.01118349, 0.00857 , 0.00586061, 0.00219561, 0.00182 , 0.004145 , 0.00440283, 0.00356199, nan, nan, nan, nan, nan, nan], [0.02243752, 0.01810576, 0.01339458, 0.01447744, 0.01363468, 0.01064118, 0.00933131, 0.00677 , 0.00433 , 0.00278 , 0.0032897 , 0.00385035, 0.00285688, nan, nan, nan, nan, nan, nan], [0.02258 , 0.01735 , 0.01385838, 0.01369838, 0.012635 , 0.011305 , 0.009235 , 0.00708344, 0.00503532, 0.00244734, 0.00260111, 0.00307237, 0.00261849, nan, nan, nan, nan, nan, nan], [0.02381405, 0.0204163 , 0.01436905, 0.01109787, 0.01154702, 0.01225227, 0.00976526, 0.005985 , 0.00469 , 0.00364 , 0.00346737, 0.00353237, 0.00360339, nan, nan, nan, nan, nan, nan]]) - Tmld(profile)float6496.0 56.0 46.0 45.0
- units :
- m
- description :
- ΔT criterion applied first time
array([96., 56., 46., 45.])
- σmld(profile)float6436.0 46.0 46.0 36.0
- units :
- m
- description :
- Δσ criterion applied first time
array([36., 46., 46., 36.])
- Tmode(profile)float64146.0 66.0 56.0 55.0
- units :
- m
- description :
- ΔT criterion applied second time
array([146., 66., 56., 55.])
- σmode(profile)float64106.0 66.0 56.0 55.0
- units :
- m
- description :
- Δσ criterion applied second time
array([106., 66., 56., 55.])
- χ(profile, pressure_)float642.333e-10 1.974e+53 ... nan nan
- long_name :
- $χ$
- units :
- °C²/s
array([[2.33263671e-10, 1.97364115e+53, 8.12729831e-11, 2.53182794e-09, 1.31847653e-10, 3.10299895e-10, 3.18370598e-10, 8.69055809e-12, 9.94589724e-12, 8.72587848e-12, 4.74710895e-11, 1.29528529e-11, 1.72574648e-12, nan, nan, nan, nan, nan, nan], [3.02843189e-11, 9.84019085e-11, 1.24111757e-10, 4.91759850e-10, 1.18546403e+53, 8.09943173e-10, 1.72984105e-11, 9.01092374e-12, 4.74459075e-12, 6.41616514e-13, 5.12219620e-11, 3.25946916e-12, 1.40899748e-11, nan, nan, nan, nan, nan, nan], [3.53654152e-09, 8.45208560e-11, 1.64046943e-10, 1.03594927e-11, 4.73398504e-11, 3.39823356e-10, 3.57351501e-10, 2.97158229e-10, 5.52847350e-12, 2.71816440e+51, 6.54002764e-13, 2.85919661e-12, 6.61682081e-12, nan, nan, nan, nan, nan, nan], [1.71311214e-10, 3.10292992e-09, 2.02195378e+53, 8.39171002e-11, 6.59327638e-11, 2.20286861e-11, 2.42484118e-11, 3.06984881e-11, 1.21003392e-10, 1.05890624e-11, 2.34259653e-11, 5.66202574e-12, 4.33777088e-11, nan, nan, nan, nan, nan, nan]]) - KtTz(profile, pressure_)float645.082e-09 5.251e+54 ... nan nan
- long_name :
- $K_ρθ_z$
- units :
- °Cm/s
array([[5.08249607e-09, 5.25113107e+54, 2.53981604e-09, 8.61633765e-08,
        4.93792782e-09, 1.38731296e-08, 1.85747116e-08, 7.41438520e-10,
        2.26495389e-09, 2.39721725e-09, 5.72630756e-09, 1.47097006e-09,
        2.42244755e-10,            nan,            nan,            nan,
                   nan,            nan,            nan],
       [6.74858985e-10, 2.71742024e-09, 4.63290956e-09, 1.69836633e-08,
        4.34723813e+54, 3.80570162e-08, 9.26901220e-10, 6.65503924e-10,
        5.47874109e-10, 1.15398704e-10, 7.78520827e-09, 4.23268807e-10,
        2.46597320e-09,            nan,            nan,            nan,
                   nan,            nan,            nan],
       [7.83113582e-08, 2.43575935e-09, 5.91869043e-09, 3.78128282e-10,
        1.87336139e-09, 1.50297834e-08, 1.93476757e-08, 2.09755732e-08,
        5.48969276e-10, 5.55329427e+53, 1.25716144e-10, 4.65307337e-10,
        1.26348153e-09,            nan,            nan,            nan,
                   nan,            nan,            nan],
       [3.59685199e-09, 7.59914940e-08, 7.03579687e+54, 3.78077369e-09,
        2.85496987e-09, 8.98963103e-10, 1.24156562e-09, 2.56461883e-09,
        1.29001521e-08, 1.45454216e-09, 3.37805667e-09, 8.01447860e-10,
        6.01900891e-09,            nan,            nan,            nan,
                   nan,            nan,            nan]])