TIW DCL#
import dask_jobqueue
if "client" in locals():
client.close()
if "cluster" in locals():
cluster.close()
env = {"OMP_NUM_THREADS": "3", "NUMBA_NUM_THREADS": "3"}
# cluster = distributed.LocalCluster(
# n_workers=8,
# threads_per_worker=1,
# env=env
# )
if "cluster" in locals():
del cluster
cluster = dask_jobqueue.SLURMCluster(
cores=1,
processes=1,
memory="25GB",
walltime="08:00:00",
project="NCGD0046",
scheduler_options=dict(dashboard_address=":9797"),
)
# cluster = dask_jobqueue.PBSCluster(
# cores=9, processes=9, memory="108GB", walltime="02:00:00", project="NCGD0043",
# env_extra=env,
# )
cluster.scale(6)
# %load_ext autoreload
# %autoreload 2
%matplotlib inline
import dask
import distributed
import holoviews as hv
import hvplot.xarray
import matplotlib as mpl
import matplotlib.dates as mdates
import matplotlib.pyplot as plt
import matplotlib.units as munits
import numpy as np
import pandas as pd
import seawater as sw
import xarray as xr
from holoviews import opts
import cf_xarray
import dcpy
import pump
# import hvplot.xarray
# import facetgrid
mpl.rcParams["savefig.dpi"] = 300
mpl.rcParams["savefig.bbox"] = "tight"
mpl.rcParams["figure.dpi"] = 140
munits.registry[np.datetime64] = mdates.ConciseDateConverter()
xr.set_options(keep_attrs=True)
hv.extension("bokeh")
# hv.opts.defaults(opts.Image(fontscale=1.5), opts.Curve(fontscale=1.5))
print(dask.__version__)
print(distributed.__version__)
print(xr.__version__)
def unpack(d):
val = []
for k, v in d.items():
if isinstance(v, dict):
val.extend(unpack(v))
else:
val.append(v)
return val
xr.DataArray([1.0])


2.23.0
2.23.0
0.16.0
<xarray.DataArray (dim_0: 1)> array([1.]) Dimensions without coordinates: dim_0
- dim_0: 1
- 1.0
array([1.])
client = distributed.Client(cluster)
client
Client
|
Cluster
|
from dask.cache import Cache
cache = Cache(5e9, 0.4) # Leverage two gigabytes of memory
cache.register() # Turn cache on globally
gcm1 = pump.Model(
"/glade/u/home/dcherian/pump/TPOS_MITgcm_1_hb/HOLD_NC_LINKS/",
name="gcm1",
full=False,
budget=False,
)
# gcm1.tao.load()
# gcm1.tao = xr.merge([gcm1.tao, pump.calc.get_tiw_phase(gcm1.tao.v)])
# gcm1.surface["zeta"] = xr.open_dataset(gcm1.dirname + "obs_subset/surface_zeta.nc").zeta
# gcm1.surface = gcm1.surface.chunk({"time": 1})
# gcm1.surface["zeta"] = gcm1.surface.v.differentiate("longitude") - gcm1.surface.u.differentiate("latitude")
calc uz
calc vz
calc S2
calc N2
calc shred2
Calc Ri
gcm1.tao["mld"] = pump.calc.get_mld(gcm1.tao.dens)
gcm1.tao["dcl"] = pump.calc.get_dcl_base_Ri(gcm1.tao)
read data#
model = gcm1
periods = np.arange(1, 9)
longitudes = [-110] # -140, -155]
tslice = slice(None, "1996-03-01")
subset_fields = [
"Jq",
"theta",
"salt",
"dens",
"u",
"v",
"w",
"KPP_diffusivity",
"sst",
"Ri",
]
anomalize_fields = ["u", "v", "w", "theta", "salt", "sst"]
anomalize_over = ["time"]
import xfilter
surf = (
model.surface.sel(longitude=longitudes, method="nearest")
.assign_coords(longitude=longitudes)
.drop("depth")
)
tao = model.tao.sel(longitude=longitudes, latitude=0).chunk({"longitude": 1})
# tao["time"] = model.full.time
sst = surf.theta.sel(longitude=longitudes).chunk({"longitude": 1, "time": -1})
sstfilt = pump.calc.tiw_avg_filter_sst(sst, "bandpass") # .persist()
# filter out daily cycle
subdaily_sst = xfilter.lowpass(
surf.theta.chunk({"time": -1, "latitude": 10}),
coord="time",
freq=2,
cycles_per="D",
).reindex(time=tao.time)
subdaily_sst.attrs["long_name"] = "2 day filtered SST"
subdaily_sst.attrs["units"] = "C"
# surf["theta"] = (
# sst.pipe(xfilter.lowpass, coord="time", freq=1/7, cycles_per="D", num_discard=0, method="pad")
# )
Tx = model.surface.theta.differentiate("longitude")
Ty = model.surface.theta.differentiate("latitude")
gradT = (
np.hypot(Tx, Ty)
.sel(longitude=longitudes, method="nearest")
.assign_coords(longitude=longitudes)
.drop_vars("depth")
)
# with performance_report("profiles/phase-period.html"):
tiw_phase, period, tiw_ptp = dask.compute(
pump.calc.get_tiw_phase_sst(
sstfilt.chunk({"longitude": 1}), gradT.chunk({"longitude": 1, "time": -1})
),
)[0]
full = pump.utils.read_gcm1_zarr_subset(gcm1)
# needed for apply_ufunc later
valid_subset_fields = list(set(subset_fields).intersection(set(full.data_vars)))
full_subset = full[valid_subset_fields]
full_subset = pump.calc_reduced_shear(
full_subset.sel(depth=slice(0, -200))
.sel(longitude=longitudes)
.sel(time=tslice)
.chunk({"longitude": 1, "latitude": -1, "time": 36})
.assign_coords(
period=period,
tiw_phase=tiw_phase,
)
)
# full_subset["uz"] = full_subset.u.differentiate("depth")
# full_subset["vz"] = full_subset.v.differentiate("depth")
# full_subset["S2"] = full_subset.uz ** 2 + full_subset.vz ** 2
# full_subset["N2"] = -9.81/1025 * full_subset.dens.differentiate("depth")
# full_subset["Ri"] = full_subset.N2 / full_subset.S2
full_subset["sst"] = surf.theta.sel(
time=full_subset.time
) # full_subset.theta.isel(depth=0)
# if "zeta" in surf:
# full["ssvor"] = surf.zeta
euc_max = tao.euc_max.reset_coords(drop=True)
mld = pump.calc.get_mld(full_subset.dens)
dcl_base = pump.calc.get_dcl_base_Ri(full_subset, mld, euc_max)
full_subset = full_subset.assign_coords(mld=mld, dcl_base=dcl_base, eucmax=tao.euc_max)
single TIW period analysis#
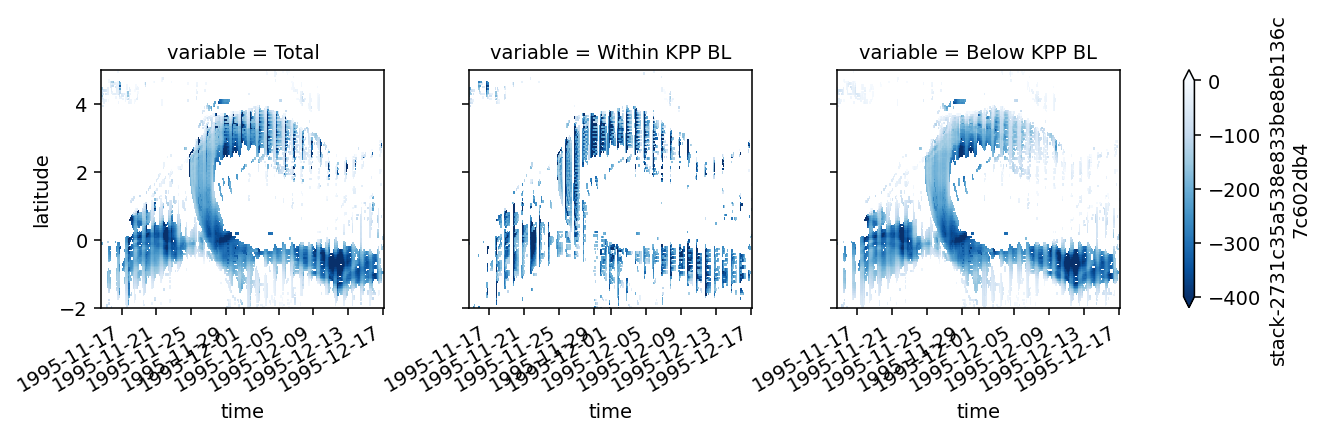
Paritioning mixing within KPP interior & KPP BL#
Jq = xr.Dataset()
Jq["Total DCL"] = period4.Jq.where(period4.dcl_mask)
Jq["Within KPP BL"] = period4.Jq.where(
period4.dcl_mask & (period4.depth > -period4.KPPhbl)
)
Jq["Below KPP BL"] = period4.Jq.where(
period4.dcl_mask & (period4.depth <= -period4.KPPhbl)
)
Jq = Jq.isel(longitude=1).to_array().load()
(
Jq.mean("depth").plot(
col="variable", robust=True, x="time", **pump.plot.cmaps["Jq"], ylim=(-2, 5)
)
)
<xarray.plot.facetgrid.FacetGrid at 0x2b559b58c820>
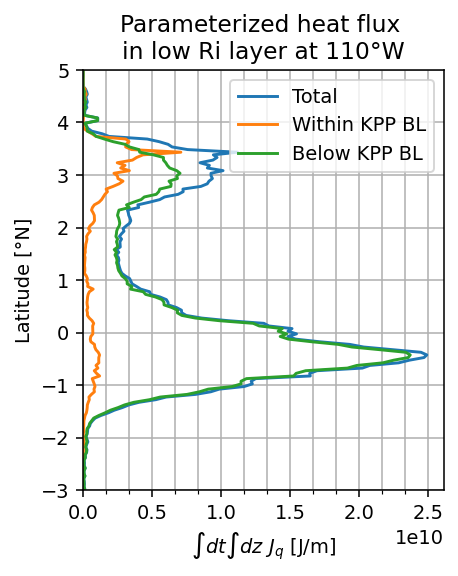
f, ax = plt.subplots(1, 1, constrained_layout=1)
(
Jq.fillna(0)
.integrate("time", datetime_unit="s")
.integrate("depth")
.plot.line(
hue="variable",
y="latitude",
ylim=(-3, 5),
xlim=(0, None),
add_legend=False,
ax=ax,
)
)
ax.legend(Jq["variable"].values, loc="upper right")
ax.grid(True, which="both")
ax.xaxis.set_minor_locator(mpl.ticker.AutoMinorLocator(3))
ax.set_xlabel("$∫dt∫dz$ $J_q$ [J/m]")
ax.set_title("Parameterized heat flux \nin low Ri layer at 110°W")
f.set_size_inches((dcpy.plots.pub_fig_width("jpo", "single column"), 4))
f.savefig("images/kpp-deep-cycle-bl-int-heat-flux.png")
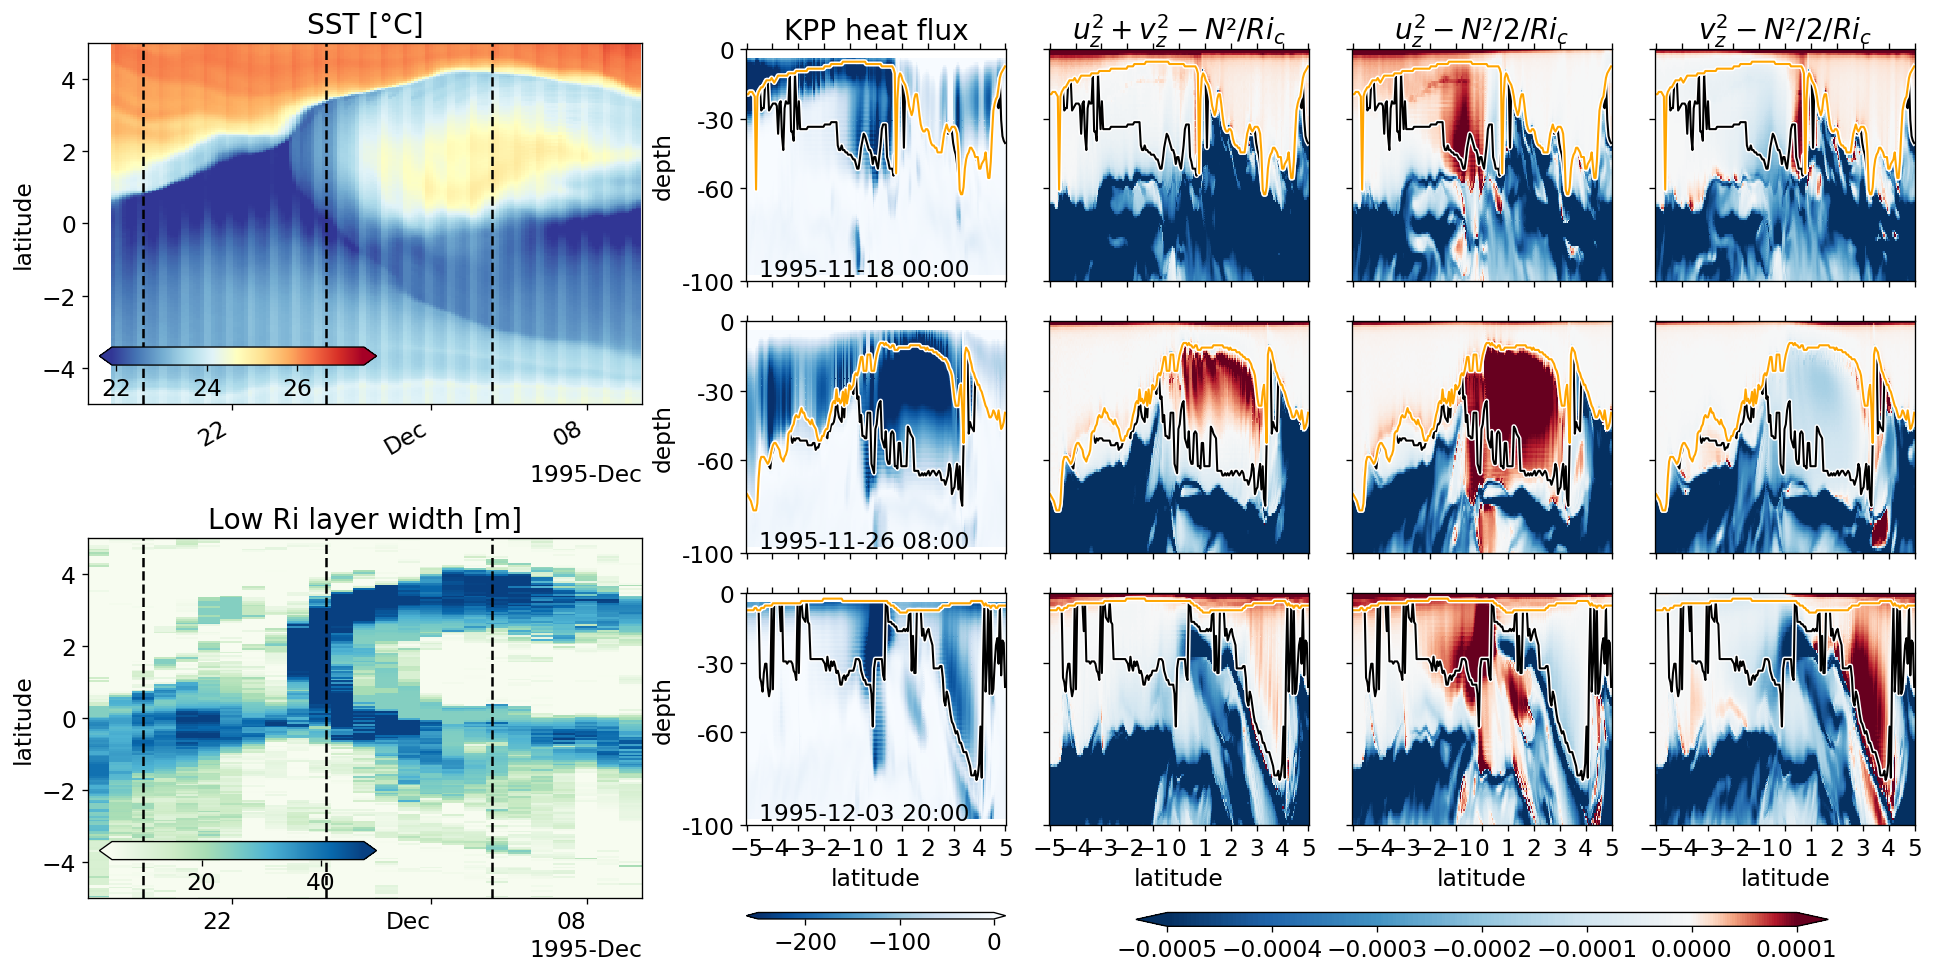
Reduced shear analysis#
pump.plot.plot_tiw_period_snapshots(
full_subset,
lon=-110,
period=4,
times=[
"1995-11-18 00:00",
# "1995-11-24 18:00",
"1995-11-26 06:00",
"1995-12-03 18:00",
# "1995-12-09 18:00",
],
)
plt.gcf().savefig("images/sst-dcl-shred2.png", dpi=150)
/glade/u/home/dcherian/python/xarray/xarray/core/resample.py:176: FutureWarning: This DataArray contains multi-dimensional coordinates. In the future, the dimension order of these coordinates will be restored as well unless you specify restore_coord_dims=False.
super().__init__(*args, **kwargs)
shred2 = (
(full_subset.uz**2 + full_subset.vz**2 - 1 / 0.4 * full_subset.N2).sel(
time="1995-12-03 20:00", longitude=-110
)
).compute()
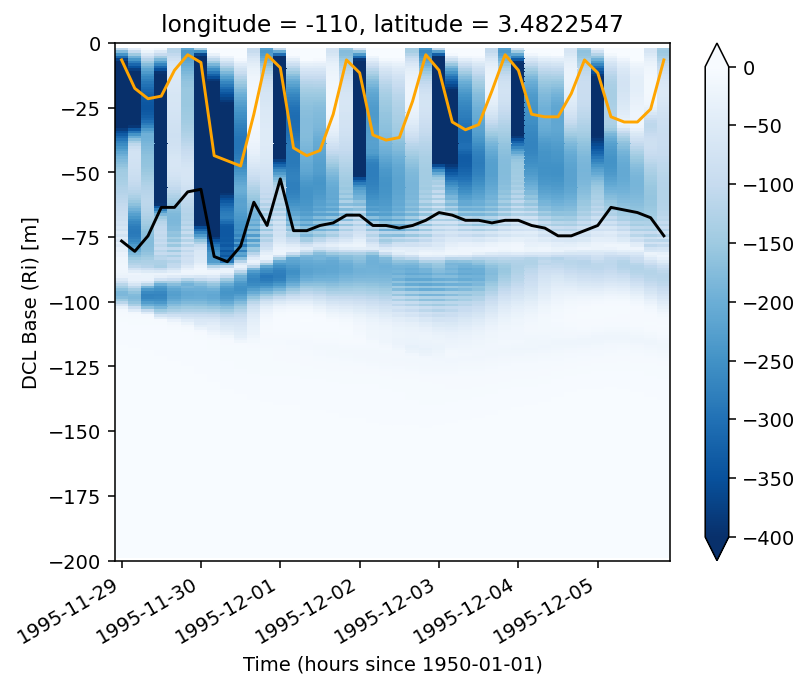
are we seeing a deep cycle off the equator? Yes!#
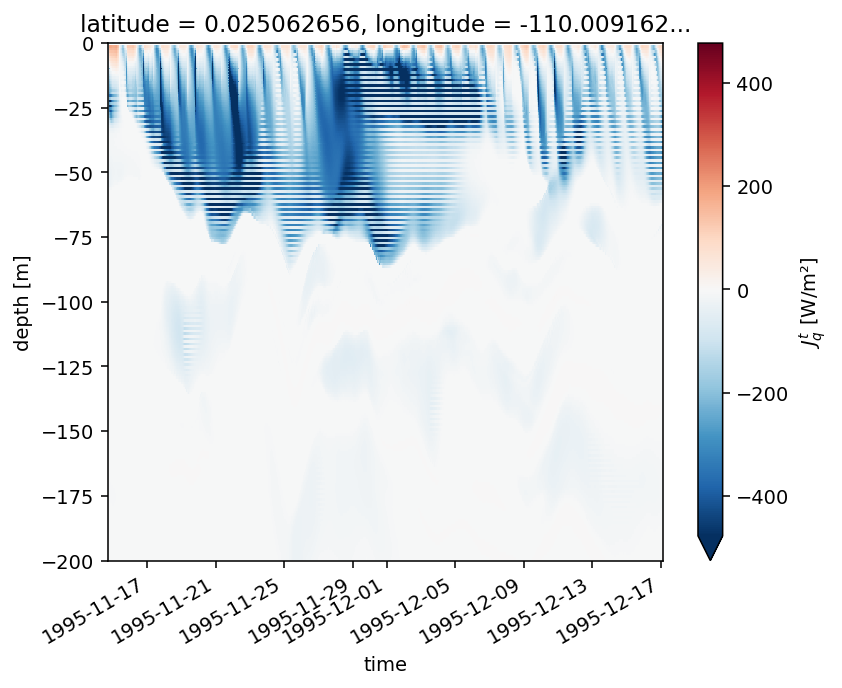
Jq#
sub = full_subset.sel(longitude=-110, latitude=3.5, method="nearest").sel(
time=slice("1995-11-29", "1995-12-05")
)
sub.Jq.rolling(depth=3, center=True).mean().plot(
y="depth",
cmap=mpl.cm.Blues_r,
vmax=0,
vmin=-400,
)
sub.mld.plot(color="orange", x="time")
sub.dcl_base.plot(color="k", x="time")
[<matplotlib.lines.Line2D at 0x2ba424ec7860>]
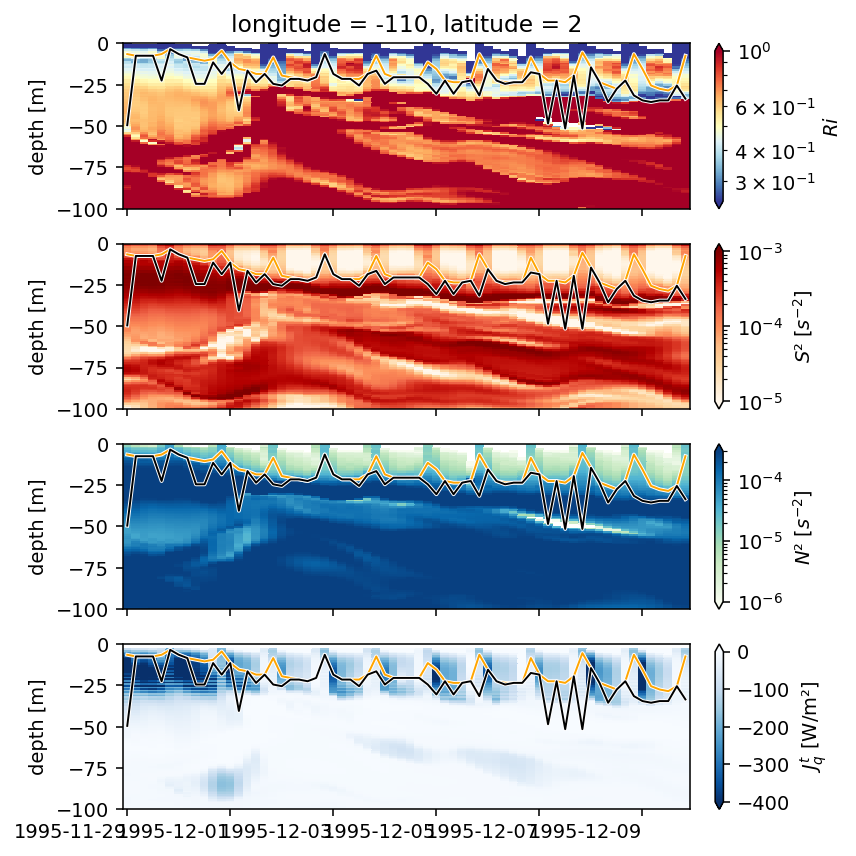
deep cycle summary#
Jq, N2, S2, Ri
ds = (
full_subset[["Ri", "S2", "N2", "Jq"]]
.sel(latitude=2, method="nearest")
.sel(time=slice("1995-11-29", "1995-12-09"), depth=slice(-100))
.assign_coords(latitude=2)
.squeeze()
.compute()
)
ds["Jq"] = ds.Jq.rolling(depth=2).mean()
del ds.time.attrs["long_name"]
ds.depth.attrs["units"] = "m"
ds.Jq.attrs["long_name"] = "$J^t_q$"
ds.Jq.attrs["units"] = "W/m²"
ds.S2.attrs["long_name"] = "$S²$"
ds.S2.attrs["units"] = "$s^{-2}$"
ds.Ri.attrs["long_name"] = "$Ri$"
ds.N2.attrs["long_name"] = "$N²$"
ds.N2.attrs["units"] = "$s^{-2}$"
f, axx = plt.subplots(4, 1, sharex=True, sharey=True, constrained_layout=True)
ax = dict(zip(["Ri", "S2", "N2", "Jq"], axx))
kwargs = {
"S2": dict(cmap=mpl.cm.OrRd, norm=mpl.colors.LogNorm(1e-5, 1e-3)),
"Jq": dict(
cmap=mpl.cm.Blues_r,
vmax=0,
vmin=-400,
),
"Ri": dict(cmap=mpl.cm.RdYlBu_r, center=0.5, norm=mpl.colors.LogNorm(0.25, 1)),
"N2": dict(cmap=mpl.cm.GnBu, norm=mpl.colors.LogNorm(1e-6, 3e-4)),
}
for var in kwargs.keys():
ds[var].plot(ax=ax[var], x="time", y="depth", **kwargs[var])
def plot(ax):
ds.mld.plot(ax=ax, color="w", x="time", _labels=False, lw=2)
ds.mld.plot(ax=ax, color="orange", x="time", _labels=False, lw=1)
ds.dcl_base.plot(ax=ax, color="w", x="time", _labels=False, lw=2)
ds.dcl_base.plot(ax=ax, color="k", x="time", _labels=False, lw=1)
[plot(aa) for aa in axx]
[aa.set_xlabel("") for aa in axx]
[aa.set_title("") for aa in axx[1:]]
[tt.set_rotation(0) for tt in axx[-1].get_xticklabels()]
f.set_size_inches((6, 6))
# f.savefig("images/110-deep-cycle-2.png")
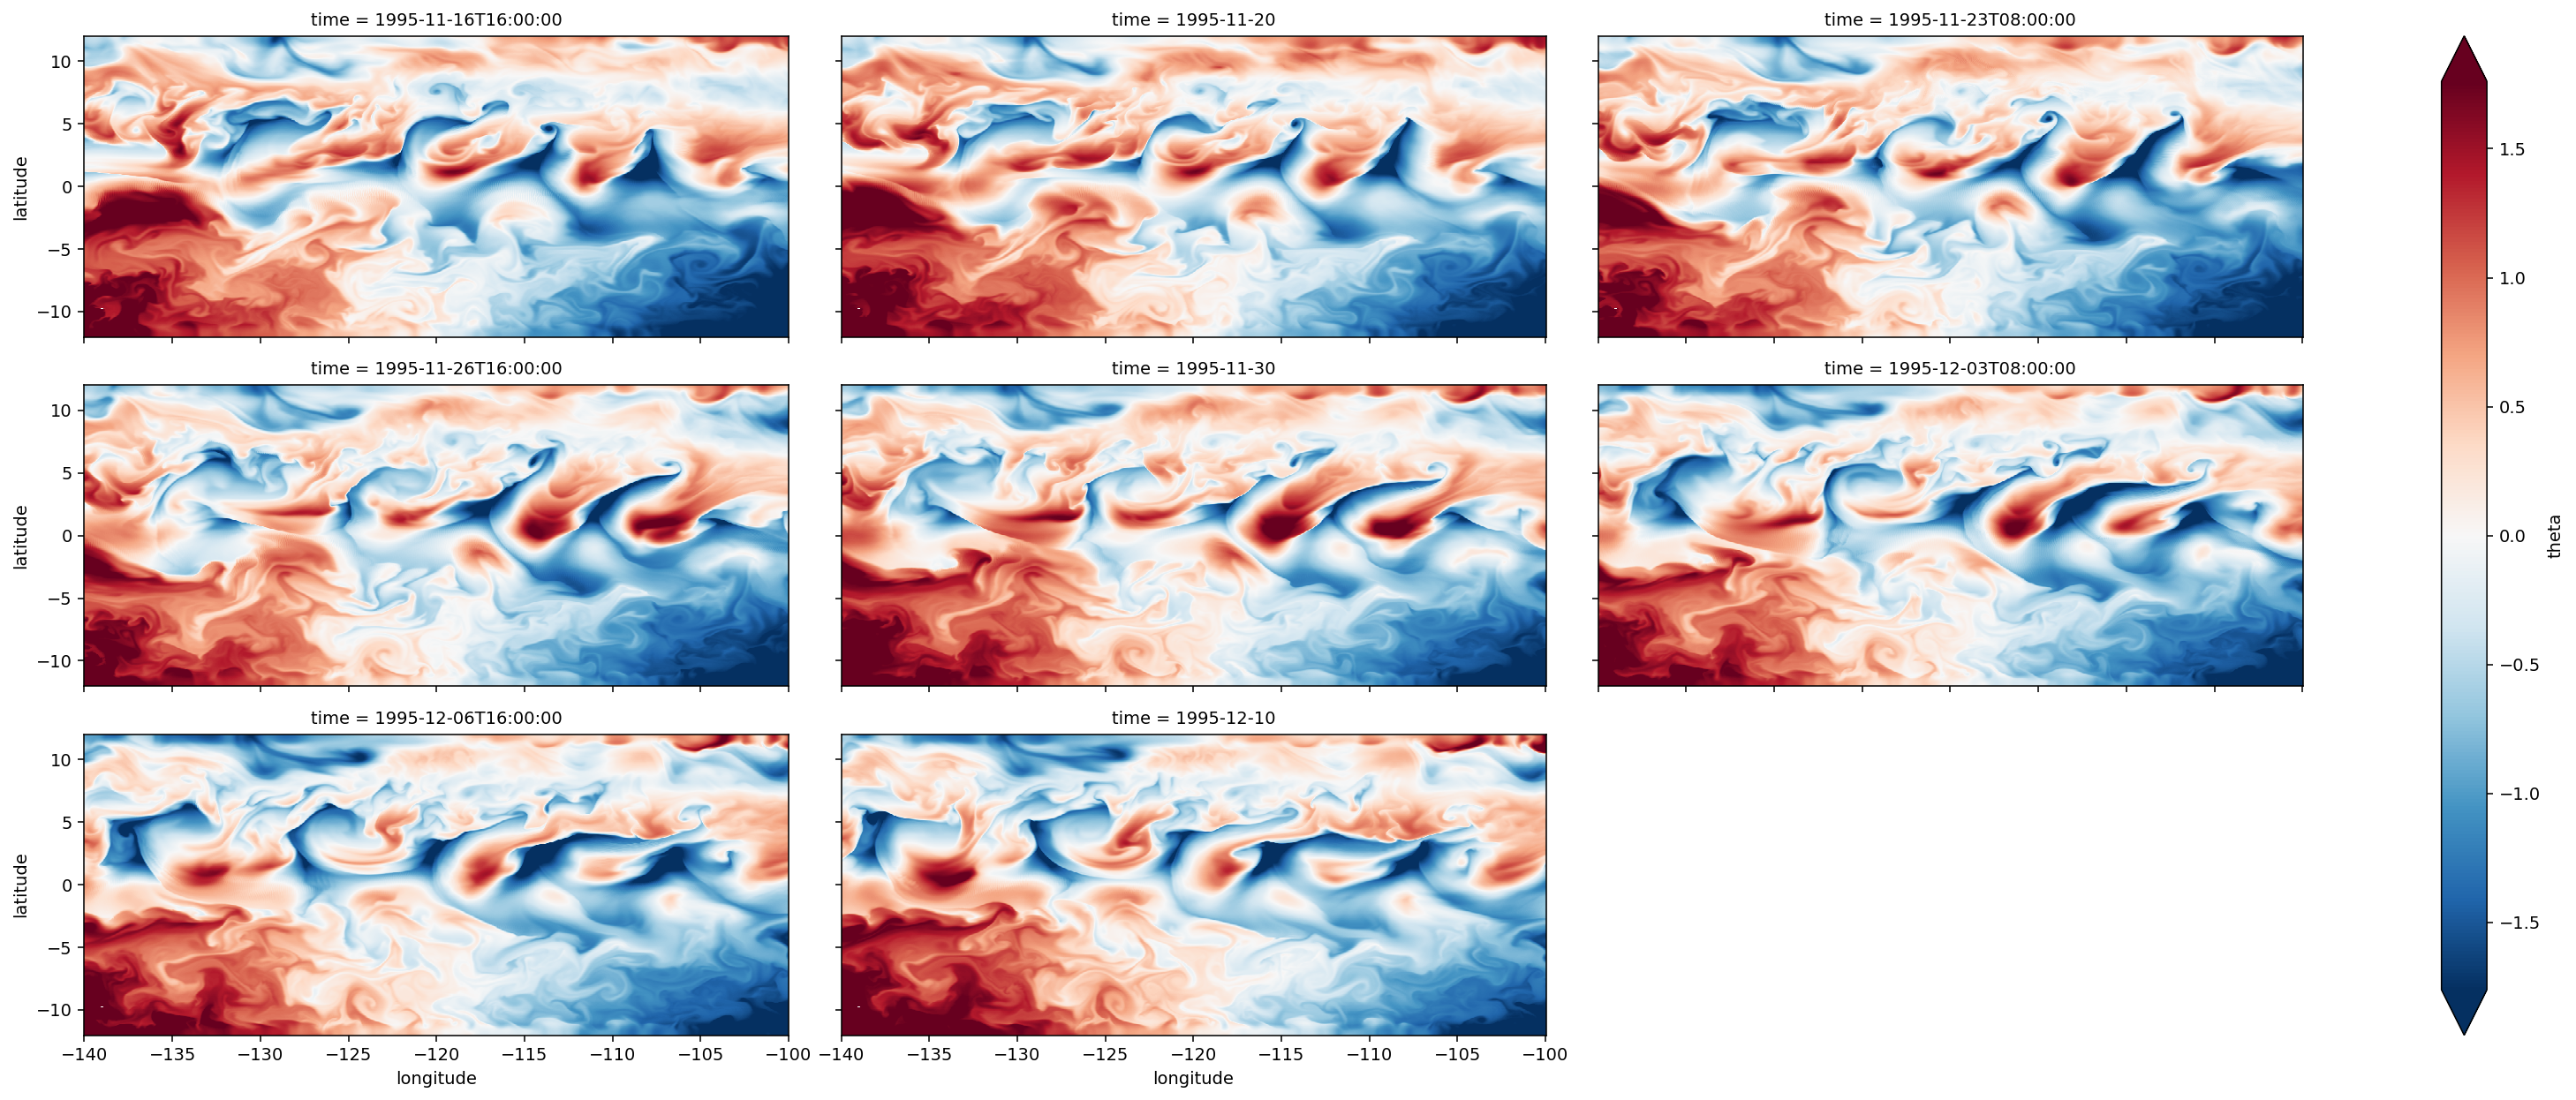
Deep cycle forcing: shear, velocity & vorticity#
subset = (
full_subset[["u", "v"]].sel(
longitude=-110,
latitude=slice(-3, 6),
time=(full_subset.period == 4).squeeze().reset_coords(drop=True),
)
).compute()
ssta4 = (
gcm1.surface.theta.sel(time=full_subset.time)
.sel(
longitude=slice(-140, -100),
time=(full_subset.period == 4).squeeze().reset_coords(drop=True),
)
.pipe(lambda x: x - x.mean(["longitude", "time"]))
.reset_coords(drop=True)
)
ssta4.isel(time=slice(None, None, 20)).plot(
x="longitude", y="latitude", col="time", col_wrap=3, robust=True, aspect=2.5
)
<xarray.plot.facetgrid.FacetGrid at 0x2b3a768f65f8>
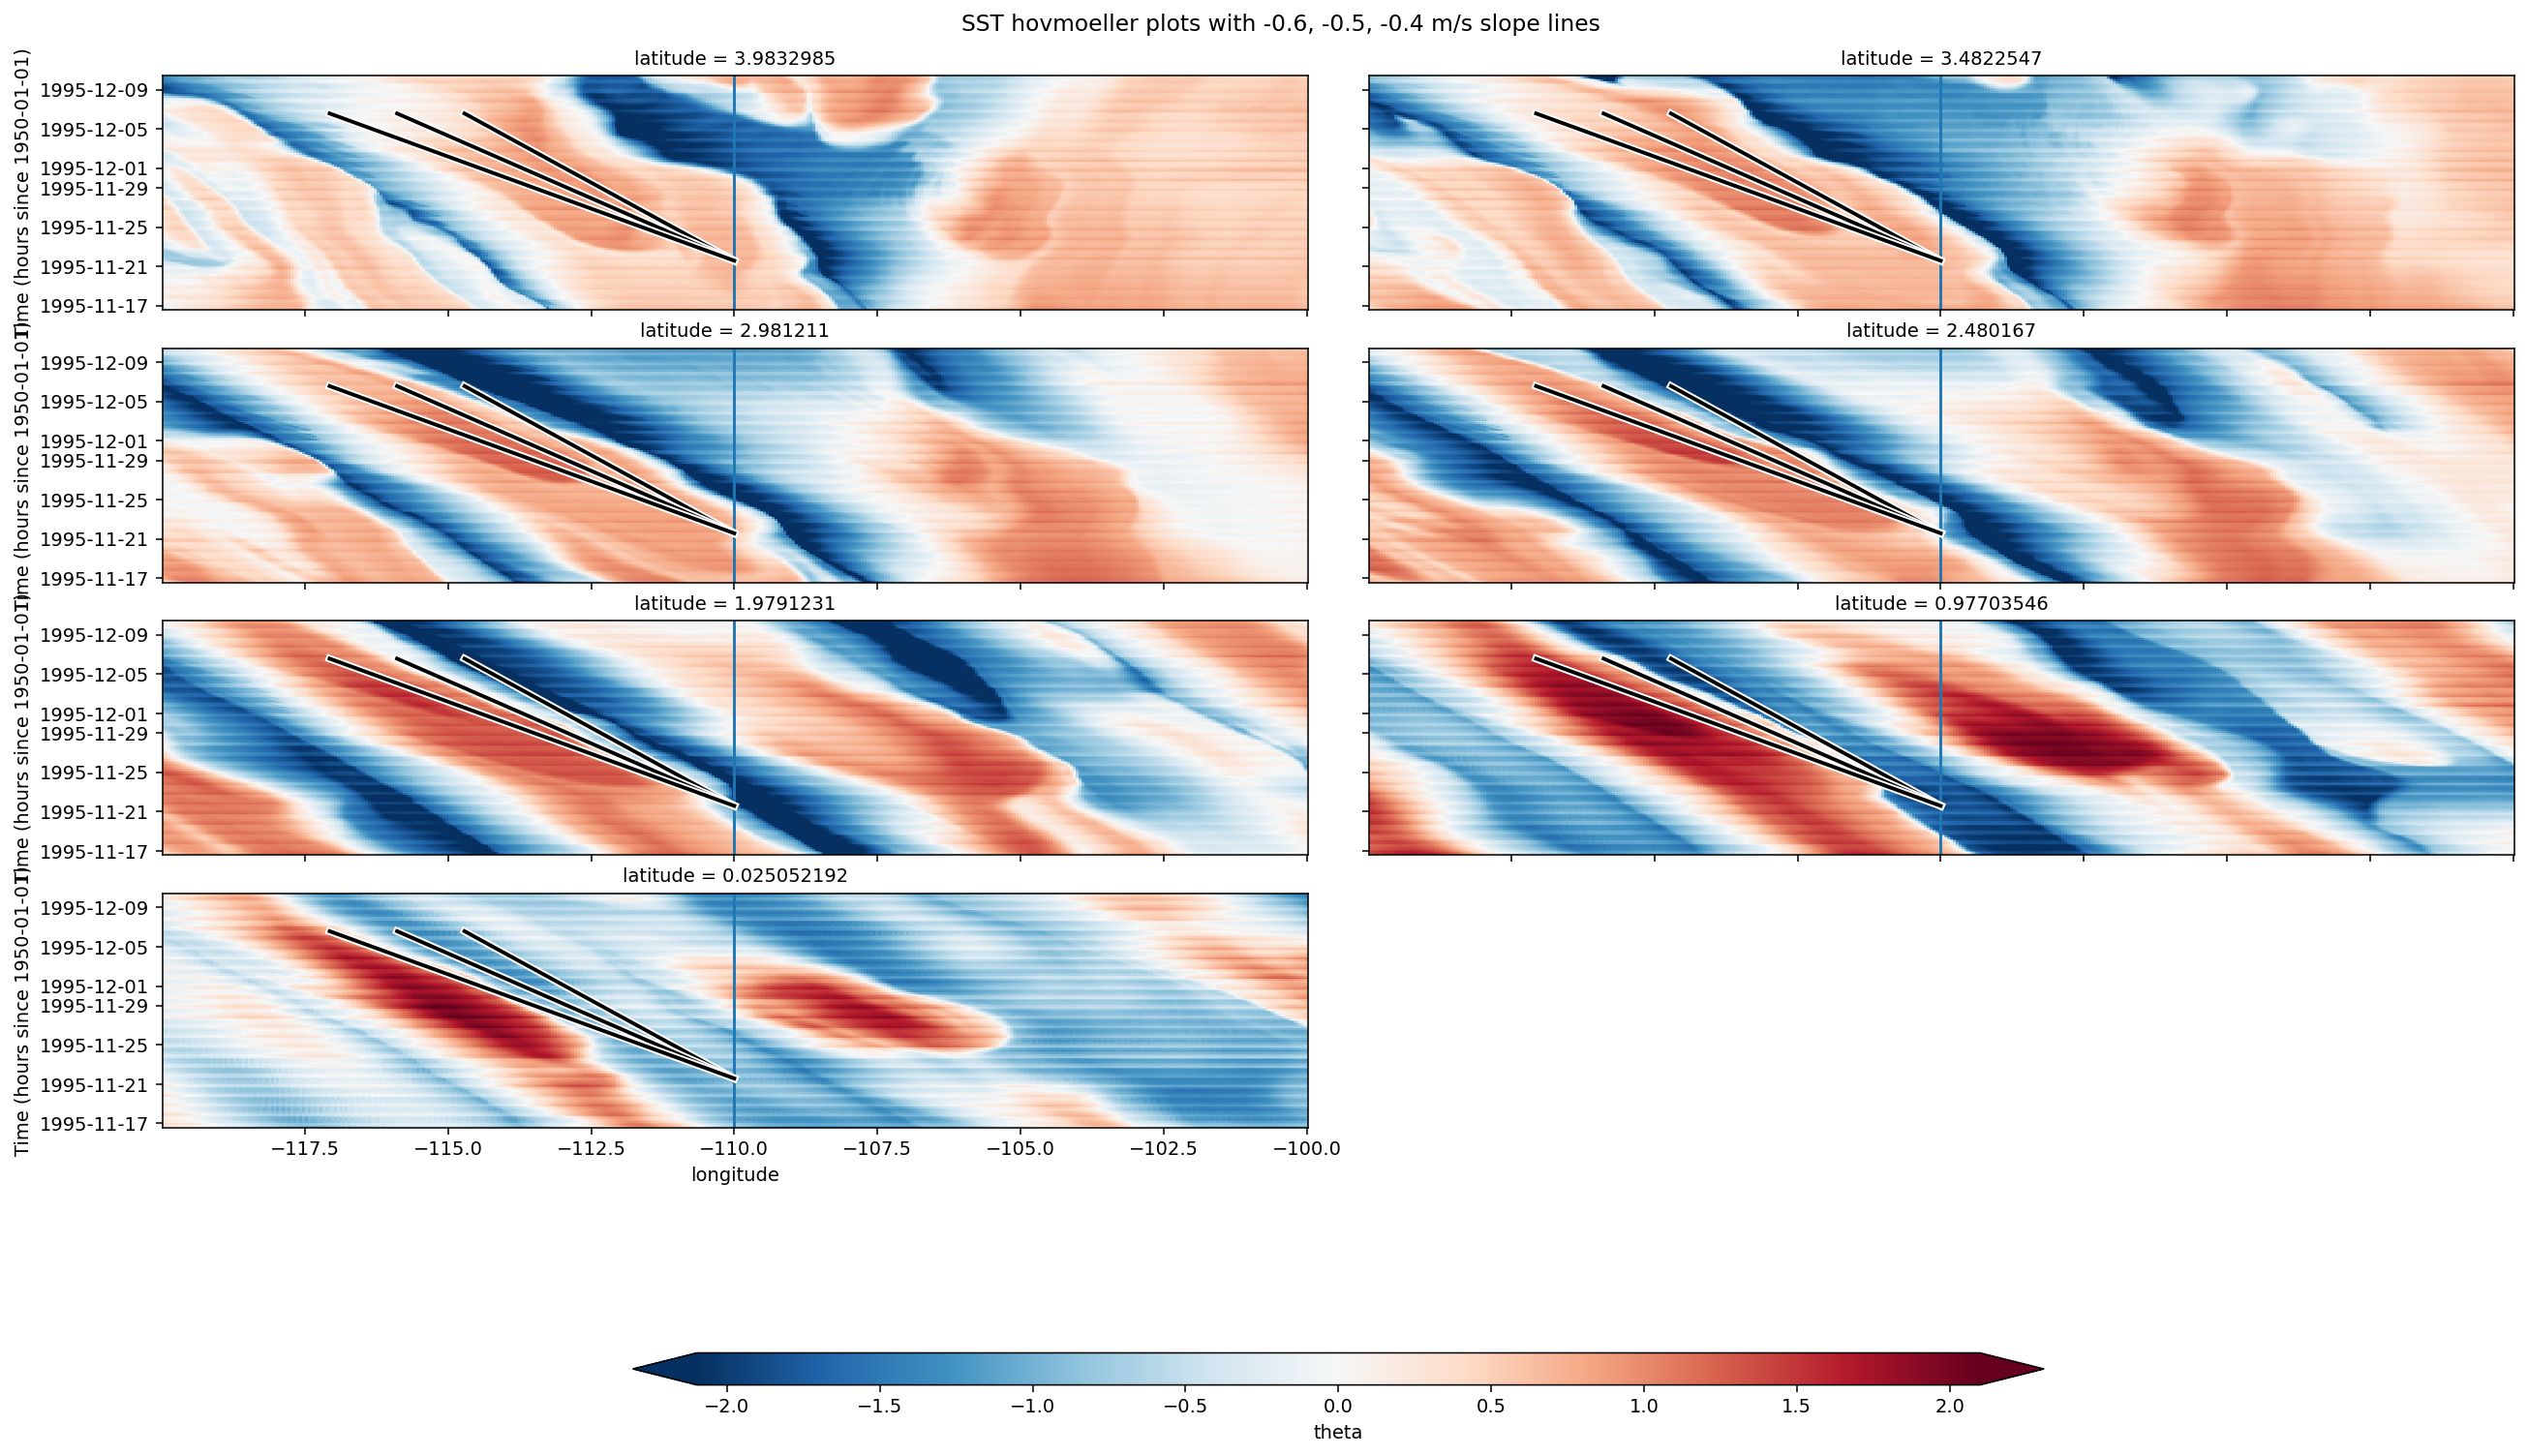
propagation velocity from hovmoeller plots#
Using 0.5m/s barotropic shift in u works OK. This is inferred from SST, SSV plots.
SST#
fg = (
ssta4.sel(longitude=slice(-120, -100))
.sel(latitude=[0, 1, 2, 2.5, 3, 3.5, 4], method="nearest")
.sortby("latitude", ascending=False)
.plot(
x="longitude",
y="time",
col="latitude",
col_wrap=2,
robust=True,
aspect=3,
cbar_kwargs={"orientation": "horizontal", "shrink": 0.6, "aspect": 40},
)
)
[plot_reference(ax) for ax in fg.axes.flat]
fg.fig.suptitle("SST hovmoeller plots with -0.6, -0.5, -0.4 m/s slope lines", y=1.01)
Text(0.5, 1.01, 'SST hovmoeller plots with -0.6, -0.5, -0.4 m/s slope lines')
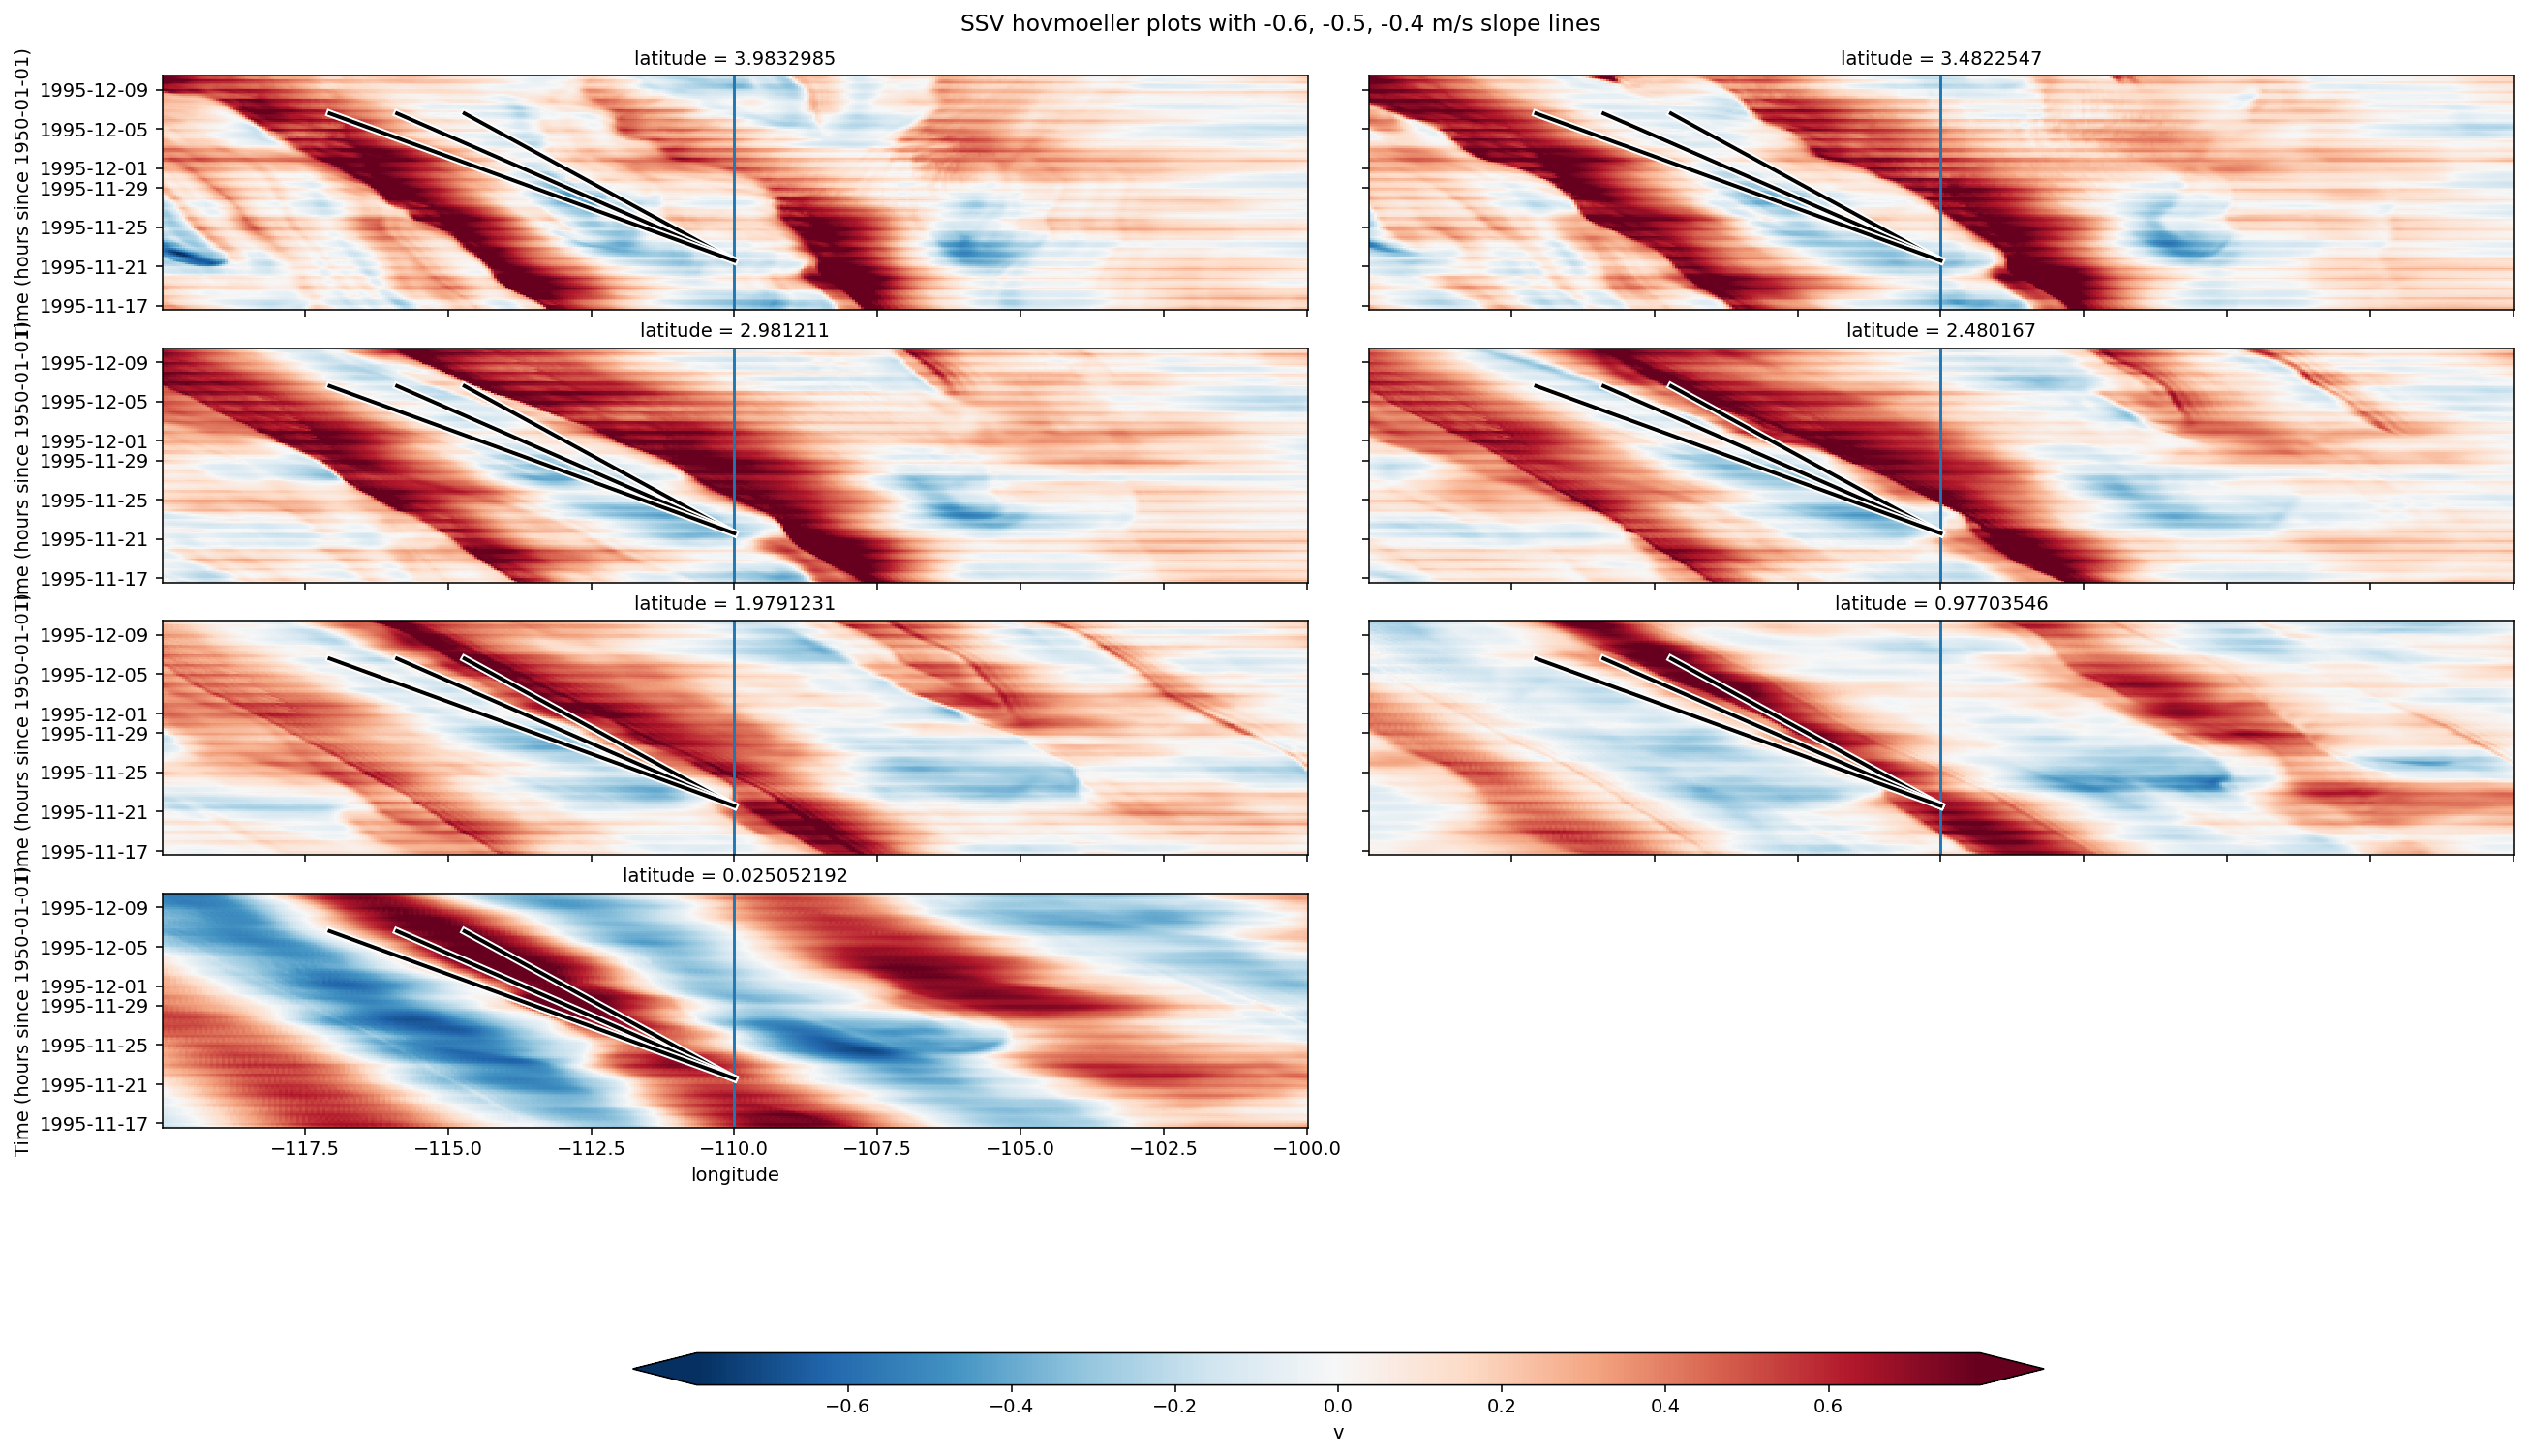
SSV#
ssv = (
gcm1.surface.v.sel(time=full_subset.time)
.sel(
longitude=slice(-140, -100),
time=(full_subset.period == 4).squeeze().reset_coords(drop=True),
)
.reset_coords(drop=True)
)
fg = (
ssv.sel(longitude=slice(-120, -100))
.sel(latitude=[0, 1, 2, 2.5, 3, 3.5, 4], method="nearest")
.sortby("latitude", ascending=False)
.plot(
x="longitude",
y="time",
col="latitude",
col_wrap=2,
robust=True,
aspect=3,
cbar_kwargs={"orientation": "horizontal", "shrink": 0.6, "aspect": 40},
)
)
[plot_reference(ax) for ax in fg.axes.flat]
fg.fig.suptitle("SSV hovmoeller plots with -0.6, -0.5, -0.4 m/s slope lines", y=1.01)
Text(0.5, 1.01, 'SSV hovmoeller plots with -0.6, -0.5, -0.4 m/s slope lines')
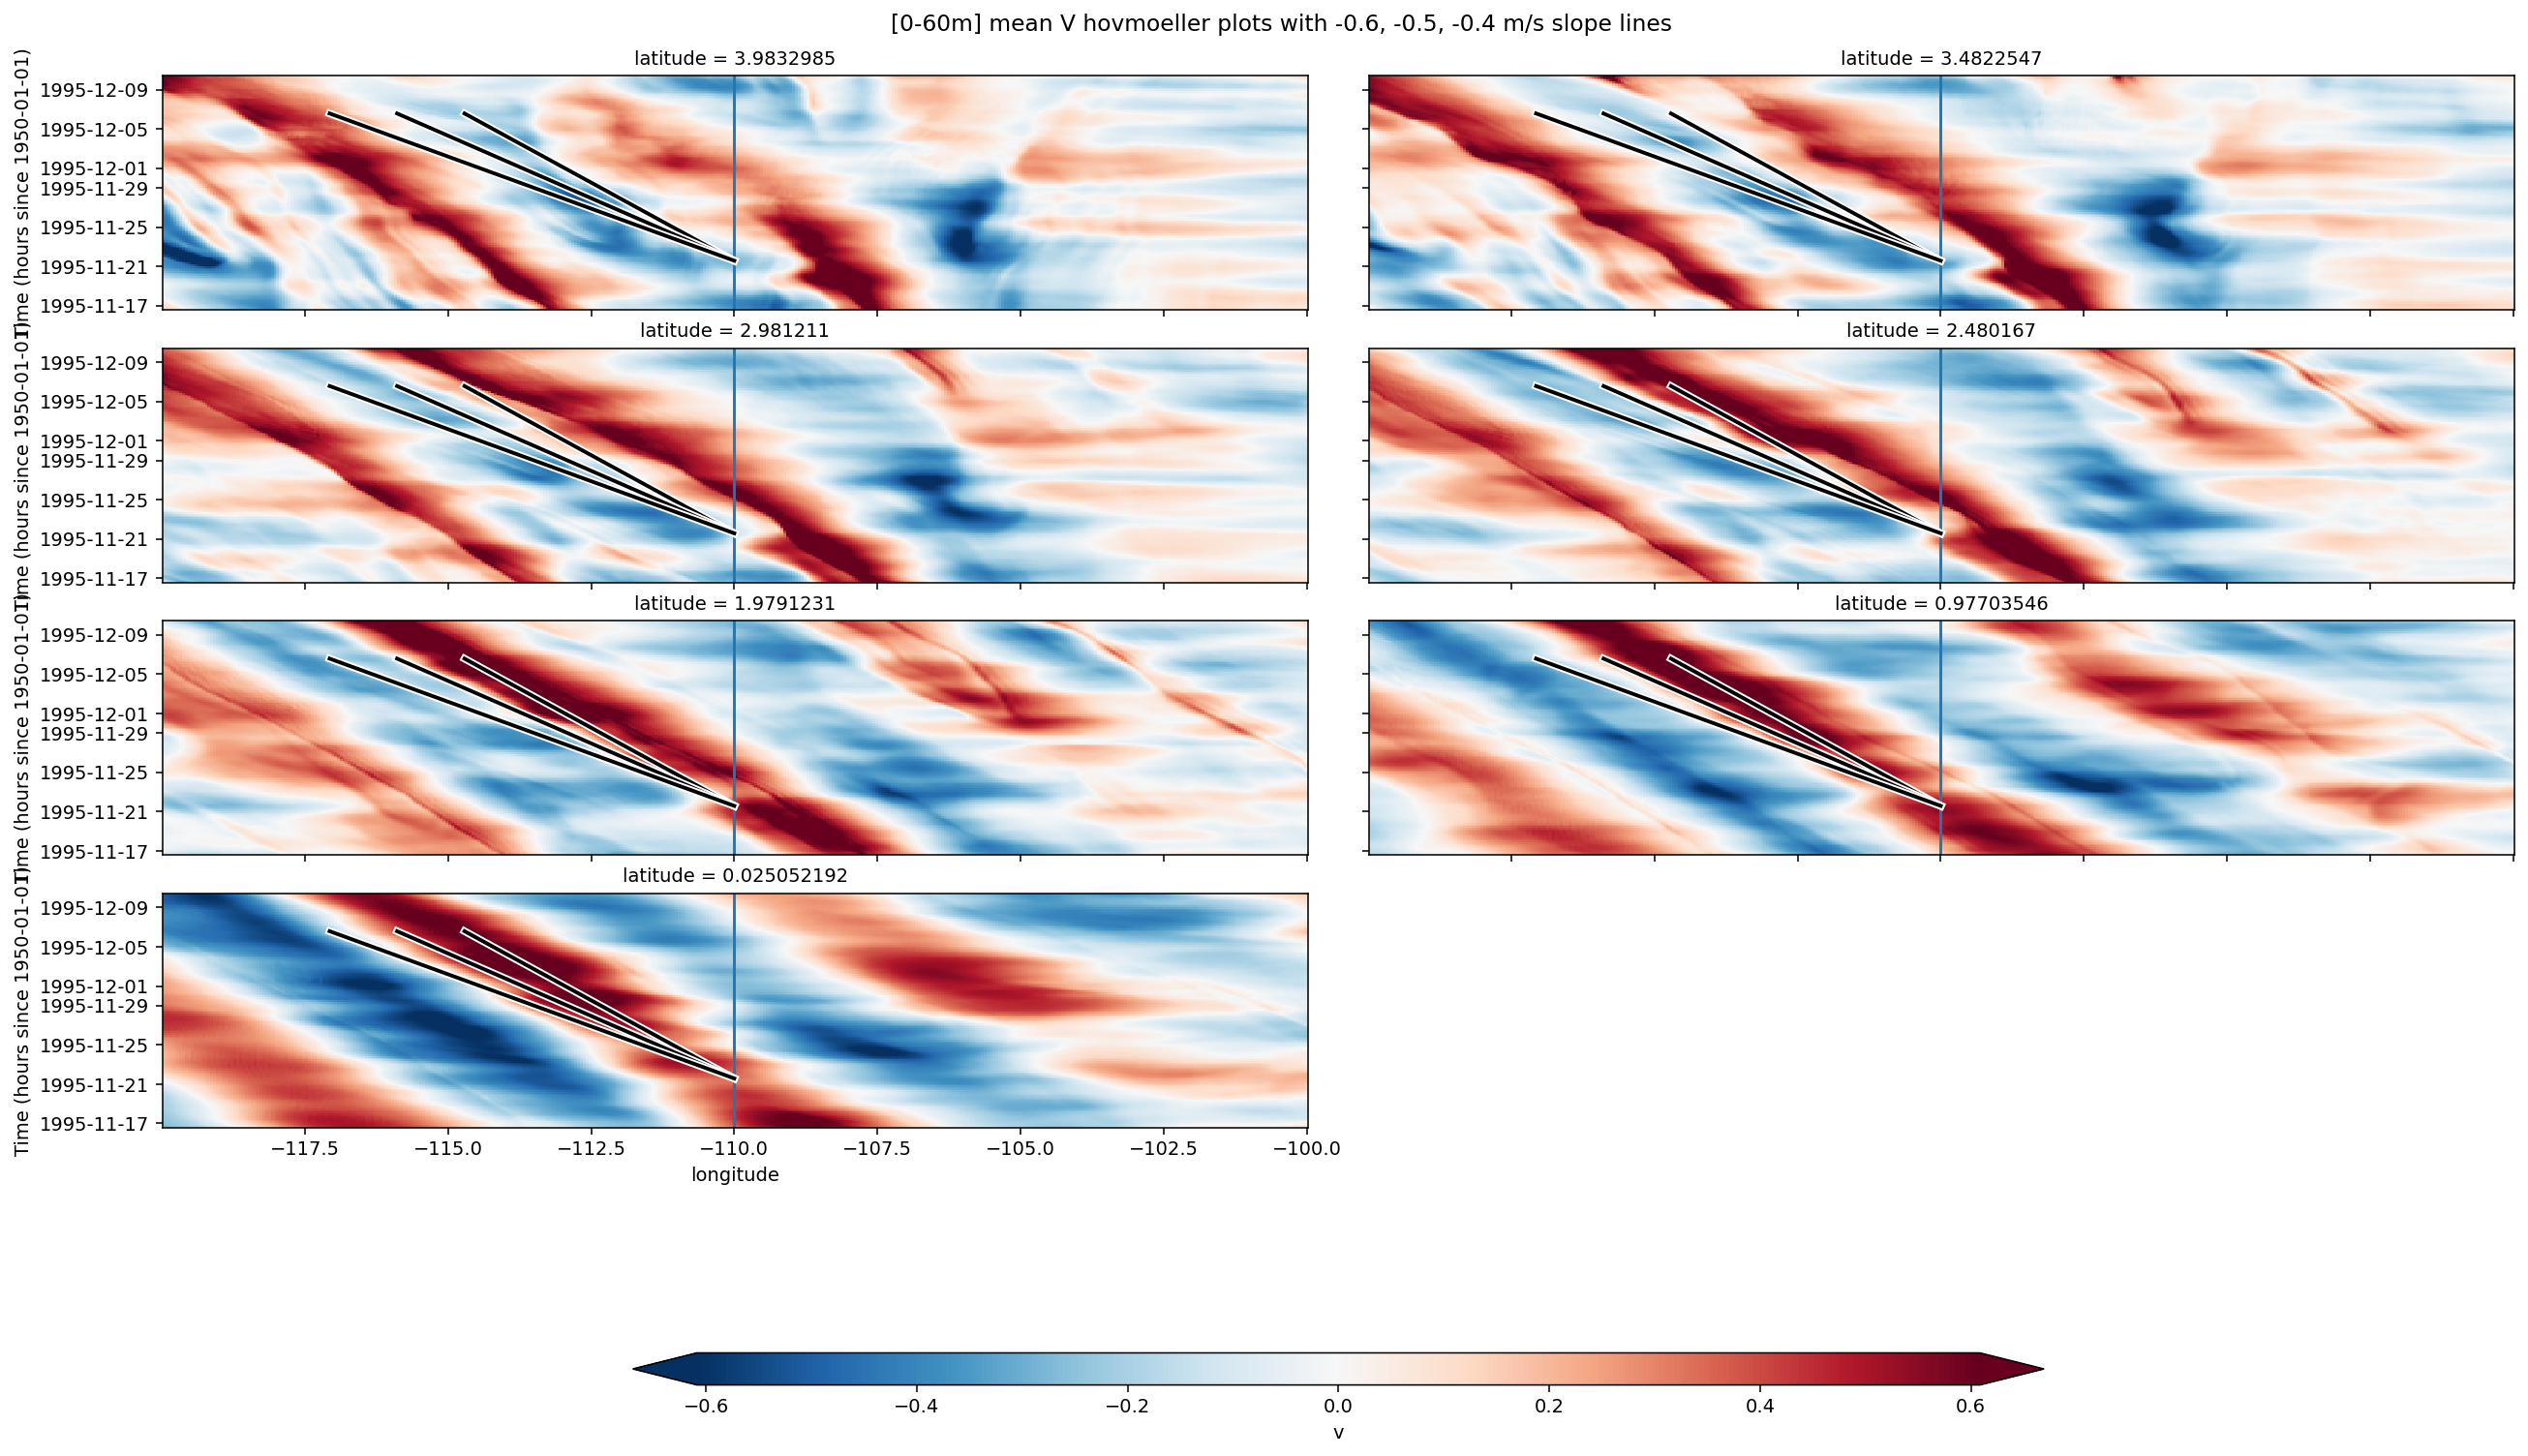
depth-averaged velocity?#
time4 = full_subset.time.where((full_subset.period == 4).squeeze().reset_coords(drop=True), drop=True)
fg = (
gcm1.full.v
.sel(depth=slice(-60))
.mean("depth")
.sel(longitude=slice(-120, -100), time=time4)
.sel(latitude=[4, 3.5, 3, 2.5, 2, 1, 0], method="nearest")
.plot(x="longitude", y="time", col="latitude", col_wrap=2, robust=True, aspect=3,
cbar_kwargs={"orientation": "horizontal", "shrink": 0.6, "aspect": 40})
)
[plot_reference(ax) for ax in fg.axes.flat]
fg.fig.suptitle("[0-60m] mean V hovmoeller plots with -0.6, -0.5, -0.4 m/s slope lines", y=1.01);;;;;;;;
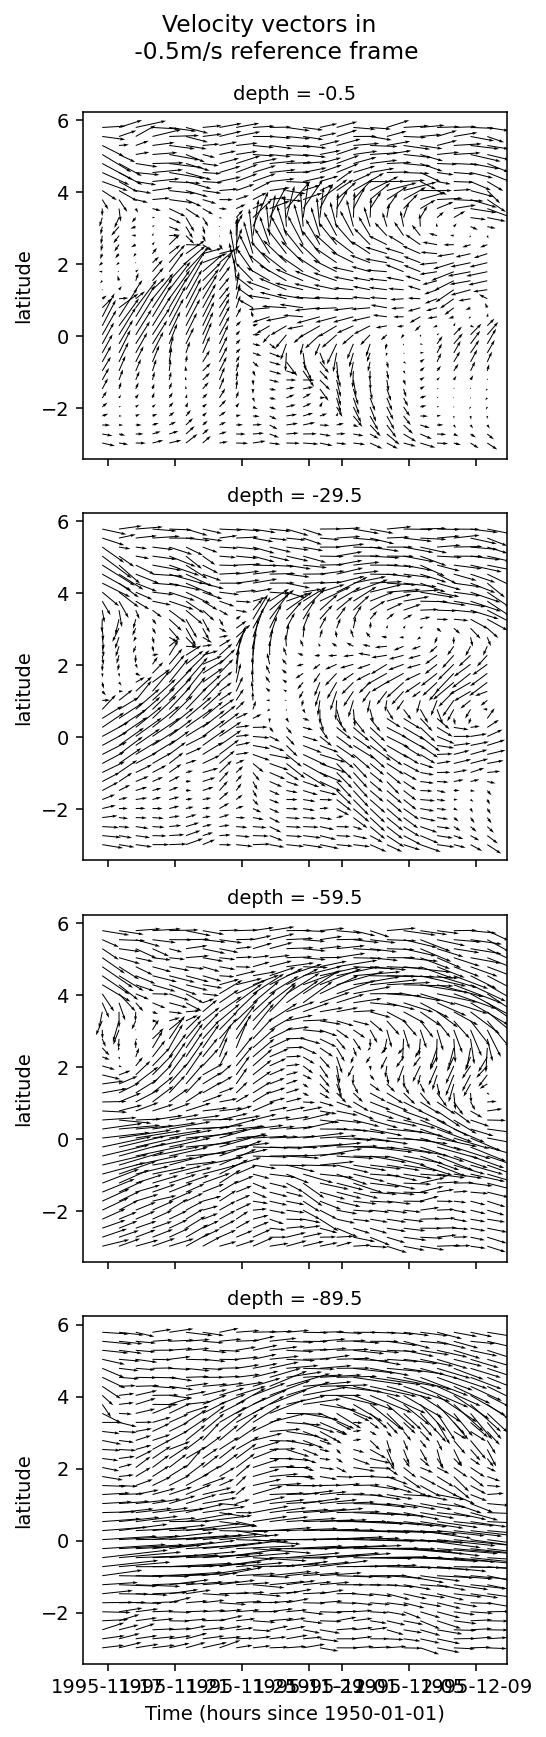
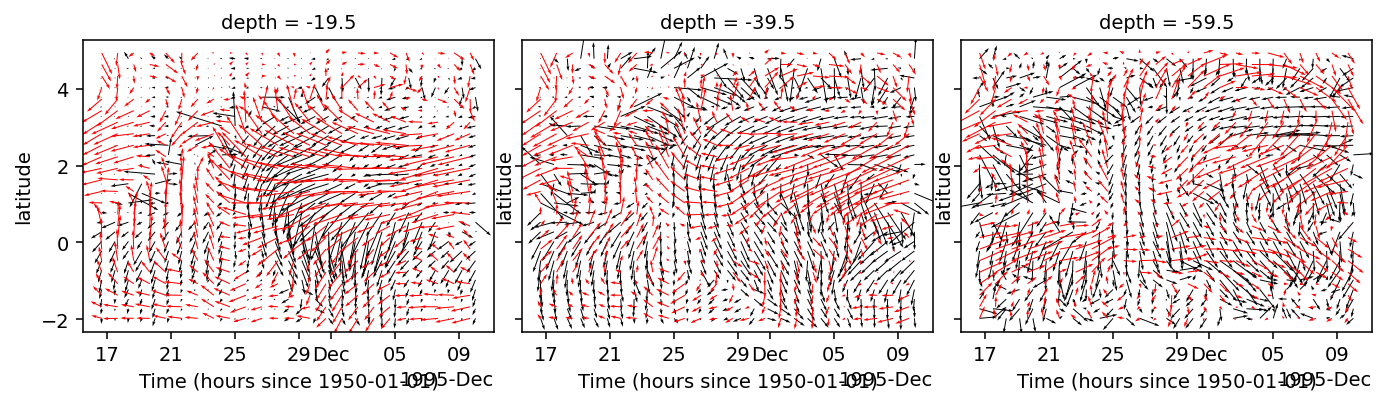
velocity in vortex-following frame#
Kennan & Flament find 0.35 m/s north of eq and 0.8m/s at eq. so there’s definitely some latitudinal structure
fg = quiver(
(subset.assign(u=lambda x: x["u"] + 0.5))
.sel(depth=[0, -30, -60, -90], method="nearest")
.isel(latitude=slice(None, None, 5), time=slice(None, None, 6))
.reset_coords(drop=True),
row="depth",
x="time",
y="latitude",
u="u",
v="v",
scale=10,
)
fg.fig.suptitle("Velocity vectors in \n -0.5m/s reference frame", y=1.03);;;;;;;;
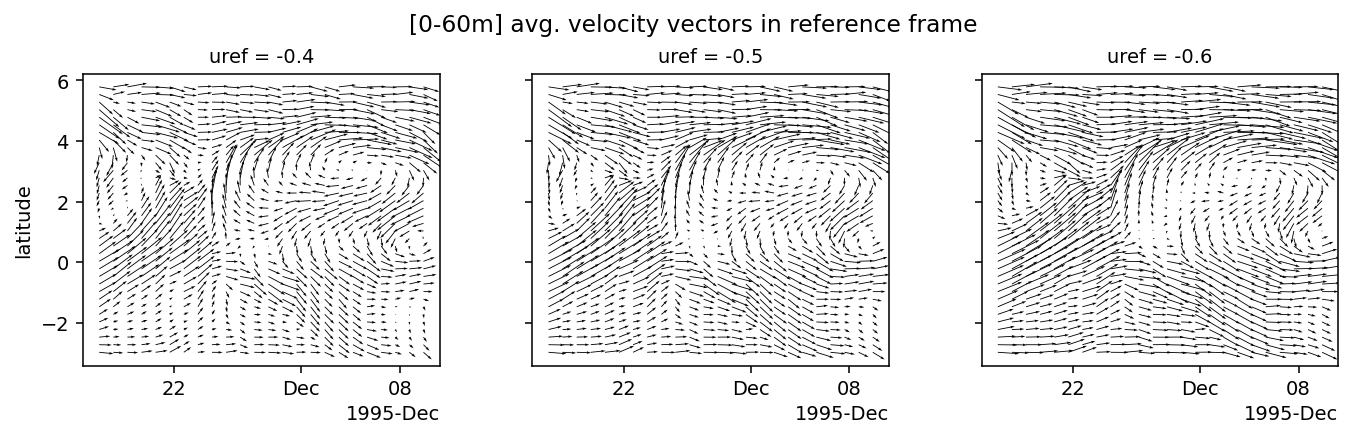
refvel = xr.concat(
[
subset.assign(u=lambda x: x["u"] + 0.4),
subset.assign(u=lambda x: x["u"] + 0.5),
subset.assign(u=lambda x: x["u"] + 0.6),
],
dim=xr.Variable("uref", [-0.4, -0.5, -0.6]),
)
refvel
<xarray.Dataset>
Dimensions: (depth: 200, latitude: 180, time: 143, uref: 3)
Coordinates:
mld (time, latitude) float32 -23.5 -24.5 -22.5 ... -35.5 -31.5 -28.5
eucmax (time) float64 -91.5 -88.5 -86.5 -85.5 ... -80.5 -78.5 -77.5
tiw_phase (time) float64 0.0 2.571 5.143 7.714 ... 350.3 352.7 355.1 357.6
dcl_base (time, latitude) float32 -48.5 -49.5 -47.5 ... -35.5 -31.5 -28.5
longitude int64 -110
period (time) float64 4.0 4.0 4.0 4.0 4.0 4.0 ... 4.0 4.0 4.0 4.0 4.0
* time (time) datetime64[ns] 1995-11-16T16:00:00 ... 1995-12-10T08:00:00
* latitude (latitude) float32 -2.981211 -2.9311066 ... 5.9373693 5.987474
* depth (depth) float32 -0.5 -1.5 -2.5 -3.5 ... -197.5 -198.5 -199.5
* uref (uref) float64 -0.4 -0.5 -0.6
Data variables:
u (uref, time, depth, latitude) float32 0.1987586 ... 0.64383435
v (uref, time, depth, latitude) float32 -0.06828315 ... -0.027467424
Attributes:
easting: longitude
field_julian_date: 400296
julian_day_unit: days since 1950-01-01 00:00:00
northing: latitude
title: daily snapshot from 1/20 degree Equatorial Pacific MI...fg = quiver(
refvel.sel(depth=slice(-60)).mean("depth")
.isel(latitude=slice(None, None, 5), time=slice(None, None, 6))
.reset_coords(drop=True),
col="uref",
x="time",
y="latitude",
u="u",
v="v",
scale=10,
)
fg.fig.suptitle("[0-60m] avg. velocity vectors in reference frame", y=1.03);
[dcpy.plots.concise_date_formatter(aa) for aa in fg.axes.flat]
[[aa.set_xlabel("") for aa in fg.axes.flat]];;;;;;;;
[[Text(0.5, 5.811111111111111, ''),
Text(0.5, 5.811111111111111, ''),
Text(0.5, 5.811111111111111, '')]]
bandpass filtering#
Not sure this does what i want.
Let’s try bandpass filtering in time. This will be wrong at the front but sensible behind it?
vel = (
full_subset[["u", "v"]]
.squeeze()
.sel(depth=[0, -30, -60, -90], method="nearest")
.chunk({"time": -1, "depth": 1})
)
tiw_filter = lambda x: xfilter.bandpass(
x, coord="time", freq=[1 / 20.0, 1 / 40.0], cycles_per="D", num_discard=0
)
filtered = vel.map(tiw_filter)
/glade/u/home/dcherian/python/xfilter/xfilter/xfilter.py:152: FutureWarning: This DataArray contains multi-dimensional coordinates. In the future, these coordinates will be transposed as well unless you specify transpose_coords=False.
data = data.copy().transpose(..., coord)
/glade/u/home/dcherian/miniconda3/envs/dcpy/lib/python3.6/site-packages/xarray/core/missing.py:410: FutureWarning: This DataArray contains multi-dimensional coordinates. In the future, these coordinates will be transposed as well unless you specify transpose_coords=False.
).transpose(*arr.dims)
/glade/u/home/dcherian/miniconda3/envs/dcpy/lib/python3.6/site-packages/xarray/core/missing.py:427: FutureWarning: This DataArray contains multi-dimensional coordinates. In the future, these coordinates will be transposed as well unless you specify transpose_coords=False.
).transpose(*arr.dims)
/glade/u/home/dcherian/miniconda3/envs/dcpy/lib/python3.6/site-packages/xarray/core/missing.py:346: FutureWarning: This DataArray contains multi-dimensional coordinates. In the future, these coordinates will be transposed as well unless you specify transpose_coords=False.
).transpose(*self.dims)
merged = xr.concat(
[vel, filtered.reset_coords(drop=True)],
dim=xr.Variable("kind", ["unfiltered", "filtered"]),
coords="minimal",
)
merged_subset = (
merged.sel(
time=merged.time.where(filtered.period == 4, drop=True), latitude=slice(-3, 6)
)
.isel(latitude=slice(None, None, 5), time=slice(None, None, 5))
.compute()
)
ERROR:root:Internal Python error in the inspect module.
Below is the traceback from this internal error.
Traceback (most recent call last):
File "/glade/u/home/dcherian/miniconda3/envs/dcpy/lib/python3.6/site-packages/IPython/core/interactiveshell.py", line 3331, in run_code
exec(code_obj, self.user_global_ns, self.user_ns)
File "<ipython-input-171-5c50a822dbc5>", line 8, in <module>
.sel(time=merged.time.where(filtered.period == 4, drop=True), latitude=slice(-3, 6))
File "/glade/u/home/dcherian/miniconda3/envs/dcpy/lib/python3.6/site-packages/xarray/core/common.py", line 1141, in where
nonzeros = zip(clipcond.dims, np.nonzero(clipcond.values))
File "/glade/u/home/dcherian/miniconda3/envs/dcpy/lib/python3.6/site-packages/xarray/core/dataarray.py", line 557, in values
return self.variable.values
File "/glade/u/home/dcherian/miniconda3/envs/dcpy/lib/python3.6/site-packages/xarray/core/variable.py", line 451, in values
return _as_array_or_item(self._data)
File "/glade/u/home/dcherian/miniconda3/envs/dcpy/lib/python3.6/site-packages/xarray/core/variable.py", line 254, in _as_array_or_item
data = np.asarray(data)
File "/glade/u/home/dcherian/miniconda3/envs/dcpy/lib/python3.6/site-packages/numpy/core/_asarray.py", line 85, in asarray
return array(a, dtype, copy=False, order=order)
File "/glade/u/home/dcherian/miniconda3/envs/dcpy/lib/python3.6/site-packages/dask/array/core.py", line 1342, in __array__
x = self.compute()
File "/glade/u/home/dcherian/miniconda3/envs/dcpy/lib/python3.6/site-packages/dask/base.py", line 166, in compute
(result,) = compute(self, traverse=False, **kwargs)
File "/glade/u/home/dcherian/miniconda3/envs/dcpy/lib/python3.6/site-packages/dask/base.py", line 437, in compute
results = schedule(dsk, keys, **kwargs)
File "/glade/u/home/dcherian/miniconda3/envs/dcpy/lib/python3.6/site-packages/distributed/client.py", line 2595, in get
results = self.gather(packed, asynchronous=asynchronous, direct=direct)
File "/glade/u/home/dcherian/miniconda3/envs/dcpy/lib/python3.6/site-packages/distributed/client.py", line 1893, in gather
asynchronous=asynchronous,
File "/glade/u/home/dcherian/miniconda3/envs/dcpy/lib/python3.6/site-packages/distributed/client.py", line 780, in sync
self.loop, func, *args, callback_timeout=callback_timeout, **kwargs
File "/glade/u/home/dcherian/miniconda3/envs/dcpy/lib/python3.6/site-packages/distributed/utils.py", line 345, in sync
e.wait(10)
File "/glade/u/home/dcherian/miniconda3/envs/dcpy/lib/python3.6/threading.py", line 551, in wait
signaled = self._cond.wait(timeout)
File "/glade/u/home/dcherian/miniconda3/envs/dcpy/lib/python3.6/threading.py", line 299, in wait
gotit = waiter.acquire(True, timeout)
KeyboardInterrupt
During handling of the above exception, another exception occurred:
Traceback (most recent call last):
File "/glade/u/home/dcherian/miniconda3/envs/dcpy/lib/python3.6/site-packages/IPython/core/interactiveshell.py", line 2044, in showtraceback
stb = value._render_traceback_()
AttributeError: 'KeyboardInterrupt' object has no attribute '_render_traceback_'
During handling of the above exception, another exception occurred:
Traceback (most recent call last):
File "/glade/u/home/dcherian/miniconda3/envs/dcpy/lib/python3.6/site-packages/IPython/core/ultratb.py", line 1148, in get_records
return _fixed_getinnerframes(etb, number_of_lines_of_context, tb_offset)
File "/glade/u/home/dcherian/miniconda3/envs/dcpy/lib/python3.6/site-packages/IPython/core/ultratb.py", line 316, in wrapped
return f(*args, **kwargs)
File "/glade/u/home/dcherian/miniconda3/envs/dcpy/lib/python3.6/site-packages/IPython/core/ultratb.py", line 350, in _fixed_getinnerframes
records = fix_frame_records_filenames(inspect.getinnerframes(etb, context))
File "/glade/u/home/dcherian/miniconda3/envs/dcpy/lib/python3.6/inspect.py", line 1490, in getinnerframes
frameinfo = (tb.tb_frame,) + getframeinfo(tb, context)
File "/glade/u/home/dcherian/miniconda3/envs/dcpy/lib/python3.6/inspect.py", line 1452, in getframeinfo
lines, lnum = findsource(frame)
File "/glade/u/home/dcherian/miniconda3/envs/dcpy/lib/python3.6/site-packages/IPython/core/ultratb.py", line 182, in findsource
lines = linecache.getlines(file, globals_dict)
File "/glade/u/home/dcherian/miniconda3/envs/dcpy/lib/python3.6/linecache.py", line 47, in getlines
return updatecache(filename, module_globals)
File "/glade/u/home/dcherian/miniconda3/envs/dcpy/lib/python3.6/linecache.py", line 136, in updatecache
with tokenize.open(fullname) as fp:
File "/glade/u/home/dcherian/miniconda3/envs/dcpy/lib/python3.6/tokenize.py", line 452, in open
buffer = _builtin_open(filename, 'rb')
KeyboardInterrupt
---------------------------------------------------------------------------
quiver(
merged_subset,
x="time",
y="latitude",
u="u",
v="v",
row="depth",
col="kind",
scale=8,
)
quiver(
subset.sel(depth=[0, -30, -60, -90], method="nearest")
.isel(latitude=slice(None, None, 5), time=slice(None, None, 6))
.reset_coords(drop=True),
row="depth",
x="time",
y="latitude",
u="u",
v="v",
)
dcl = (
(subset.mld - subset.dcl_base)
.resample(time="D")
.mean()
.rolling(latitude=6)
.mean()
.compute()
)
/glade/u/home/dcherian/miniconda3/envs/dcpy/lib/python3.6/site-packages/xarray/core/resample.py:176: FutureWarning: This DataArray contains multi-dimensional coordinates. In the future, the dimension order of these coordinates will be restored as well unless you specify restore_coord_dims=False.
super().__init__(*args, **kwargs)
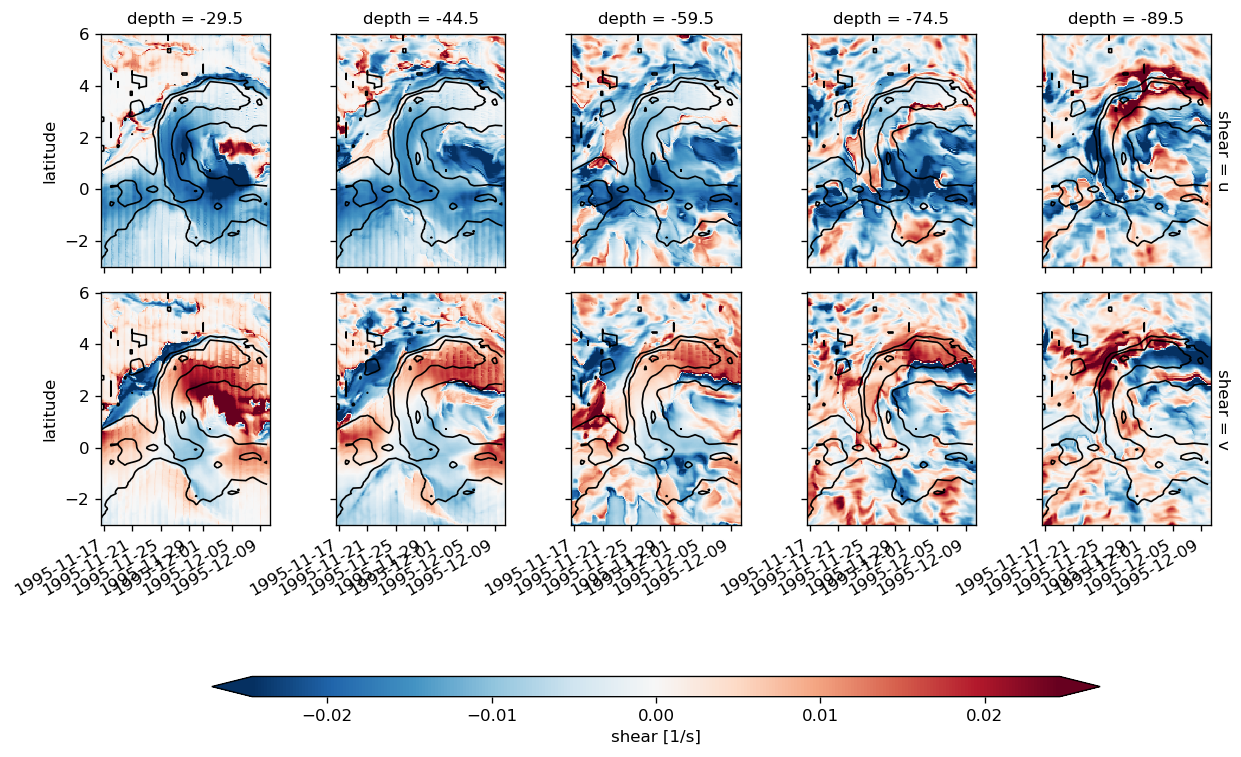
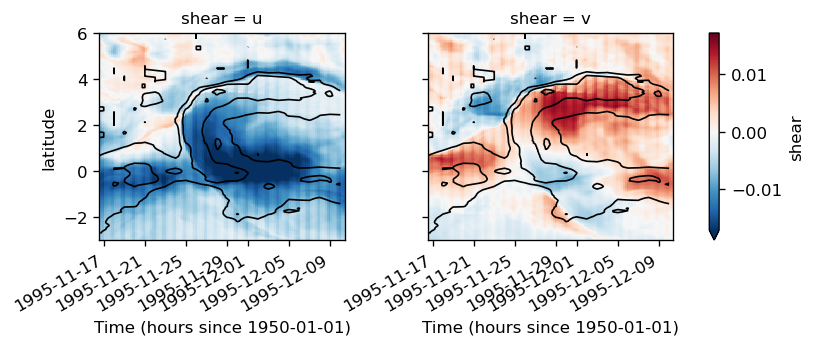
shears = subset.differentiate("depth").to_array("shear").reset_coords(drop=True)
shears.name = "shear"
shears.attrs["units"] = "1/s"
fg = shears.sel(depth=[-30, -45, -60, -75, -90], method="nearest").plot(
col="depth",
row="shear",
x="time",
y="latitude",
robust=True,
cbar_kwargs={"orientation": "horizontal", "pad": 0.2, "shrink": 0.8, "aspect": 40},
)
def plot():
dcl.plot.contour(
levels=7, colors="k", robust=True, x="time", add_labels=False, linewidths=1
)
fg.map(plot)
fg.set_xlabels("")
fg.fig.set_size_inches((10, 8))
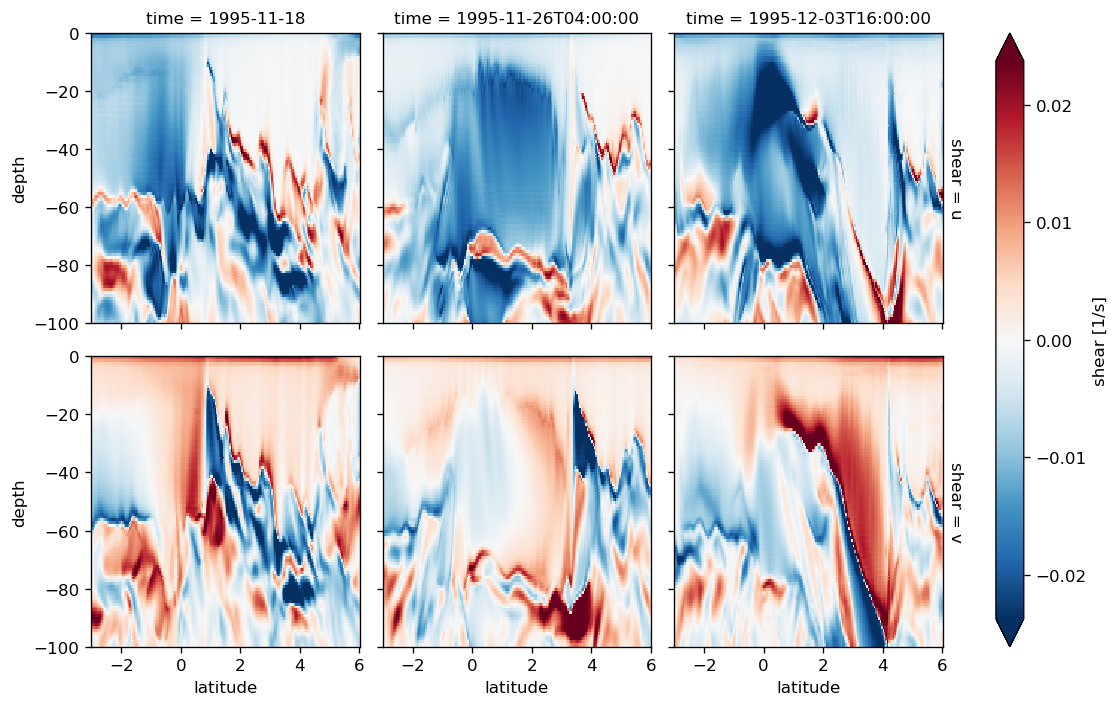
times = pd.to_datetime(["1995-11-18 00:00", "1995-11-26 04:00", "1995-12-03 16:00"])
shears.sel(time=times).sel(depth=slice(-100)).plot(col="time", row="shear", robust=True)
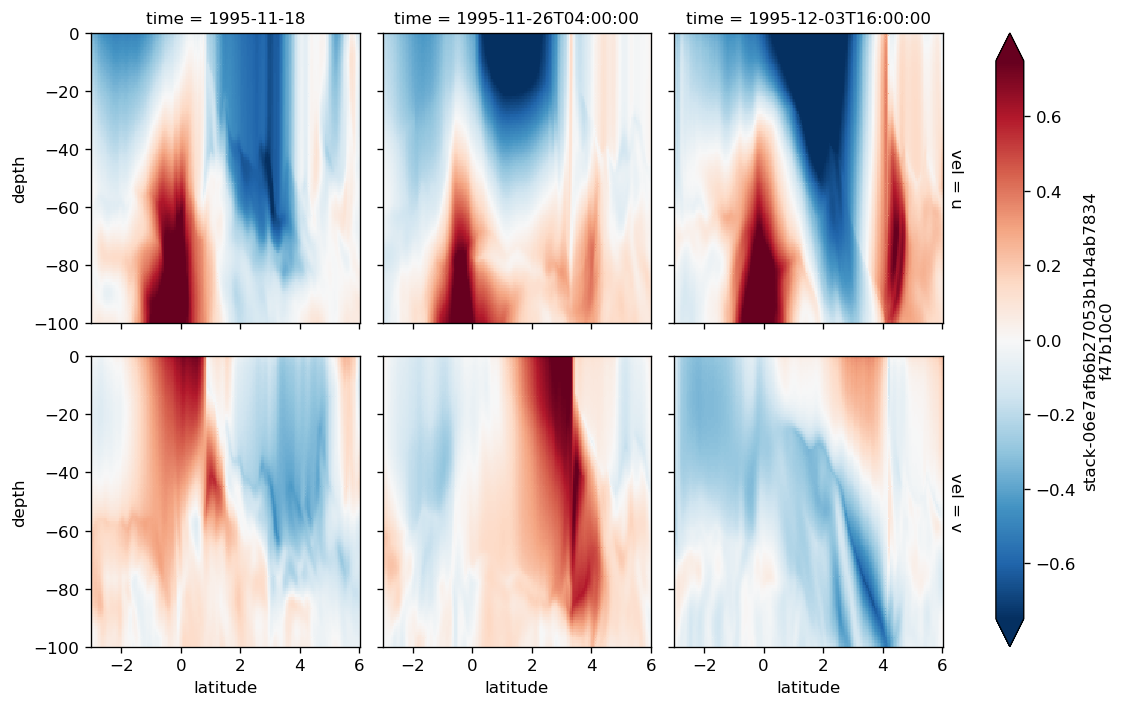
full_subset[["u", "v"]].to_array("vel").sel(
time=times, latitude=slice(-3, 6), depth=slice(-100)
).plot(col="time", row="vel", robust=True)
<xarray.plot.facetgrid.FacetGrid at 0x2abce7ac7128>
fg = shears.sel(depth=slice(-60)).mean("depth").plot(col="shear", x="time", robust=True)
def plot():
dcl.plot.contour(
levels=7, colors="k", robust=True, x="time", add_labels=False, linewidths=1
)
fg.map(plot)
<xarray.plot.facetgrid.FacetGrid at 0x2abc7cd550f0>
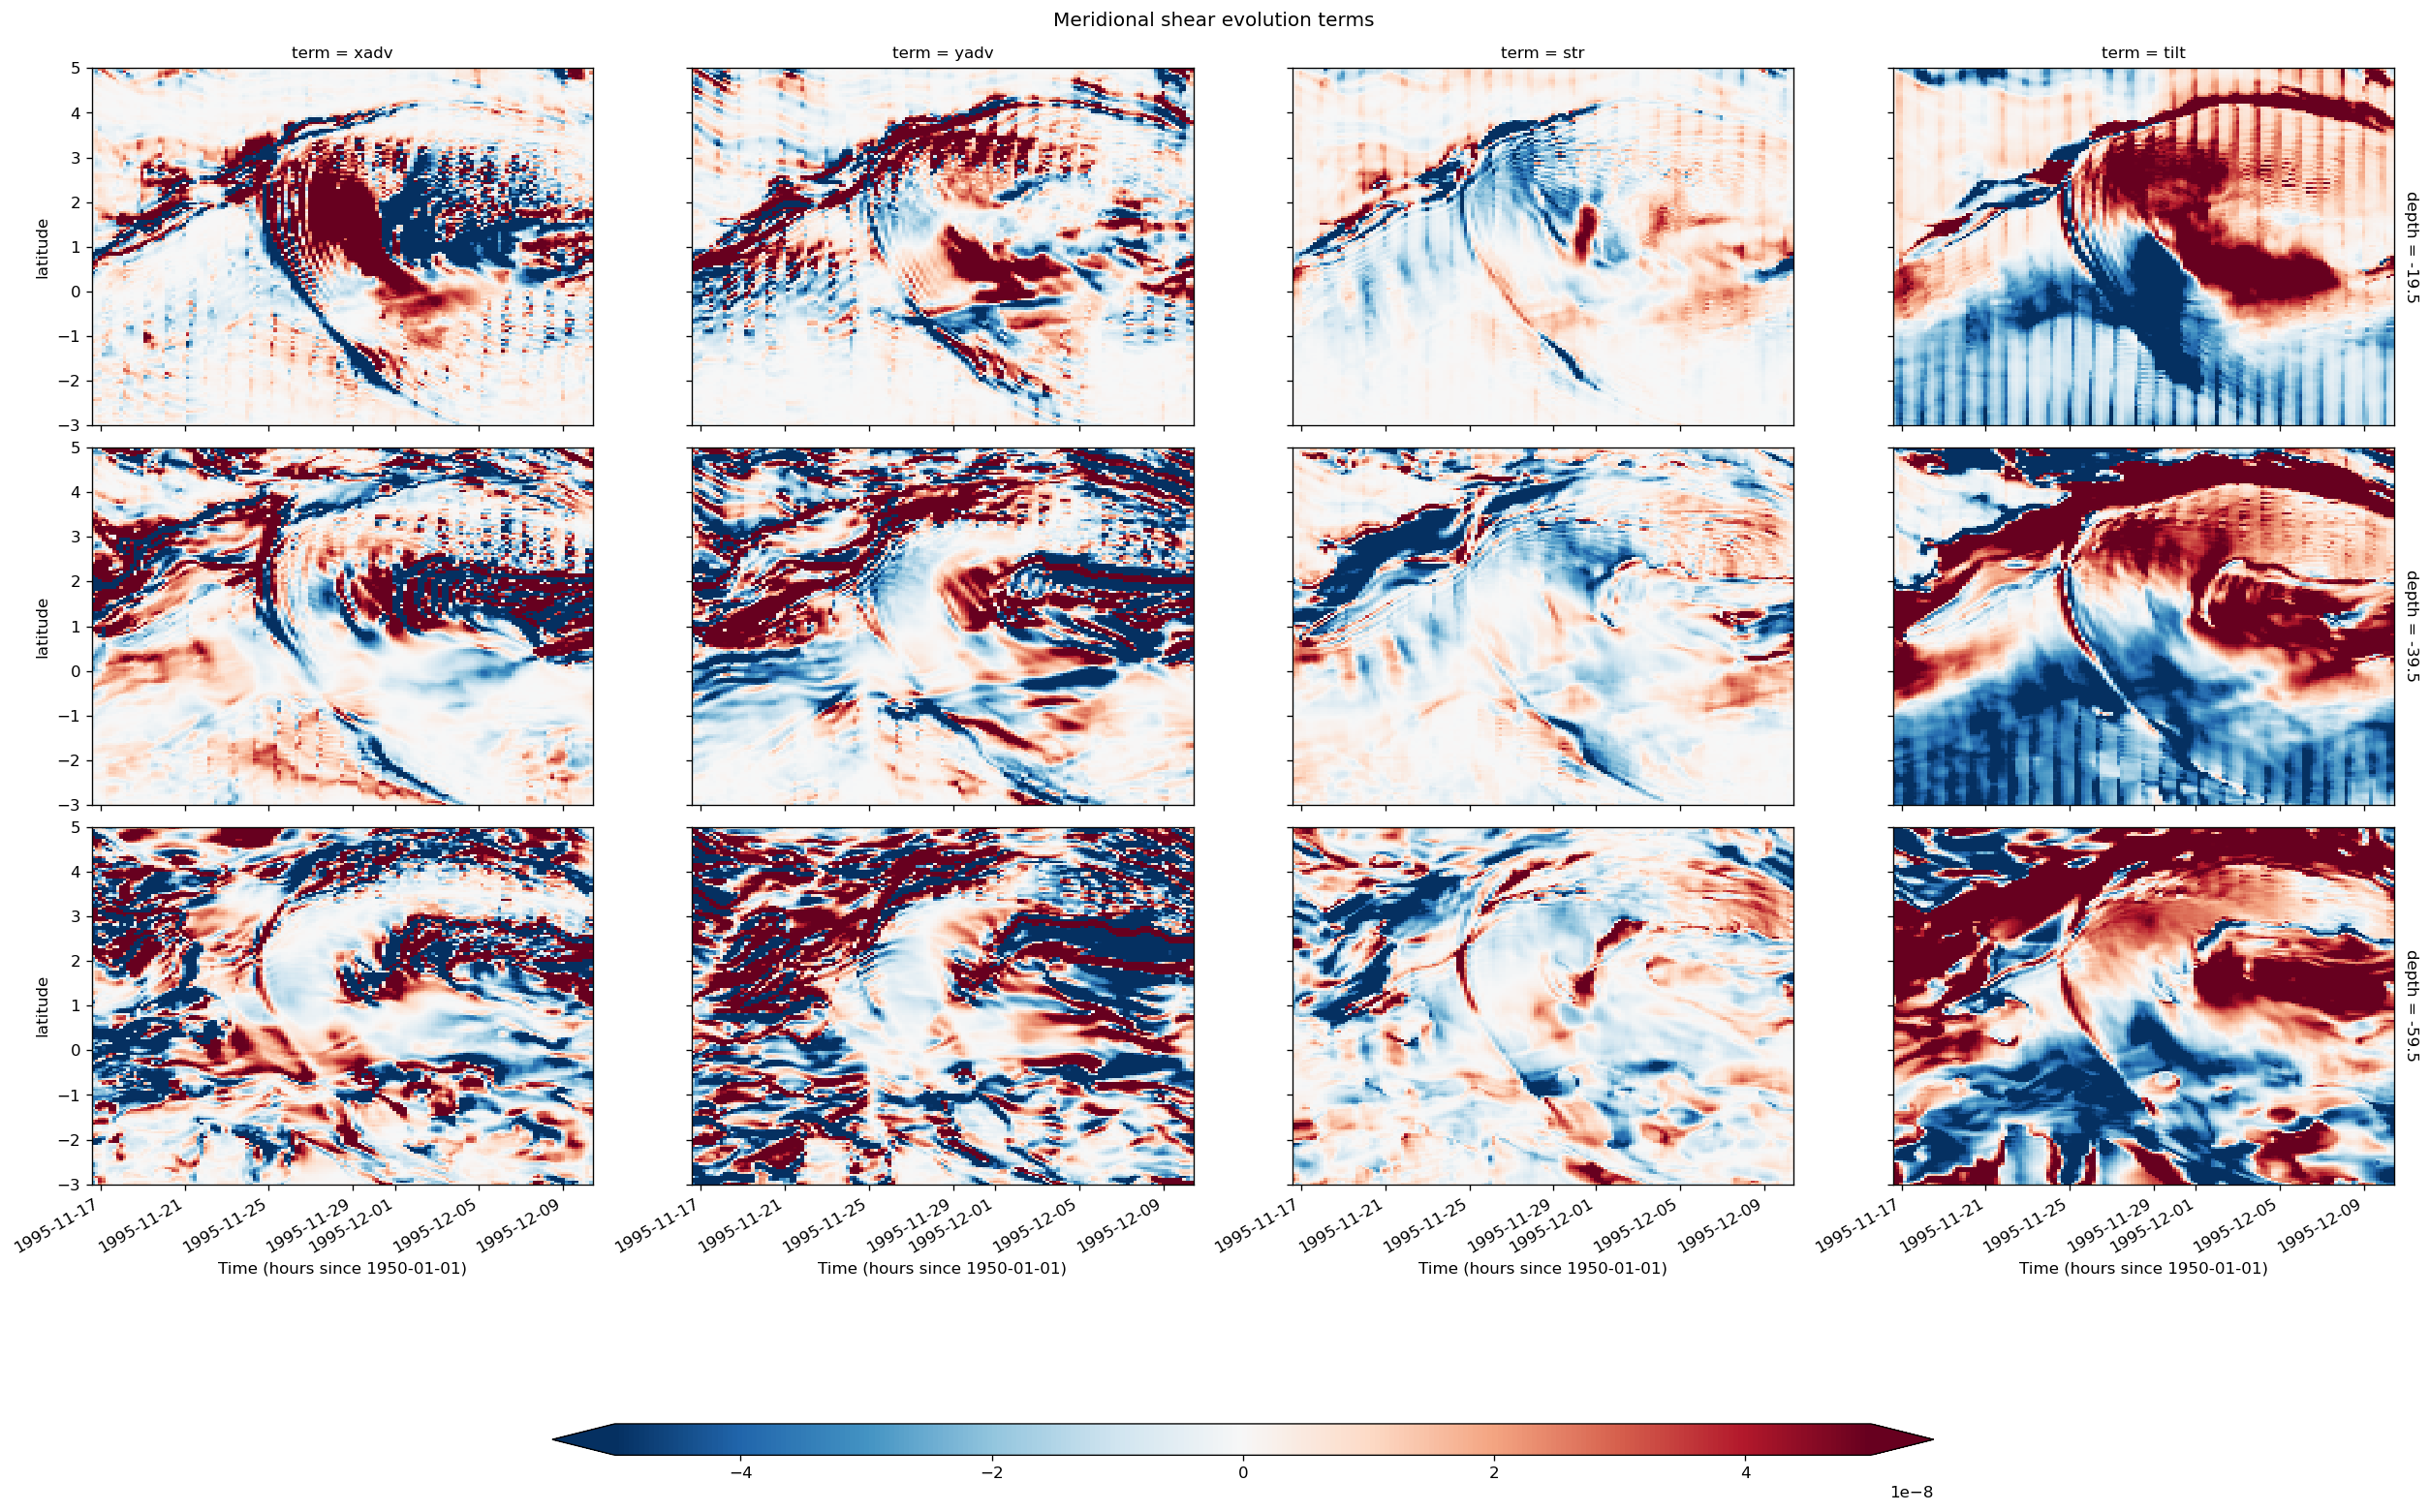
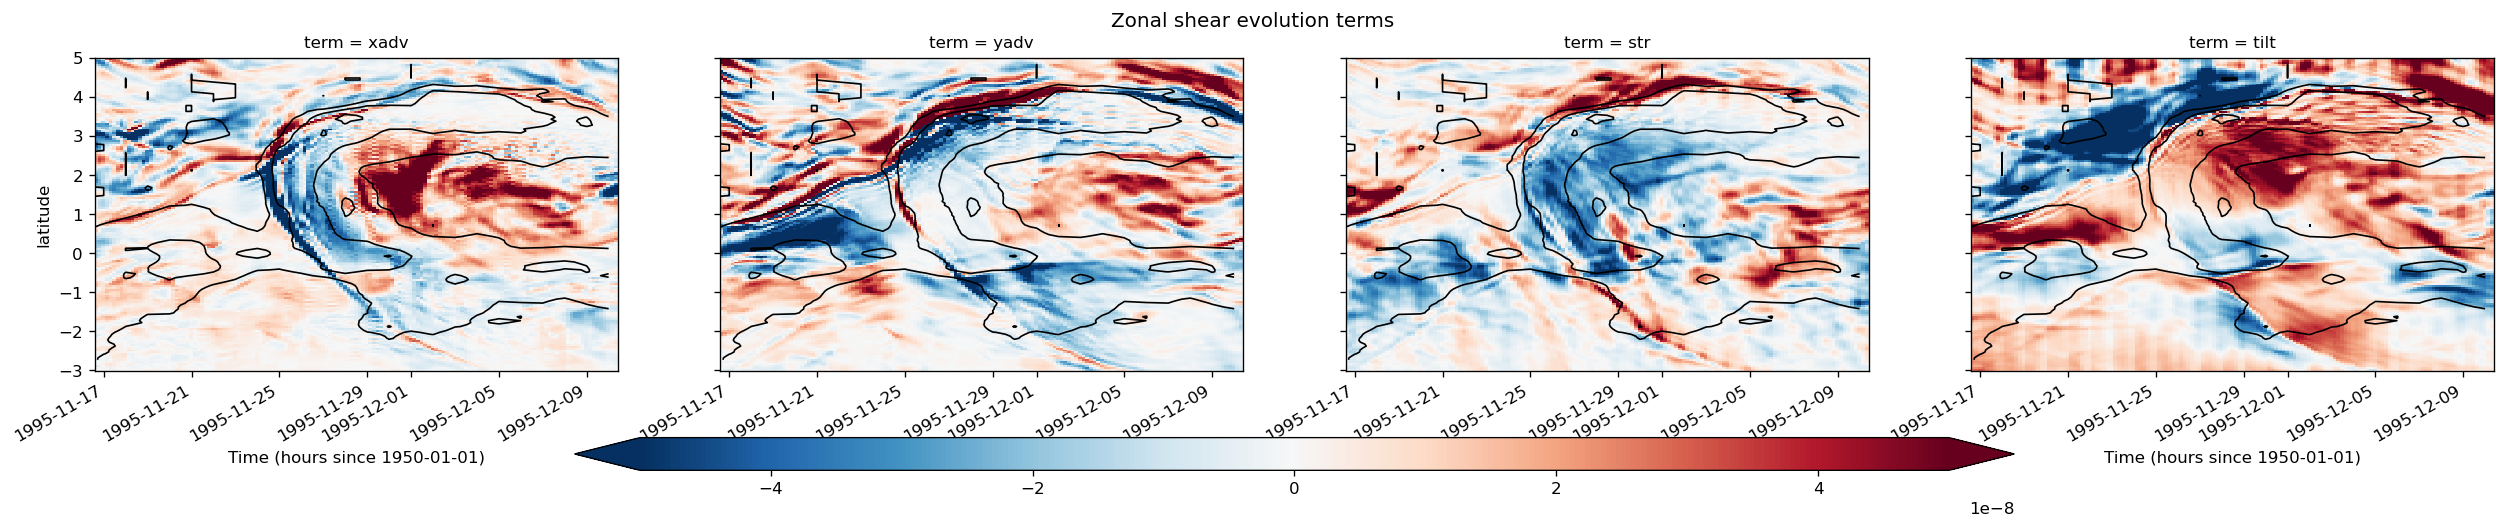
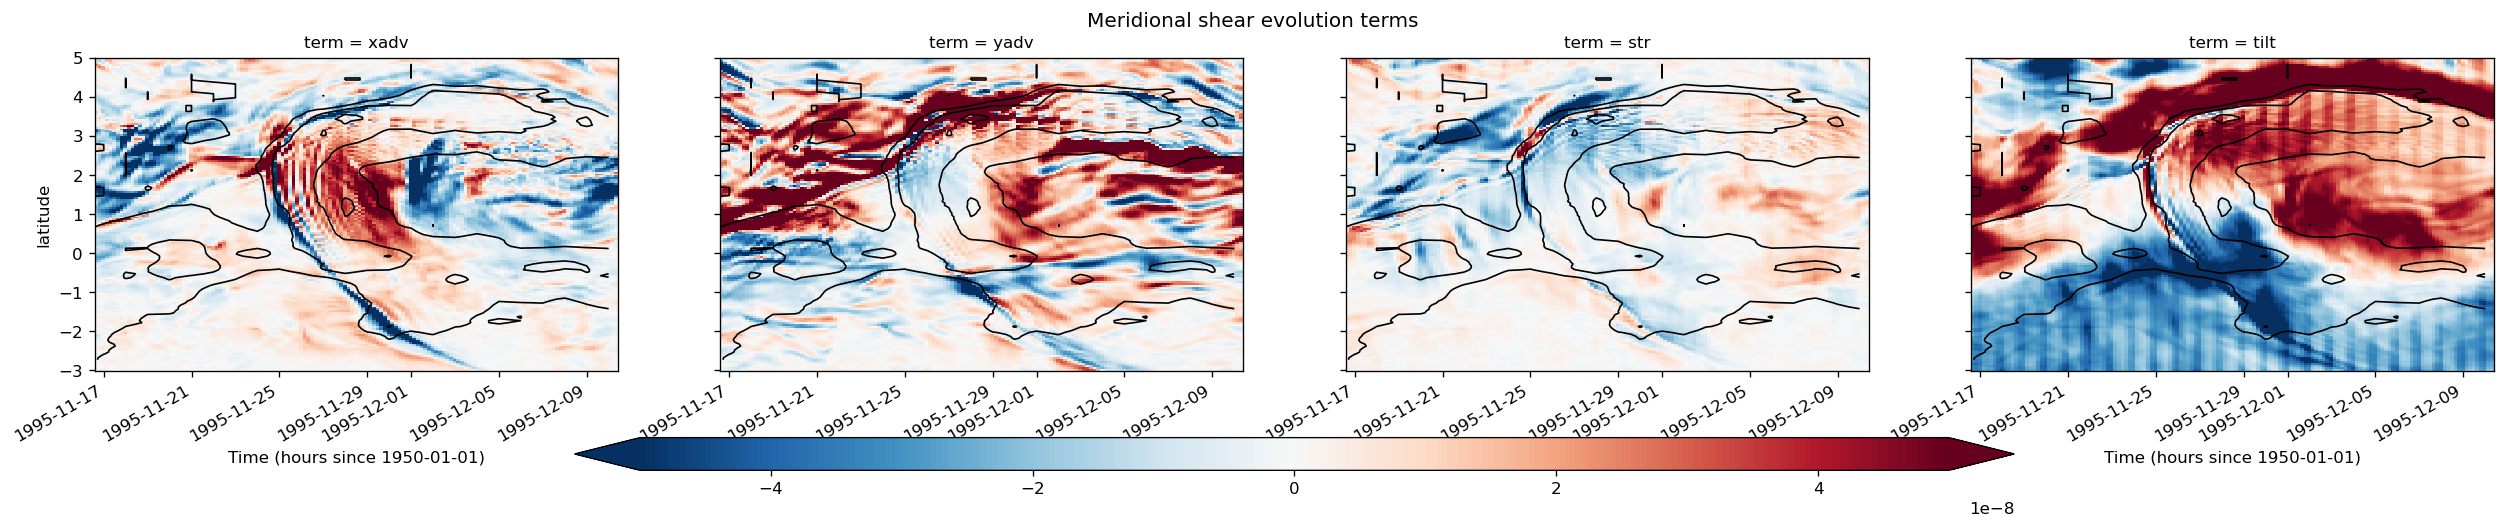
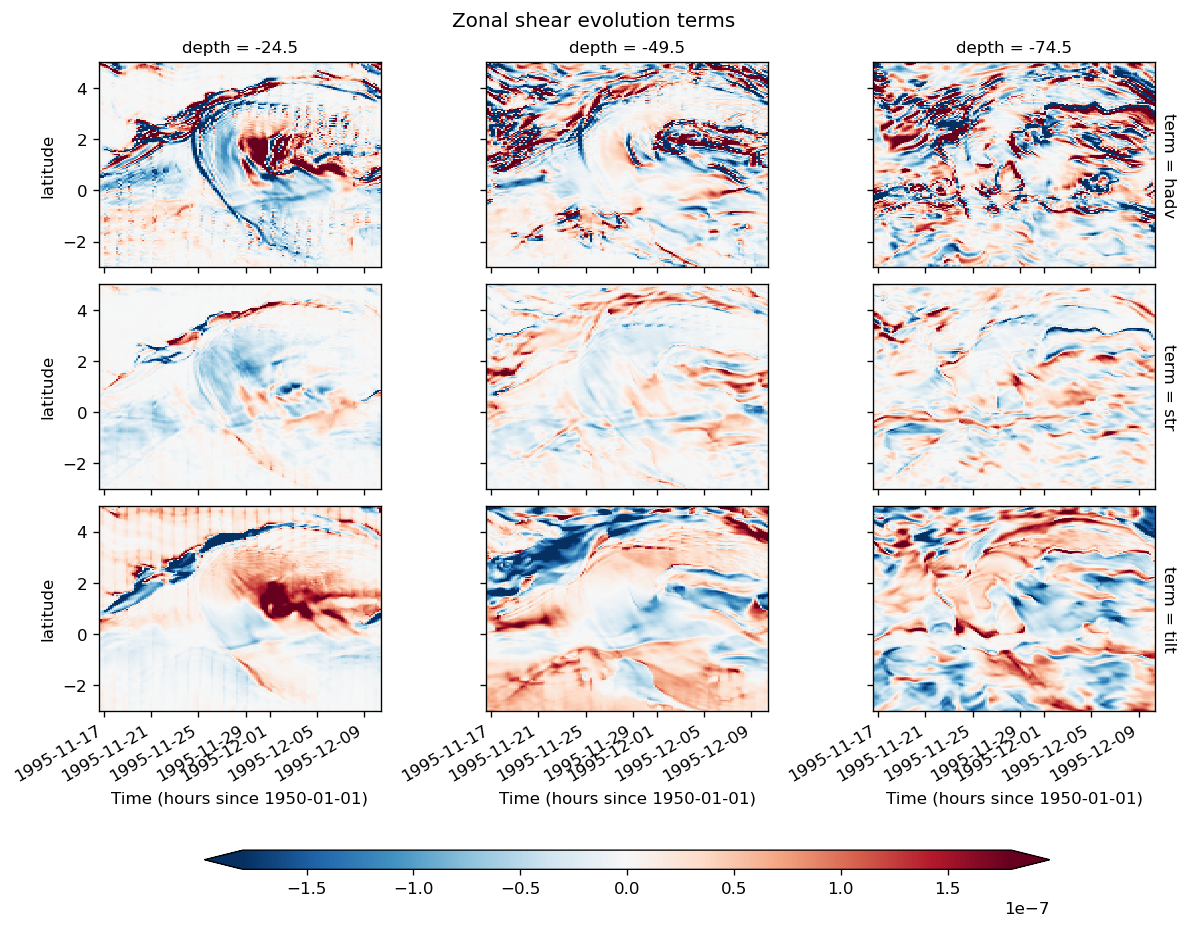
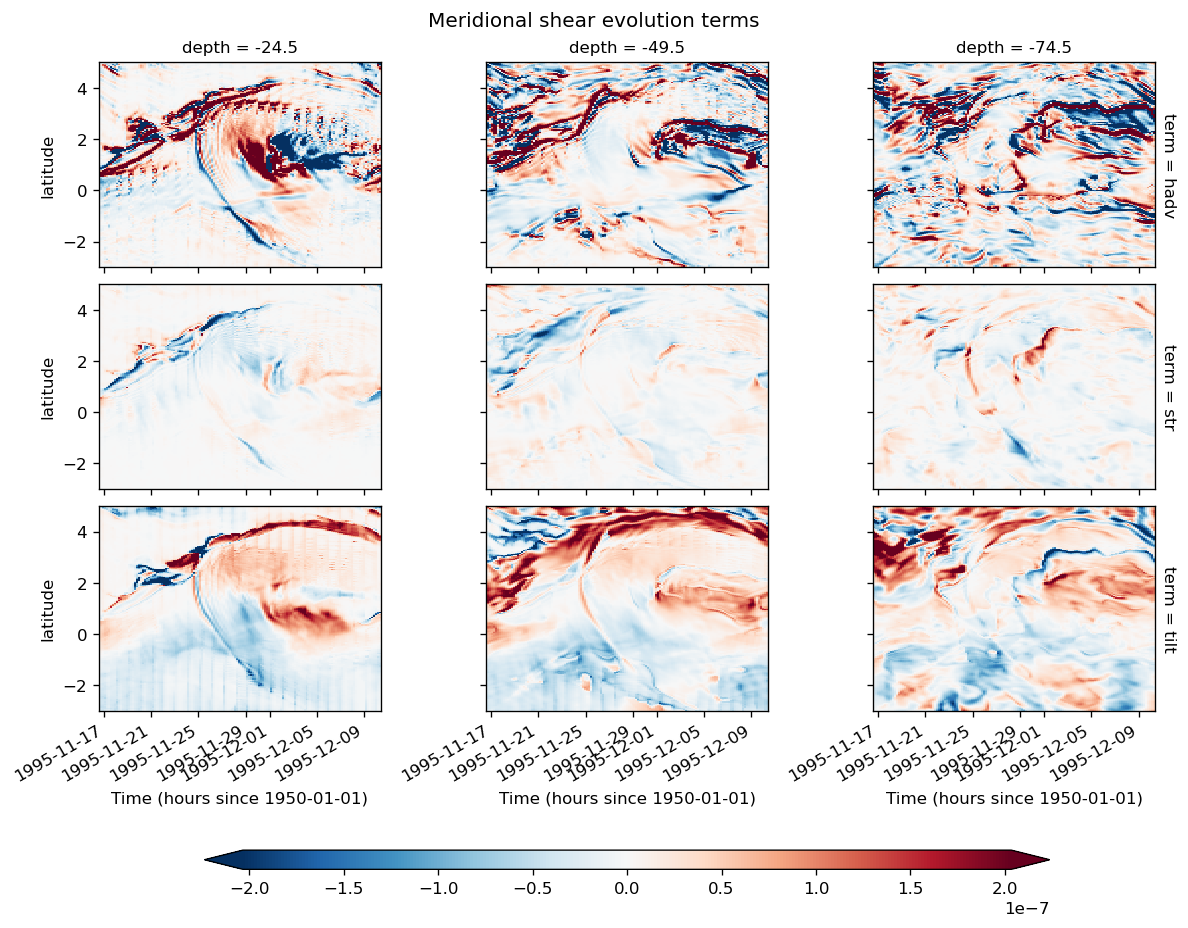
shear evolution#
\begin{align} D_t u_z &= u_z v_y + (f - u_y) v_z - b_x + ∂_z F_x \ D_t v_z &= v_z u_x - (f + v_x) u_z - b_y + ∂_z F_y \end{align}
ilon = gcmfull.full.indexes["longitude"].get_loc(-110, method="nearest")
time_subset = gcmfull.time.where(full_subset.period.squeeze() == 4, drop=True).values
ds = gcmfull.full.isel(longitude=[ilon - 1, ilon, ilon + 1]).sel(
time=time_subset, depth=slice(-200)
)
# ds = dcpy.dask.map_copy(ds)
---------------------------------------------------------------------------
NameError Traceback (most recent call last)
<ipython-input-5-d89d001597c4> in <module>
----> 1 ilon = gcmfull.full.indexes["longitude"].get_loc(-110, method="nearest")
2 time_subset = gcmfull.time.where(full_subset.period.squeeze() == 4, drop=True).values
3 ds = gcmfull.full.isel(longitude=[ilon-1, ilon, ilon+1]).sel(time=time_subset, depth=slice(-200))
4 # ds = dcpy.dask.map_copy(ds)
NameError: name 'gcmfull' is not defined
ds.to_netcdf("/glade/scratch/dcherian/TPOS_MITgcm_1_hb/110w-period-4.nc")
from pump.calc import ddx, ddy
from pump.plot import plot_shear_terms
ds = xr.open_dataset("/glade/scratch/dcherian/TPOS_MITgcm_1_hb/110w-period-4.nc")
duzdt, dvzdt = dask.compute(pump.calc.estimate_shear_evolution_terms(ds))
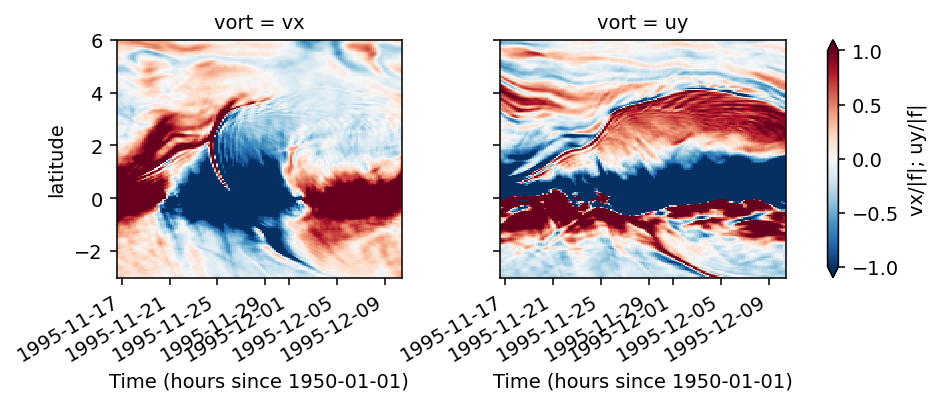
Tilting of the vertical vortex tube is what changes both components of shear so lets look at that
f = dcpy.oceans.coriolis(ds.latitude)
vvort = xr.Dataset()
vvort["zeta"] = ddx(ds.v) - ddy(ds.u)
vvort["vx"] = ddx(ds.v)
vvort["uy"] = ddy(ds.u)
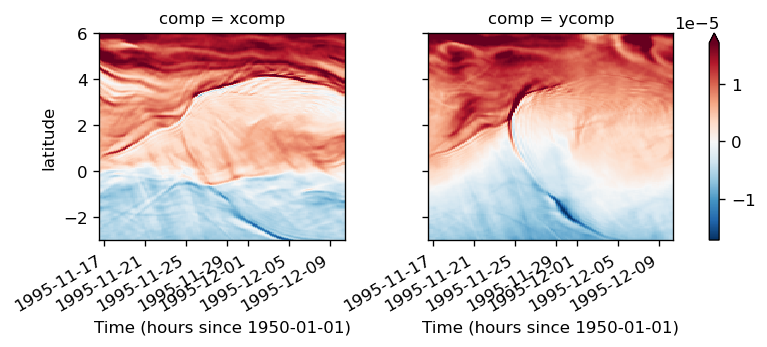
vvort["xcomp"] = f - vvort.uy
vvort["ycomp"] = f + vvort.vx
vvort = vvort.isel(longitude=1).load()
(vvort[["vx", "uy"]].to_array("vort") / np.abs(f)).sel(
latitude=slice(-3, 6), depth=slice(-60)
).mean("depth").plot(
col="vort",
x="time",
vmin=-1,
vmax=1,
cmap=mpl.cm.RdBu_r,
cbar_kwargs={"label": "vx/|f|; uy/|f|"},
)
<xarray.plot.facetgrid.FacetGrid at 0x2ba563a03cf8>
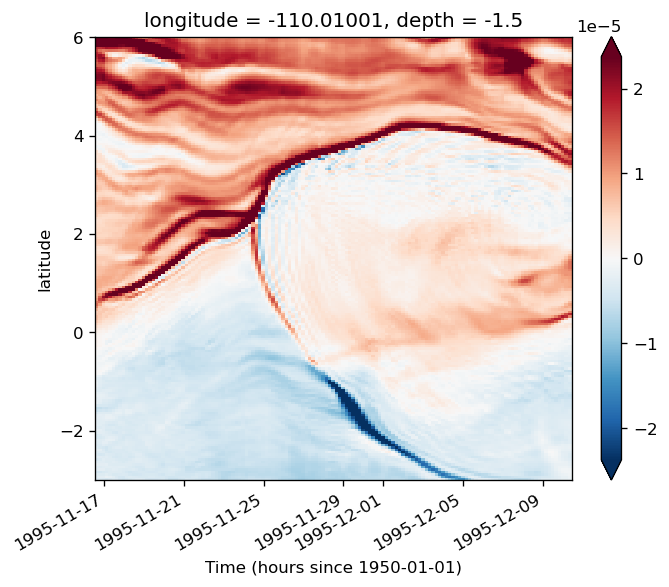
(f + vvort.zeta).isel(depth=1).sel(latitude=slice(-3, 6)).plot(x="time", robust=True)
<matplotlib.collections.QuadMesh at 0x2b16b6c32fd0>
vvort[["xcomp", "ycomp"]].sel(depth=slice(-60), latitude=slice(-3, 6)).mean(
"depth"
).to_array("comp").plot(col="comp", robust=True)
<xarray.plot.facetgrid.FacetGrid at 0x2b3cb8ec62e8>
depth slices shear evolution terms#
large advection at the surface
plot_shear_terms(duzdt.sel(depth=[-20, -40, -60], method="nearest"), dcl)
plot_shear_terms(dvzdt.sel(depth=[-20, -40, -60], method="nearest"), dcl)
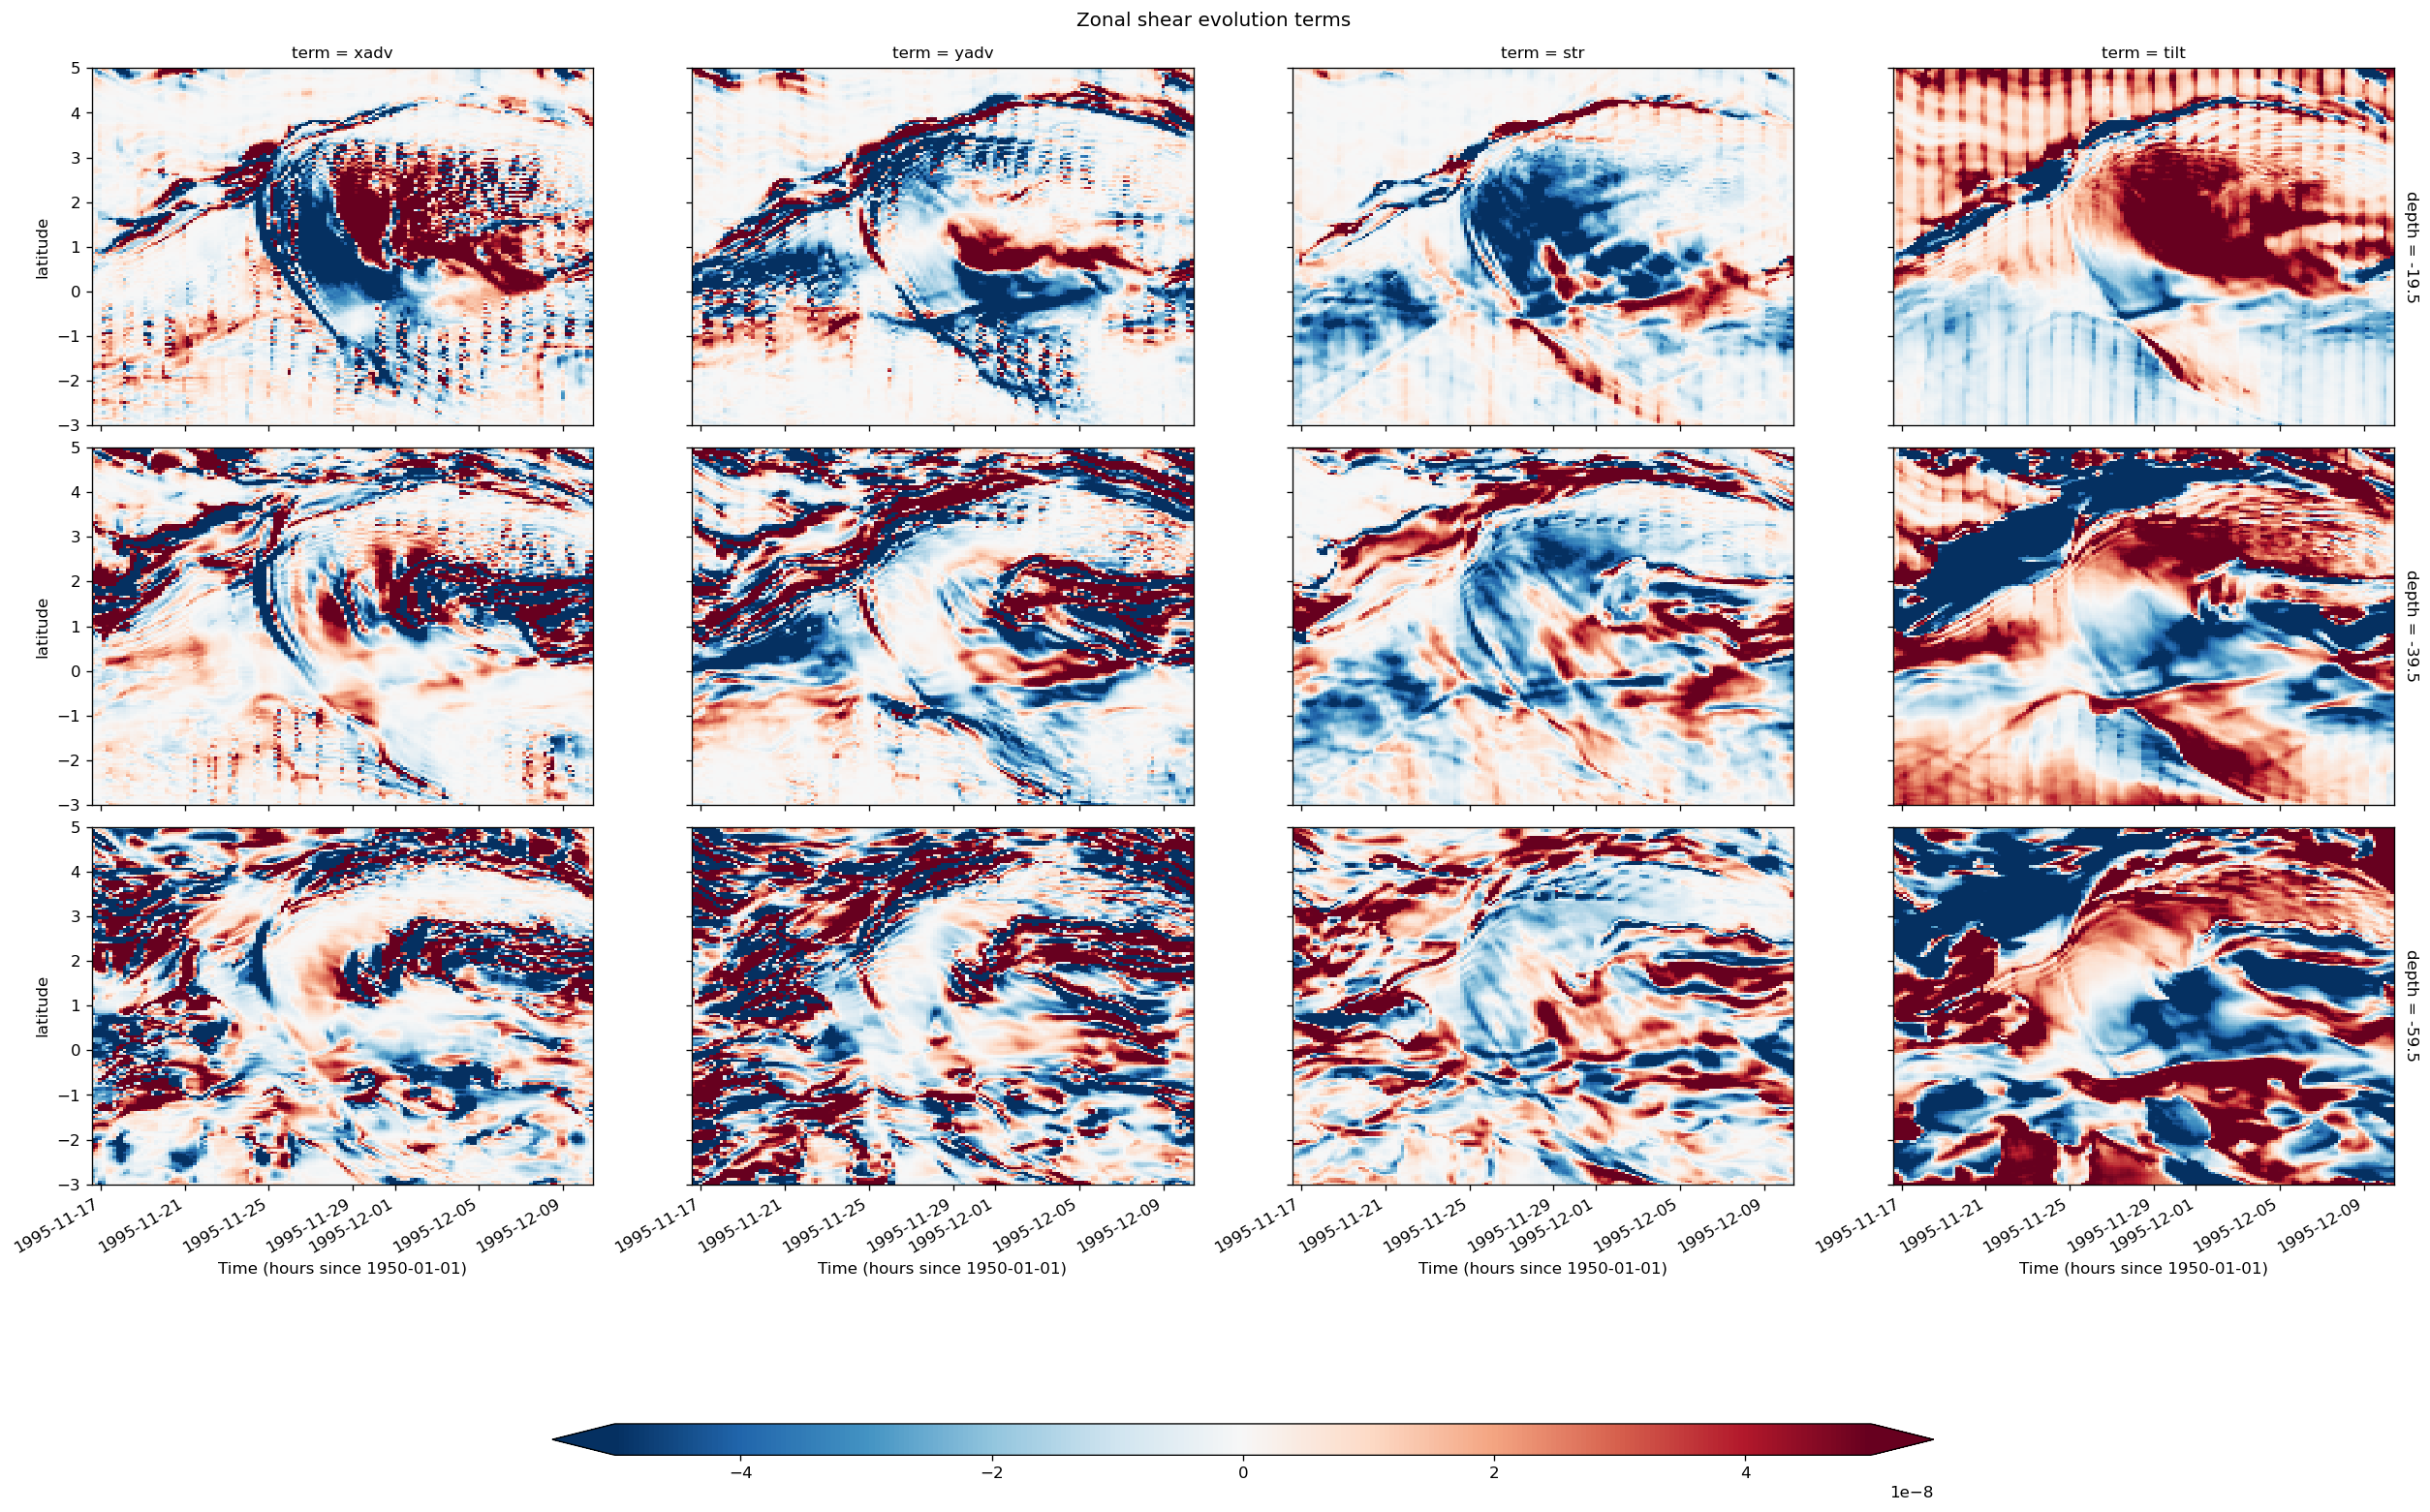
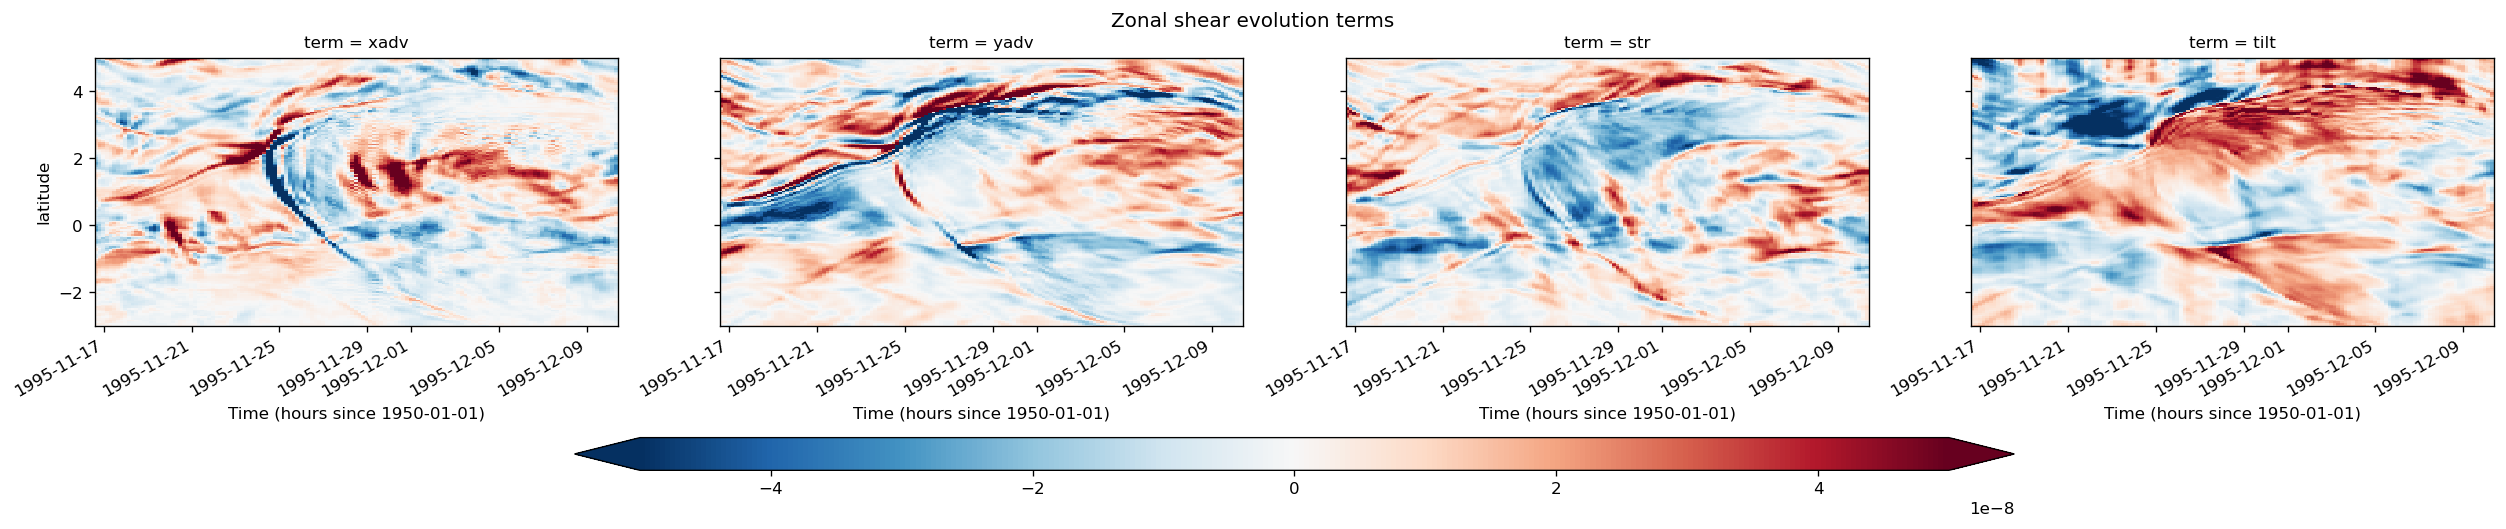
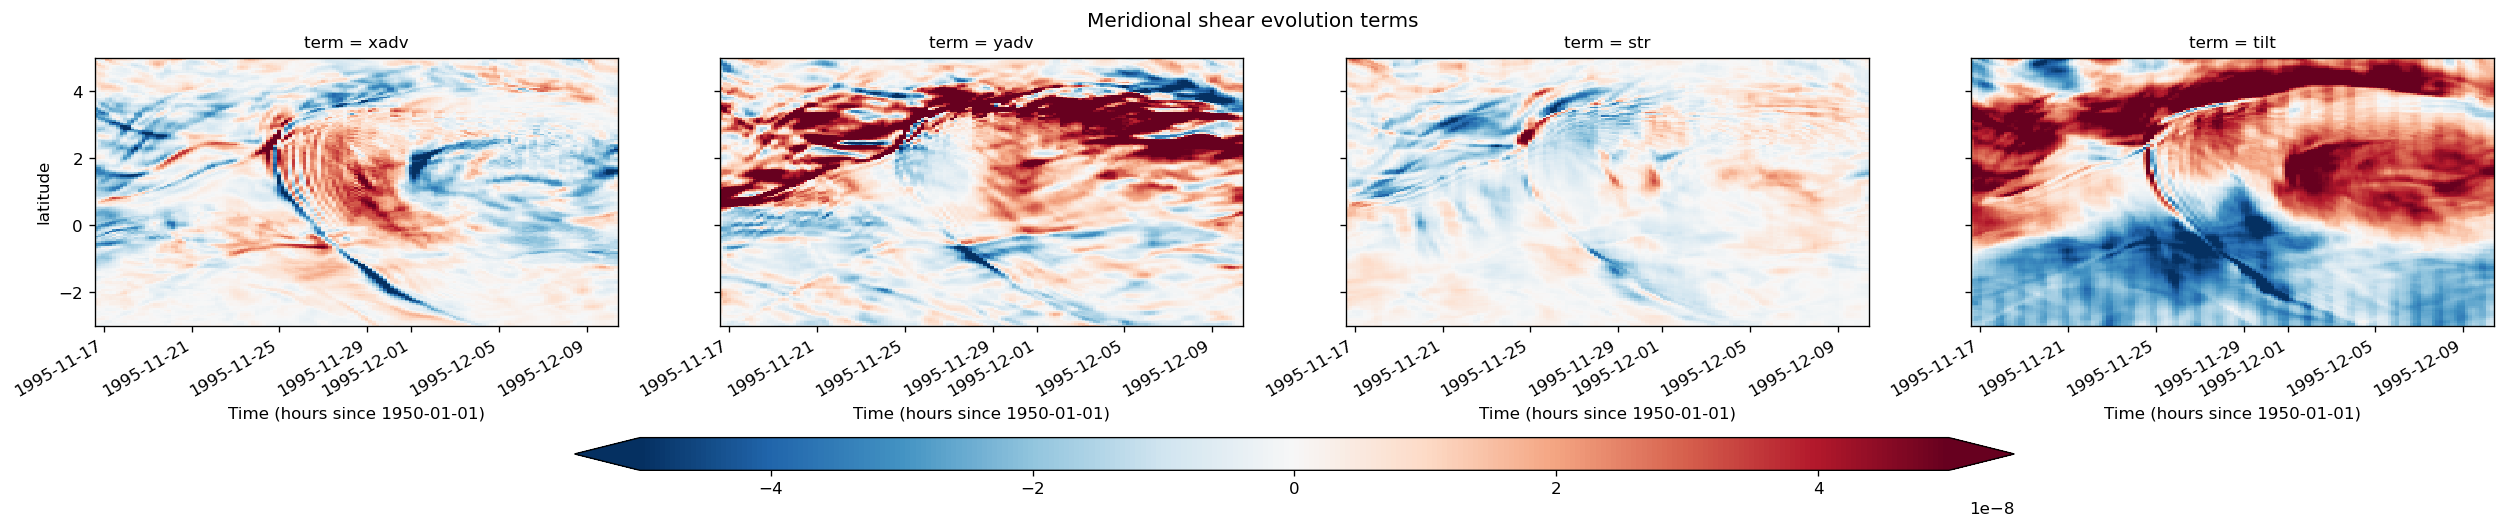
depth averaged shear evolution terms#
plot_shear_terms(duzdt.sel(depth=slice(-60)).mean("depth", keep_attrs=True), dcl)
plot_shear_terms(dvzdt.sel(depth=slice(-60)).mean("depth", keep_attrs=True), dcl)
plot_shear_terms(duzdt.sel(depth=slice(-90)).mean("depth", keep_attrs=True))
plot_shear_terms(dvzdt.sel(depth=slice(-90)).mean("depth", keep_attrs=True))
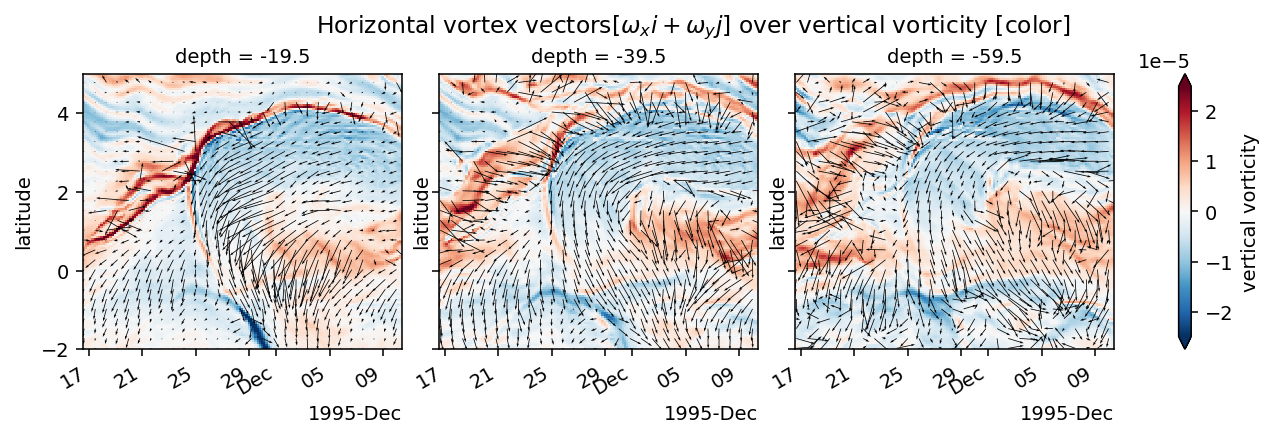
vertical and horizontal vorticity#
vort = xr.Dataset()
vort["x"] = ddy(ds.w) - ds.v.differentiate("depth")
vort["y"] = ds.u.differentiate("depth") - ddx(ds.w)
vort["z"] = ddx(ds.v) - ddy(ds.u)
vort["vx"] = ddx(ds.v)
vort["uy"] = ddy(ds.u)
vort = vort.isel(longitude=1).load()
subset = (
vort.sel(depth=(-20, -40, -60), method="nearest")
.sel(latitude=slice(-2, 5))
.isel(latitude=slice(None, None, 5), time=slice(None, None, 5))
)
fg = quiver(
subset,
u="x",
v="y",
x="time",
y="latitude",
col="depth",
scale=0.4,
)
uvsub = (
ds.isel(longitude=1)[["u", "v"]]
# .differentiate("depth")
.sel(latitude=slice(-2, 5)).isel(
latitude=slice(None, None, 6), time=slice(None, None, 6)
)
).load()
for loc, ax in zip(fg.name_dicts.flat, fg.axes.flat):
quiver(
uvsub.sel(loc).load(),
u="u",
v="v",
x="time",
y="latitude",
scale=10,
ax=ax,
color="r",
)
subset = vort.sel(depth=(-20, -40, -60), method="nearest").sel(latitude=slice(-2, 5))
fg = subset.z.sel(depth=(-20, -40, -60), method="nearest").plot(
x="time", col="depth", vmax=2.5e-5, cbar_kwargs={"label": "vertical vorticity"}
)
subset.time.attrs["name"] = ""
for loc, ax in zip(fg.name_dicts.flat, fg.axes.flat):
quiver(
subset.isel(latitude=slice(None, None, 5), time=slice(None, None, 5))
.sel(loc)
.load(),
u="x",
v="y",
x="time",
y="latitude",
scale=0.3,
ax=ax,
color="k",
)
fg.set_xlabels("")
fg.fig.suptitle(
"Horizontal vortex vectors[$ω_xi + ω_yj$] over vertical vorticity [color]", y=1.03
)
plt.gcf().savefig("images/110-period-4-horizontal-vertical-vorticity-depth.png")
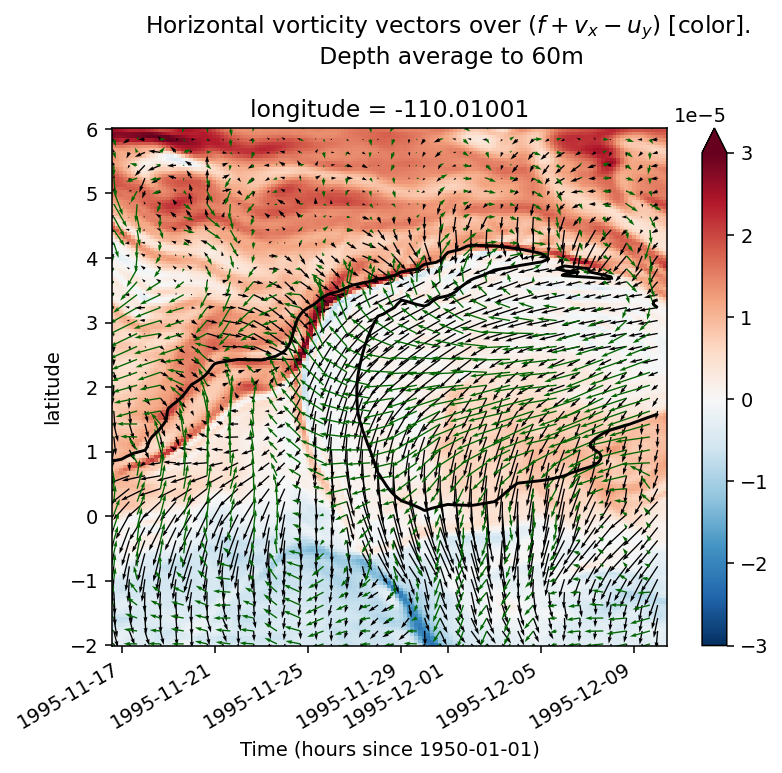
subset = vort.sel(latitude=slice(-2, 6), depth=slice(0, -60)).mean("depth")
f0 = f.reindex_like(subset.z)
subset.z.attrs["long_name"] = "vert vorticity"
((f0 + subset.vx - subset.uy)).plot(x="time", vmax=3e-5)
(
ds.theta.isel(depth=0, longitude=1)
.resample(time="D")
.mean()
.plot.contour(x="time", colors="k", levels=[23.8], zorder=2, add_labels=False)
)
quiver(
subset.isel(latitude=slice(None, None, 4), time=slice(None, None, 4)),
u="x",
v="y",
x="time",
y="latitude",
scale=0.3,
)
quiver(
ds.sel(depth=-30, method="nearest").isel(
longitude=1, latitude=slice(None, None, 4), time=slice(None, None, 6)
),
u="u",
v="v",
x="time",
y="latitude",
color="darkgreen",
scale=12,
)
plt.gcf().suptitle(
"Horizontal vorticity vectors over ($f+v_x - u_y$) [color].\n Depth average to 60m",
y=1.05,
)
# plt.gcf().savefig("images/110-period-4-horizontal-vertical-vorticity.png")
Text(0.5, 1.05, 'Horizontal vorticity vectors over ($f+v_x - u_y$) [color].\n Depth average to 60m')
quiver(subset, x="time", y="latitude", u="u", v="v", scale=10)
subset = (
ds.isel(longitude=1)
.sel(
latitude=slice(
-2,
6,
),
depth=slice(-20, -60),
)
.isel(latitude=slice(0, -1, 2))
.mean("depth")
.resample(time="D")
.mean()
)
t = (subset.time - subset.time[0]).values.astype("timedelta64[s]").astype("float32")
x = t * 1200e3 / 25 / 86400
y = subset.latitude # np.linspace(-2, 6, 100)
start_points = [x[-4] * np.ones_like(y), y]
start_points = np.stack(start_points).T
plt.streamplot(
x,
y,
subset.u.transpose().values,
subset.v.transpose().values,
integration_direction="forward",
start_points=start_points,
)
older plots#
plot_shear_terms(duzdt.sel(depth=[-25, -50, -75], method="nearest"))
plot_shear_terms(dvzdt.sel(depth=[-25, -50, -75], method="nearest"))
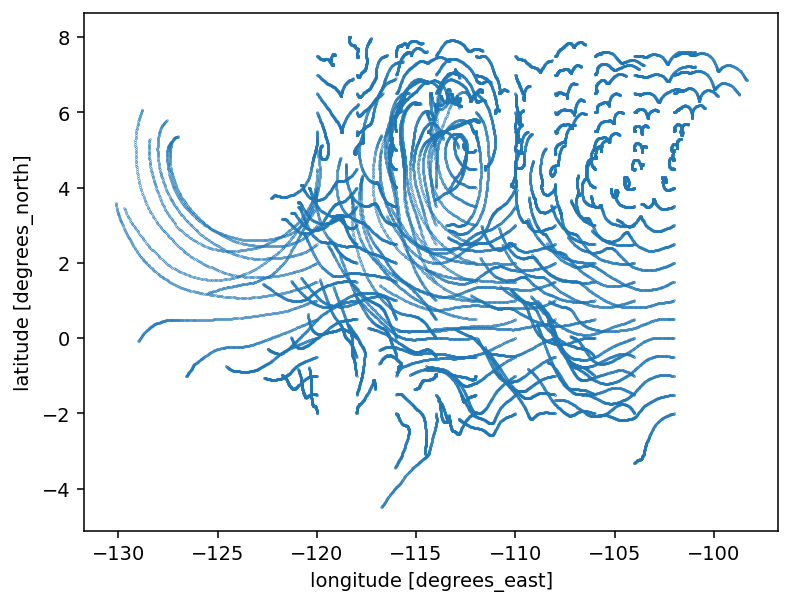
particle tracking#
from datetime import timedelta as delta
import numpy as np
import xarray as xr
from parcels import (
AdvectionRK4,
FieldSet,
JITParticle,
ParticleSet,
plotTrajectoriesFile,
)
variables = {"U": "u", "V": "v"}
dimensions = {"lon": "longitude", "lat": "latitude", "time": "time"}
fset = FieldSet.from_xarray_dataset(gcm1.surface, variables, dimensions)
# fset.add_periodic_halo(zonal=True, meridional=False, halosize=2)
fset
WARNING: Casting depth data to np.float32
WARNING:parcels.tools.loggers:Casting depth data to np.float32
<parcels.fieldset.FieldSet at 0x2b3a5b619b70>
lons, lats = np.meshgrid(np.arange(-120.0, -105.0, 0.2), np.arange(-2, 8, 0.5))
pset = ParticleSet(fset, JITParticle, lon=lons, lat=lats)
ofile = pset.ParticleFile("particles.nc", outputdt=delta(hours=1))
kernel =
def beach(particle, fieldset, time):
if particle.lon > -96:
particle.lon = -96
gcm1.surface
<xarray.Dataset>
Dimensions: (latitude: 480, longitude: 1500, time: 2947)
Coordinates:
* latitude (latitude) float32 -12.0 -11.949896 ... 11.949896 12.0
depth float32 ...
* longitude (longitude) float32 -170.0 -169.94997 ... -95.05003 -95.0
* time (time) datetime64[ns] 1995-09-01 ... 1997-01-04T12:00:00
Data variables:
theta (time, latitude, longitude) float32 dask.array<chunksize=(227, 480, 116), meta=np.ndarray>
u (time, latitude, longitude) float32 dask.array<chunksize=(227, 480, 116), meta=np.ndarray>
v (time, latitude, longitude) float32 dask.array<chunksize=(227, 480, 116), meta=np.ndarray>
w (time, latitude, longitude) float32 dask.array<chunksize=(227, 480, 116), meta=np.ndarray>
salt (time, latitude, longitude) float32 dask.array<chunksize=(227, 480, 116), meta=np.ndarray>
KPP_diffusivity (time, latitude, longitude) float32 dask.array<chunksize=(227, 480, 116), meta=np.ndarray>
zeta (time, latitude, longitude) float32 ...
Attributes:
title: daily snapshot from 1/20 degree Equatorial Pacific MI...
easting: longitude
northing: latitude
field_julian_date: 400296
julian_day_unit: days since 1950-01-01 00:00:00# %%time
# Advect ParticleSet with RK4 and periodic Boundary conditions
pset.execute(
pset.Kernel(AdvectionRK4) + pset.Kernel(beach),
runtime=delta(days=60),
dt=delta(minutes=30),
output_file=ofile,
)
INFO: Compiled JITParticleAdvectionRK4beach ==> /glade/scratch/dcherian/parcels-25721/3d4cb8c8bf1b028586a64d8cc3f66cce_0.so
INFO:parcels.tools.loggers:Compiled JITParticleAdvectionRK4beach ==> /glade/scratch/dcherian/parcels-25721/3d4cb8c8bf1b028586a64d8cc3f66cce_0.so
INFO: Temporary output files are stored in out-NQNDSGCQ.
INFO:parcels.tools.loggers:Temporary output files are stored in out-NQNDSGCQ.
INFO: You can use "parcels_convert_npydir_to_netcdf out-NQNDSGCQ" to convert these to a NetCDF file during the run.
INFO:parcels.tools.loggers:You can use "parcels_convert_npydir_to_netcdf out-NQNDSGCQ" to convert these to a NetCDF file during the run.
100% (5184000.0 of 5184000.0) |##########| Elapsed Time: 0:01:12 Time: 0:01:12
ds = xr.open_dataset("particles.nc").set_coords(["time"])
ds["time"] = ds.time.isel(traj=0, drop=True)
ds = ds.rename({"obs": "time"})
ds["trajectory"] = ds.trajectory.isel(time=0)
ds = ds.rename({"trajectory": "traj"})
ds = ds.set_coords("traj")
ds
<xarray.Dataset>
Dimensions: (time: 241, traj: 2000)
Coordinates:
* traj (traj) float64 0.0 1.0 2.0 3.0 ... 1.997e+03 1.998e+03 1.999e+03
* time (time) datetime64[ns] 1995-09-01 1995-09-01T01:00:00 ... 1995-09-11
Data variables:
lat (traj, time) float32 ...
lon (traj, time) float32 ...
z (traj, time) float32 ...
Attributes:
feature_type: trajectory
Conventions: CF-1.6/CF-1.7
ncei_template_version: NCEI_NetCDF_Trajectory_Template_v2.0
parcels_version: 2.1.4
parcels_mesh: sphericalds.sel(traj=slice(None, None, 10)).plot.scatter(x="lon", y="lat", s=0.05)
<matplotlib.collections.PathCollection at 0x2b3a52b15588>
Read new hourly output#
dirname = "/glade/campaign/cgd/oce/people/dcherian/TPOS_MITgcm_1_hb/HOLD"
metrics = pump.model.read_metrics(f"{dirname}/../")
ds = xr.open_mfdataset(f"{dirname}/File_*.nc", parallel=True)
# RAC = xr.align(metrics.RAC, ds, join="right")[0].chunk(
# {k: v for k, v in ds.chunks.items() if k in ["latitude", "longitude"]}
# )
# ds["Jq"] = 1035 * 3994 * (ds.DFrI_TH + ds.KPPg_TH) / RAC
ds
<xarray.Dataset>
Dimensions: (depth: 280, latitude: 400, longitude: 1420, time: 779)
Coordinates:
* latitude (latitude) float32 -10.0 -9.95 -9.9 -9.85 ... 9.85 9.9 9.95 10.0
* longitude (longitude) float32 -168.0 -167.9 -167.9 ... -97.1 -97.05 -97.0
* depth (depth) float32 -0.5 -1.5 -2.5 -3.5 ... -378.4 -391.7 -406.3
* time (time) datetime64[ns] 1995-11-15 ... 1995-12-17T10:00:00
Data variables:
DFrI_TH (time, depth, latitude, longitude) float32 dask.array<chunksize=(1, 280, 400, 1420), meta=np.ndarray>
VISrI_Um (time, depth, latitude, longitude) float32 dask.array<chunksize=(1, 280, 400, 1420), meta=np.ndarray>
VISrI_Vm (time, depth, latitude, longitude) float32 dask.array<chunksize=(1, 280, 400, 1420), meta=np.ndarray>
Um_Diss (time, depth, latitude, longitude) float32 dask.array<chunksize=(1, 280, 400, 1420), meta=np.ndarray>
Vm_Diss (time, depth, latitude, longitude) float32 dask.array<chunksize=(1, 280, 400, 1420), meta=np.ndarray>
ETAN (time, latitude, longitude) float32 dask.array<chunksize=(1, 400, 1420), meta=np.ndarray>
KPPviscA (time, depth, latitude, longitude) float32 dask.array<chunksize=(1, 280, 400, 1420), meta=np.ndarray>
KPPdiffT (time, depth, latitude, longitude) float32 dask.array<chunksize=(1, 280, 400, 1420), meta=np.ndarray>
KPPRi (time, depth, latitude, longitude) float32 dask.array<chunksize=(1, 280, 400, 1420), meta=np.ndarray>
KPPg_TH (time, depth, latitude, longitude) float32 dask.array<chunksize=(1, 280, 400, 1420), meta=np.ndarray>
KPPhbl (time, latitude, longitude) float32 dask.array<chunksize=(1, 400, 1420), meta=np.ndarray>
KPPbo (time, latitude, longitude) float32 dask.array<chunksize=(1, 400, 1420), meta=np.ndarray>
theta (time, depth, latitude, longitude) float32 dask.array<chunksize=(1, 280, 400, 1420), meta=np.ndarray>
u (time, depth, latitude, longitude) float32 dask.array<chunksize=(1, 280, 400, 1420), meta=np.ndarray>
v (time, depth, latitude, longitude) float32 dask.array<chunksize=(1, 280, 400, 1420), meta=np.ndarray>
w (time, depth, latitude, longitude) float32 dask.array<chunksize=(1, 280, 400, 1420), meta=np.ndarray>
salt (time, depth, latitude, longitude) float32 dask.array<chunksize=(1, 280, 400, 1420), meta=np.ndarray>
Attributes:
title: daily snapshot from 1/20 degree Equatorial Pacific MI...
easting: longitude
northing: latitude
field_julian_date: 400296
julian_day_unit: days since 1950-01-01 00:00:00- depth: 280
- latitude: 400
- longitude: 1420
- time: 779
- latitude(latitude)float32-10.0 -9.95 -9.9 ... 9.9 9.95 10.0
array([-10. , -9.949875, -9.89975 , ..., 9.89975 , 9.949875, 10. ], dtype=float32) - longitude(longitude)float32-168.0 -167.9 ... -97.05 -97.0
array([-168. , -167.94997, -167.89993, ..., -97.10007, -97.05003, -97. ], dtype=float32) - depth(depth)float32-0.5 -1.5 -2.5 ... -391.7 -406.3
array([ -0.5 , -1.5 , -2.5 , ..., -378.44086, -391.7377 , -406.29776], dtype=float32) - time(time)datetime64[ns]1995-11-15 ... 1995-12-17T10:00:00
- long_name :
- Time (hours since 1950-01-01)
- standard_name :
- time
- axis :
- T
- _CoordinateAxisType :
- Time
array(['1995-11-15T00:00:00.000000000', '1995-11-15T01:00:00.000000000', '1995-11-15T02:00:00.000000000', ..., '1995-12-17T08:00:00.000000000', '1995-12-17T09:00:00.000000000', '1995-12-17T10:00:00.000000000'], dtype='datetime64[ns]')
- DFrI_TH(time, depth, latitude, longitude)float32dask.array<chunksize=(1, 280, 400, 1420), meta=np.ndarray>
Array Chunk Bytes 495.57 GB 636.16 MB Shape (779, 280, 400, 1420) (1, 280, 400, 1420) Count 2337 Tasks 779 Chunks Type float32 numpy.ndarray - VISrI_Um(time, depth, latitude, longitude)float32dask.array<chunksize=(1, 280, 400, 1420), meta=np.ndarray>
Array Chunk Bytes 495.57 GB 636.16 MB Shape (779, 280, 400, 1420) (1, 280, 400, 1420) Count 2337 Tasks 779 Chunks Type float32 numpy.ndarray - VISrI_Vm(time, depth, latitude, longitude)float32dask.array<chunksize=(1, 280, 400, 1420), meta=np.ndarray>
Array Chunk Bytes 495.57 GB 636.16 MB Shape (779, 280, 400, 1420) (1, 280, 400, 1420) Count 2337 Tasks 779 Chunks Type float32 numpy.ndarray - Um_Diss(time, depth, latitude, longitude)float32dask.array<chunksize=(1, 280, 400, 1420), meta=np.ndarray>
Array Chunk Bytes 495.57 GB 636.16 MB Shape (779, 280, 400, 1420) (1, 280, 400, 1420) Count 2337 Tasks 779 Chunks Type float32 numpy.ndarray - Vm_Diss(time, depth, latitude, longitude)float32dask.array<chunksize=(1, 280, 400, 1420), meta=np.ndarray>
Array Chunk Bytes 495.57 GB 636.16 MB Shape (779, 280, 400, 1420) (1, 280, 400, 1420) Count 2337 Tasks 779 Chunks Type float32 numpy.ndarray - ETAN(time, latitude, longitude)float32dask.array<chunksize=(1, 400, 1420), meta=np.ndarray>
Array Chunk Bytes 1.77 GB 2.27 MB Shape (779, 400, 1420) (1, 400, 1420) Count 2337 Tasks 779 Chunks Type float32 numpy.ndarray - KPPviscA(time, depth, latitude, longitude)float32dask.array<chunksize=(1, 280, 400, 1420), meta=np.ndarray>
Array Chunk Bytes 495.57 GB 636.16 MB Shape (779, 280, 400, 1420) (1, 280, 400, 1420) Count 2337 Tasks 779 Chunks Type float32 numpy.ndarray - KPPdiffT(time, depth, latitude, longitude)float32dask.array<chunksize=(1, 280, 400, 1420), meta=np.ndarray>
Array Chunk Bytes 495.57 GB 636.16 MB Shape (779, 280, 400, 1420) (1, 280, 400, 1420) Count 2337 Tasks 779 Chunks Type float32 numpy.ndarray - KPPRi(time, depth, latitude, longitude)float32dask.array<chunksize=(1, 280, 400, 1420), meta=np.ndarray>
Array Chunk Bytes 495.57 GB 636.16 MB Shape (779, 280, 400, 1420) (1, 280, 400, 1420) Count 2337 Tasks 779 Chunks Type float32 numpy.ndarray - KPPg_TH(time, depth, latitude, longitude)float32dask.array<chunksize=(1, 280, 400, 1420), meta=np.ndarray>
Array Chunk Bytes 495.57 GB 636.16 MB Shape (779, 280, 400, 1420) (1, 280, 400, 1420) Count 2337 Tasks 779 Chunks Type float32 numpy.ndarray - KPPhbl(time, latitude, longitude)float32dask.array<chunksize=(1, 400, 1420), meta=np.ndarray>
Array Chunk Bytes 1.77 GB 2.27 MB Shape (779, 400, 1420) (1, 400, 1420) Count 2337 Tasks 779 Chunks Type float32 numpy.ndarray - KPPbo(time, latitude, longitude)float32dask.array<chunksize=(1, 400, 1420), meta=np.ndarray>
Array Chunk Bytes 1.77 GB 2.27 MB Shape (779, 400, 1420) (1, 400, 1420) Count 2337 Tasks 779 Chunks Type float32 numpy.ndarray - theta(time, depth, latitude, longitude)float32dask.array<chunksize=(1, 280, 400, 1420), meta=np.ndarray>
Array Chunk Bytes 495.57 GB 636.16 MB Shape (779, 280, 400, 1420) (1, 280, 400, 1420) Count 2337 Tasks 779 Chunks Type float32 numpy.ndarray - u(time, depth, latitude, longitude)float32dask.array<chunksize=(1, 280, 400, 1420), meta=np.ndarray>
Array Chunk Bytes 495.57 GB 636.16 MB Shape (779, 280, 400, 1420) (1, 280, 400, 1420) Count 2337 Tasks 779 Chunks Type float32 numpy.ndarray - v(time, depth, latitude, longitude)float32dask.array<chunksize=(1, 280, 400, 1420), meta=np.ndarray>
Array Chunk Bytes 495.57 GB 636.16 MB Shape (779, 280, 400, 1420) (1, 280, 400, 1420) Count 2337 Tasks 779 Chunks Type float32 numpy.ndarray - w(time, depth, latitude, longitude)float32dask.array<chunksize=(1, 280, 400, 1420), meta=np.ndarray>
Array Chunk Bytes 495.57 GB 636.16 MB Shape (779, 280, 400, 1420) (1, 280, 400, 1420) Count 2337 Tasks 779 Chunks Type float32 numpy.ndarray - salt(time, depth, latitude, longitude)float32dask.array<chunksize=(1, 280, 400, 1420), meta=np.ndarray>
Array Chunk Bytes 495.57 GB 636.16 MB Shape (779, 280, 400, 1420) (1, 280, 400, 1420) Count 2337 Tasks 779 Chunks Type float32 numpy.ndarray
- title :
- daily snapshot from 1/20 degree Equatorial Pacific MITgcm simulation
- easting :
- longitude
- northing :
- latitude
- field_julian_date :
- 400296
- julian_day_unit :
- days since 1950-01-01 00:00:00
idx = ds.indexes["longitude"].get_loc(-110, method="nearest")
period4 = dcpy.dask.map_copy(
ds.isel(longitude=[idx - 1, idx, idx + 1]).sel(depth=slice(-200))
)
period4.to_zarr(
"/glade/work/dcherian/pump/zarrs/110w-period-4-3.zarr",
consolidated=True,
mode="w",
)
<xarray.backends.zarr.ZarrStore at 0x2b629541f040>
RAC = metrics.RAC.reindex(
longitude=period4.longitude, latitude=period4.latitude, method="nearest"
) # .isel(longitude=[idx - 1, idx, idx + 1])
period4 = xr.open_zarr(
"/glade/work/dcherian/pump/zarrs/110w-period-4-3.zarr", consolidated=True
)
period4["Jq"] = 1035 * 3994 * (period4.DFrI_TH + period4.KPPg_TH.fillna(0)) / RAC
period4["time"] = period4["time"] - pd.Timedelta("7h")
period4["dens"] = pump.mdjwf.dens(period4.salt, period4.theta, np.array([0.0]))
period4 = pump.calc.calc_reduced_shear(period4)
period4["mld"] = pump.calc.get_mld(period4.dens)
period4["dcl_base"] = pump.calc.get_dcl_base_Ri(period4)
period4["dcl"] = period4["mld"] - period4["dcl_base"]
period4["sst"] = period4.theta.isel(depth=0)
period4["eucmax"] = pump.calc.get_euc_max(
period4.u.sel(latitude=0, method="nearest", drop=True)
)
period4.depth.attrs["units"] = "m"
period4.Jq.attrs["long_name"] = "$J^t_q$"
period4.Jq.attrs["units"] = "W/m²"
period4.S2.attrs["long_name"] = "$S²$"
period4.S2.attrs["units"] = "$s^{-2}$"
period4.Ri.attrs["long_name"] = "$Ri$"
period4.N2.attrs["long_name"] = "$N²$"
period4.N2.attrs["units"] = "$s^{-2}$"
period4
calc uz
calc vz
calc S2
calc N2
calc shred2
Calc Ri
<xarray.Dataset>
Dimensions: (depth: 200, latitude: 400, longitude: 3, time: 779)
Coordinates:
* depth (depth) float32 -0.5 -1.5 -2.5 -3.5 ... -197.5 -198.5 -199.5
* latitude (latitude) float32 -10.0 -9.95 -9.9 -9.85 ... 9.85 9.9 9.95 10.0
* longitude (longitude) float64 -110.1 -110.0 -110.0
* time (time) datetime64[ns] 1995-11-14T17:00:00 ... 1995-12-17T03:00:00
Data variables:
DFrI_TH (time, depth, latitude, longitude) float32 dask.array<chunksize=(1, 200, 400, 3), meta=np.ndarray>
ETAN (time, latitude, longitude) float32 dask.array<chunksize=(1, 400, 3), meta=np.ndarray>
KPPRi (time, depth, latitude, longitude) float32 dask.array<chunksize=(1, 200, 400, 3), meta=np.ndarray>
KPPbo (time, latitude, longitude) float32 dask.array<chunksize=(1, 400, 3), meta=np.ndarray>
KPPdiffT (time, depth, latitude, longitude) float32 dask.array<chunksize=(1, 200, 400, 3), meta=np.ndarray>
KPPg_TH (time, depth, latitude, longitude) float32 dask.array<chunksize=(1, 200, 400, 3), meta=np.ndarray>
KPPhbl (time, latitude, longitude) float32 dask.array<chunksize=(1, 400, 3), meta=np.ndarray>
KPPviscA (time, depth, latitude, longitude) float32 dask.array<chunksize=(1, 200, 400, 3), meta=np.ndarray>
Um_Diss (time, depth, latitude, longitude) float32 dask.array<chunksize=(1, 200, 400, 3), meta=np.ndarray>
VISrI_Um (time, depth, latitude, longitude) float32 dask.array<chunksize=(1, 200, 400, 3), meta=np.ndarray>
VISrI_Vm (time, depth, latitude, longitude) float32 dask.array<chunksize=(1, 200, 400, 3), meta=np.ndarray>
Vm_Diss (time, depth, latitude, longitude) float32 dask.array<chunksize=(1, 200, 400, 3), meta=np.ndarray>
salt (time, depth, latitude, longitude) float32 dask.array<chunksize=(1, 200, 400, 3), meta=np.ndarray>
theta (time, depth, latitude, longitude) float32 dask.array<chunksize=(1, 200, 400, 3), meta=np.ndarray>
u (time, depth, latitude, longitude) float32 dask.array<chunksize=(1, 200, 400, 3), meta=np.ndarray>
v (time, depth, latitude, longitude) float32 dask.array<chunksize=(1, 200, 400, 3), meta=np.ndarray>
w (time, depth, latitude, longitude) float32 dask.array<chunksize=(1, 200, 400, 3), meta=np.ndarray>
Jq (time, depth, latitude, longitude) float64 dask.array<chunksize=(1, 200, 400, 3), meta=np.ndarray>
dens (time, depth, latitude, longitude) float64 dask.array<chunksize=(1, 200, 400, 3), meta=np.ndarray>
uz (time, depth, latitude, longitude) float32 dask.array<chunksize=(1, 200, 400, 3), meta=np.ndarray>
vz (time, depth, latitude, longitude) float32 dask.array<chunksize=(1, 200, 400, 3), meta=np.ndarray>
S2 (time, depth, latitude, longitude) float32 dask.array<chunksize=(1, 200, 400, 3), meta=np.ndarray>
shear (time, depth, latitude, longitude) float32 dask.array<chunksize=(1, 200, 400, 3), meta=np.ndarray>
N2 (time, depth, latitude, longitude) float64 dask.array<chunksize=(1, 200, 400, 3), meta=np.ndarray>
shred2 (time, depth, latitude, longitude) float64 dask.array<chunksize=(1, 200, 400, 3), meta=np.ndarray>
Ri (time, depth, latitude, longitude) float64 dask.array<chunksize=(1, 200, 400, 3), meta=np.ndarray>
mld (time, latitude, longitude) float32 dask.array<chunksize=(1, 400, 3), meta=np.ndarray>
dcl_base (time, latitude, longitude) float32 dask.array<chunksize=(1, 400, 3), meta=np.ndarray>
dcl (time, latitude, longitude) float32 dask.array<chunksize=(1, 400, 3), meta=np.ndarray>
sst (time, latitude, longitude) float32 dask.array<chunksize=(1, 400, 3), meta=np.ndarray>
eucmax (time, longitude) float64 -96.5 -97.5 -97.5 ... -99.5 -99.5 -99.5
Attributes:
easting: longitude
field_julian_date: 400296
julian_day_unit: days since 1950-01-01 00:00:00
northing: latitude
title: daily snapshot from 1/20 degree Equatorial Pacific MI...- depth: 200
- latitude: 400
- longitude: 3
- time: 779
- depth(depth)float32-0.5 -1.5 -2.5 ... -198.5 -199.5
- units :
- m
array([ -0.5, -1.5, -2.5, -3.5, -4.5, -5.5, -6.5, -7.5, -8.5, -9.5, -10.5, -11.5, -12.5, -13.5, -14.5, -15.5, -16.5, -17.5, -18.5, -19.5, -20.5, -21.5, -22.5, -23.5, -24.5, -25.5, -26.5, -27.5, -28.5, -29.5, -30.5, -31.5, -32.5, -33.5, -34.5, -35.5, -36.5, -37.5, -38.5, -39.5, -40.5, -41.5, -42.5, -43.5, -44.5, -45.5, -46.5, -47.5, -48.5, -49.5, -50.5, -51.5, -52.5, -53.5, -54.5, -55.5, -56.5, -57.5, -58.5, -59.5, -60.5, -61.5, -62.5, -63.5, -64.5, -65.5, -66.5, -67.5, -68.5, -69.5, -70.5, -71.5, -72.5, -73.5, -74.5, -75.5, -76.5, -77.5, -78.5, -79.5, -80.5, -81.5, -82.5, -83.5, -84.5, -85.5, -86.5, -87.5, -88.5, -89.5, -90.5, -91.5, -92.5, -93.5, -94.5, -95.5, -96.5, -97.5, -98.5, -99.5, -100.5, -101.5, -102.5, -103.5, -104.5, -105.5, -106.5, -107.5, -108.5, -109.5, -110.5, -111.5, -112.5, -113.5, -114.5, -115.5, -116.5, -117.5, -118.5, -119.5, -120.5, -121.5, -122.5, -123.5, -124.5, -125.5, -126.5, -127.5, -128.5, -129.5, -130.5, -131.5, -132.5, -133.5, -134.5, -135.5, -136.5, -137.5, -138.5, -139.5, -140.5, -141.5, -142.5, -143.5, -144.5, -145.5, -146.5, -147.5, -148.5, -149.5, -150.5, -151.5, -152.5, -153.5, -154.5, -155.5, -156.5, -157.5, -158.5, -159.5, -160.5, -161.5, -162.5, -163.5, -164.5, -165.5, -166.5, -167.5, -168.5, -169.5, -170.5, -171.5, -172.5, -173.5, -174.5, -175.5, -176.5, -177.5, -178.5, -179.5, -180.5, -181.5, -182.5, -183.5, -184.5, -185.5, -186.5, -187.5, -188.5, -189.5, -190.5, -191.5, -192.5, -193.5, -194.5, -195.5, -196.5, -197.5, -198.5, -199.5], dtype=float32) - latitude(latitude)float32-10.0 -9.95 -9.9 ... 9.9 9.95 10.0
array([-10. , -9.949875, -9.89975 , ..., 9.89975 , 9.949875, 10. ], dtype=float32) - longitude(longitude)float64-110.1 -110.0 -110.0
array([-110.059196, -110.009163, -109.959129])
- time(time)datetime64[ns]1995-11-14T17:00:00 ... 1995-12-...
- _CoordinateAxisType :
- Time
- axis :
- T
- long_name :
- Time (hours since 1950-01-01)
- standard_name :
- time
array(['1995-11-14T17:00:00.000000000', '1995-11-14T18:00:00.000000000', '1995-11-14T19:00:00.000000000', ..., '1995-12-17T01:00:00.000000000', '1995-12-17T02:00:00.000000000', '1995-12-17T03:00:00.000000000'], dtype='datetime64[ns]')
- DFrI_TH(time, depth, latitude, longitude)float32dask.array<chunksize=(1, 200, 400, 3), meta=np.ndarray>
Array Chunk Bytes 747.84 MB 960.00 kB Shape (779, 200, 400, 3) (1, 200, 400, 3) Count 780 Tasks 779 Chunks Type float32 numpy.ndarray - ETAN(time, latitude, longitude)float32dask.array<chunksize=(1, 400, 3), meta=np.ndarray>
Array Chunk Bytes 3.74 MB 4.80 kB Shape (779, 400, 3) (1, 400, 3) Count 780 Tasks 779 Chunks Type float32 numpy.ndarray - KPPRi(time, depth, latitude, longitude)float32dask.array<chunksize=(1, 200, 400, 3), meta=np.ndarray>
Array Chunk Bytes 747.84 MB 960.00 kB Shape (779, 200, 400, 3) (1, 200, 400, 3) Count 780 Tasks 779 Chunks Type float32 numpy.ndarray - KPPbo(time, latitude, longitude)float32dask.array<chunksize=(1, 400, 3), meta=np.ndarray>
Array Chunk Bytes 3.74 MB 4.80 kB Shape (779, 400, 3) (1, 400, 3) Count 780 Tasks 779 Chunks Type float32 numpy.ndarray - KPPdiffT(time, depth, latitude, longitude)float32dask.array<chunksize=(1, 200, 400, 3), meta=np.ndarray>
Array Chunk Bytes 747.84 MB 960.00 kB Shape (779, 200, 400, 3) (1, 200, 400, 3) Count 780 Tasks 779 Chunks Type float32 numpy.ndarray - KPPg_TH(time, depth, latitude, longitude)float32dask.array<chunksize=(1, 200, 400, 3), meta=np.ndarray>
Array Chunk Bytes 747.84 MB 960.00 kB Shape (779, 200, 400, 3) (1, 200, 400, 3) Count 780 Tasks 779 Chunks Type float32 numpy.ndarray - KPPhbl(time, latitude, longitude)float32dask.array<chunksize=(1, 400, 3), meta=np.ndarray>
Array Chunk Bytes 3.74 MB 4.80 kB Shape (779, 400, 3) (1, 400, 3) Count 780 Tasks 779 Chunks Type float32 numpy.ndarray - KPPviscA(time, depth, latitude, longitude)float32dask.array<chunksize=(1, 200, 400, 3), meta=np.ndarray>
Array Chunk Bytes 747.84 MB 960.00 kB Shape (779, 200, 400, 3) (1, 200, 400, 3) Count 780 Tasks 779 Chunks Type float32 numpy.ndarray - Um_Diss(time, depth, latitude, longitude)float32dask.array<chunksize=(1, 200, 400, 3), meta=np.ndarray>
Array Chunk Bytes 747.84 MB 960.00 kB Shape (779, 200, 400, 3) (1, 200, 400, 3) Count 780 Tasks 779 Chunks Type float32 numpy.ndarray - VISrI_Um(time, depth, latitude, longitude)float32dask.array<chunksize=(1, 200, 400, 3), meta=np.ndarray>
Array Chunk Bytes 747.84 MB 960.00 kB Shape (779, 200, 400, 3) (1, 200, 400, 3) Count 780 Tasks 779 Chunks Type float32 numpy.ndarray - VISrI_Vm(time, depth, latitude, longitude)float32dask.array<chunksize=(1, 200, 400, 3), meta=np.ndarray>
Array Chunk Bytes 747.84 MB 960.00 kB Shape (779, 200, 400, 3) (1, 200, 400, 3) Count 780 Tasks 779 Chunks Type float32 numpy.ndarray - Vm_Diss(time, depth, latitude, longitude)float32dask.array<chunksize=(1, 200, 400, 3), meta=np.ndarray>
Array Chunk Bytes 747.84 MB 960.00 kB Shape (779, 200, 400, 3) (1, 200, 400, 3) Count 780 Tasks 779 Chunks Type float32 numpy.ndarray - salt(time, depth, latitude, longitude)float32dask.array<chunksize=(1, 200, 400, 3), meta=np.ndarray>
Array Chunk Bytes 747.84 MB 960.00 kB Shape (779, 200, 400, 3) (1, 200, 400, 3) Count 780 Tasks 779 Chunks Type float32 numpy.ndarray - theta(time, depth, latitude, longitude)float32dask.array<chunksize=(1, 200, 400, 3), meta=np.ndarray>
Array Chunk Bytes 747.84 MB 960.00 kB Shape (779, 200, 400, 3) (1, 200, 400, 3) Count 780 Tasks 779 Chunks Type float32 numpy.ndarray - u(time, depth, latitude, longitude)float32dask.array<chunksize=(1, 200, 400, 3), meta=np.ndarray>
Array Chunk Bytes 747.84 MB 960.00 kB Shape (779, 200, 400, 3) (1, 200, 400, 3) Count 780 Tasks 779 Chunks Type float32 numpy.ndarray - v(time, depth, latitude, longitude)float32dask.array<chunksize=(1, 200, 400, 3), meta=np.ndarray>
Array Chunk Bytes 747.84 MB 960.00 kB Shape (779, 200, 400, 3) (1, 200, 400, 3) Count 780 Tasks 779 Chunks Type float32 numpy.ndarray - w(time, depth, latitude, longitude)float32dask.array<chunksize=(1, 200, 400, 3), meta=np.ndarray>
Array Chunk Bytes 747.84 MB 960.00 kB Shape (779, 200, 400, 3) (1, 200, 400, 3) Count 780 Tasks 779 Chunks Type float32 numpy.ndarray - Jq(time, depth, latitude, longitude)float64dask.array<chunksize=(1, 200, 400, 3), meta=np.ndarray>
- long_name :
- $J^t_q$
- units :
- W/m²
Array Chunk Bytes 1.50 GB 1.92 MB Shape (779, 200, 400, 3) (1, 200, 400, 3) Count 6242 Tasks 779 Chunks Type float64 numpy.ndarray - dens(time, depth, latitude, longitude)float64dask.array<chunksize=(1, 200, 400, 3), meta=np.ndarray>
Array Chunk Bytes 1.50 GB 1.92 MB Shape (779, 200, 400, 3) (1, 200, 400, 3) Count 3898 Tasks 779 Chunks Type float64 numpy.ndarray - uz(time, depth, latitude, longitude)float32dask.array<chunksize=(1, 200, 400, 3), meta=np.ndarray>
Array Chunk Bytes 747.84 MB 960.00 kB Shape (779, 200, 400, 3) (1, 200, 400, 3) Count 5454 Tasks 779 Chunks Type float32 numpy.ndarray - vz(time, depth, latitude, longitude)float32dask.array<chunksize=(1, 200, 400, 3), meta=np.ndarray>
Array Chunk Bytes 747.84 MB 960.00 kB Shape (779, 200, 400, 3) (1, 200, 400, 3) Count 5454 Tasks 779 Chunks Type float32 numpy.ndarray - S2(time, depth, latitude, longitude)float32dask.array<chunksize=(1, 200, 400, 3), meta=np.ndarray>
- long_name :
- $S²$
- units :
- $s^{-2}$
Array Chunk Bytes 747.84 MB 960.00 kB Shape (779, 200, 400, 3) (1, 200, 400, 3) Count 13245 Tasks 779 Chunks Type float32 numpy.ndarray - shear(time, depth, latitude, longitude)float32dask.array<chunksize=(1, 200, 400, 3), meta=np.ndarray>
- long_name :
- |$u_z$|
- units :
- s$^{-1}$
Array Chunk Bytes 747.84 MB 960.00 kB Shape (779, 200, 400, 3) (1, 200, 400, 3) Count 14024 Tasks 779 Chunks Type float32 numpy.ndarray - N2(time, depth, latitude, longitude)float64dask.array<chunksize=(1, 200, 400, 3), meta=np.ndarray>
- long_name :
- $N²$
- units :
- $s^{-2}$
Array Chunk Bytes 1.50 GB 1.92 MB Shape (779, 200, 400, 3) (1, 200, 400, 3) Count 9351 Tasks 779 Chunks Type float64 numpy.ndarray - shred2(time, depth, latitude, longitude)float64dask.array<chunksize=(1, 200, 400, 3), meta=np.ndarray>
- long_name :
- Reduced shear$^2$
- units :
- $s^{-2}$
Array Chunk Bytes 1.50 GB 1.92 MB Shape (779, 200, 400, 3) (1, 200, 400, 3) Count 24154 Tasks 779 Chunks Type float64 numpy.ndarray - Ri(time, depth, latitude, longitude)float64dask.array<chunksize=(1, 200, 400, 3), meta=np.ndarray>
- long_name :
- $Ri$
- units :
Array Chunk Bytes 1.50 GB 1.92 MB Shape (779, 200, 400, 3) (1, 200, 400, 3) Count 23375 Tasks 779 Chunks Type float64 numpy.ndarray - mld(time, latitude, longitude)float32dask.array<chunksize=(1, 400, 3), meta=np.ndarray>
- long_name :
- MLD
- units :
- m
- description :
- Interpolate density to 1m grid. Search for max depth where |drho| > 0.01 and N2 > 1e-5
Array Chunk Bytes 3.74 MB 4.80 kB Shape (779, 400, 3) (1, 400, 3) Count 17921 Tasks 779 Chunks Type float32 numpy.ndarray - dcl_base(time, latitude, longitude)float32dask.array<chunksize=(1, 400, 3), meta=np.ndarray>
- long_name :
- DCL Base (Ri)
- units :
- m
- description :
- Deepest depth above EUC where Ri=0.54
Array Chunk Bytes 3.74 MB 4.80 kB Shape (779, 400, 3) (1, 400, 3) Count 63962 Tasks 779 Chunks Type float32 numpy.ndarray - dcl(time, latitude, longitude)float32dask.array<chunksize=(1, 400, 3), meta=np.ndarray>
- long_name :
- MLD
- units :
- m
- description :
- Interpolate density to 1m grid. Search for max depth where |drho| > 0.01 and N2 > 1e-5
Array Chunk Bytes 3.74 MB 4.80 kB Shape (779, 400, 3) (1, 400, 3) Count 64741 Tasks 779 Chunks Type float32 numpy.ndarray - sst(time, latitude, longitude)float32dask.array<chunksize=(1, 400, 3), meta=np.ndarray>
Array Chunk Bytes 3.74 MB 4.80 kB Shape (779, 400, 3) (1, 400, 3) Count 1559 Tasks 779 Chunks Type float32 numpy.ndarray - eucmax(time, longitude)float64-96.5 -97.5 -97.5 ... -99.5 -99.5
- long_name :
- Depth of EUC max
- units :
- m
array([[ -96.5, -97.5, -97.5], [ -96.5, -97.5, -97.5], [ -96.5, -97.5, -97.5], ..., [-100.5, -100.5, -100.5], [ -99.5, -99.5, -99.5], [ -99.5, -99.5, -99.5]])
- easting :
- longitude
- field_julian_date :
- 400296
- julian_day_unit :
- days since 1950-01-01 00:00:00
- northing :
- latitude
- title :
- daily snapshot from 1/20 degree Equatorial Pacific MITgcm simulation
period4.to_zarr(
"/glade/work/dcherian/pump/zarrs/110w-period-4-4.zarr",
consolidated=True,
mode="w",
)
period4.Jq.isel(longitude=1).sel(latitude=0, method="nearest").plot(
x="time", robust=True
)
<matplotlib.collections.QuadMesh at 0x2b5715c4e810>
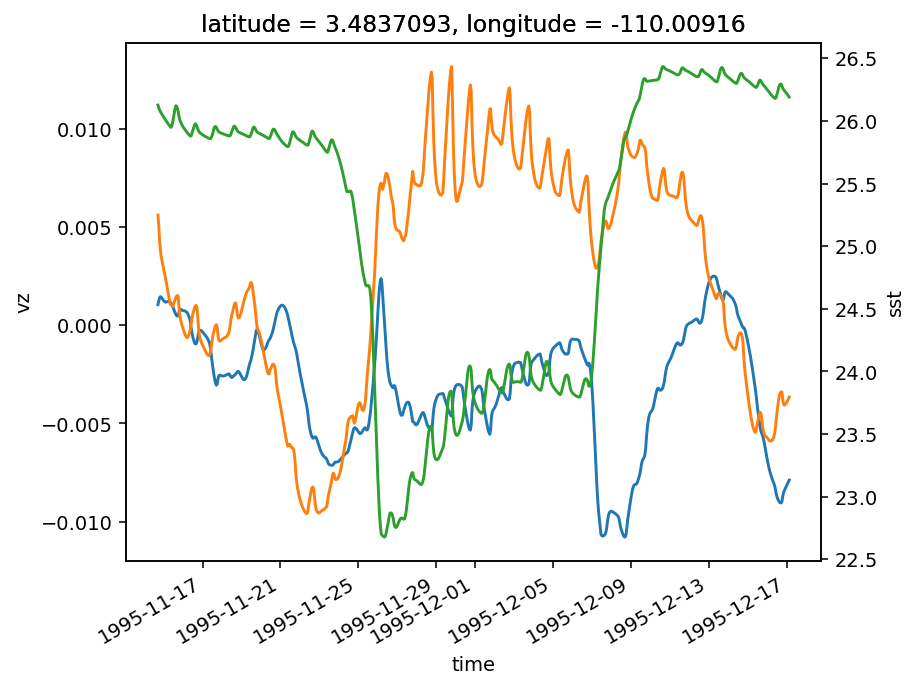
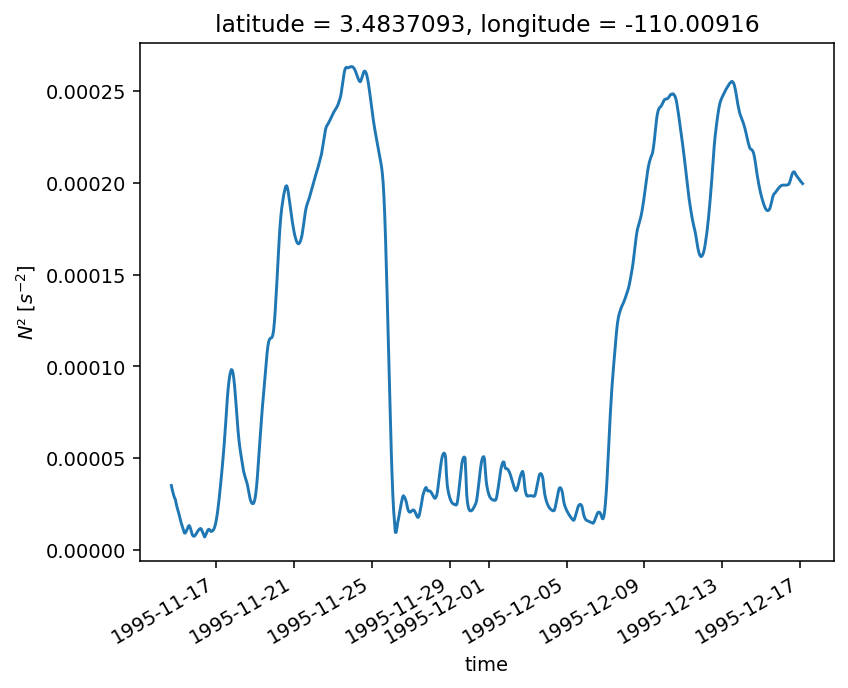
Time series of shear#
subset = (
period4.isel(longitude=1)
.sel(latitude=3.5, method="nearest")
.sel(depth=slice(-60))
.mean("depth")
)
subset.uz.plot()
subset.vz.plot()
subset.sst.plot(ax=plt.gca().twinx(), color="C2")
plt.figure()
subset.N2.plot()
[<matplotlib.lines.Line2D at 0x2ae91f212310>]
older attempts#
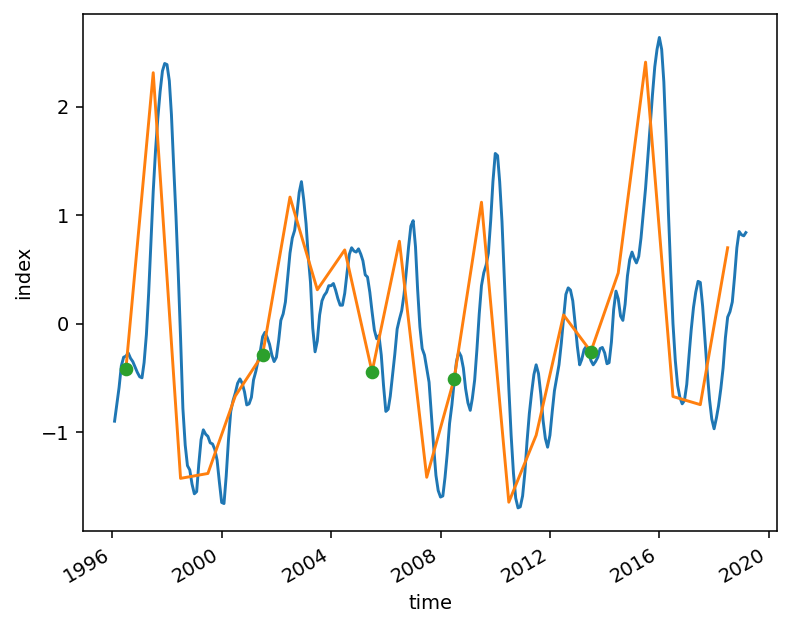
oni = pump.obs.process_oni().sel(time=slice("1996", None))
oni.plot()
oni = oni.where(oni.time.dt.month.isin([9, 10, 11, 12]))
yearly = oni.resample(time="Y", loffset="-6M").mean()
yearly.plot()
x
subset = yearly.where((yearly < -0.25) & (yearly > (-0.65)), drop=True)
subset.plot(marker="o", ls="none")
print(subset.time.dt.year)
neutral_years = subset.time.dt.year.values
ny = list(set(neutral_years) - set([2008]))
/glade/u/home/dcherian/pump/pump/obs.py:354: ParserWarning: Falling back to the 'python' engine because the 'c' engine does not support skipfooter; you can avoid this warning by specifying engine='python'.
)
/glade/u/home/dcherian/miniconda3/envs/dcpy/lib/python3.6/site-packages/xarray/core/nanops.py:142: RuntimeWarning: Mean of empty slice
return np.nanmean(a, axis=axis, dtype=dtype)
<xarray.DataArray 'year' (time: 5)>
array([1996, 2001, 2005, 2008, 2013])
Coordinates:
* time (time) datetime64[ns] 1996-06-30 2001-06-30 ... 2013-06-30
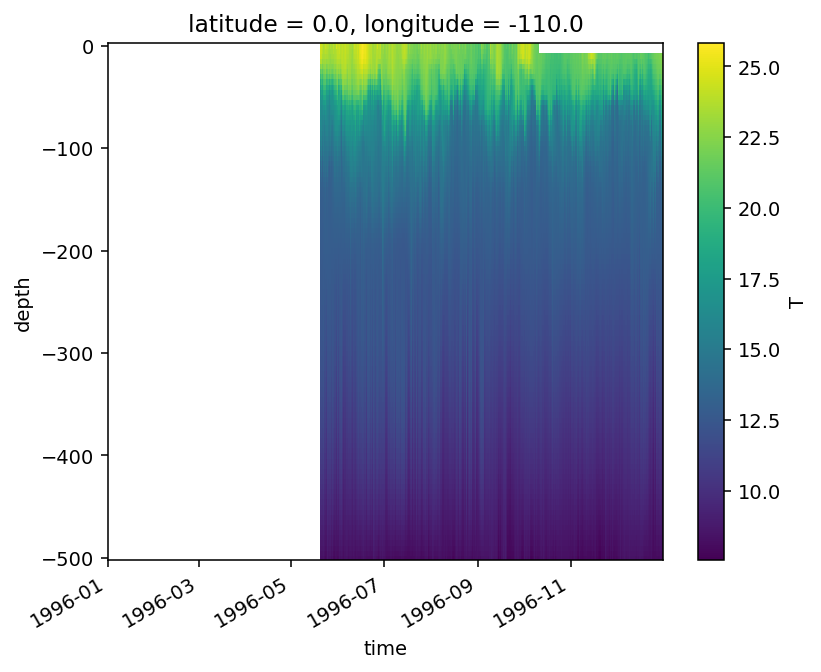
tao.sel(longitude=-110, time="1996").T.plot(x="time")
<matplotlib.collections.QuadMesh at 0x2b2a8ba57ed0>
# meantao = tao.sel(longitude=-110, time=slice("1990", "2000")).resample(time="D").mean()
# meantao = meantao.where(meantao.time.dt.year.isin([1996, 2001, 2013]), drop=True).resample(time="Y").mean()
meantao = (
tao.sel(longitude=-110, time="1996")
# .where(tao.time.dt.year.isin([1996]), drop=True)
# .groupby("time.year")
# .mean()
.mean("time")
)
meantao
<xarray.Dataset>
Dimensions: (depth: 101)
Coordinates:
* depth (depth) float64 -500.0 -495.0 -490.0 -485.0 ... -10.0 -5.0 0.0
latitude float32 ...
longitude float32 -110.0
Data variables:
T (depth) float64 dask.array<chunksize=(101,), meta=np.ndarray>
u (depth) float32 dask.array<chunksize=(101,), meta=np.ndarray>
v (depth) float32 dask.array<chunksize=(101,), meta=np.ndarray>
dens (depth) float64 dask.array<chunksize=(101,), meta=np.ndarray>- depth: 101
- depth(depth)float64-500.0 -495.0 -490.0 ... -5.0 0.0
array([-500., -495., -490., -485., -480., -475., -470., -465., -460., -455., -450., -445., -440., -435., -430., -425., -420., -415., -410., -405., -400., -395., -390., -385., -380., -375., -370., -365., -360., -355., -350., -345., -340., -335., -330., -325., -320., -315., -310., -305., -300., -295., -290., -285., -280., -275., -270., -265., -260., -255., -250., -245., -240., -235., -230., -225., -220., -215., -210., -205., -200., -195., -190., -185., -180., -175., -170., -165., -160., -155., -150., -145., -140., -135., -130., -125., -120., -115., -110., -105., -100., -95., -90., -85., -80., -75., -70., -65., -60., -55., -50., -45., -40., -35., -30., -25., -20., -15., -10., -5., 0.]) - latitude()float32...
- FORTRAN_format :
- epic_code :
- 500
- type :
- EVEN
- units :
- degree_north
array(0., dtype=float32)
- longitude()float32-110.0
- FORTRAN_format :
- epic_code :
- 502
- type :
- EVEN
- units :
- degree_east
array(-110., dtype=float32)
- T(depth)float64dask.array<chunksize=(101,), meta=np.ndarray>
Array Chunk Bytes 808 B 808 B Shape (101,) (101,) Count 1621 Tasks 1 Chunks Type float64 numpy.ndarray - u(depth)float32dask.array<chunksize=(101,), meta=np.ndarray>
Array Chunk Bytes 404 B 404 B Shape (101,) (101,) Count 1621 Tasks 1 Chunks Type float32 numpy.ndarray - v(depth)float32dask.array<chunksize=(101,), meta=np.ndarray>
Array Chunk Bytes 404 B 404 B Shape (101,) (101,) Count 1621 Tasks 1 Chunks Type float32 numpy.ndarray - dens(depth)float64dask.array<chunksize=(101,), meta=np.ndarray>
Array Chunk Bytes 808 B 808 B Shape (101,) (101,) Count 14073 Tasks 1 Chunks Type float64 numpy.ndarray
import xrft
daily = (
tao.sel(longitude=-140)
.resample(time="D")
.mean()
.where(
tao.time.dt.year.isin(ny) & tao.time.dt.month.isin([9, 10, 11, 12]), drop=True
)
)
daily
- depth: 101
- time: 488
- time(time)datetime64[ns]1996-09-01 ... 2013-12-31
array(['1996-09-01T00:00:00.000000000', '1996-09-02T00:00:00.000000000', '1996-09-03T00:00:00.000000000', ..., '2013-12-29T00:00:00.000000000', '2013-12-30T00:00:00.000000000', '2013-12-31T00:00:00.000000000'], dtype='datetime64[ns]') - longitude()float32-140.0
- FORTRAN_format :
- epic_code :
- 502
- type :
- EVEN
- units :
- degree_east
array(-140., dtype=float32)
- latitude()float320.0
- FORTRAN_format :
- epic_code :
- 500
- type :
- EVEN
- units :
- degree_north
array(0., dtype=float32)
- depth(depth)float64-500.0 -495.0 -490.0 ... -5.0 0.0
array([-500., -495., -490., -485., -480., -475., -470., -465., -460., -455., -450., -445., -440., -435., -430., -425., -420., -415., -410., -405., -400., -395., -390., -385., -380., -375., -370., -365., -360., -355., -350., -345., -340., -335., -330., -325., -320., -315., -310., -305., -300., -295., -290., -285., -280., -275., -270., -265., -260., -255., -250., -245., -240., -235., -230., -225., -220., -215., -210., -205., -200., -195., -190., -185., -180., -175., -170., -165., -160., -155., -150., -145., -140., -135., -130., -125., -120., -115., -110., -105., -100., -95., -90., -85., -80., -75., -70., -65., -60., -55., -50., -45., -40., -35., -30., -25., -20., -15., -10., -5., 0.])
- T(time, depth)float64dask.array<chunksize=(1, 101), meta=np.ndarray>
Array Chunk Bytes 394.30 kB 808 B Shape (488, 101) (1, 101) Count 76730 Tasks 488 Chunks Type float64 numpy.ndarray - u(time, depth)float32dask.array<chunksize=(1, 101), meta=np.ndarray>
Array Chunk Bytes 197.15 kB 404 B Shape (488, 101) (1, 101) Count 76730 Tasks 488 Chunks Type float32 numpy.ndarray - v(time, depth)float32dask.array<chunksize=(1, 101), meta=np.ndarray>
Array Chunk Bytes 197.15 kB 404 B Shape (488, 101) (1, 101) Count 76730 Tasks 488 Chunks Type float32 numpy.ndarray - dens(time, depth)float64dask.array<chunksize=(1, 101), meta=np.ndarray>
Array Chunk Bytes 394.30 kB 808 B Shape (488, 101) (1, 101) Count 89182 Tasks 488 Chunks Type float64 numpy.ndarray
ind = pd.MultiIndex.from_arrays([daily.time.dt.year, daily.time.dt.dayofyear])
daily = daily.assign_coords(time=ind)
reshaped = daily.unstack("time")
reshaped
- dayofyear: 123
- depth: 101
- year: 4
- longitude()float32-140.0
- FORTRAN_format :
- epic_code :
- 502
- type :
- EVEN
- units :
- degree_east
array(-140., dtype=float32)
- latitude()float320.0
- FORTRAN_format :
- epic_code :
- 500
- type :
- EVEN
- units :
- degree_north
array(0., dtype=float32)
- depth(depth)float64-500.0 -495.0 -490.0 ... -5.0 0.0
array([-500., -495., -490., -485., -480., -475., -470., -465., -460., -455., -450., -445., -440., -435., -430., -425., -420., -415., -410., -405., -400., -395., -390., -385., -380., -375., -370., -365., -360., -355., -350., -345., -340., -335., -330., -325., -320., -315., -310., -305., -300., -295., -290., -285., -280., -275., -270., -265., -260., -255., -250., -245., -240., -235., -230., -225., -220., -215., -210., -205., -200., -195., -190., -185., -180., -175., -170., -165., -160., -155., -150., -145., -140., -135., -130., -125., -120., -115., -110., -105., -100., -95., -90., -85., -80., -75., -70., -65., -60., -55., -50., -45., -40., -35., -30., -25., -20., -15., -10., -5., 0.]) - year(year)int641996 2001 2005 2013
array([1996, 2001, 2005, 2013])
- dayofyear(dayofyear)int64244 245 246 247 ... 363 364 365 366
array([244, 245, 246, 247, 248, 249, 250, 251, 252, 253, 254, 255, 256, 257, 258, 259, 260, 261, 262, 263, 264, 265, 266, 267, 268, 269, 270, 271, 272, 273, 274, 275, 276, 277, 278, 279, 280, 281, 282, 283, 284, 285, 286, 287, 288, 289, 290, 291, 292, 293, 294, 295, 296, 297, 298, 299, 300, 301, 302, 303, 304, 305, 306, 307, 308, 309, 310, 311, 312, 313, 314, 315, 316, 317, 318, 319, 320, 321, 322, 323, 324, 325, 326, 327, 328, 329, 330, 331, 332, 333, 334, 335, 336, 337, 338, 339, 340, 341, 342, 343, 344, 345, 346, 347, 348, 349, 350, 351, 352, 353, 354, 355, 356, 357, 358, 359, 360, 361, 362, 363, 364, 365, 366])
- T(depth, year, dayofyear)float64dask.array<chunksize=(101, 1, 123), meta=np.ndarray>
Array Chunk Bytes 397.54 kB 99.38 kB Shape (101, 4, 123) (101, 1, 123) Count 80157 Tasks 4 Chunks Type float64 numpy.ndarray - u(depth, year, dayofyear)float32dask.array<chunksize=(101, 1, 123), meta=np.ndarray>
Array Chunk Bytes 198.77 kB 49.69 kB Shape (101, 4, 123) (101, 1, 123) Count 80157 Tasks 4 Chunks Type float32 numpy.ndarray - v(depth, year, dayofyear)float32dask.array<chunksize=(101, 1, 123), meta=np.ndarray>
Array Chunk Bytes 198.77 kB 49.69 kB Shape (101, 4, 123) (101, 1, 123) Count 80157 Tasks 4 Chunks Type float32 numpy.ndarray - dens(depth, year, dayofyear)float64dask.array<chunksize=(101, 1, 123), meta=np.ndarray>
Array Chunk Bytes 397.54 kB 99.38 kB Shape (101, 4, 123) (101, 1, 123) Count 92609 Tasks 4 Chunks Type float64 numpy.ndarray
u = reshaped.u.sel(depth=slice(-200, -55)).sel(dayofyear=slice(365)).fillna(0)
u
- depth: 30
- year: 4
- dayofyear: 122
- dask.array<chunksize=(30, 1, 122), meta=np.ndarray>
Array Chunk Bytes 58.56 kB 14.64 kB Shape (30, 4, 122) (30, 1, 122) Count 80177 Tasks 4 Chunks Type float32 numpy.ndarray - longitude()float32-140.0
- FORTRAN_format :
- epic_code :
- 502
- type :
- EVEN
- units :
- degree_east
array(-140., dtype=float32)
- latitude()float320.0
- FORTRAN_format :
- epic_code :
- 500
- type :
- EVEN
- units :
- degree_north
array(0., dtype=float32)
- depth(depth)float64-200.0 -195.0 ... -60.0 -55.0
array([-200., -195., -190., -185., -180., -175., -170., -165., -160., -155., -150., -145., -140., -135., -130., -125., -120., -115., -110., -105., -100., -95., -90., -85., -80., -75., -70., -65., -60., -55.]) - year(year)int641996 2001 2005 2013
array([1996, 2001, 2005, 2013])
- dayofyear(dayofyear)int64244 245 246 247 ... 362 363 364 365
array([244, 245, 246, 247, 248, 249, 250, 251, 252, 253, 254, 255, 256, 257, 258, 259, 260, 261, 262, 263, 264, 265, 266, 267, 268, 269, 270, 271, 272, 273, 274, 275, 276, 277, 278, 279, 280, 281, 282, 283, 284, 285, 286, 287, 288, 289, 290, 291, 292, 293, 294, 295, 296, 297, 298, 299, 300, 301, 302, 303, 304, 305, 306, 307, 308, 309, 310, 311, 312, 313, 314, 315, 316, 317, 318, 319, 320, 321, 322, 323, 324, 325, 326, 327, 328, 329, 330, 331, 332, 333, 334, 335, 336, 337, 338, 339, 340, 341, 342, 343, 344, 345, 346, 347, 348, 349, 350, 351, 352, 353, 354, 355, 356, 357, 358, 359, 360, 361, 362, 363, 364, 365])
variable = u.differentiate("depth")
fft = xrft.dft(variable, dim=["dayofyear"]).mean("year")
rms = 1.414 * np.abs(fft).sel(freq_dayofyear=slice(1 / 50, 1 / 5)).integrate(
"freq_dayofyear"
)
mean = variable.mean(["year", "dayofyear"])
mean, rms = dask.compute(mean, rms)
mean.plot(y="depth")
(mean + rms).plot(y="depth")
(mean - rms).plot(y="depth")
[<matplotlib.lines.Line2D at 0x2ac3fabc32b0>]
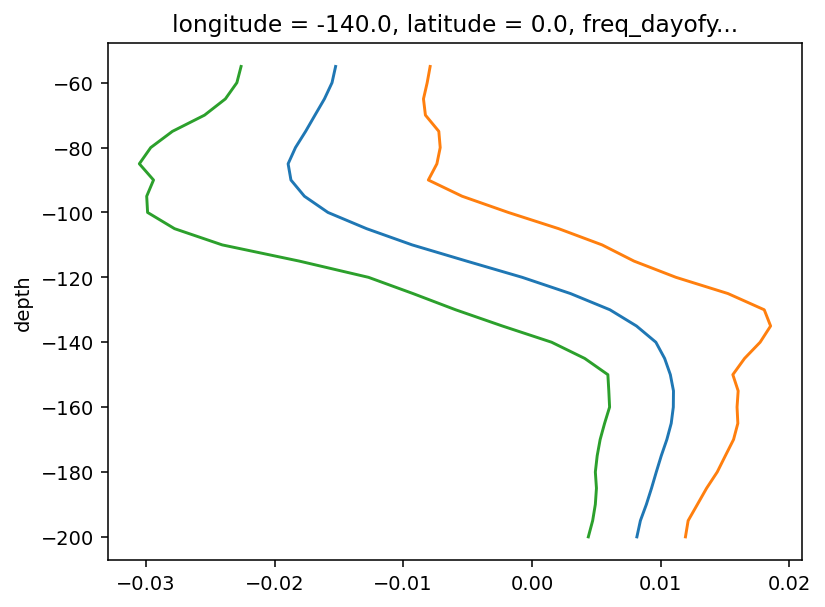
This plot is junk because of sampling bias.
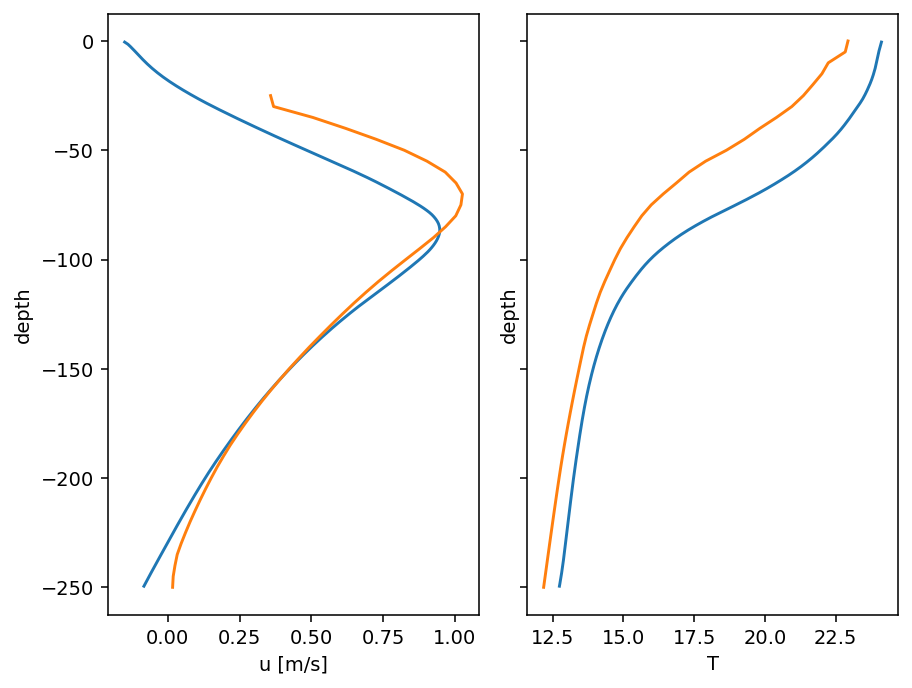
model = (
gcm1.annual.sel(depth=slice(-250))
.sel(latitude=0, longitude=-110, method="nearest")
.rename({"theta": "T"})
)
f, axx = plt.subplots(1, 2, sharey=True, constrained_layout=True)
ax = dict(zip("uT", axx))
for var in ax:
model[var].plot(ax=ax[var], y="depth")
meantao[var].sel(depth=slice(-250, None)).plot(ax=ax[var], y="depth")
[aa.set_title("") for aa in axx]
[Text(0.5, 1.0, ''), Text(0.5, 1.0, '')]
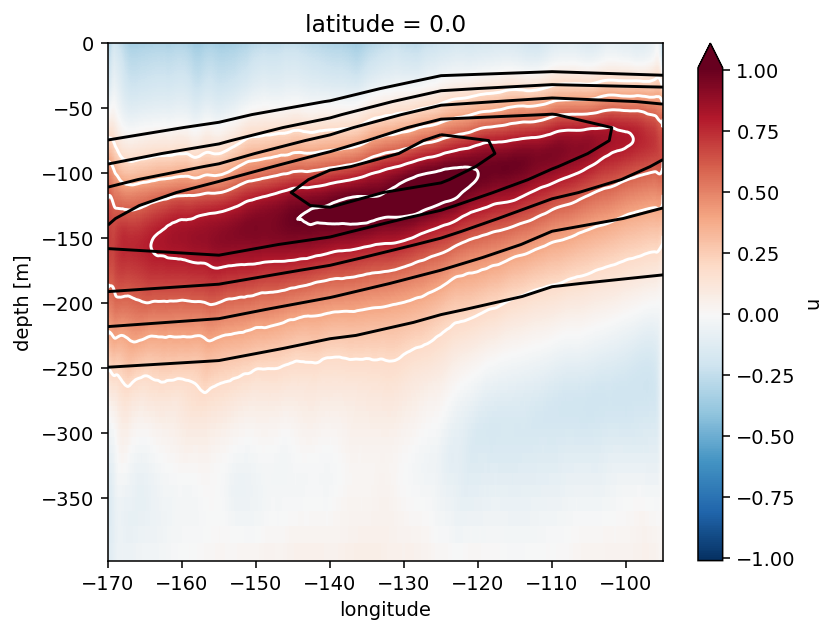
levels = np.sort([0.2, 0.4, 0.6, 0.8, 1])
gcm1.annual.u.sel(depth=slice(-400)).sel(latitude=0, method="nearest").plot.contour(
colors="w", levels=levels
)
johnson.u.sel(longitude=slice(-170, -95)).sel(
latitude=0, method="nearest"
).plot.contour(colors="k", levels=levels)
<matplotlib.contour.QuadContourSet at 0x2ac327fe0d30>
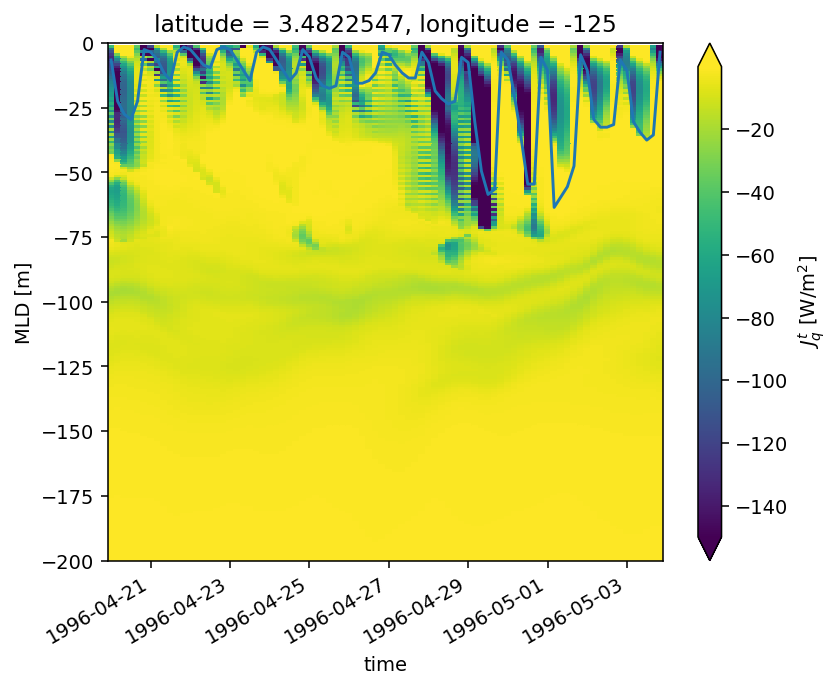
125 W summer low Ri#
subset = (
sections.isel(longitude=1)
.sel(depth=slice(-200), time=slice("1996-04-20", "1996-05-03"))
.sel(latitude=3.5, method="nearest")
)
subset.Jq.plot(
x="time",
robust=True,
)
subset.mld.plot(x="time")
[<matplotlib.lines.Line2D at 0x2ac3f0fd2710>]
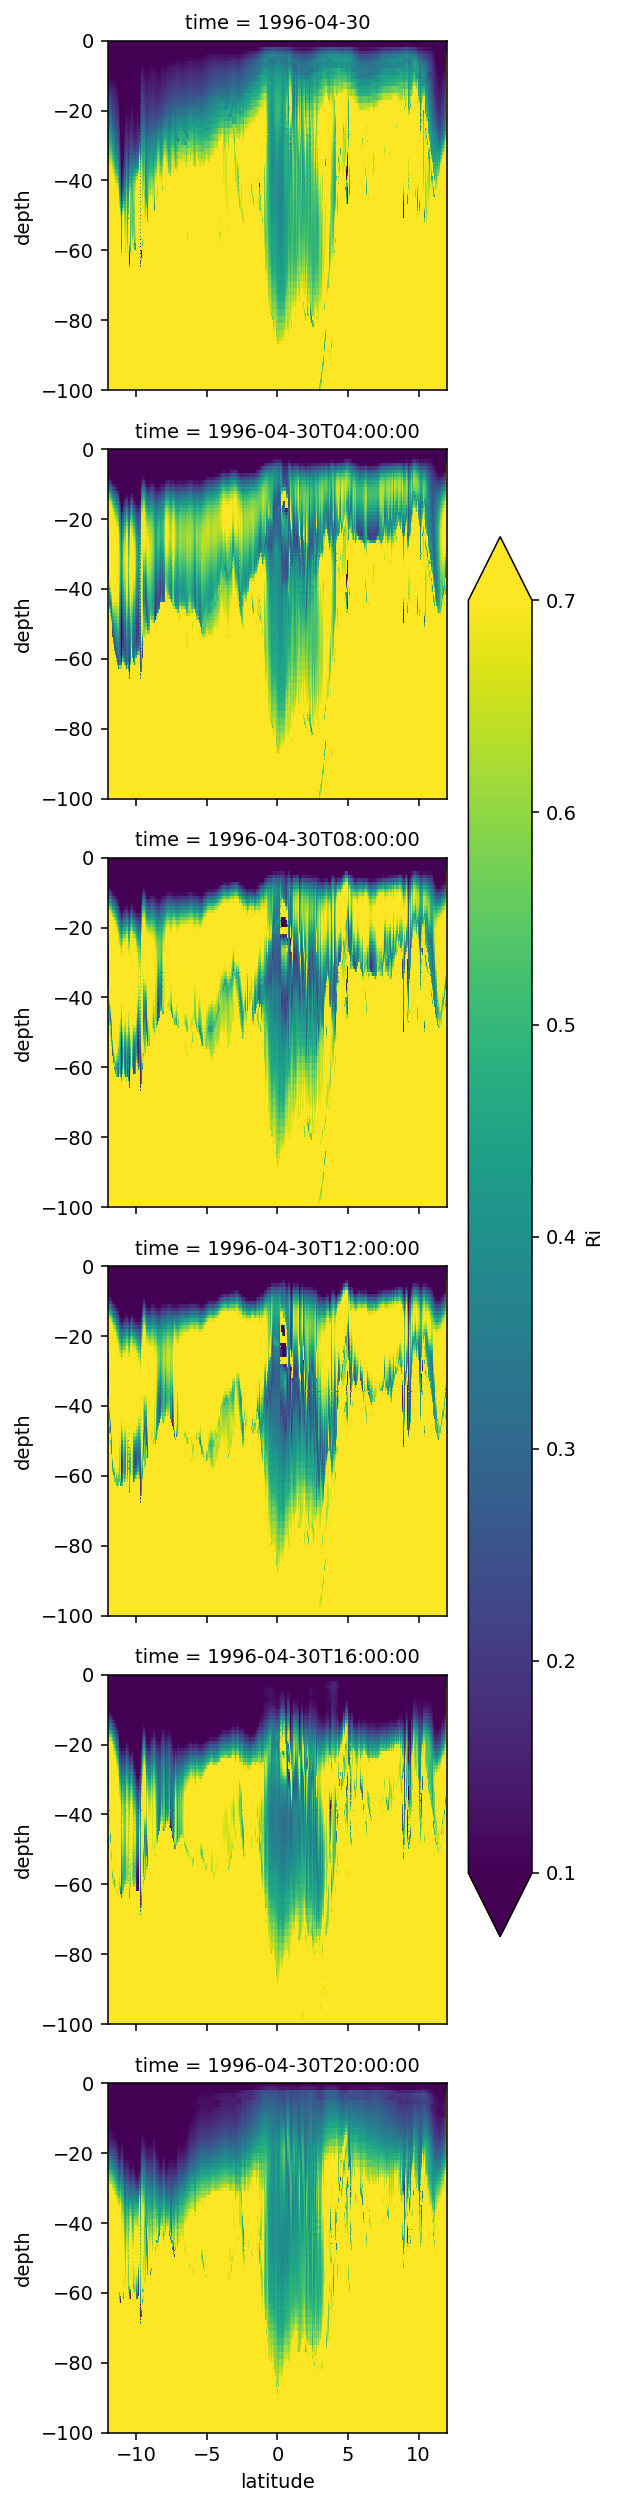
fg = (
sections.Ri.sel(time="1996-04-30", depth=slice(-100))
.isel(longitude=1)
.plot(y="depth", row="time", vmin=0.1, vmax=0.7)
)
sections.mld.sel(time="1996-04-30").isel(longitude=1)
<xarray.DataArray 'mld' (time: 6, latitude: 480)>
dask.array<getitem, shape=(6, 480), dtype=float32, chunksize=(6, 138), chunktype=numpy.ndarray>
Coordinates:
* time (time) datetime64[ns] 1996-04-30 ... 1996-04-30T20:00:00
* latitude (latitude) float32 -12.0 -11.949896 -11.899791 ... 11.949896 12.0
longitude int64 -125
Attributes:
long_name: MLD
units: m
description: Interpolate density to 1m grid. Search for max depth where ...- time: 6
- latitude: 480
- dask.array<chunksize=(6, 138), meta=np.ndarray>
Array Chunk Bytes 11.52 kB 3.31 kB Shape (6, 480) (6, 138) Count 12512 Tasks 4 Chunks Type float32 numpy.ndarray - time(time)datetime64[ns]1996-04-30 ... 1996-04-30T20:00:00
array(['1996-04-30T00:00:00.000000000', '1996-04-30T04:00:00.000000000', '1996-04-30T08:00:00.000000000', '1996-04-30T12:00:00.000000000', '1996-04-30T16:00:00.000000000', '1996-04-30T20:00:00.000000000'], dtype='datetime64[ns]') - latitude(latitude)float32-12.0 -11.949896 ... 11.949896 12.0
array([-12. , -11.949896, -11.899791, ..., 11.899791, 11.949896, 12. ], dtype=float32) - longitude()int64-125
array(-125)
- long_name :
- MLD
- units :
- m
- description :
- Interpolate density to 1m grid. Search for max depth where |drho| > 0.01 and N2 > 1e-5
diurnal trigger#
subset = (
period4.isel(longitude=1)
.sel(latitude=3.5, method="nearest")
.sel(depth=slice(-100))
.transpose(..., "time")
)
f, axx = plt.subplots(3, 1, sharex=True, squeeze=False)
ax = axx.squeeze()
subset.S2.plot(
ax=ax[0],
robust=True,
norm=mpl.colors.Normalize(vmin=8e-5, vmax=4e-4),
cmap=mpl.cm.Spectral_r,
)
subset.N2.plot(
ax=ax[1],
robust=True,
norm=mpl.colors.LogNorm(vmin=0.5e-5, vmax=2e-4),
cmap=mpl.cm.Spectral_r,
)
subset.Jq.rolling(depth=2).mean().plot(
ax=ax[2], vmax=0, robust=True, cmap=mpl.cm.BuPu_r
)
def plot(ax):
if "KPPhbl" in subset:
(-1 * subset.KPPhbl).plot(x="time", color="w", lw=2, ax=ax)
subset.mld.plot(color="g", lw=4, ax=ax)
subset.dcl_base.plot(color="k", lw=2, ax=ax)
subset.Jq.rolling(depth=2).mean().plot.contour(
levels=17,
colors="k",
linestyles="-",
linewidths=0.5,
x="time",
robust=True,
ax=ax,
)
[plot(axx) for axx in ax]
dcpy.plots.clean_axes(axx)
f.set_size_inches((8, 8))
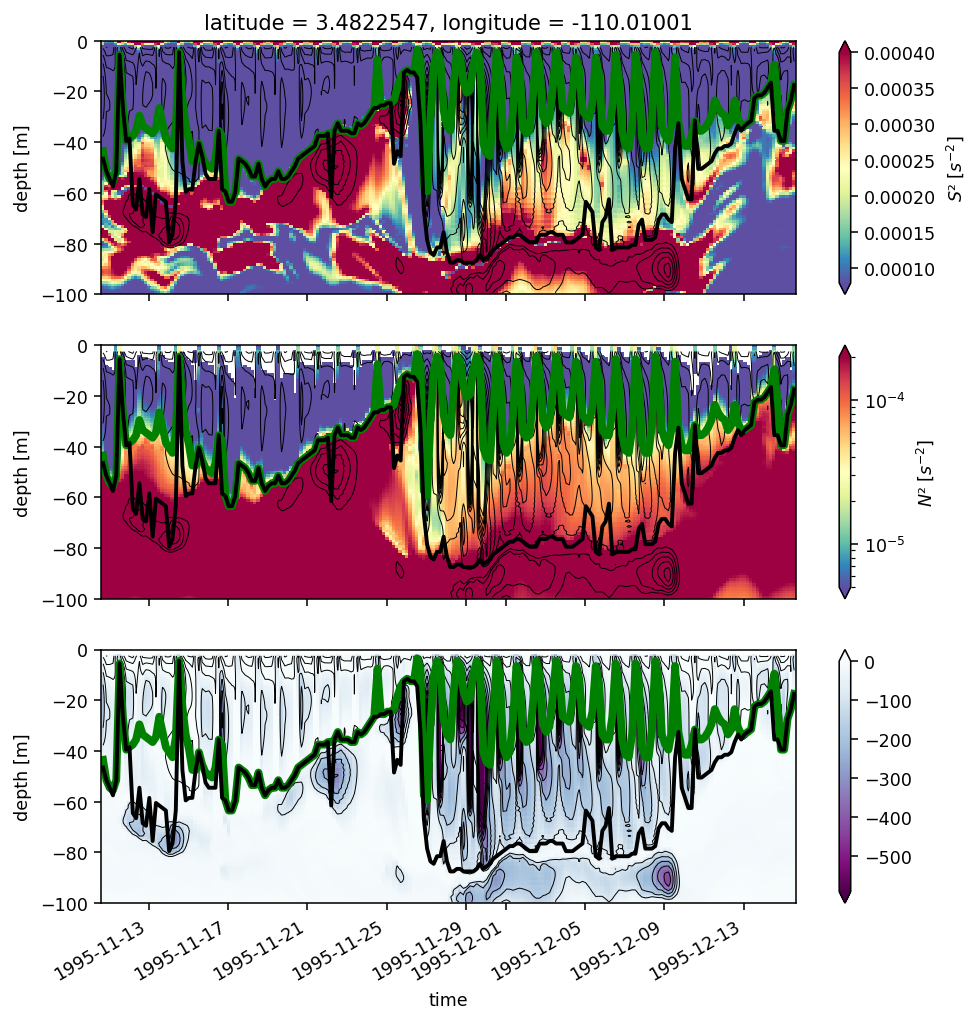
Presentation images#
Summary lat-lon fields#
subset = period4.isel(longitude=1).sel(depth=slice(-40, -60), latitude=slice(-2, 5))
# subset = subset.where((subset.depth < subset.mld)).mean("depth")
subset = subset.mean("depth")
kwargs = {
"sst": dict(cmap=mpl.cm.RdYlBu_r),
"uz": dict(vmax=1.5e-2),
"vz": dict(vmax=1.5e-2),
"N2": dict(cmap=mpl.cm.Greens, vmin=0, vmax=4e-4),
"Jq": dict(cmap=mpl.cm.Blues_r, vmax=0, vmin=-200),
"dcl": dict(cmap=mpl.cm.GnBu, vmin=10, vmax=50),
}
subset = subset[list(kwargs.keys())].compute()
xr.set_options(keep_attrs=True)
sstmean = subset.sst.resample(time="D").mean().compute()
kwargs = {
"sst": dict(cmap=mpl.cm.RdYlBu_r),
"uz": dict(vmax=1.5e-2),
"vz": dict(vmax=1.5e-2),
"N2": dict(cmap=mpl.cm.Greens, vmin=1e-5, vmax=2e-4),
"Jq": dict(cmap=mpl.cm.Blues_r, vmax=0, vmin=-200),
"dcl": dict(cmap=mpl.cm.GnBu, vmin=10, vmax=50),
}
f, axx = plt.subplots(2, 3, sharex=True, sharey=True, constrained_layout=True)
subset["sst"].attrs["long_name"] = "SST"
subset["uz"].attrs["long_name"] = "$u_z$"
subset["uz"].attrs["units"] = "1/s"
subset["vz"].attrs["long_name"] = "$v_z$"
subset["vz"].attrs["units"] = "1/s"
subset["N2"].attrs["long_name"] = "$N^2$"
subset["N2"].attrs["units"] = "1/s²"
subset["dcl"].attrs["long_name"] = "$z_{MLD} - z_{Ri}$"
subset["dcl"].attrs["units"] = "m"
subset["Jq"].attrs["long_name"] = "$J_q^t$"
subset["Jq"].attrs["units"] = "W/m²"
ax = dict(zip(["sst", "uz", "vz", "N2", "dcl", "Jq"], axx.flat))
for var, axis in ax.items():
subset[var].plot(
x="time",
cbar_kwargs={"orientation": "horizontal", "shrink": 0.8},
ax=axis,
robust=True,
**kwargs[var],
)
sstmean.plot.contour(
x="time",
ax=axis,
levels=[24],
colors="w",
add_labels=False,
linewidths=2,
)
sstmean.plot.contour(
x="time",
ax=axis,
levels=[24],
colors="k",
add_labels=False,
linewidths=0.5,
)
[dcpy.plots.concise_date_formatter(aa) for aa in axx.flat]
[aa.set_xlabel("") for aa in axx.flat]
[aa.set_title("") for aa in axx.flat]
dcpy.plots.clean_axes(axx)
# f.savefig("images/period4-all-fields.png")
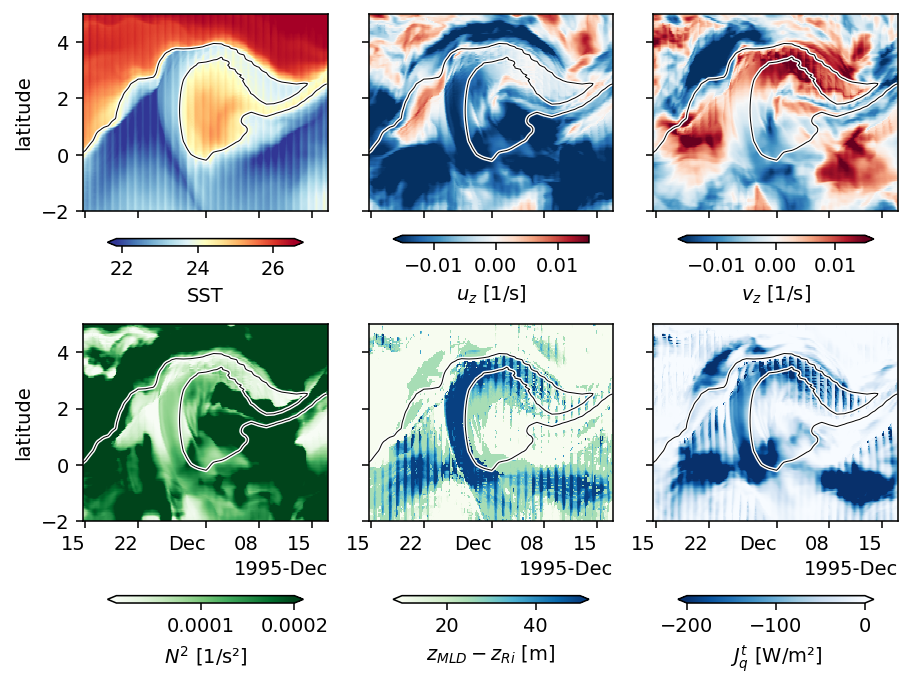
shear rotation sequence#
pump.plot.vor_streamplot(
period4,
vort,
stride=3,
refspeed=0.4,
uy=False,
vec=False,
stream=False,
)
plt.gcf().savefig("images/110-period4-vort-0.png")
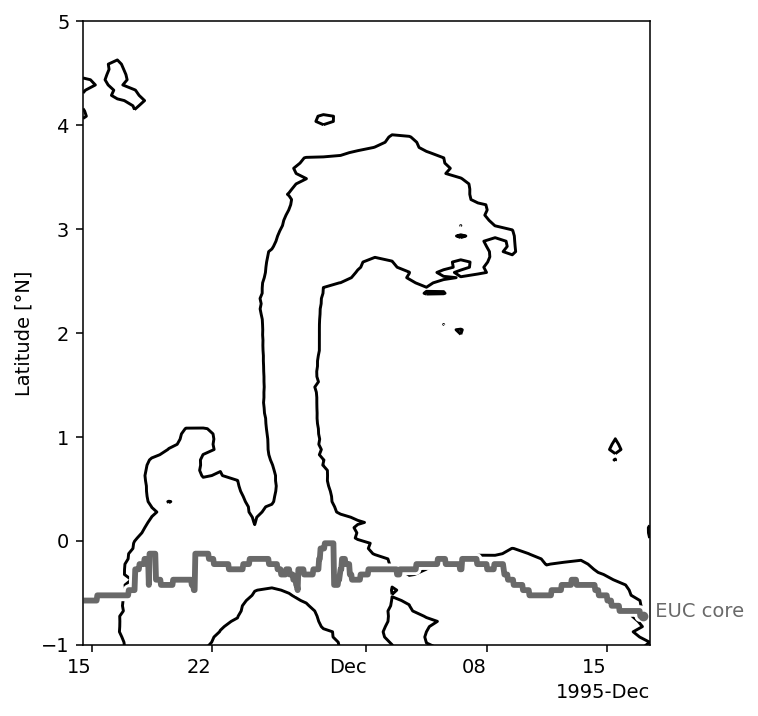
pump.plot.vor_streamplot(
period4, vort, stride=3, refspeed=0.4, uy=False, vec=False, stream=True
)
plt.gcf().savefig("images/110-period4-vort-1.png")
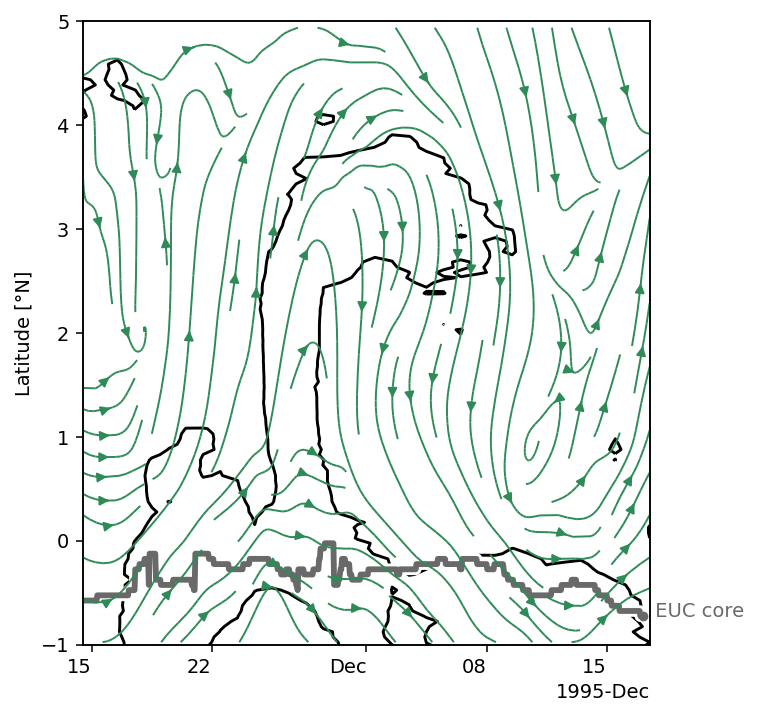
pump.plot.vor_streamplot(period4, vort, stride=3, refspeed=0.4, uy=False, stream=False)
plt.gcf().savefig("images/110-period4-vort-2.png")
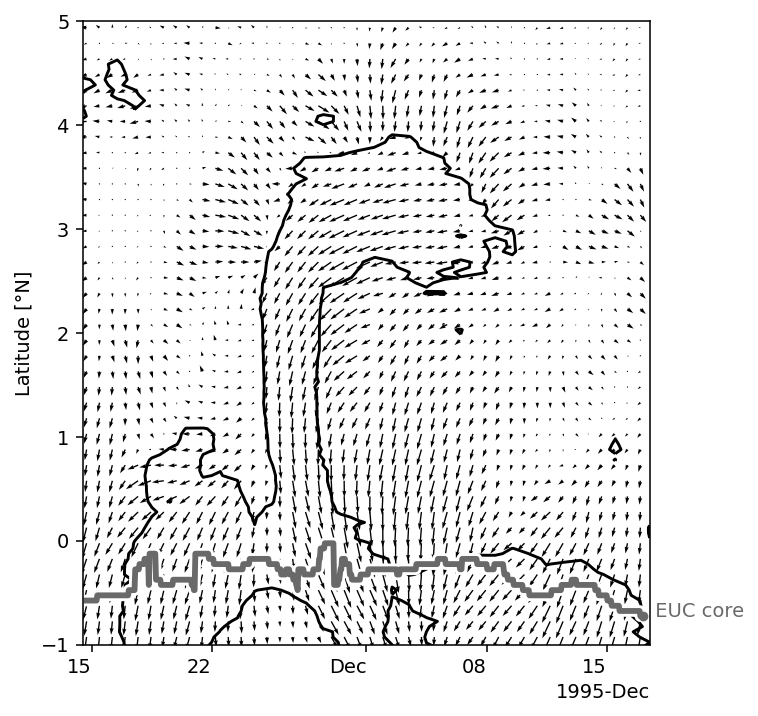
pump.plot.vor_streamplot(
period4, vort, stride=3, refspeed=0.4, vy=True, stream=False, colorbar=False
)
plt.gca().text(0.8, 0.9, "$+v_y$", fontsize="xx-large", transform=plt.gca().transAxes)
plt.gcf().savefig("images/110-period4-vort-3.png")
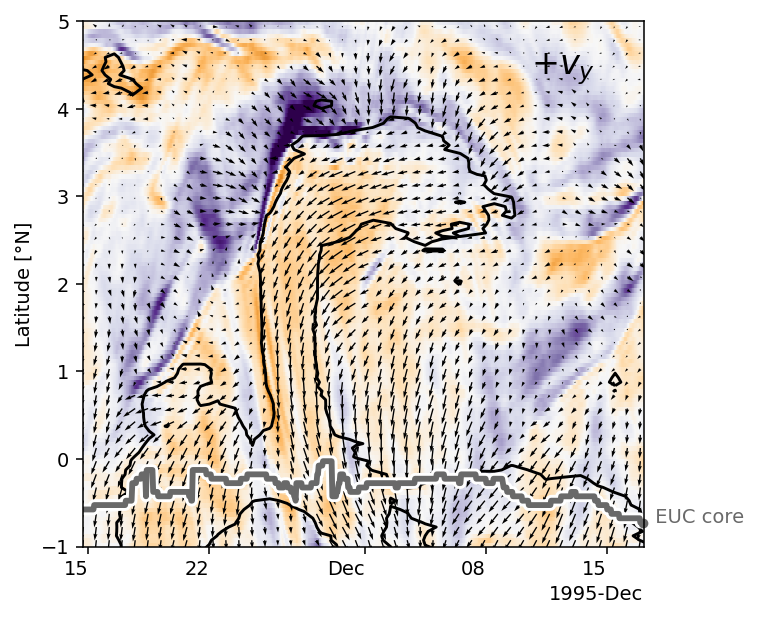
pump.plot.vor_streamplot(
period4, vort, stride=3, refspeed=0.4, stream=False, colorbar=False
)
plt.gca().text(0.8, 0.9, "$-u_y$", fontsize="xx-large", transform=plt.gca().transAxes)
plt.gcf().savefig("images/110-period4-vort-4.png")
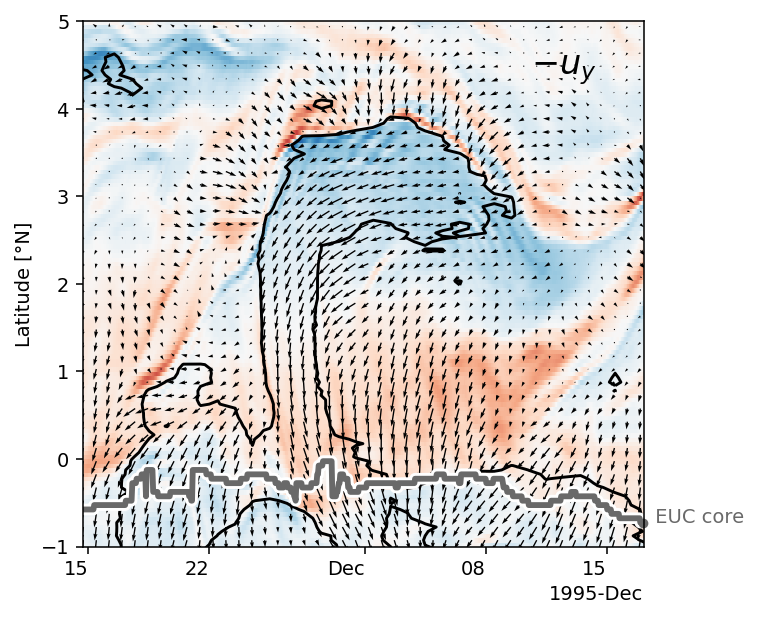
pump.plot.vor_streamplot(
period4, vort, stride=3, refspeed=0.4, uy=False, colorbar=False
)
plt.gcf().savefig("images/110-period4-vort-4.png")
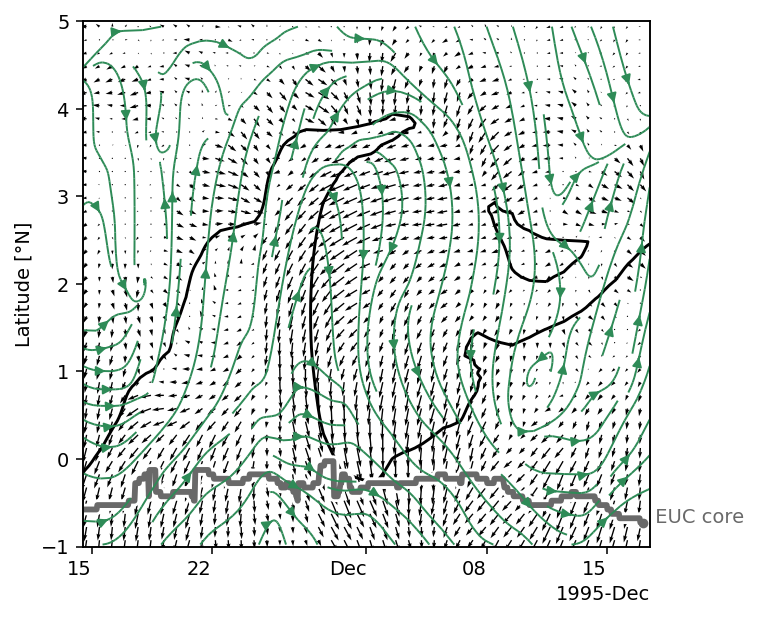
pump.plot.vor_streamplot(
period4, vort, stride=3, refspeed=0.4, uy=False, colorbar=False
)
plt.gcf().savefig("images/110-period4-vort-4.png")
pump.plot.vor_streamplot(
period4, vort, stride=3, refspeed=0.4, uy=False, colorbar=False
)
plt.gcf().savefig("images/110-period4-vort-4.png")
KPP deep cycle 1999 nov#
stationnov = (
xr.open_zarr("nov-1999-station.zarr", consolidated=True)
.sel(depth=slice(-50))
.load()
)
stationnov
<xarray.Dataset>
Dimensions: (depth: 20, time: 49)
Coordinates:
* depth (depth) float32 -1.25 -3.75 -6.25 ... -43.75 -46.25 -48.75
latitude float64 3.525
longitude float32 -110.025
* time (time) datetime64[ns] 1999-11-21 ... 1999-11-23
Data variables:
Cd (time) float64 0.001047 0.001046 ... 0.001075 0.00107
Cdn_10 (time) float64 0.9759 0.9749 0.9742 ... 1.008 0.9959 0.988
Ce (time) float64 0.001237 0.001237 ... 0.001244 0.001253
Cen_10 (time) float64 1.108 1.108 1.108 1.109 ... 1.105 1.106 1.107
Ch (time) float64 0.001237 0.001237 ... 0.001244 0.001253
Chn_10 (time) float64 1.108 1.108 1.108 1.109 ... 1.105 1.106 1.107
DFrI_TH (depth, time) float32 0.0 0.0 0.0 ... -763.1658 -812.03156
Evap (time) float64 0.1404 0.1398 0.1391 ... 0.1514 0.1474 0.1456
Jq (depth, time) float64 0.0 0.0 0.0 ... -95.27 -102.3 -108.8
KPPdiffKzT (depth, time) float32 0.0 0.0 ... 0.0007682296 0.00079970685
KPPg_TH (depth, time) float32 0.0 0.0 0.0 0.0 0.0 ... 0.0 0.0 0.0 0.0
KPPhbl (time) float32 22.682652 22.976309 ... 22.382105 22.323658
KPPviscAz (depth, time) float32 0.0 0.0 ... 0.0007772296 0.00080870686
L (time) float64 -50.09 -50.04 -50.2 ... -48.49 -44.78 -41.55
Le (time) float64 2.5e+06 2.5e+06 2.5e+06 ... 2.5e+06 2.5e+06
Q10 (time) float64 12.94 12.95 12.96 12.93 ... 13.38 13.4 13.41
Qrf (time) float64 12.94 12.95 12.96 12.93 ... 13.38 13.4 13.41
Qs (time) float64 0.01747 0.01747 0.01746 ... 0.01792 0.01793
RF (time) float64 1.601e-10 9.915e-11 ... 1.131e-10 1.209e-10
RH10 (time) float64 75.81 75.84 75.88 75.48 ... 78.1 78.3 78.46
RHrf (time) float64 75.81 75.84 75.88 75.48 ... 78.1 78.3 78.46
Rnl (time) float64 23.84 28.76 33.68 35.42 ... 31.87 30.67 31.06
SSH (time) float32 0.36676002 0.36429515 ... 0.37923476
T10 (time) float64 22.65 22.65 22.64 22.69 ... 22.7 22.69 22.65
Trf (time) float64 22.65 22.65 22.64 22.69 ... 22.7 22.69 22.65
U10 (time) float64 5.76 5.745 5.736 5.713 ... 6.195 6.022 5.902
U10N (time) float64 5.966 5.95 5.941 5.912 ... 6.425 6.256 6.143
UN (time) float64 5.966 5.95 5.941 5.912 ... 6.425 6.256 6.143
Urf (time) float64 5.76 5.745 5.736 5.713 ... 6.195 6.022 5.902
UrfN (time) float64 5.966 5.95 5.941 5.912 ... 6.425 6.256 6.143
VISrI_Um (depth, time) float32 0.0 0.0 0.0 ... 190.43164 193.63968
VISrI_Vm (depth, time) float32 0.0 0.0 0.0 ... -298.01572 -318.4322
dens (depth, time) float32 1023.3128 1023.317 ... 1023.55115
dqer (time) float64 0.0 0.0 0.0 0.0 0.0 ... 0.0 0.0 0.0 0.0 0.0
dter (time) float64 0.1908 0.1978 0.2047 ... 0.2018 0.2022 0.2055
hbb (time) float64 12.05 11.94 11.84 11.21 ... 16.35 16.06 16.21
hlb (time) float64 97.53 97.06 96.61 96.27 ... 105.1 102.3 101.1
hlwebb (time) float64 2.531 2.516 2.5 2.423 ... 3.198 3.135 3.137
hsb (time) float64 4.97 4.904 4.828 4.225 ... 8.717 8.634 8.871
hsbb (time) float64 10.89 10.79 10.69 10.06 ... 15.09 14.84 15.01
huss (time) float64 0.01294 0.01295 0.01296 ... 0.0134 0.01341
lat (time) float64 -97.53 -97.06 -96.61 ... -105.1 -102.3 -101.1
long (time) float64 -35.87 -40.65 -45.41 ... -43.73 -42.57 -42.95
netflux (time) float64 -138.4 -142.6 -146.9 ... -157.6 -153.5 -153.0
nonlocal_flux (depth, time) float64 0.0 0.0 0.0 0.0 0.0 ... 0.0 0.0 0.0 0.0
prra (time) float64 1.427e-07 8.867e-08 ... 1.004e-07 1.07e-07
psl (time) float64 1.014e+05 1.014e+05 ... 1.014e+05 1.013e+05
qsr (time) float64 -0.1732 -0.1729 -0.1724 ... -0.1714 -0.1731
rhoa (time) float64 1.2 1.2 1.2 1.2 1.2 ... 1.2 1.2 1.2 1.2 1.2
rlds (time) float64 401.1 396.1 391.1 389.3 ... 395.5 396.7 396.3
rsds (time) float64 0.0 0.0 0.0 29.76 59.52 ... 0.0 0.0 0.0 0.0
salt (depth, time) float32 34.304375 34.30507 ... 34.393257
sens (time) float64 -4.97 -4.904 -4.828 ... -8.717 -8.634 -8.871
short (time) float64 0.0 0.0 0.0 26.78 53.57 ... 0.0 0.0 0.0 0.0
stress (time) float64 0.04198 0.04172 0.04156 ... 0.04716 0.04512
tas (time) float64 295.8 295.8 295.8 295.8 ... 295.8 295.8 295.8
tau (time) float64 0.04198 0.04172 0.04156 ... 0.04716 0.04512
taux (time) float64 -0.0117 -0.01035 ... -0.01367 -0.01311
tauy (time) float64 0.04032 0.04042 0.04057 ... 0.04513 0.04317
theta (depth, time) float32 23.32442 23.311815 ... 22.730448
tkt (time) float64 0.0009061 0.0009081 ... 0.0008566 0.0008741
tsr (time) float64 -0.02195 -0.02173 ... -0.03597 -0.03777
u (depth, time) float32 -0.29970324 -0.30042994 ... -0.17791136
uas (time) float64 -1.606 -1.426 -1.246 ... -1.768 -1.746 -1.715
usr (time) float64 0.1877 0.1872 0.1868 ... 0.2056 0.199 0.1947
v (depth, time) float32 0.689187 0.6815233 ... -0.060036022
vas (time) float64 5.532 5.565 5.599 5.612 ... 5.938 5.763 5.647
w (depth, time) float32 -7.249771e-06 ... 4.057019e-05
zet (time) float64 -0.1997 -0.1998 -0.1992 ... -0.2233 -0.2407
zoq (time) float64 0.0001268 0.0001276 ... 0.0001107 0.0001166
zot (time) float64 0.0001268 0.0001276 ... 0.0001107 0.0001166
Attributes:
easting: longitude
northing: latitude
title: Station profile, index (i,j)=(1200,240)- depth: 20
- time: 49
- depth(depth)float32-1.25 -3.75 -6.25 ... -46.25 -48.75
array([ -1.25, -3.75, -6.25, -8.75, -11.25, -13.75, -16.25, -18.75, -21.25, -23.75, -26.25, -28.75, -31.25, -33.75, -36.25, -38.75, -41.25, -43.75, -46.25, -48.75], dtype=float32) - latitude()float643.525
array(3.5250001)
- longitude()float32-110.025
array(-110.025, dtype=float32)
- time(time)datetime64[ns]1999-11-21 ... 1999-11-23
array(['1999-11-21T00:00:00.000000000', '1999-11-21T01:00:00.000000000', '1999-11-21T02:00:00.000000000', '1999-11-21T03:00:00.000000000', '1999-11-21T04:00:00.000000000', '1999-11-21T05:00:00.000000000', '1999-11-21T06:00:00.000000000', '1999-11-21T07:00:00.000000000', '1999-11-21T08:00:00.000000000', '1999-11-21T09:00:00.000000000', '1999-11-21T10:00:00.000000000', '1999-11-21T11:00:00.000000000', '1999-11-21T12:00:00.000000000', '1999-11-21T13:00:00.000000000', '1999-11-21T14:00:00.000000000', '1999-11-21T15:00:00.000000000', '1999-11-21T16:00:00.000000000', '1999-11-21T17:00:00.000000000', '1999-11-21T18:00:00.000000000', '1999-11-21T19:00:00.000000000', '1999-11-21T20:00:00.000000000', '1999-11-21T21:00:00.000000000', '1999-11-21T22:00:00.000000000', '1999-11-21T23:00:00.000000000', '1999-11-22T00:00:00.000000000', '1999-11-22T01:00:00.000000000', '1999-11-22T02:00:00.000000000', '1999-11-22T03:00:00.000000000', '1999-11-22T04:00:00.000000000', '1999-11-22T05:00:00.000000000', '1999-11-22T06:00:00.000000000', '1999-11-22T07:00:00.000000000', '1999-11-22T08:00:00.000000000', '1999-11-22T09:00:00.000000000', '1999-11-22T10:00:00.000000000', '1999-11-22T11:00:00.000000000', '1999-11-22T12:00:00.000000000', '1999-11-22T13:00:00.000000000', '1999-11-22T14:00:00.000000000', '1999-11-22T15:00:00.000000000', '1999-11-22T16:00:00.000000000', '1999-11-22T17:00:00.000000000', '1999-11-22T18:00:00.000000000', '1999-11-22T19:00:00.000000000', '1999-11-22T20:00:00.000000000', '1999-11-22T21:00:00.000000000', '1999-11-22T22:00:00.000000000', '1999-11-22T23:00:00.000000000', '1999-11-23T00:00:00.000000000'], dtype='datetime64[ns]')
- Cd(time)float640.001047 0.001046 ... 0.00107
- long_name :
- wind stress transfer (drag) coefficient at height zu
array([0.00104679, 0.00104573, 0.00104487, 0.001041 , 0.00103772, 0.00103513, 0.00104503, 0.00105736, 0.00107148, 0.00107159, 0.00107201, 0.00107283, 0.00108607, 0.0010996 , 0.00111363, 0.00110565, 0.00109652, 0.00108725, 0.00105727, 0.00103266, 0.00101401, 0.00100872, 0.00100467, 0.00100195, 0.00100756, 0.0010132 , 0.00101888, 0.00102504, 0.00103234, 0.00104078, 0.00106834, 0.00110423, 0.00114674, 0.00114984, 0.00115306, 0.00115637, 0.00115403, 0.00115109, 0.0011478 , 0.00114266, 0.00113624, 0.00112997, 0.00112123, 0.00111291, 0.00110493, 0.00109432, 0.00108433, 0.00107495, 0.00107022]) - Cdn_10(time)float640.9759 0.9749 ... 0.9959 0.988
- long_name :
- neutral value of drag coefficient at 10m
array([0.97585365, 0.97485968, 0.97422445, 0.97234251, 0.97085304, 0.96977023, 0.98474341, 1.00095534, 1.01821793, 1.01958029, 1.02101466, 1.02253945, 1.03485374, 1.04830496, 1.06288869, 1.05255406, 1.04211465, 1.03181376, 0.99795234, 0.96848301, 0.94414966, 0.93557412, 0.92790948, 0.92120362, 0.92397734, 0.92717535, 0.93082021, 0.93965628, 0.94964624, 0.96073458, 0.99309637, 1.03281141, 1.07852834, 1.08278619, 1.08713373, 1.09156089, 1.08665445, 1.08169768, 1.07675215, 1.07170142, 1.06647656, 1.06140538, 1.05202273, 1.04283988, 1.03384432, 1.02074515, 1.00807617, 0.99587299, 0.9879921 ]) - Ce(time)float640.001237 0.001237 ... 0.001253
- long_name :
- latent heat transfer coefficient (Dalton number) at height zu
array([0.00123711, 0.00123735, 0.00123717, 0.00123431, 0.00123163, 0.00122933, 0.00121529, 0.00120409, 0.00119483, 0.00119249, 0.00119056, 0.00118913, 0.00118833, 0.00118616, 0.00118308, 0.00118829, 0.0011921 , 0.00119565, 0.00120992, 0.00122777, 0.00124847, 0.00125083, 0.00125436, 0.00125914, 0.00126594, 0.00127214, 0.0012777 , 0.00127637, 0.00127028, 0.00125994, 0.00123876, 0.00122117, 0.00120702, 0.00120462, 0.00120231, 0.00120004, 0.00120455, 0.00120833, 0.00121163, 0.00121241, 0.00121155, 0.00121066, 0.00121348, 0.00121678, 0.00122044, 0.00122777, 0.0012358 , 0.00124449, 0.00125271]) - Cen_10(time)float641.108 1.108 1.108 ... 1.106 1.107
- long_name :
- neutral value of Dalton number at 10m
array([1.1081668 , 1.10827847, 1.10835054, 1.10861061, 1.10882862, 1.10899855, 1.10736476, 1.10601465, 1.10495659, 1.10492083, 1.10488242, 1.10484054, 1.10429459, 1.10386063, 1.10355751, 1.10372461, 1.10397999, 1.10432267, 1.10627427, 1.1092817 , 1.1130032 , 1.10793707, 1.10338938, 1.09939513, 1.10104902, 1.10295281, 1.10511862, 1.11035155, 1.11198166, 1.11015079, 1.10646494, 1.10408334, 1.10315695, 1.10317685, 1.10320748, 1.10324925, 1.10321736, 1.1032011 , 1.10320065, 1.10324205, 1.10330584, 1.10338618, 1.10355842, 1.10379196, 1.10408859, 1.10464672, 1.10535558, 1.10622065, 1.10686845]) - Ch(time)float640.001237 0.001237 ... 0.001253
- long_name :
- sensible heat transfer coefficient (Stanton number) at height zu
array([0.00123711, 0.00123735, 0.00123717, 0.00123431, 0.00123163, 0.00122933, 0.00121529, 0.00120409, 0.00119483, 0.00119249, 0.00119056, 0.00118913, 0.00118833, 0.00118616, 0.00118308, 0.00118829, 0.0011921 , 0.00119565, 0.00120992, 0.00122777, 0.00124847, 0.00125083, 0.00125436, 0.00125914, 0.00126594, 0.00127214, 0.0012777 , 0.00127637, 0.00127028, 0.00125994, 0.00123876, 0.00122117, 0.00120702, 0.00120462, 0.00120231, 0.00120004, 0.00120455, 0.00120833, 0.00121163, 0.00121241, 0.00121155, 0.00121066, 0.00121348, 0.00121678, 0.00122044, 0.00122777, 0.0012358 , 0.00124449, 0.00125271]) - Chn_10(time)float641.108 1.108 1.108 ... 1.106 1.107
- long_name :
- neutral value of Stanton number at 10m
array([1.1081668 , 1.10827847, 1.10835054, 1.10861061, 1.10882862, 1.10899855, 1.10736476, 1.10601465, 1.10495659, 1.10492083, 1.10488242, 1.10484054, 1.10429459, 1.10386063, 1.10355751, 1.10372461, 1.10397999, 1.10432267, 1.10627427, 1.1092817 , 1.1130032 , 1.10793707, 1.10338938, 1.09939513, 1.10104902, 1.10295281, 1.10511862, 1.11035155, 1.11198166, 1.11015079, 1.10646494, 1.10408334, 1.10315695, 1.10317685, 1.10320748, 1.10324925, 1.10321736, 1.1032011 , 1.10320065, 1.10324205, 1.10330584, 1.10338618, 1.10355842, 1.10379196, 1.10408859, 1.10464672, 1.10535558, 1.10622065, 1.10686845]) - DFrI_TH(depth, time)float320.0 0.0 ... -763.1658 -812.03156
array([[ 0.00000000e+00, 0.00000000e+00, 0.00000000e+00, 0.00000000e+00, 0.00000000e+00, 0.00000000e+00, 0.00000000e+00, 0.00000000e+00, 0.00000000e+00, 0.00000000e+00, 0.00000000e+00, 0.00000000e+00, 0.00000000e+00, 0.00000000e+00, 0.00000000e+00, 0.00000000e+00, 0.00000000e+00, 0.00000000e+00, 0.00000000e+00, 0.00000000e+00, 0.00000000e+00, 0.00000000e+00, 0.00000000e+00, 0.00000000e+00, 0.00000000e+00, 0.00000000e+00, 0.00000000e+00, 0.00000000e+00, 0.00000000e+00, 0.00000000e+00, 0.00000000e+00, 0.00000000e+00, 0.00000000e+00, 0.00000000e+00, 0.00000000e+00, 0.00000000e+00, 0.00000000e+00, 0.00000000e+00, 0.00000000e+00, 0.00000000e+00, 0.00000000e+00, 0.00000000e+00, 0.00000000e+00, 0.00000000e+00, 0.00000000e+00, 0.00000000e+00, 0.00000000e+00, 0.00000000e+00, 0.00000000e+00], [ 1.18091545e+02, 1.54551117e+02, 1.96001984e+02, 2.11274384e+02, 2.07292892e+02, 1.91500443e+02, 8.21416092e+01, -2.24179321e+02, -7.38680176e+02, ... -6.54751282e+02, -7.35820312e+02, -8.23777161e+02, -9.03803711e+02, -9.69690063e+02, -1.02417944e+03, -1.07307739e+03], [-1.45258130e+03, -1.42155737e+03, -1.40369202e+03, -1.42511035e+03, -1.45724084e+03, -1.46177588e+03, -1.43376501e+03, -1.38107153e+03, -1.31036987e+03, -1.23099463e+03, -1.15214417e+03, -1.07771094e+03, -1.00980566e+03, -9.49635803e+02, -8.95534668e+02, -8.46382751e+02, -8.01418091e+02, -7.61249512e+02, -7.31554077e+02, -7.12013855e+02, -6.99529236e+02, -6.90014526e+02, -6.80155457e+02, -6.67975647e+02, -6.53671936e+02, -6.38261597e+02, -6.22673584e+02, -6.09142273e+02, -5.99097717e+02, -5.93652283e+02, -5.92750427e+02, -5.93850586e+02, -5.94824646e+02, -5.92081360e+02, -5.83374207e+02, -5.69400635e+02, -5.52253662e+02, -5.34010559e+02, -5.15996521e+02, -4.98985504e+02, -4.83520538e+02, -4.74689606e+02, -4.93075195e+02, -5.36053833e+02, -5.92866028e+02, -6.53450317e+02, -7.10854248e+02, -7.63165771e+02, -8.12031555e+02]], dtype=float32) - Evap(time)float640.1404 0.1398 ... 0.1474 0.1456
- long_name :
- evaporation rate
- units :
- mm/hour
array([0.14044934, 0.1397621 , 0.13911915, 0.13863338, 0.13853254, 0.1389005 , 0.14144307, 0.14478645, 0.14861001, 0.14792037, 0.14749355, 0.14740036, 0.1498568 , 0.15177465, 0.15325018, 0.1512912 , 0.14802661, 0.14443018, 0.13665843, 0.12956652, 0.12280872, 0.11784329, 0.11308186, 0.10850907, 0.111308 , 0.11419286, 0.11711477, 0.12304791, 0.12868208, 0.13403806, 0.14908964, 0.16659054, 0.18635424, 0.1872476 , 0.18821497, 0.18920981, 0.18884172, 0.18764108, 0.18589779, 0.18321015, 0.1789388 , 0.17482181, 0.16947377, 0.16449677, 0.15976561, 0.15551792, 0.15140505, 0.14737081, 0.1456374 ]) - Jq(depth, time)float640.0 0.0 0.0 ... -102.3 -108.8
array([[ 0. , 0. , 0. , 0. , 0. , 0. , 0. , 0. , 0. , 0. , 0. , 0. , 0. , 0. , 0. , 0. , 0. , 0. , 0. , 0. , 0. , 0. , 0. , 0. , 0. , 0. , 0. , 0. , 0. , 0. , 0. , 0. , 0. , 0. , 0. , 0. , 0. , 0. , 0. , 0. , 0. , 0. , 0. , 0. , 0. , 0. , 0. , 0. , 0. ], [ 96.62282422, 102.88489507, 109.34514556, 100.15921742, 88.01559765, 74.92145021, 11.00931927, -30.04642527, -99.00421935, -158.3644613 , -186.11815118, -240.70380665, -282.73299128, -211.12607222, -178.8862877 , -138.67761367, -177.89440785, -7.8381168 , 39.89349348, 47.54002408, 50.54322767, 55.4097297 , 60.74342146, 64.41270202, 73.66127606, 79.48304224, 83.45266402, 75.92998546, ... -103.95114341, -102.30903213, -100.78216705, -99.52753107, -98.85747022, -98.9656158 , -99.39521225, -99.83999163, -99.77130037, -98.55025333, -96.19926494, -93.1985523 , -90.01834418, -86.99506985, -84.26563738, -81.89067208, -79.8996236 , -80.52435657, -87.75535292, -98.62091608, -110.40964329, -121.13548432, -129.96613541, -137.26926699, -143.82298732], [-194.68733865, -190.52924743, -188.13477994, -191.00544792, -195.31185074, -195.91967472, -192.16541971, -185.10298976, -175.62695006, -164.98840264, -154.42019074, -144.44401454, -135.34277045, -127.27829235, -120.02719663, -113.43943743, -107.41288999, -102.02915431, -98.04911882, -95.43017153, -93.75687636, -92.48163382, -91.16023716, -89.52779517, -87.6106898 , -85.54526464, -83.45602619, -81.64244444, -80.29618739, -79.56634379, -79.44546943, -79.59292208, -79.72347392, -79.35579531, -78.18878833, -76.31593102, -74.01774746, -71.57265114, -69.15825607, -66.87829446, -64.8055478 , -63.62195086, -66.08614444, -71.84650815, -79.4609632 , -87.58098657, -95.27475111, -102.28598779, -108.83539703]]) - KPPdiffKzT(depth, time)float320.0 0.0 ... 0.00079970685
array([[0. , 0. , 0. , 0. , 0. , 0. , 0. , 0. , 0. , 0. , 0. , 0. , 0. , 0. , 0. , 0. , 0. , 0. , 0. , 0. , 0. , 0. , 0. , 0. , 0. , 0. , 0. , 0. , 0. , 0. , 0. , 0. , 0. , 0. , 0. , 0. , 0. , 0. , 0. , 0. , 0. , 0. , 0. , 0. , 0. , 0. , 0. , 0. , 0. ], [0.01337718, 0.01362901, 0.01395127, 0.01330278, 0.01236589, 0.01131802, 0.00474387, 0.00340684, 0.004281 , 0.00424945, 0.00309305, 0.00277512, 0.0038102 , 0.00365704, 0.00349906, 0.00403004, 0.00771195, 0.01173732, 0.01203097, 0.01187546, 0.01139231, 0.01092175, 0.01004506, 0.00945487, 0.0087192 , 0.00833916, 0.0081771 , 0.00796388, 0.00791654, 0.00767651, 0.00426438, 0.00320072, 0.00397054, 0.00401093, 0.00434088, 0.00438381, 0.00407183, 0.00383861, 0.0038404 , 0.00469445, 0.00961767, 0.01329732, 0.01339949, 0.01404718, 0.01415717, 0.01403724, 0.01390051, 0.01370099, 0.01367293], ... [0.00266167, 0.00266545, 0.00266849, 0.00270099, 0.0027183 , 0.00269964, 0.00265676, 0.0025951 , 0.00251294, 0.002415 , 0.0023101 , 0.00220261, 0.00209536, 0.00198974, 0.00188533, 0.00178244, 0.00168209, 0.00159083, 0.00152165, 0.00146817, 0.00142298, 0.00137863, 0.0013303 , 0.00127725, 0.00122106, 0.0011646 , 0.00111004, 0.00106009, 0.00101701, 0.00098267, 0.00095619, 0.00093444, 0.00091343, 0.00088777, 0.0008568 , 0.00082272, 0.00078797, 0.00075468, 0.00072345, 0.00069451, 0.00066822, 0.00065965, 0.00069484, 0.00075098, 0.00081049, 0.00086309, 0.00090567, 0.00094119, 0.00097417], [0.0024559 , 0.00247552, 0.00247783, 0.00249774, 0.00251909, 0.00251778, 0.00249405, 0.00245282, 0.00239313, 0.00231641, 0.00222878, 0.00213453, 0.00203696, 0.00193882, 0.00184059, 0.00174287, 0.00164697, 0.00155574, 0.00147816, 0.00141334, 0.00135758, 0.00130556, 0.0012527 , 0.00119693, 0.00113903, 0.00108055, 0.00102357, 0.00097052, 0.00092405, 0.00088552, 0.00085465, 0.00082987, 0.00080877, 0.00078737, 0.00076285, 0.00073508, 0.00070566, 0.00067615, 0.00064737, 0.00061982, 0.00059395, 0.00057482, 0.00058281, 0.00061336, 0.00065436, 0.00069646, 0.00073454, 0.00076823, 0.00079971]], dtype=float32) - KPPg_TH(depth, time)float320.0 0.0 0.0 0.0 ... 0.0 0.0 0.0 0.0
array([[ 0.00000000e+00, 0.00000000e+00, 0.00000000e+00, 0.00000000e+00, 0.00000000e+00, 0.00000000e+00, 0.00000000e+00, 0.00000000e+00, 0.00000000e+00, 0.00000000e+00, 0.00000000e+00, 0.00000000e+00, 0.00000000e+00, 0.00000000e+00, 0.00000000e+00, 0.00000000e+00, 0.00000000e+00, 0.00000000e+00, 0.00000000e+00, 0.00000000e+00, 0.00000000e+00, 0.00000000e+00, 0.00000000e+00, 0.00000000e+00, 0.00000000e+00, 0.00000000e+00, 0.00000000e+00, 0.00000000e+00, 0.00000000e+00, 0.00000000e+00, 0.00000000e+00, 0.00000000e+00, 0.00000000e+00, 0.00000000e+00, 0.00000000e+00, 0.00000000e+00, 0.00000000e+00, 0.00000000e+00, 0.00000000e+00, 0.00000000e+00, 0.00000000e+00, 0.00000000e+00, 0.00000000e+00, 0.00000000e+00, 0.00000000e+00, 0.00000000e+00, 0.00000000e+00, 0.00000000e+00, 0.00000000e+00], [ 6.02820801e+02, 6.13083191e+02, 6.19832825e+02, 5.36023315e+02, 4.49400085e+02, 3.67495850e+02, -0.00000000e+00, -0.00000000e+00, -0.00000000e+00, ... 0.00000000e+00, 0.00000000e+00, 0.00000000e+00, 0.00000000e+00, 0.00000000e+00, 0.00000000e+00, 0.00000000e+00], [ 0.00000000e+00, 0.00000000e+00, 0.00000000e+00, 0.00000000e+00, 0.00000000e+00, 0.00000000e+00, -0.00000000e+00, -0.00000000e+00, -0.00000000e+00, -0.00000000e+00, -0.00000000e+00, -0.00000000e+00, -0.00000000e+00, -0.00000000e+00, -0.00000000e+00, -0.00000000e+00, 0.00000000e+00, 0.00000000e+00, 0.00000000e+00, 0.00000000e+00, 0.00000000e+00, 0.00000000e+00, 0.00000000e+00, 0.00000000e+00, 0.00000000e+00, 0.00000000e+00, 0.00000000e+00, 0.00000000e+00, 0.00000000e+00, 0.00000000e+00, -0.00000000e+00, -0.00000000e+00, -0.00000000e+00, -0.00000000e+00, -0.00000000e+00, -0.00000000e+00, -0.00000000e+00, -0.00000000e+00, -0.00000000e+00, -0.00000000e+00, 0.00000000e+00, 0.00000000e+00, 0.00000000e+00, 0.00000000e+00, 0.00000000e+00, 0.00000000e+00, 0.00000000e+00, 0.00000000e+00, 0.00000000e+00]], dtype=float32) - KPPhbl(time)float3222.682652 22.976309 ... 22.323658
array([22.682652 , 22.976309 , 23.443365 , 23.608408 , 23.381216 , 22.8835 , 20.023281 , 8.586645 , 5.078205 , 3.9927316, 3.3475456, 2.9330244, 3.9255166, 5.4875035, 8.481589 , 17.44334 , 23.597738 , 20.194412 , 20.246532 , 19.92704 , 18.72656 , 17.548143 , 15.691837 , 14.432017 , 12.968116 , 12.24404 , 11.893579 , 12.207215 , 12.858485 , 13.281775 , 13.811285 , 9.636713 , 6.7865567, 5.7722993, 5.064069 , 4.5686874, 5.417419 , 6.979744 , 10.141655 , 26.696741 , 24.047106 , 21.664755 , 21.15301 , 22.7553 , 22.998276 , 22.869375 , 22.68643 , 22.382105 , 22.323658 ], dtype=float32) - KPPviscAz(depth, time)float320.0 0.0 ... 0.00080870686
array([[0. , 0. , 0. , 0. , 0. , 0. , 0. , 0. , 0. , 0. , 0. , 0. , 0. , 0. , 0. , 0. , 0. , 0. , 0. , 0. , 0. , 0. , 0. , 0. , 0. , 0. , 0. , 0. , 0. , 0. , 0. , 0. , 0. , 0. , 0. , 0. , 0. , 0. , 0. , 0. , 0. , 0. , 0. , 0. , 0. , 0. , 0. , 0. , 0. ], [0.00849002, 0.00857476, 0.00869639, 0.00846747, 0.00811854, 0.00772308, 0.0047446 , 0.00341 , 0.00428822, 0.00425812, 0.00310018, 0.00278143, 0.00381902, 0.00366386, 0.00350327, 0.00403167, 0.00694051, 0.00836142, 0.00818535, 0.00783148, 0.00734516, 0.00702921, 0.00650866, 0.00614757, 0.0058095 , 0.00564293, 0.00559381, 0.00561572, 0.00577806, 0.00581785, 0.00426571, 0.00320434, 0.00397599, 0.00401737, 0.00434815, 0.00439173, 0.00407867, 0.00384385, 0.00384371, 0.00469511, 0.0079378 , 0.00920293, 0.00912367, 0.00935055, 0.00931875, 0.00916238, 0.00900317, 0.00880773, 0.00871424], ... [0.00267067, 0.00267445, 0.00267749, 0.00270999, 0.0027273 , 0.00270864, 0.00266576, 0.0026041 , 0.00252194, 0.002424 , 0.0023191 , 0.00221161, 0.00210436, 0.00199874, 0.00189433, 0.00179144, 0.00169109, 0.00159983, 0.00153065, 0.00147717, 0.00143198, 0.00138763, 0.0013393 , 0.00128625, 0.00123006, 0.0011736 , 0.00111904, 0.00106909, 0.00102601, 0.00099167, 0.00096519, 0.00094344, 0.00092243, 0.00089677, 0.0008658 , 0.00083172, 0.00079697, 0.00076368, 0.00073245, 0.00070351, 0.00067722, 0.00066865, 0.00070384, 0.00075998, 0.00081949, 0.00087209, 0.00091467, 0.00095019, 0.00098317], [0.0024649 , 0.00248452, 0.00248683, 0.00250674, 0.00252808, 0.00252678, 0.00250305, 0.00246182, 0.00240213, 0.00232541, 0.00223778, 0.00214353, 0.00204596, 0.00194782, 0.00184959, 0.00175187, 0.00165597, 0.00156474, 0.00148716, 0.00142234, 0.00136658, 0.00131456, 0.0012617 , 0.00120593, 0.00114803, 0.00108955, 0.00103257, 0.00097952, 0.00093305, 0.00089452, 0.00086365, 0.00083887, 0.00081777, 0.00079637, 0.00077185, 0.00074408, 0.00071466, 0.00068515, 0.00065637, 0.00062882, 0.00060295, 0.00058382, 0.00059181, 0.00062236, 0.00066336, 0.00070546, 0.00074354, 0.00077723, 0.00080871]], dtype=float32) - L(time)float64-50.09 -50.04 ... -44.78 -41.55
- long_name :
- Obukhov len scale
- units :
- m
array([-50.08547606, -50.04437803, -50.20143106, -52.0616675 , -53.87646485, -55.49551348, -64.12928781, -72.59525572, -81.1086263 , -83.92784498, -86.36112032, -88.19426661, -88.19021862, -90.28722651, -94.07898491, -87.01315907, -82.62087976, -79.02084519, -67.40457639, -56.7762775 , -47.62325434, -43.65600226, -39.90746927, -36.38423754, -34.77321178, -33.54927445, -32.6713103 , -35.01160503, -37.65378414, -40.58378901, -47.83286993, -56.07346026, -65.45761584, -67.55633814, -69.6941991 , -71.91239812, -67.6117964 , -64.33379109, -61.69243826, -61.18913778, -62.00241426, -62.87171247, -60.92359303, -58.78447725, -56.56451215, -52.43080582, -48.49113725, -44.78300861, -41.5478405 ]) - Le(time)float642.5e+06 2.5e+06 ... 2.5e+06 2.5e+06
- long_name :
- latent heat of vaporization
array([2500000., 2500000., 2500000., 2500000., 2500000., 2500000., 2500000., 2500000., 2500000., 2500000., 2500000., 2500000., 2500000., 2500000., 2500000., 2500000., 2500000., 2500000., 2500000., 2500000., 2500000., 2500000., 2500000., 2500000., 2500000., 2500000., 2500000., 2500000., 2500000., 2500000., 2500000., 2500000., 2500000., 2500000., 2500000., 2500000., 2500000., 2500000., 2500000., 2500000., 2500000., 2500000., 2500000., 2500000., 2500000., 2500000., 2500000., 2500000., 2500000.]) - Q10(time)float6412.94 12.95 12.96 ... 13.4 13.41
- long_name :
- specific humidity adjusted to 10 m
- units :
- g/kg
array([12.93811895, 12.94742842, 12.9567379 , 12.93129144, 12.90584497, 12.88039851, 12.93936382, 12.99832913, 13.05729444, 13.1357657 , 13.21423697, 13.29270823, 13.37976755, 13.46682687, 13.55388619, 13.54609739, 13.53830859, 13.53051979, 13.48725012, 13.44398045, 13.40071079, 13.44211832, 13.48352586, 13.5249334 , 13.51916273, 13.51339207, 13.50762141, 13.45041887, 13.39321633, 13.3360138 , 13.16301636, 12.99001893, 12.81702149, 12.86981286, 12.92260423, 12.9753956 , 13.01623647, 13.05707735, 13.09791822, 13.12502599, 13.15213376, 13.17924153, 13.23115965, 13.28307778, 13.33499591, 13.35771155, 13.38042719, 13.40314283, 13.40692968]) - Qrf(time)float6412.94 12.95 12.96 ... 13.4 13.41
- long_name :
- specific humidity at reference height
- units :
- g/kg
array([12.93811895, 12.94742842, 12.9567379 , 12.93129144, 12.90584497, 12.88039851, 12.93936382, 12.99832913, 13.05729444, 13.1357657 , 13.21423697, 13.29270823, 13.37976755, 13.46682687, 13.55388619, 13.54609739, 13.53830859, 13.53051979, 13.48725012, 13.44398045, 13.40071079, 13.44211832, 13.48352586, 13.5249334 , 13.51916273, 13.51339207, 13.50762141, 13.45041887, 13.39321633, 13.3360138 , 13.16301636, 12.99001893, 12.81702149, 12.86981286, 12.92260423, 12.9753956 , 13.01623647, 13.05707735, 13.09791822, 13.12502599, 13.15213376, 13.17924153, 13.23115965, 13.28307778, 13.33499591, 13.35771155, 13.38042719, 13.40314283, 13.40692968]) - Qs(time)float640.01747 0.01747 ... 0.01792 0.01793
- long_name :
- surface water specific humidity
- units :
- g/kg
array([0.01746741, 0.01746524, 0.01746147, 0.01744965, 0.01744567, 0.01745157, 0.0174603 , 0.01748952, 0.01753033, 0.01758232, 0.01764065, 0.01770701, 0.01776625, 0.01780857, 0.01783711, 0.01783664, 0.01780474, 0.01776373, 0.01773967, 0.01772724, 0.01771927, 0.01772237, 0.01772697, 0.01773286, 0.01775124, 0.01776795, 0.0177816 , 0.01777975, 0.01777835, 0.01777882, 0.01777429, 0.01779206, 0.01782397, 0.01787372, 0.01792475, 0.01797601, 0.01803244, 0.01806963, 0.01809382, 0.01808689, 0.01804243, 0.01800002, 0.01797215, 0.01795091, 0.01793358, 0.01792735, 0.01792275, 0.0179185 , 0.01792788]) - RF(time)float641.601e-10 9.915e-11 ... 1.209e-10
- long_name :
- rain heat flux
- units :
- ?
array([1.60079423e-10, 9.91461690e-11, 3.86106310e-11, 2.57074401e-11, 1.28663999e-11, 0.00000000e+00, 0.00000000e+00, 0.00000000e+00, 0.00000000e+00, 0.00000000e+00, 0.00000000e+00, 0.00000000e+00, 0.00000000e+00, 0.00000000e+00, 0.00000000e+00, 4.25400768e-11, 8.46628453e-11, 1.26014992e-10, 1.48395646e-10, 1.71480798e-10, 1.95087493e-10, 1.98274556e-10, 2.01470469e-10, 2.04669579e-10, 2.05328359e-10, 2.05824620e-10, 2.06076571e-10, 1.39617429e-10, 7.09414013e-11, 0.00000000e+00, 0.00000000e+00, 0.00000000e+00, 0.00000000e+00, 0.00000000e+00, 0.00000000e+00, 0.00000000e+00, 2.37086582e-12, 4.74504871e-12, 7.09945131e-12, 2.77654440e-11, 4.75795438e-11, 6.66467284e-11, 8.70188052e-11, 1.06753543e-10, 1.25875561e-10, 1.21523290e-10, 1.17270455e-10, 1.13071866e-10, 1.20927074e-10]) - RH10(time)float6475.81 75.84 75.88 ... 78.3 78.46
- long_name :
- relative humidity adjusted to 10 m
- units :
- %
array([75.80929039, 75.84410659, 75.87886979, 75.47563097, 75.07434971, 74.67501635, 74.81641011, 74.95658966, 75.09556127, 75.213251 , 75.32861031, 75.44165964, 76.03992644, 76.63968673, 77.24094331, 77.33892562, 77.43704193, 77.5352924 , 77.15758576, 76.78095504, 76.40539739, 76.70478174, 77.00461178, 77.30488807, 77.61335295, 77.92325055, 78.2345884 , 77.97784804, 77.7205477 , 77.46268652, 76.81251073, 76.1547462 , 75.48933273, 75.49800264, 75.50554454, 75.51196836, 75.81839488, 76.1252968 , 76.43267448, 76.50198991, 76.57105539, 76.63987147, 76.99132523, 77.34317386, 77.69541741, 77.8960833 , 78.09704342, 78.29829816, 78.46472597]) - RHrf(time)float6475.81 75.84 75.88 ... 78.3 78.46
- long_name :
- relative humidity at reference height
- units :
- %
array([75.80929039, 75.84410659, 75.87886979, 75.47563097, 75.07434971, 74.67501635, 74.81641011, 74.95658966, 75.09556127, 75.213251 , 75.32861031, 75.44165964, 76.03992644, 76.63968673, 77.24094331, 77.33892562, 77.43704193, 77.5352924 , 77.15758576, 76.78095504, 76.40539739, 76.70478174, 77.00461178, 77.30488807, 77.61335295, 77.92325055, 78.2345884 , 77.97784804, 77.7205477 , 77.46268652, 76.81251073, 76.1547462 , 75.48933273, 75.49800264, 75.50554454, 75.51196836, 75.81839488, 76.1252968 , 76.43267448, 76.50198991, 76.57105539, 76.63987147, 76.99132523, 77.34317386, 77.69541741, 77.8960833 , 78.09704342, 78.29829816, 78.46472597]) - Rnl(time)float6423.84 28.76 33.68 ... 30.67 31.06
- long_name :
- Upwelling IR radiation computed by COARE
- units :
- W/m^2
array([23.83781047, 28.76250231, 33.67852262, 35.42364706, 37.21092797, 39.05135717, 39.3895421 , 39.8378529 , 40.34822274, 44.57311436, 48.83134359, 53.13152323, 52.06612061, 50.91007769, 49.68051287, 45.17273475, 40.49844492, 35.77558819, 31.0041706 , 26.29446761, 21.6083915 , 23.22103681, 24.84160776, 26.46905369, 26.86147145, 27.24491425, 27.61201348, 30.37668678, 33.143783 , 35.92075729, 42.88225698, 49.9620827 , 57.11683909, 57.56521562, 58.0198234 , 58.47510062, 55.49847235, 52.42010213, 49.27320407, 47.96597249, 46.46187832, 44.96812286, 41.37957728, 37.82581534, 34.29245155, 33.07700241, 31.87014092, 30.66512431, 31.05851243]) - SSH(time)float320.36676002 ... 0.37923476
array([0.36676002, 0.36429515, 0.361738 , 0.359857 , 0.3595188 , 0.36188754, 0.36681786, 0.37388927, 0.3799195 , 0.38492346, 0.3886736 , 0.3914941 , 0.39198887, 0.39029008, 0.38812554, 0.38460943, 0.38073498, 0.3775577 , 0.3754281 , 0.3752992 , 0.37616947, 0.37770927, 0.37781885, 0.37615353, 0.3736428 , 0.3701476 , 0.3668807 , 0.36397365, 0.36287585, 0.36555284, 0.37173203, 0.37913904, 0.3847717 , 0.38828948, 0.3910809 , 0.39198384, 0.39176026, 0.3903012 , 0.38800406, 0.38491523, 0.38133657, 0.37953025, 0.37868354, 0.3795932 , 0.38090602, 0.3816969 , 0.38162598, 0.38077566, 0.37923476], dtype=float32) - T10(time)float6422.65 22.65 22.64 ... 22.69 22.65
- long_name :
- temperature adjusted to 10 m
- units :
- °C
array([22.65229387, 22.64596817, 22.63964248, 22.69487427, 22.75010607, 22.80533786, 22.85510904, 22.90488022, 22.9546514 , 23.02560119, 23.09655097, 23.16750076, 23.12990675, 23.09231275, 23.05471874, 23.02293618, 22.99115361, 22.95937105, 22.99638594, 23.03340084, 23.07041573, 23.05871536, 23.04701499, 23.03531462, 22.95311897, 22.87092332, 22.78872767, 22.77636378, 22.76399989, 22.75163601, 22.68784883, 22.62406164, 22.56027446, 22.6241647 , 22.68805493, 22.75194517, 22.72374367, 22.69554218, 22.66734068, 22.68742736, 22.70751404, 22.72760072, 22.72602084, 22.72444095, 22.72286107, 22.71135973, 22.69985839, 22.68835705, 22.6476096 ]) - Trf(time)float6422.65 22.65 22.64 ... 22.69 22.65
- long_name :
- temperature at reference height
array([22.65229387, 22.64596817, 22.63964248, 22.69487427, 22.75010607, 22.80533786, 22.85510904, 22.90488022, 22.9546514 , 23.02560119, 23.09655097, 23.16750076, 23.12990675, 23.09231275, 23.05471874, 23.02293618, 22.99115361, 22.95937105, 22.99638594, 23.03340084, 23.07041573, 23.05871536, 23.04701499, 23.03531462, 22.95311897, 22.87092332, 22.78872767, 22.77636378, 22.76399989, 22.75163601, 22.68784883, 22.62406164, 22.56027446, 22.6241647 , 22.68805493, 22.75194517, 22.72374367, 22.69554218, 22.66734068, 22.68742736, 22.70751404, 22.72760072, 22.72602084, 22.72444095, 22.72286107, 22.71135973, 22.69985839, 22.68835705, 22.6476096 ]) - U10(time)float645.76 5.745 5.736 ... 6.022 5.902
- long_name :
- wind speed adjusted to 10 m
- units :
- m/s
array([5.75987555, 5.74517735, 5.73630078, 5.71339165, 5.69564596, 5.68311207, 5.9224065 , 6.16195098, 6.40171745, 6.42333296, 6.44503335, 6.46681774, 6.62031724, 6.7866521 , 6.96490277, 6.83242869, 6.7002796 , 6.56847513, 6.11117626, 5.66539366, 5.23407067, 5.05580901, 4.87766104, 4.69963967, 4.76605676, 4.83874905, 4.91743825, 5.10772456, 5.30087501, 5.49658767, 5.995224 , 6.52904033, 7.09009497, 7.14348855, 7.19758696, 7.25237443, 7.18694986, 7.12262487, 7.05942951, 7.0005683 , 6.94304329, 6.88688796, 6.77214524, 6.65744139, 6.54277845, 6.36897552, 6.19529155, 6.02173683, 5.90226717]) - U10N(time)float645.966 5.95 5.941 ... 6.256 6.143
- long_name :
- neutral value of wind speed at 10m
array([5.9655613 , 5.95034574, 5.94064227, 5.9116718 , 5.88850954, 5.87150429, 6.10099935, 6.33319622, 6.56703203, 6.58511754, 6.6040166 , 6.62394052, 6.78216447, 6.95070879, 7.12921348, 7.00264423, 6.8729673 , 6.74261245, 6.29017856, 5.85008933, 5.42425821, 5.24972057, 5.07540325, 4.90128084, 4.97695438, 5.05824243, 5.14477742, 5.33473369, 5.52684336, 5.72098252, 6.21818378, 6.75101646, 7.31087751, 7.36135062, 7.41261966, 7.46457508, 7.40640975, 7.34754702, 7.28861851, 7.22862543, 7.16653866, 7.10583768, 6.9913392 , 6.87746656, 6.76397706, 6.59452774, 6.42532956, 6.25625642, 6.14297711]) - UN(time)float645.966 5.95 5.941 ... 6.256 6.143
- long_name :
- neutral value of wind speed at zu
array([5.9655613 , 5.95034574, 5.94064227, 5.9116718 , 5.88850954, 5.87150429, 6.10099935, 6.33319622, 6.56703203, 6.58511754, 6.6040166 , 6.62394052, 6.78216447, 6.95070879, 7.12921348, 7.00264423, 6.8729673 , 6.74261245, 6.29017856, 5.85008933, 5.42425821, 5.24972057, 5.07540325, 4.90128084, 4.97695438, 5.05824243, 5.14477742, 5.33473369, 5.52684336, 5.72098252, 6.21818378, 6.75101646, 7.31087751, 7.36135062, 7.41261966, 7.46457508, 7.40640975, 7.34754702, 7.28861851, 7.22862543, 7.16653866, 7.10583768, 6.9913392 , 6.87746656, 6.76397706, 6.59452774, 6.42532956, 6.25625642, 6.14297711]) - Urf(time)float645.76 5.745 5.736 ... 6.022 5.902
- long_name :
- wind speed at reference height
array([5.75987555, 5.74517735, 5.73630078, 5.71339165, 5.69564596, 5.68311207, 5.9224065 , 6.16195098, 6.40171745, 6.42333296, 6.44503335, 6.46681774, 6.62031724, 6.7866521 , 6.96490277, 6.83242869, 6.7002796 , 6.56847513, 6.11117626, 5.66539366, 5.23407067, 5.05580901, 4.87766104, 4.69963967, 4.76605676, 4.83874905, 4.91743825, 5.10772456, 5.30087501, 5.49658767, 5.995224 , 6.52904033, 7.09009497, 7.14348855, 7.19758696, 7.25237443, 7.18694986, 7.12262487, 7.05942951, 7.0005683 , 6.94304329, 6.88688796, 6.77214524, 6.65744139, 6.54277845, 6.36897552, 6.19529155, 6.02173683, 5.90226717]) - UrfN(time)float645.966 5.95 5.941 ... 6.256 6.143
- long_name :
- neutral value of wind speed at reference height
array([5.9655613 , 5.95034574, 5.94064227, 5.9116718 , 5.88850954, 5.87150429, 6.10099935, 6.33319622, 6.56703203, 6.58511754, 6.6040166 , 6.62394052, 6.78216447, 6.95070879, 7.12921348, 7.00264423, 6.8729673 , 6.74261245, 6.29017856, 5.85008933, 5.42425821, 5.24972057, 5.07540325, 4.90128084, 4.97695438, 5.05824243, 5.14477742, 5.33473369, 5.52684336, 5.72098252, 6.21818378, 6.75101646, 7.31087751, 7.36135062, 7.41261966, 7.46457508, 7.40640975, 7.34754702, 7.28861851, 7.22862543, 7.16653866, 7.10583768, 6.9913392 , 6.87746656, 6.76397706, 6.59452774, 6.42532956, 6.25625642, 6.14297711]) - VISrI_Um(depth, time)float320.0 0.0 0.0 ... 190.43164 193.63968
array([[ 0. , 0. , 0. , 0. , 0. , 0. , 0. , 0. , 0. , 0. , 0. , 0. , 0. , 0. , 0. , 0. , 0. , 0. , 0. , 0. , 0. , 0. , 0. , 0. , 0. , 0. , 0. , 0. , 0. , 0. , 0. , 0. , 0. , 0. , 0. , 0. , 0. , 0. , 0. , 0. , 0. , 0. , 0. , 0. , 0. , 0. , 0. , 0. , 0. ], [ 478.07684 , 434.68857 , 399.97925 , 366.2785 , 327.16577 , 284.3768 , 190.61703 , 189.36215 , 219.59465 , 240.43295 , 222.39537 , 235.33578 , 246.81412 , 166.17737 , 121.27713 , 96.337944 , 186.65198 , 124.31963 , 38.34903 , -21.74747 , -66.17351 , -78.05494 , -74.046165 , -68.72148 , -54.745354 , -31.015669 , -4.30686 , 16.886728 , ... 368.38828 , 347.89233 , 327.16898 , 307.33365 , 289.53607 , 274.56726 , 262.2848 , 252.14626 , 243.0141 , 233.39813 , 223.12529 , 212.75317 , 202.91339 , 193.87793 , 185.55464 , 177.82516 , 170.5116 , 167.7539 , 176.15176 , 188.78351 , 200.69083 , 209.3132 , 214.23576 , 216.7536 , 218.47183 ], [ 844.1831 , 850.14355 , 849.718 , 855.70465 , 861.17145 , 858.8734 , 847.3747 , 826.6956 , 795.49725 , 756.19586 , 714.05365 , 672.4523 , 633.22015 , 597.0254 , 563.03204 , 530.6799 , 499.7592 , 471.23465 , 448.03787 , 429.01318 , 412.69144 , 397.57074 , 381.99118 , 364.9138 , 346.1744 , 326.2394 , 305.86087 , 286.07758 , 267.91296 , 252.11867 , 238.92297 , 228.04979 , 219.00475 , 210.65431 , 202.2346 , 193.72954 , 185.43987 , 177.65024 , 170.29527 , 163.28804 , 156.6312 , 151.61761 , 153.8512 , 161.60208 , 171.13597 , 179.74554 , 186.12202 , 190.43164 , 193.63968 ]], dtype=float32) - VISrI_Vm(depth, time)float320.0 0.0 ... -298.01572 -318.4322
array([[ 0. , 0. , 0. , 0. , 0. , 0. , 0. , 0. , 0. , 0. , 0. , 0. , 0. , 0. , 0. , 0. , 0. , 0. , 0. , 0. , 0. , 0. , 0. , 0. , 0. , 0. , 0. , 0. , 0. , 0. , 0. , 0. , 0. , 0. , 0. , 0. , 0. , 0. , 0. , 0. , 0. , 0. , 0. , 0. , 0. , 0. , 0. , 0. , 0. ], [-1488.9612 , -1580.6384 , -1600.1063 , -1545.267 , -1446.6067 , -1320.4425 , -1054.4606 , -1094.7894 , -1327.5206 , -1415.3649 , -1306.4567 , -1392.6515 , -1675.1897 , -1576.1588 , -1759.2844 , -1971.544 , -2768.5999 , -2159.5977 , -1693.9218 , -1438.6245 , -1220.1534 , -1112.8959 , -1017.22327, -950.29443, -958.04596, -1017.1469 , -1060.0004 , -1089.0409 , -1133.2606 , -1183.1395 , -1060.7081 , -1176.5184 , -1617.6869 , -1661.8849 , -1776.857 , -1850.5865 , -1758.9641 , -1893.4012 , -1880.1704 , -2149.9556 , -2804.8867 , -2301.3452 , -1979.4037 , -1860.1263 , -1757.4205 , -1659.7535 , -1568.7693 , -1487.2855 , -1430.2078 ], ... -810.04193, -773.8309 , -723.4206 , -669.03534, -616.239 , -567.88025, -524.4555 , -485.96588, -452.12244, -422.25772, -395.86075, -372.66913, -353.68628, -343.11453, -339.37173, -339.48093, -340.2957 , -339.6634 , -337.06433, -333.0845 , -328.61176, -324.08905, -319.9776 , -316.85574, -315.0065 , -313.68677, -311.8488 , -308.18207, -301.202 , -290.9988 , -278.8629 , -266.28595, -254.59477, -244.42157, -236.01262, -229.46243, -230.64273, -251.0353 , -283.14096, -319.34946, -353.3716 , -382.09378, -406.0491 , -427.4717 ], [ -639.58276, -628.7204 , -627.67944, -654.7729 , -690.5311 , -701.57837, -686.2567 , -654.0755 , -613.4027 , -570.04156, -527.7957 , -488.23526, -452.0856 , -419.66553, -390.6215 , -364.66913, -341.58496, -321.40778, -306.3528 , -296.37756, -290.08215, -285.51254, -281.0703 , -276.00137, -270.41208, -264.67294, -259.16623, -254.26614, -250.41534, -247.79929, -246.07774, -244.52849, -242.4275 , -238.68422, -232.6413 , -224.58505, -215.43079, -206.23372, -197.63617, -189.99211, -183.50752, -179.89859, -186.6986 , -203.51254, -226.55211, -251.74261, -275.94473, -298.01572, -318.4322 ]], dtype=float32) - dens(depth, time)float321023.3128 1023.317 ... 1023.55115
array([[1023.3128 , 1023.317 , 1023.3219 , 1023.32574, 1023.3266 , 1023.32367, 1023.31726, 1023.3052 , 1023.29016, 1023.27484, 1023.2581 , 1023.2394 , 1023.22626, 1023.2178 , 1023.213 , 1023.21246, 1023.2211 , 1023.2334 , 1023.2373 , 1023.2374 , 1023.23615, 1023.23346, 1023.2303 , 1023.2267 , 1023.22327, 1023.2205 , 1023.2188 , 1023.2179 , 1023.2169 , 1023.21533, 1023.2127 , 1023.2042 , 1023.1917 , 1023.17804, 1023.1642 , 1023.1504 , 1023.1386 , 1023.13196, 1023.1288 , 1023.1297 , 1023.14124, 1023.1534 , 1023.15845, 1023.16144, 1023.16327, 1023.1637 , 1023.1636 , 1023.1634 , 1023.16364], [1023.31274, 1023.31683, 1023.32166, 1023.32544, 1023.3263 , 1023.32336, 1023.3169 , 1023.3066 , 1023.29407, 1023.2813 , 1023.2687 , 1023.2546 , 1023.2393 , 1023.22784, 1023.222 , 1023.2185 , 1023.22577, 1023.2351 , 1023.2382 , 1023.23816, 1023.2368 , 1023.23413, 1023.231 , 1023.2274 , 1023.224 , 1023.2212 , 1023.21954, 1023.2185 , 1023.21735, 1023.2157 , 1023.2129 , 1023.2064 , 1023.19666, 1023.1848 , 1023.1722 , 1023.15985, 1023.1478 , 1023.14087, 1023.13544, 1023.13367, 1023.1442 , 1023.1542 , 1023.1586 , 1023.1616 , 1023.1633 , 1023.16376, 1023.1637 , 1023.16345, 1023.1637 ], ... [1023.48834, 1023.4905 , 1023.4931 , 1023.49554, 1023.4976 , 1023.49976, 1023.50244, 1023.5056 , 1023.5093 , 1023.5134 , 1023.51794, 1023.52264, 1023.5276 , 1023.53265, 1023.53754, 1023.5422 , 1023.5463 , 1023.55005, 1023.5533 , 1023.5561 , 1023.55853, 1023.5608 , 1023.56287, 1023.5647 , 1023.56635, 1023.5677 , 1023.5687 , 1023.5693 , 1023.5693 , 1023.5686 , 1023.5673 , 1023.56555, 1023.5634 , 1023.561 , 1023.5584 , 1023.5559 , 1023.55365, 1023.5516 , 1023.5496 , 1023.5477 , 1023.54584, 1023.544 , 1023.5418 , 1023.5391 , 1023.5358 , 1023.532 , 1023.5278 , 1023.5232 , 1023.51843], [1023.50745, 1023.50903, 1023.5115 , 1023.5141 , 1023.5164 , 1023.5187 , 1023.5212 , 1023.524 , 1023.5272 , 1023.5308 , 1023.53485, 1023.53925, 1023.5439 , 1023.5487 , 1023.5535 , 1023.5581 , 1023.5623 , 1023.56616, 1023.5696 , 1023.5727 , 1023.57556, 1023.57825, 1023.58075, 1023.5831 , 1023.58527, 1023.58716, 1023.58875, 1023.58997, 1023.5906 , 1023.59064, 1023.5901 , 1023.58905, 1023.5875 , 1023.5856 , 1023.5834 , 1023.58124, 1023.57916, 1023.57733, 1023.5756 , 1023.574 , 1023.5724 , 1023.57086, 1023.56934, 1023.56757, 1023.56525, 1023.56244, 1023.5591 , 1023.5553 , 1023.55115]], dtype=float32) - dqer(time)float640.0 0.0 0.0 0.0 ... 0.0 0.0 0.0 0.0
- long_name :
- cool-skin humidity depression
- units :
- degC
array([0., 0., 0., 0., 0., 0., 0., 0., 0., 0., 0., 0., 0., 0., 0., 0., 0., 0., 0., 0., 0., 0., 0., 0., 0., 0., 0., 0., 0., 0., 0., 0., 0., 0., 0., 0., 0., 0., 0., 0., 0., 0., 0., 0., 0., 0., 0., 0., 0.]) - dter(time)float640.1908 0.1978 ... 0.2022 0.2055
- long_name :
- cool-skin temperature depression
- units :
- degC
array([0.19079488, 0.19784192, 0.20473295, 0.20603541, 0.20768256, 0.20978934, 0.19860504, 0.18966183, 0.18232981, 0.18375224, 0.18552201, 0.18772505, 0.1886506 , 0.18815418, 0.18646648, 0.18674282, 0.18560268, 0.1841752 , 0.1844418 , 0.18460248, 0.18401161, 0.18714852, 0.19059084, 0.1943354 , 0.19685904, 0.19918996, 0.20125059, 0.20458795, 0.20721721, 0.20924218, 0.21148121, 0.21519289, 0.21978507, 0.21783578, 0.21599705, 0.21421592, 0.21543669, 0.21575533, 0.21547635, 0.21657033, 0.21589611, 0.21543532, 0.21047226, 0.20570453, 0.20099365, 0.20136185, 0.20179045, 0.20220579, 0.20550352]) - hbb(time)float6412.05 11.94 11.84 ... 16.06 16.21
- long_name :
- buoyancy flux into ocean
- units :
- W/m^2
array([12.04510531, 11.94433993, 11.836223 , 11.20983863, 10.67694604, 10.25592958, 10.1729653 , 10.29000825, 10.52597609, 10.27595517, 10.09334843, 9.9959589 , 10.92512008, 11.70948686, 12.37526609, 12.50313738, 12.26894236, 11.93557697, 10.82216642, 9.89965293, 9.07584693, 8.86362129, 8.66587486, 8.4797277 , 9.33826552, 10.21927148, 11.1111616 , 11.71109471, 12.28791387, 12.85249397, 14.68242037, 16.96764036, 19.66734755, 19.56610787, 19.47901088, 19.39320848, 20.02602313, 20.41885223, 20.65130639, 20.17029735, 19.25101601, 18.3702951 , 17.82187546, 17.35866845, 16.9465483 , 16.63608841, 16.34502176, 16.05844138, 16.20775625]) - hlb(time)float6497.53 97.06 96.61 ... 102.3 101.1
- long_name :
- latent heat flux into ocean
- units :
- W/m^2
array([ 97.53426162, 97.05701224, 96.61052161, 96.27318005, 96.20315362, 96.45867747, 98.22435112, 100.54614462, 103.20139265, 102.72247682, 102.42607769, 102.36136062, 104.06722292, 105.39906389, 106.42373538, 105.06333144, 102.79625436, 100.29873573, 94.90168748, 89.97675144, 85.28383662, 81.8356209 , 78.52907027, 75.35352054, 77.29722487, 79.30059623, 81.32970337, 85.44993486, 89.36255782, 93.08198627, 103.53447369, 115.68787448, 129.41266544, 130.03305331, 130.70483839, 131.39570273, 131.14008583, 130.30630544, 129.09568798, 127.22927191, 124.26305872, 121.40403174, 117.69011924, 114.23387151, 110.94833928, 107.99855735, 105.1423953 , 102.34083857, 101.13708252]) - hlwebb(time)float642.531 2.516 2.5 ... 3.135 3.137
- long_name :
- Webb correction for latent heat flux
array([2.53096027, 2.5158328 , 2.50026515, 2.42286965, 2.35926438, 2.31208026, 2.335369 , 2.3876034 , 2.45745662, 2.43801846, 2.42799847, 2.43018294, 2.57236965, 2.69497861, 2.80145318, 2.79677527, 2.73907703, 2.66715343, 2.46216592, 2.28613932, 2.12531796, 2.06308046, 2.0039111 , 1.94737525, 2.06970695, 2.19531852, 2.32245002, 2.43417914, 2.5396073 , 2.64020537, 2.94231114, 3.30688469, 3.72513142, 3.73656156, 3.75014156, 3.76408995, 3.84199819, 3.88668944, 3.90916031, 3.84021778, 3.70852209, 3.58190781, 3.48732847, 3.40473146, 3.32932001, 3.26204843, 3.19792243, 3.13477422, 3.13714107]) - hsb(time)float644.97 4.904 4.828 ... 8.634 8.871
- long_name :
- sensible heat flux into ocean
- units :
- W/m^2
array([ 4.97005866, 4.90406307, 4.82848333, 4.22526445, 3.69614927, 3.25528478, 3.04297506, 2.9902546 , 3.03218913, 2.81515664, 2.65229552, 2.55782665, 3.36398998, 4.0525619 , 4.64488293, 4.87238976, 4.80365366, 4.65244524, 3.93007667, 3.36441242, 2.88069066, 2.9191838 , 2.9618464 , 3.00657431, 3.72549303, 4.46262685, 5.20885787, 5.51003437, 5.80318732, 6.09814378, 7.17122109, 8.57654806, 10.28279067, 10.13452537, 9.99665456, 9.85867283, 10.51094286, 10.96516937, 11.28634623, 10.94010552, 10.23540407, 9.56151509, 9.28261347, 9.07022627, 8.89653675, 8.800407 , 8.71686166, 8.63382497, 8.87148042]) - hsbb(time)float6410.89 10.79 10.69 ... 14.84 15.01
- long_name :
- buoyancy flux measured directly by sonic anemometer
array([10.8852616 , 10.79019619, 10.68741322, 10.06482647, 9.53255313, 9.10828289, 9.00411444, 9.09332733, 9.29748642, 9.05287344, 8.87350369, 8.77659296, 9.68559056, 10.45425326, 11.10799017, 11.25219515, 11.04512454, 10.74162095, 9.69231564, 8.82830203, 8.06024754, 7.88912334, 7.73078823, 7.58248944, 8.41813888, 9.27555925, 10.14357082, 10.69452744, 11.22484395, 11.74522344, 13.45107622, 15.59205146, 18.1288956 , 18.0199468 , 17.92452624, 17.83016985, 18.46617391, 18.86906815, 19.11606702, 18.65715115, 17.77304684, 16.9262328 , 16.42199645, 15.99990743, 15.62687428, 15.35155047, 15.09450371, 14.84129115, 15.00508808]) - huss(time)float640.01294 0.01295 ... 0.0134 0.01341
array([0.01293812, 0.01294743, 0.01295674, 0.01293129, 0.01290584, 0.0128804 , 0.01293936, 0.01299833, 0.01305729, 0.01313577, 0.01321424, 0.01329271, 0.01337977, 0.01346683, 0.01355389, 0.0135461 , 0.01353831, 0.01353052, 0.01348725, 0.01344398, 0.01340071, 0.01344212, 0.01348353, 0.01352493, 0.01351916, 0.01351339, 0.01350762, 0.01345042, 0.01339322, 0.01333601, 0.01316302, 0.01299002, 0.01281702, 0.01286981, 0.0129226 , 0.0129754 , 0.01301624, 0.01305708, 0.01309792, 0.01312503, 0.01315213, 0.01317924, 0.01323116, 0.01328308, 0.013335 , 0.01335771, 0.01338043, 0.01340314, 0.01340693]) - lat(time)float64-97.53 -97.06 ... -102.3 -101.1
array([ -97.53426162, -97.05701224, -96.61052161, -96.27318005, -96.20315362, -96.45867747, -98.22435112, -100.54614462, -103.20139265, -102.72247682, -102.42607769, -102.36136062, -104.06722292, -105.39906389, -106.42373538, -105.06333144, -102.79625436, -100.29873573, -94.90168748, -89.97675144, -85.28383662, -81.8356209 , -78.52907027, -75.35352054, -77.29722487, -79.30059623, -81.32970337, -85.44993486, -89.36255782, -93.08198627, -103.53447369, -115.68787448, -129.41266544, -130.03305331, -130.70483839, -131.39570273, -131.14008583, -130.30630544, -129.09568798, -127.22927191, -124.26305872, -121.40403174, -117.69011924, -114.23387151, -110.94833928, -107.99855735, -105.1423953 , -102.34083857, -101.13708252]) - long(time)float64-35.87 -40.65 ... -42.57 -42.95
array([-35.87197644, -40.64674129, -45.41283275, -47.10360469, -48.83650035, -50.62259089, -50.95317683, -51.3938232 , -51.89651547, -56.0027381 , -60.14238143, -64.32388207, -63.29750351, -62.18048348, -60.98981355, -56.61701849, -52.0777119 , -47.48970993, -42.85905514, -38.29026865, -33.74501578, -35.31019413, -36.88330583, -38.463226 , -38.84507447, -39.21819033, -39.57478824, -42.2567483 , -44.94101731, -47.63523261, -54.38904392, -61.26123382, -68.20825772, -68.65083703, -69.09966237, -69.54913896, -66.66851159, -63.68611237, -60.6351548 , -59.36634055, -57.90055426, -56.44506947, -52.96148794, -49.51274801, -46.08419669, -44.90473837, -43.73392385, -42.56500387, -42.9462278 ]) - netflux(time)float64-138.4 -142.6 ... -153.5 -153.0
array([-138.37629671, -142.6078166 , -146.85183769, -120.81793232, -95.16756951, -69.98420255, 82.71125757, 234.58094815, 385.9604833 , 477.40602193, 568.58145178, 659.41495001, 535.30230135, 411.77190691, 288.71858274, 147.72193739, 8.09471965, -131.17088884, -127.51081791, -124.54143181, -121.90954306, -120.06499883, -118.3742225 , -116.82332085, -119.86779236, -122.98141341, -126.11334949, -103.66882333, -81.01097404, -58.17168005, 103.06426189, 262.14866222, 419.28592274, 484.45673818, 549.55951588, 614.64267399, 497.58264837, 381.40060159, 265.79699989, 121.5287386 , -21.08429278, -163.84562435, -164.22422601, -164.96184847, -165.92907271, -161.70370272, -157.59318081, -153.53966741, -152.95479074]) - nonlocal_flux(depth, time)float640.0 0.0 0.0 0.0 ... 0.0 0.0 0.0 0.0
array([[ 0.00000000e+00, 0.00000000e+00, 0.00000000e+00, 0.00000000e+00, 0.00000000e+00, 0.00000000e+00, 0.00000000e+00, 0.00000000e+00, 0.00000000e+00, 0.00000000e+00, 0.00000000e+00, 0.00000000e+00, 0.00000000e+00, 0.00000000e+00, 0.00000000e+00, 0.00000000e+00, 0.00000000e+00, 0.00000000e+00, 0.00000000e+00, 0.00000000e+00, 0.00000000e+00, 0.00000000e+00, 0.00000000e+00, 0.00000000e+00, 0.00000000e+00, 0.00000000e+00, 0.00000000e+00, 0.00000000e+00, 0.00000000e+00, 0.00000000e+00, 0.00000000e+00, 0.00000000e+00, 0.00000000e+00, 0.00000000e+00, 0.00000000e+00, 0.00000000e+00, 0.00000000e+00, 0.00000000e+00, 0.00000000e+00, 0.00000000e+00, 0.00000000e+00, 0.00000000e+00, 0.00000000e+00, 0.00000000e+00, 0.00000000e+00, 0.00000000e+00, 0.00000000e+00, 0.00000000e+00, 0.00000000e+00], [ 8.07951868e+01, 8.21706399e+01, 8.30752834e+01, 7.18424179e+01, 6.02324336e+01, 4.92549291e+01, -0.00000000e+00, -0.00000000e+00, -0.00000000e+00, ... 0.00000000e+00, 0.00000000e+00, 0.00000000e+00, 0.00000000e+00, 0.00000000e+00, 0.00000000e+00, 0.00000000e+00], [ 0.00000000e+00, 0.00000000e+00, 0.00000000e+00, 0.00000000e+00, 0.00000000e+00, 0.00000000e+00, -0.00000000e+00, -0.00000000e+00, -0.00000000e+00, -0.00000000e+00, -0.00000000e+00, -0.00000000e+00, -0.00000000e+00, -0.00000000e+00, -0.00000000e+00, -0.00000000e+00, 0.00000000e+00, 0.00000000e+00, 0.00000000e+00, 0.00000000e+00, 0.00000000e+00, 0.00000000e+00, 0.00000000e+00, 0.00000000e+00, 0.00000000e+00, 0.00000000e+00, 0.00000000e+00, 0.00000000e+00, 0.00000000e+00, 0.00000000e+00, -0.00000000e+00, -0.00000000e+00, -0.00000000e+00, -0.00000000e+00, -0.00000000e+00, -0.00000000e+00, -0.00000000e+00, -0.00000000e+00, -0.00000000e+00, -0.00000000e+00, 0.00000000e+00, 0.00000000e+00, 0.00000000e+00, 0.00000000e+00, 0.00000000e+00, 0.00000000e+00, 0.00000000e+00, 0.00000000e+00, 0.00000000e+00]]) - prra(time)float641.427e-07 8.867e-08 ... 1.07e-07
array([1.42681783e-07, 8.86749195e-08, 3.46680561e-08, 2.31120374e-08, 1.15560187e-08, 0.00000000e+00, 0.00000000e+00, 0.00000000e+00, 0.00000000e+00, 0.00000000e+00, 0.00000000e+00, 0.00000000e+00, 0.00000000e+00, 0.00000000e+00, 0.00000000e+00, 4.14603970e-08, 8.29207941e-08, 1.24381191e-07, 1.46163598e-07, 1.67946005e-07, 1.89728412e-07, 1.94612523e-07, 1.99496635e-07, 2.04380746e-07, 2.02255923e-07, 2.00131099e-07, 1.98006276e-07, 1.32004184e-07, 6.60020920e-08, 0.00000000e+00, 0.00000000e+00, 0.00000000e+00, 0.00000000e+00, 0.00000000e+00, 0.00000000e+00, 0.00000000e+00, 1.86585962e-09, 3.73171925e-09, 5.59757887e-09, 2.21007266e-08, 3.86038743e-08, 5.51070220e-08, 7.33474761e-08, 9.15879301e-08, 1.09828384e-07, 1.06700165e-07, 1.03571946e-07, 1.00443727e-07, 1.06992645e-07]) - psl(time)float641.014e+05 1.014e+05 ... 1.013e+05
array([101435.86483658, 101370.90194346, 101305.93905034, 101303.24799616, 101300.55694198, 101297.8658878 , 101336.10285584, 101374.33982388, 101412.57679192, 101404.04187026, 101395.50694859, 101386.97202693, 101300.57817915, 101214.18433136, 101127.79048358, 101119.13911613, 101110.48774868, 101101.83638122, 101156.06769745, 101210.29901367, 101264.53032989, 101279.02773664, 101293.5251434 , 101308.02255015, 101250.13117004, 101192.23978992, 101134.34840981, 101151.87751801, 101169.40662621, 101186.9357344 , 101253.46300596, 101319.99027752, 101386.51754907, 101377.89824506, 101369.27894104, 101360.65963703, 101281.50104349, 101202.34244996, 101123.18385642, 101130.70069269, 101138.21752895, 101145.73436522, 101204.53292145, 101263.33147767, 101322.1300339 , 101341.80176941, 101361.47350492, 101381.14524043, 101317.13254286]) - qsr(time)float64-0.1732 -0.1729 ... -0.1714 -0.1731
- long_name :
- specific humidity scaling parameter
- units :
- g/kg
array([-0.17318448, -0.1728664 , -0.1724121 , -0.17285406, -0.17357255, -0.17466174, -0.16995853, -0.16630561, -0.1632737 , -0.16198118, -0.16095428, -0.16026017, -0.15817016, -0.15530655, -0.15184908, -0.15332879, -0.15359248, -0.15350053, -0.15823417, -0.16364911, -0.16931485, -0.16857067, -0.16792958, -0.16738571, -0.16878478, -0.17003629, -0.17108024, -0.17259512, -0.17336998, -0.17351093, -0.17476465, -0.17647113, -0.17846607, -0.17776342, -0.17711169, -0.17647019, -0.17786505, -0.17852088, -0.17867009, -0.177965 , -0.17576844, -0.17362226, -0.17181287, -0.17025365, -0.16883902, -0.16960039, -0.17046861, -0.17139059, -0.17311854]) - rhoa(time)float641.2 1.2 1.2 1.2 ... 1.2 1.2 1.2 1.2
- long_name :
- density of air
- units :
- kg/mɡ^3
array([1.2, 1.2, 1.2, 1.2, 1.2, 1.2, 1.2, 1.2, 1.2, 1.2, 1.2, 1.2, 1.2, 1.2, 1.2, 1.2, 1.2, 1.2, 1.2, 1.2, 1.2, 1.2, 1.2, 1.2, 1.2, 1.2, 1.2, 1.2, 1.2, 1.2, 1.2, 1.2, 1.2, 1.2, 1.2, 1.2, 1.2, 1.2, 1.2, 1.2, 1.2, 1.2, 1.2, 1.2, 1.2, 1.2, 1.2, 1.2, 1.2]) - rlds(time)float64401.1 396.1 391.1 ... 396.7 396.3
array([401.1361347 , 396.13917278, 391.14221086, 389.33100125, 387.51979165, 385.70858204, 385.45306842, 385.19755479, 384.94204117, 380.98775264, 377.03346411, 373.07917557, 374.37869184, 375.6782081 , 376.97772436, 381.47489625, 385.97206813, 390.46924001, 395.16376522, 399.85829043, 404.55281564, 402.97029661, 401.38777757, 399.80525854, 399.45624754, 399.10723655, 398.75822555, 396.00018474, 393.24214392, 390.48410311, 383.56105337, 376.63800364, 369.7149539 , 369.52190068, 369.32884746, 369.13579424, 372.33479174, 375.53378925, 378.73278675, 380.01075234, 381.28871794, 382.56668354, 386.06394953, 389.56121553, 393.05848153, 394.25955587, 395.46063022, 396.66170457, 396.25764284]) - rsds(time)float640.0 0.0 0.0 29.76 ... 0.0 0.0 0.0
array([0.00000000e+00, 0.00000000e+00, 0.00000000e+00, 2.97601299e+01, 5.95202597e+01, 8.92803896e+01, 2.61035290e+02, 4.32790190e+02, 6.04545090e+02, 7.09940437e+02, 8.15335785e+02, 9.20731133e+02, 7.84478909e+02, 6.48226685e+02, 5.11974461e+02, 3.49194086e+02, 1.86413711e+02, 2.36333356e+01, 1.57555571e+01, 7.87777854e+00, 0.00000000e+00, 0.00000000e+00, 0.00000000e+00, 0.00000000e+00, 0.00000000e+00, 0.00000000e+00, 0.00000000e+00, 3.28309936e+01, 6.56619871e+01, 9.84929807e+01, 2.97954445e+02, 4.97415910e+02, 6.96877374e+02, 7.70305727e+02, 8.43734079e+02, 9.17162432e+02, 7.84335765e+02, 6.51509099e+02, 5.18682432e+02, 3.54516063e+02, 1.90349694e+02, 2.61833244e+01, 1.74555496e+01, 8.72777480e+00, 3.55271368e-15, 0.00000000e+00, 0.00000000e+00, 0.00000000e+00, 0.00000000e+00]) - salt(depth, time)float3234.304375 34.30507 ... 34.393257
array([[34.304375, 34.30507 , 34.306175, 34.306824, 34.306316, 34.304443, 34.301487, 34.298412, 34.29562 , 34.293484, 34.2918 , 34.290226, 34.288616, 34.286987, 34.285446, 34.283997, 34.283512, 34.284637, 34.28462 , 34.283768, 34.2826 , 34.281082, 34.279453, 34.27775 , 34.276142, 34.274765, 34.273743, 34.27298 , 34.27227 , 34.27145 , 34.270607, 34.269913, 34.268925, 34.26808 , 34.26734 , 34.266766, 34.266197, 34.265583, 34.264847, 34.264084, 34.26412 , 34.265594, 34.26614 , 34.266323, 34.26627 , 34.26587 , 34.265335, 34.264805, 34.26446 ], [34.304523, 34.30518 , 34.30624 , 34.3069 , 34.306427, 34.304577, 34.301537, 34.298206, 34.29545 , 34.293377, 34.291687, 34.290104, 34.288513, 34.286842, 34.28534 , 34.283974, 34.284172, 34.28512 , 34.28494 , 34.28406 , 34.282894, 34.28136 , 34.279724, 34.27799 , 34.276337, 34.274944, 34.273933, 34.273182, 34.2725 , 34.271717, 34.270786, 34.26979 , 34.26876 , 34.267845, 34.267036, 34.266376, 34.265705, 34.265053, 34.264328, 34.26371 , 34.26452 , 34.265865, 34.266277, 34.266476, 34.26642 , 34.26603 , 34.2655 , 34.264965, 34.264603], [34.304813, 34.30545 , 34.30647 , 34.30713 , 34.306683, 34.30486 , 34.30183 , 34.298386, 34.295757, 34.293835, 34.29232 , 34.290874, ... 34.37804 , 34.376667, 34.375114, 34.373474, 34.37179 , 34.370083, 34.368347], [34.36846 , 34.369194, 34.370125, 34.370945, 34.371605, 34.372326, 34.37324 , 34.37439 , 34.37576 , 34.37733 , 34.379074, 34.38094 , 34.382877, 34.384834, 34.38673 , 34.388493, 34.390076, 34.391457, 34.392647, 34.393665, 34.394566, 34.39539 , 34.39614 , 34.39683 , 34.397457, 34.397984, 34.398376, 34.398598, 34.398598, 34.398354, 34.397903, 34.397312, 34.396603, 34.395794, 34.39496 , 34.39417 , 34.39345 , 34.392796, 34.392162, 34.391525, 34.390873, 34.390205, 34.389404, 34.388424, 34.38723 , 34.385868, 34.384365, 34.38277 , 34.381104], [34.37557 , 34.376118, 34.377 , 34.377914, 34.378727, 34.379513, 34.380398, 34.381435, 34.382645, 34.38404 , 34.385612, 34.38734 , 34.38917 , 34.391064, 34.39293 , 34.3947 , 34.396313, 34.397755, 34.39904 , 34.40019 , 34.401257, 34.402264, 34.403206, 34.40409 , 34.40491 , 34.405643, 34.406258, 34.40672 , 34.406975, 34.407 , 34.406822, 34.40648 , 34.405983, 34.405342, 34.404625, 34.403923, 34.40327 , 34.40267 , 34.402107, 34.401546, 34.400986, 34.400448, 34.39988 , 34.399208, 34.398357, 34.397324, 34.396103, 34.394737, 34.393257]], dtype=float32) - sens(time)float64-4.97 -4.904 ... -8.634 -8.871
array([ -4.97005866, -4.90406307, -4.82848333, -4.22526445, -3.69614927, -3.25528478, -3.04297506, -2.9902546 , -3.03218913, -2.81515664, -2.65229552, -2.55782665, -3.36398998, -4.0525619 , -4.64488293, -4.87238976, -4.80365366, -4.65244524, -3.93007667, -3.36441242, -2.88069066, -2.9191838 , -2.9618464 , -3.00657431, -3.72549303, -4.46262685, -5.20885787, -5.51003437, -5.80318732, -6.09814378, -7.17122109, -8.57654806, -10.28279067, -10.13452537, -9.99665456, -9.85867283, -10.51094286, -10.96516937, -11.28634623, -10.94010552, -10.23540407, -9.56151509, -9.28261347, -9.07022627, -8.89653675, -8.800407 , -8.71686166, -8.63382497, -8.87148042]) - short(time)float640.0 0.0 0.0 26.78 ... 0.0 0.0 0.0
array([0.00000000e+00, 0.00000000e+00, 0.00000000e+00, 2.67841169e+01, 5.35682337e+01, 8.03523506e+01, 2.34931761e+02, 3.89511171e+02, 5.44090581e+02, 6.38946393e+02, 7.33802206e+02, 8.28658019e+02, 7.06031018e+02, 5.83404016e+02, 4.60777015e+02, 3.14274677e+02, 1.67772340e+02, 2.12700021e+01, 1.41800014e+01, 7.09000069e+00, 0.00000000e+00, 0.00000000e+00, 0.00000000e+00, 0.00000000e+00, 0.00000000e+00, 0.00000000e+00, 0.00000000e+00, 2.95478942e+01, 5.90957884e+01, 8.86436826e+01, 2.68159001e+02, 4.47674319e+02, 6.27189637e+02, 6.93275154e+02, 7.59360671e+02, 8.25446189e+02, 7.05902189e+02, 5.86358189e+02, 4.66814189e+02, 3.19064457e+02, 1.71314724e+02, 2.35649920e+01, 1.57099946e+01, 7.85499732e+00, 3.19744231e-15, 0.00000000e+00, 0.00000000e+00, 0.00000000e+00, 0.00000000e+00]) - stress(time)float640.04198 0.04172 ... 0.04716 0.04512
- long_name :
- wind stress
- units :
- N/m^2
array([0.04198091, 0.04172435, 0.04156039, 0.0410682 , 0.04067714, 0.04039125, 0.04425871, 0.04845614, 0.05298084, 0.05333781, 0.05371458, 0.05411615, 0.05741921, 0.06109137, 0.06515861, 0.06226898, 0.05939766, 0.05660756, 0.0476707 , 0.04003918, 0.03358091, 0.0311814 , 0.02891922, 0.02678752, 0.02771309, 0.02873263, 0.02984756, 0.03238474, 0.03511557, 0.03805144, 0.04643555, 0.05689235, 0.06964122, 0.07087617, 0.07214689, 0.0734512 , 0.07200428, 0.07055564, 0.06912306, 0.06767138, 0.06618297, 0.06475058, 0.06213227, 0.05960679, 0.05716598, 0.05366529, 0.05033099, 0.04715617, 0.04512139]) - tas(time)float64295.8 295.8 295.8 ... 295.8 295.8
array([295.80229387, 295.79596817, 295.78964248, 295.84487427, 295.90010607, 295.95533786, 296.00510904, 296.05488022, 296.1046514 , 296.17560119, 296.24655097, 296.31750076, 296.27990675, 296.24231275, 296.20471874, 296.17293618, 296.14115361, 296.10937105, 296.14638594, 296.18340084, 296.22041573, 296.20871536, 296.19701499, 296.18531462, 296.10311897, 296.02092332, 295.93872767, 295.92636378, 295.91399989, 295.90163601, 295.83784883, 295.77406164, 295.71027446, 295.7741647 , 295.83805493, 295.90194517, 295.87374367, 295.84554218, 295.81734068, 295.83742736, 295.85751404, 295.87760072, 295.87602084, 295.87444095, 295.87286107, 295.86135973, 295.84985839, 295.83835705, 295.7976096 ]) - tau(time)float640.04198 0.04172 ... 0.04716 0.04512
- long_name :
- wind stress
- units :
- N/m^2
array([0.04198091, 0.04172435, 0.04156039, 0.0410682 , 0.04067714, 0.04039125, 0.04425871, 0.04845614, 0.05298084, 0.05333781, 0.05371458, 0.05411615, 0.05741921, 0.06109137, 0.06515861, 0.06226898, 0.05939766, 0.05660756, 0.0476707 , 0.04003918, 0.03358091, 0.0311814 , 0.02891922, 0.02678752, 0.02771309, 0.02873263, 0.02984756, 0.03238474, 0.03511557, 0.03805144, 0.04643555, 0.05689235, 0.06964122, 0.07087617, 0.07214689, 0.0734512 , 0.07200428, 0.07055564, 0.06912306, 0.06767138, 0.06618297, 0.06475058, 0.06213227, 0.05960679, 0.05716598, 0.05366529, 0.05033099, 0.04715617, 0.04512139]) - taux(time)float64-0.0117 -0.01035 ... -0.01311
array([-1.17038309e-02, -1.03540037e-02, -9.02433949e-03, -7.71300375e-03, -6.43112361e-03, -5.17373288e-03, -5.96597108e-03, -6.83126193e-03, -7.77182207e-03, -7.63170970e-03, -7.49298362e-03, -7.35613371e-03, -5.23307235e-03, -2.94963496e-03, -4.86367053e-04, -4.35828778e-05, 3.76089372e-04, 7.72443363e-04, 2.57030821e-03, 4.02395083e-03, 5.19198247e-03, 4.67992774e-03, 4.19991211e-03, 3.75022489e-03, 2.86736341e-03, 1.94948697e-03, 9.92316055e-04, 2.80739014e-04, -4.96369210e-04, -1.34396061e-03, -5.50018350e-03, -1.06839455e-02, -1.71113452e-02, -1.81014793e-02, -1.91127855e-02, -2.01451529e-02, -2.05955647e-02, -2.10234201e-02, -2.14332781e-02, -2.00997638e-02, -1.87754526e-02, -1.74880675e-02, -1.69217741e-02, -1.63736619e-02, -1.58417665e-02, -1.50883689e-02, -1.43652840e-02, -1.36712821e-02, -1.31143426e-02]) - tauy(time)float640.04032 0.04042 ... 0.04513 0.04317
array([0.04031646, 0.04041925, 0.0405688 , 0.04033741, 0.04016554, 0.04005853, 0.04385476, 0.04797219, 0.05240771, 0.052789 , 0.05318939, 0.05361385, 0.05718025, 0.06102012, 0.0651568 , 0.06226896, 0.05939647, 0.05660229, 0.04760136, 0.03983646, 0.03317711, 0.0308282 , 0.02861262, 0.02652371, 0.02756435, 0.02866642, 0.02983106, 0.03238353, 0.03511207, 0.0380277 , 0.04610866, 0.05588016, 0.06750631, 0.06852567, 0.06956921, 0.07063463, 0.06899594, 0.06735068, 0.06571615, 0.06461746, 0.06346391, 0.06234424, 0.05978355, 0.05731381, 0.05492712, 0.05150053, 0.04823741, 0.04513092, 0.04317353]) - theta(depth, time)float3223.32442 23.311815 ... 22.730448
array([[23.32442 , 23.311815, 23.297695, 23.286165, 23.28199 , 23.287088, 23.301512, 23.33514 , 23.379576, 23.426735, 23.479677, 23.539892, 23.580627, 23.605583, 23.617748, 23.615904, 23.585098, 23.545832, 23.53245 , 23.529808, 23.531279, 23.536522, 23.543144, 23.550962, 23.558516, 23.564507, 23.567654, 23.568808, 23.570383, 23.573677, 23.580366, 23.607635, 23.647924, 23.6923 , 23.73774 , 23.783274, 23.82187 , 23.842802, 23.851841, 23.846764, 23.807524, 23.770063, 23.754213, 23.744402, 23.738132, 23.735636, 23.73463 , 23.733946, 23.732092], [23.325138, 23.312735, 23.298834, 23.287453, 23.28335 , 23.28846 , 23.302916, 23.329807, 23.365591, 23.404198, 23.443287, 23.487436, 23.535751, 23.57067 , 23.58683 , 23.595093, 23.570824, 23.541338, 23.530281, 23.528118, 23.52964 , 23.534935, 23.541428, 23.54912 , 23.556597, 23.562527, 23.565632, 23.567228, 23.56939 , 23.573128, 23.580128, 23.59977 , 23.630566, 23.668558, 23.709692, 23.749931, 23.7892 , 23.811125, 23.827847, 23.832233, 23.79829 , 23.7679 , 23.753963, 23.744274, 23.738194, 23.735685, 23.734648, 23.733955, 23.732199], [23.323046, 23.310766, 23.297026, 23.285873, 23.281973, 23.287148, 23.302122, 23.326279, 23.35318 , 23.384237, 23.415852, 23.450562, ... 22.829266, 22.839138, 22.850517, 22.862776, 22.875568, 22.888662, 22.90204 ], [22.884298, 22.878878, 22.871994, 22.865688, 22.86034 , 22.854652, 22.84783 , 22.839722, 22.830458, 22.820219, 22.809141, 22.797462, 22.785378, 22.772984, 22.760826, 22.74937 , 22.738914, 22.729534, 22.721329, 22.714281, 22.708008, 22.702297, 22.697159, 22.692518, 22.688421, 22.685038, 22.682507, 22.681137, 22.681236, 22.682962, 22.686243, 22.690777, 22.696398, 22.702879, 22.709673, 22.716248, 22.722322, 22.727812, 22.732922, 22.737877, 22.742693, 22.747385, 22.752886, 22.759718, 22.768131, 22.777895, 22.788782, 22.800459, 22.812754], [22.836357, 22.832333, 22.826075, 22.81944 , 22.81345 , 22.807592, 22.801231, 22.794083, 22.786074, 22.777143, 22.76724 , 22.756538, 22.745195, 22.733282, 22.721388, 22.710007, 22.69947 , 22.689873, 22.681213, 22.673445, 22.66624 , 22.659458, 22.653149, 22.647282, 22.641905, 22.637157, 22.633196, 22.630262, 22.628685, 22.628622, 22.630026, 22.632772, 22.636784, 22.641928, 22.647686, 22.653461, 22.658886, 22.663795, 22.668314, 22.672623, 22.676708, 22.680449, 22.684309, 22.688877, 22.694693, 22.701845, 22.710339, 22.719936, 22.730448]], dtype=float32) - tkt(time)float640.0009061 0.0009081 ... 0.0008741
- long_name :
- cool-skin thickness
- units :
- m
array([0.00090609, 0.00090806, 0.00090913, 0.00091416, 0.00091817, 0.00092103, 0.00088377, 0.00084772, 0.00081319, 0.00081055, 0.00080776, 0.00080477, 0.00078228, 0.00075948, 0.00073648, 0.00075258, 0.00076981, 0.00078777, 0.00085456, 0.00092727, 0.00100578, 0.00103995, 0.00107544, 0.0011123 , 0.00109484, 0.00107662, 0.00105782, 0.00101901, 0.00098177, 0.00094605, 0.00086229, 0.00078337, 0.00071122, 0.00070535, 0.00069946, 0.00069356, 0.00070008, 0.00070685, 0.00071379, 0.00072105, 0.00072886, 0.00073661, 0.0007515 , 0.00076674, 0.00078239, 0.00080611, 0.00083082, 0.00085656, 0.00087407]) - tsr(time)float64-0.02195 -0.02173 ... -0.03777
- long_name :
- temperature scaling parameter
- units :
- K
array([-0.02195266, -0.0217277 , -0.02143522, -0.01887131, -0.01658881, -0.01466288, -0.01309773, -0.01230336, -0.01193331, -0.01104271, -0.01036783, -0.00996173, -0.0127186 , -0.01485445, -0.01648627, -0.0176884 , -0.01785411, -0.01771208, -0.01630051, -0.01522182, -0.01422653, -0.01495805, -0.01575554, -0.01661348, -0.02023611, -0.02380289, -0.02725631, -0.02768503, -0.0280065 , -0.02827697, -0.03011173, -0.0325441 , -0.03527474, -0.03446402, -0.03369645, -0.03293689, -0.03546262, -0.03736912, -0.03885684, -0.03806651, -0.03601453, -0.03401519, -0.03371009, -0.03362742, -0.03367805, -0.0343784 , -0.0351561 , -0.03596791, -0.03777489]) - u(depth, time)float32-0.29970324 ... -0.17791136
array([[-0.29970324, -0.30042994, -0.29731956, -0.29159927, -0.28569713, -0.2800854 , -0.2780183 , -0.2819269 , -0.2865336 , -0.29120618, -0.29538393, -0.29796058, -0.29581553, -0.29031193, -0.28181726, -0.2722131 , -0.26101816, -0.24958327, -0.24148843, -0.23517378, -0.23002194, -0.22643532, -0.22415654, -0.22272499, -0.2221163 , -0.22216345, -0.22237633, -0.22255851, -0.22289203, -0.22372611, -0.2269333 , -0.23441578, -0.24402754, -0.25439912, -0.2647126 , -0.27495226, -0.28592247, -0.29636323, -0.3060821 , -0.3129791 , -0.31051233, -0.30982623, -0.31305066, -0.31742406, -0.32222524, -0.32752323, -0.33291698, -0.33832425, -0.34343037], [-0.29479495, -0.2958479 , -0.29313272, -0.28790715, -0.28244054, -0.27716038, -0.2746622 , -0.27747208, -0.28228337, -0.2865642 , -0.28969982, -0.2912745 , -0.29079944, -0.28680366, -0.27915323, -0.27031857, -0.25888133, -0.24837805, -0.2410642 , -0.23534812, -0.23074575, -0.22735417, -0.22509234, -0.22364749, -0.22287574, -0.22261265, -0.22244273, -0.22231148, -0.22238588, -0.22297779, -0.2249912 , -0.22975868, -0.23714662, -0.24651793, -0.25653538, -0.26619667, -0.2765639 , -0.28532553, -0.29466236, -0.3025113 , -0.30296564, -0.30463034, -0.3084838 , -0.31301644, -0.3179122 , -0.32329944, -0.32877693, -0.33426172, -0.33944064], ... -0.01697488, -0.01538576, -0.01380437, -0.01277003, -0.01228315, -0.01219699, -0.01219294, -0.01202796, -0.0114964 , -0.01043678, -0.00892252, -0.00739646, -0.00612997, -0.00542072, -0.00538705, -0.00614998, -0.00770729, -0.01012177, -0.01323581, -0.01676193, -0.02045995, -0.02408146, -0.02765717, -0.03133487, -0.03542079, -0.0402964 , -0.04633637, -0.05368246, -0.0622587 , -0.0718034 , -0.08187602, -0.09202146, -0.10195538, -0.11148504, -0.12051363, -0.12900528, -0.1371216 , -0.14515054, -0.15330802, -0.16186967, -0.17090549, -0.18007095, -0.18898992, -0.19733156], [ 0.0120109 , 0.01018451, 0.00917421, 0.00882959, 0.00903297, 0.00988296, 0.01114115, 0.01229846, 0.01283955, 0.01281724, 0.01242878, 0.01201824, 0.01183517, 0.01207781, 0.01288789, 0.01417484, 0.01548436, 0.01655205, 0.01712439, 0.01708467, 0.01629302, 0.01472264, 0.01228162, 0.00911619, 0.00551803, 0.00173792, -0.00196579, -0.00561483, -0.00935186, -0.01347853, -0.01837957, -0.02444135, -0.03182537, -0.04047889, -0.05014048, -0.06035471, -0.07065661, -0.08075769, -0.09046758, -0.09969017, -0.10838812, -0.11668446, -0.12478047, -0.13295244, -0.14155711, -0.15071009, -0.16007672, -0.16926211, -0.17791136]], dtype=float32) - uas(time)float64-1.606 -1.426 ... -1.746 -1.715
array([-1.60579191, -1.42568039, -1.24556887, -1.07303 , -0.90049114, -0.72795228, -0.7983267 , -0.86870111, -0.93907552, -0.91906685, -0.89905818, -0.87904951, -0.60336251, -0.32767551, -0.05198851, -0.00478211, 0.0424243 , 0.0896307 , 0.32950233, 0.56937396, 0.8092456 , 0.75881193, 0.70837825, 0.65794458, 0.493125 , 0.32830541, 0.16348583, 0.04427818, -0.07492947, -0.19413711, -0.71012036, -1.22610361, -1.74208686, -1.82441739, -1.90674792, -1.98907845, -2.05570129, -2.12232413, -2.18894697, -2.07930978, -1.96967259, -1.8600354 , -1.84439915, -1.8287629 , -1.81312665, -1.79068179, -1.76823693, -1.74579207, -1.71546924]) - usr(time)float640.1877 0.1872 ... 0.199 0.1947
- long_name :
- friction velocity that includes gustiness
- units :
- m/s
array([0.1877271 , 0.18715226, 0.18678218, 0.18565407, 0.18475109, 0.18408663, 0.19264376, 0.20152887, 0.21069202, 0.21138768, 0.21212251, 0.21290663, 0.21931491, 0.22621725, 0.23361734, 0.22840532, 0.22309307, 0.21780324, 0.19991823, 0.1832717 , 0.1678999 , 0.16182258, 0.15587698, 0.15005964, 0.15265441, 0.15545818, 0.15846308, 0.16502964, 0.17181475, 0.1788206 , 0.19747409, 0.21852087, 0.24171292, 0.24383167, 0.24599324, 0.24819244, 0.24576702, 0.24330731, 0.24084555, 0.23830392, 0.23565676, 0.23308078, 0.22833004, 0.22365428, 0.21904167, 0.21226082, 0.20559483, 0.19904017, 0.1947357 ]) - v(depth, time)float320.689187 0.6815233 ... -0.060036022
array([[ 6.89186990e-01, 6.81523323e-01, 6.72377884e-01, 6.64573312e-01, 6.60925746e-01, 6.63445234e-01, 6.77232921e-01, 7.07081258e-01, 7.28443623e-01, 7.46278048e-01, 7.64194906e-01, 7.80920804e-01, 7.89017916e-01, 7.98201919e-01, 8.06627274e-01, 8.07761669e-01, 7.79793441e-01, 7.46612132e-01, 7.32291043e-01, 7.23372519e-01, 7.14973390e-01, 7.07819819e-01, 7.01139867e-01, 6.94861829e-01, 6.88715339e-01, 6.81445479e-01, 6.73074901e-01, 6.64465606e-01, 6.56243503e-01, 6.49050117e-01, 6.49301946e-01, 6.62937999e-01, 6.71238542e-01, 6.77917182e-01, 6.83283091e-01, 6.85517609e-01, 6.88720882e-01, 6.88355923e-01, 6.85144842e-01, 6.75230443e-01, 6.31477058e-01, 5.93559921e-01, 5.74015260e-01, 5.60294151e-01, 5.49138129e-01, 5.39595306e-01, 5.31236649e-01, 5.23233652e-01, 5.15337884e-01], [ 6.76013112e-01, 6.68096483e-01, 6.59020364e-01, 6.51161075e-01, 6.47409141e-01, 6.49782717e-01, 6.59323752e-01, 6.80273116e-01, 7.03368604e-01, ... 8.80756136e-03, 4.30638436e-04, -6.94904150e-03, -1.33294817e-02, -1.87559165e-02, -2.33185645e-02, -2.73058675e-02], [ 3.17209899e-01, 3.08401883e-01, 2.99514323e-01, 2.91441590e-01, 2.84709573e-01, 2.78939277e-01, 2.73913741e-01, 2.69659042e-01, 2.66017288e-01, 2.62497485e-01, 2.58774996e-01, 2.54640222e-01, 2.49786988e-01, 2.43808582e-01, 2.36660451e-01, 2.28760421e-01, 2.20600754e-01, 2.12432548e-01, 2.04353631e-01, 1.96239486e-01, 1.87956691e-01, 1.79346666e-01, 1.70248881e-01, 1.60660207e-01, 1.50640473e-01, 1.40472412e-01, 1.30303398e-01, 1.20134398e-01, 1.09973587e-01, 9.98176336e-02, 8.98451954e-02, 8.02347958e-02, 7.10794851e-02, 6.23874888e-02, 5.41236773e-02, 4.60885651e-02, 3.78658548e-02, 2.91596428e-02, 2.00708266e-02, 1.06733702e-02, 1.09969790e-03, -8.69798940e-03, -1.83887538e-02, -2.75938101e-02, -3.59613486e-02, -4.33705971e-02, -4.97779697e-02, -5.52366227e-02, -6.00360222e-02]], dtype=float32) - vas(time)float645.532 5.565 5.599 ... 5.763 5.647
array([5.53150962, 5.56547376, 5.5994379 , 5.6117244 , 5.6240109 , 5.63629739, 5.86835354, 6.10040968, 6.33246583, 6.35724174, 6.38201765, 6.40679355, 6.59276528, 6.77873701, 6.96470874, 6.83242702, 6.70014529, 6.56786357, 6.10228674, 5.63670991, 5.17113308, 4.99854071, 4.82594835, 4.65335598, 4.74047728, 4.82759857, 4.91471986, 5.10753263, 5.30034541, 5.49315818, 5.95301939, 6.4128806 , 6.87274181, 6.90658597, 6.94043013, 6.97427429, 6.88667849, 6.79908268, 6.71148688, 6.68464116, 6.65779544, 6.63094971, 6.51614479, 6.40133987, 6.28653494, 6.1120625 , 5.93759005, 5.7631176 , 5.6474705 ]) - w(depth, time)float32-7.249771e-06 ... 4.057019e-05
array([[-7.24977099e-06, -4.32955585e-06, -9.94436164e-07, 1.11877659e-06, 1.03677075e-06, -4.65247268e-07, -1.82178348e-06, -2.63026027e-06, -3.08792937e-06, -2.42025794e-06, -1.34803565e-06, -4.23666705e-07, 4.02833820e-08, 3.05581892e-07, 7.08675998e-07, 3.53638342e-07, 3.46822986e-07, -5.27007330e-07, -5.51349217e-07, -9.24226242e-08, 2.04689741e-07, 3.12154285e-08, -7.20751075e-07, -1.21695132e-06, -1.31618242e-06, -9.74044610e-07, -1.52097343e-07, 6.27704367e-07, 1.83984093e-06, 3.16821320e-06, 4.68532699e-06, 4.74192257e-06, 3.97629447e-06, 3.21783978e-06, 2.42057854e-06, 1.46230798e-06, 7.45164982e-07, 9.26857808e-08, -3.47786823e-07, -7.39021971e-07, -3.59210304e-07, 2.40945496e-07, 9.54153052e-07, 1.86189641e-06, 1.43648106e-06, 6.38336360e-07, -4.02463797e-07, -1.36638153e-06, -1.78248308e-06], [-2.01624516e-05, -1.09755529e-05, -9.37549942e-07, 4.58143086e-06, 2.88060824e-06, -3.29548766e-06, -8.86092403e-06, -1.15688399e-05, -1.20408777e-05, ... 3.43506363e-05, 4.01676843e-05, 4.19446951e-05, 4.25219514e-05, 4.05179562e-05, 3.96964388e-05, 3.77437827e-05], [ 9.30968145e-06, 1.97531463e-05, 2.99135609e-05, 3.60792874e-05, 3.74639931e-05, 3.73932235e-05, 3.68038200e-05, 3.55623779e-05, 3.57417666e-05, 4.10914472e-05, 5.20144713e-05, 6.59002399e-05, 8.05775344e-05, 9.16733916e-05, 9.44296553e-05, 9.04050976e-05, 8.04592710e-05, 7.13467598e-05, 6.40433500e-05, 6.23501182e-05, 6.52817325e-05, 6.78949946e-05, 6.83628750e-05, 6.91736786e-05, 6.86059575e-05, 6.63087121e-05, 6.19724087e-05, 5.45243238e-05, 4.33979185e-05, 3.25504807e-05, 2.51126385e-05, 1.89029834e-05, 1.12049720e-05, 3.63181971e-06, 1.16270564e-06, 4.01943134e-06, 8.13309816e-06, 1.21633830e-05, 1.59463070e-05, 1.77979291e-05, 2.23955813e-05, 2.88375395e-05, 3.66321328e-05, 4.27867199e-05, 4.46780177e-05, 4.53303473e-05, 4.32920751e-05, 4.25321341e-05, 4.05701903e-05]], dtype=float32) - zet(time)float64-0.1997 -0.1998 ... -0.2233 -0.2407
- long_name :
- M
- units :
- o
array([-0.19965868, -0.19982265, -0.19919751, -0.1920799 , -0.1856098 , -0.18019475, -0.15593499, -0.13775005, -0.12329145, -0.11914997, -0.11579285, -0.11338606, -0.11339126, -0.11075764, -0.10629366, -0.11492515, -0.12103478, -0.12654889, -0.14835788, -0.1761299 , -0.20998145, -0.22906358, -0.25057966, -0.27484429, -0.28757769, -0.29806904, -0.30607894, -0.28561958, -0.26557756, -0.2464038 , -0.20906126, -0.17833749, -0.15277061, -0.1480246 , -0.14348396, -0.13905808, -0.14790318, -0.15543931, -0.16209442, -0.1634277 , -0.16128404, -0.15905404, -0.16414002, -0.17011294, -0.17678929, -0.19072757, -0.20622325, -0.22329898, -0.2406864 ]) - zoq(time)float640.0001268 0.0001276 ... 0.0001166
- long_name :
- moisture roughness len
- units :
- m
array([1.26760552e-04, 1.27635624e-04, 1.28199041e-04, 1.29944745e-04, 1.31359825e-04, 1.32413767e-04, 1.19444606e-04, 1.07337345e-04, 9.62242872e-05, 9.54480764e-05, 9.46373308e-05, 9.37825295e-05, 8.69834996e-05, 8.02881901e-05, 7.37772190e-05, 7.82900229e-05, 8.32276040e-05, 8.85123289e-05, 1.09490154e-04, 1.33787635e-04, 1.60000000e-04, 1.60000000e-04, 1.60000000e-04, 1.60000000e-04, 1.60000000e-04, 1.60000000e-04, 1.60000000e-04, 1.60000000e-04, 1.53377433e-04, 1.41172763e-04, 1.12800644e-04, 8.77941691e-05, 6.73636477e-05, 6.58143897e-05, 6.42795513e-05, 6.27637602e-05, 6.44560858e-05, 6.62277317e-05, 6.80597664e-05, 7.00191501e-05, 7.21265367e-05, 7.42520123e-05, 7.83838549e-05, 8.27245784e-05, 8.72894755e-05, 9.45483096e-05, 1.02360641e-04, 1.10740277e-04, 1.16638504e-04]) - zot(time)float640.0001268 0.0001276 ... 0.0001166
- long_name :
- thermal roughness len
- units :
- m
array([1.26760552e-04, 1.27635624e-04, 1.28199041e-04, 1.29944745e-04, 1.31359825e-04, 1.32413767e-04, 1.19444606e-04, 1.07337345e-04, 9.62242872e-05, 9.54480764e-05, 9.46373308e-05, 9.37825295e-05, 8.69834996e-05, 8.02881901e-05, 7.37772190e-05, 7.82900229e-05, 8.32276040e-05, 8.85123289e-05, 1.09490154e-04, 1.33787635e-04, 1.60000000e-04, 1.60000000e-04, 1.60000000e-04, 1.60000000e-04, 1.60000000e-04, 1.60000000e-04, 1.60000000e-04, 1.60000000e-04, 1.53377433e-04, 1.41172763e-04, 1.12800644e-04, 8.77941691e-05, 6.73636477e-05, 6.58143897e-05, 6.42795513e-05, 6.27637602e-05, 6.44560858e-05, 6.62277317e-05, 6.80597664e-05, 7.00191501e-05, 7.21265367e-05, 7.42520123e-05, 7.83838549e-05, 8.27245784e-05, 8.72894755e-05, 9.45483096e-05, 1.02360641e-04, 1.10740277e-04, 1.16638504e-04])
- easting :
- longitude
- northing :
- latitude
- title :
- Station profile, index (i,j)=(1200,240)
stationnov.KPPdiffKzT.attrs["long_name"] = "$K_T$"
stationnov.KPPdiffKzT.attrs["units"] = "$m²/s²$"
stationnov.stress.attrs["units"] = "$N/m²$"
stationnov.netflux.attrs["long_name"] = "$Q_{net}$"
stationnov.netflux.attrs["units"] = "$W/m²$"
f, ax = pump.plot.plot_dcl(stationnov)
ax[0, 0].set_title("(3.5°N, 110°W)")
dcpy.plots.pub_fig_width("jpo", "medium 2")
f.savefig("../images/kpp-deep-cycle-35.png")
calc uz
calc vz
calc S2
calc N2
calc shred2
Calc Ri
/glade/u/home/dcherian/miniconda3/envs/dcpy2/lib/python3.7/site-packages/matplotlib/colors.py:1171: RuntimeWarning: invalid value encountered in less_equal
mask |= resdat <= 0
/glade/u/home/dcherian/miniconda3/envs/dcpy2/lib/python3.7/site-packages/IPython/core/pylabtools.py:132: UserWarning: Creating legend with loc="best" can be slow with large amounts of data.
fig.canvas.print_figure(bytes_io, **kw)
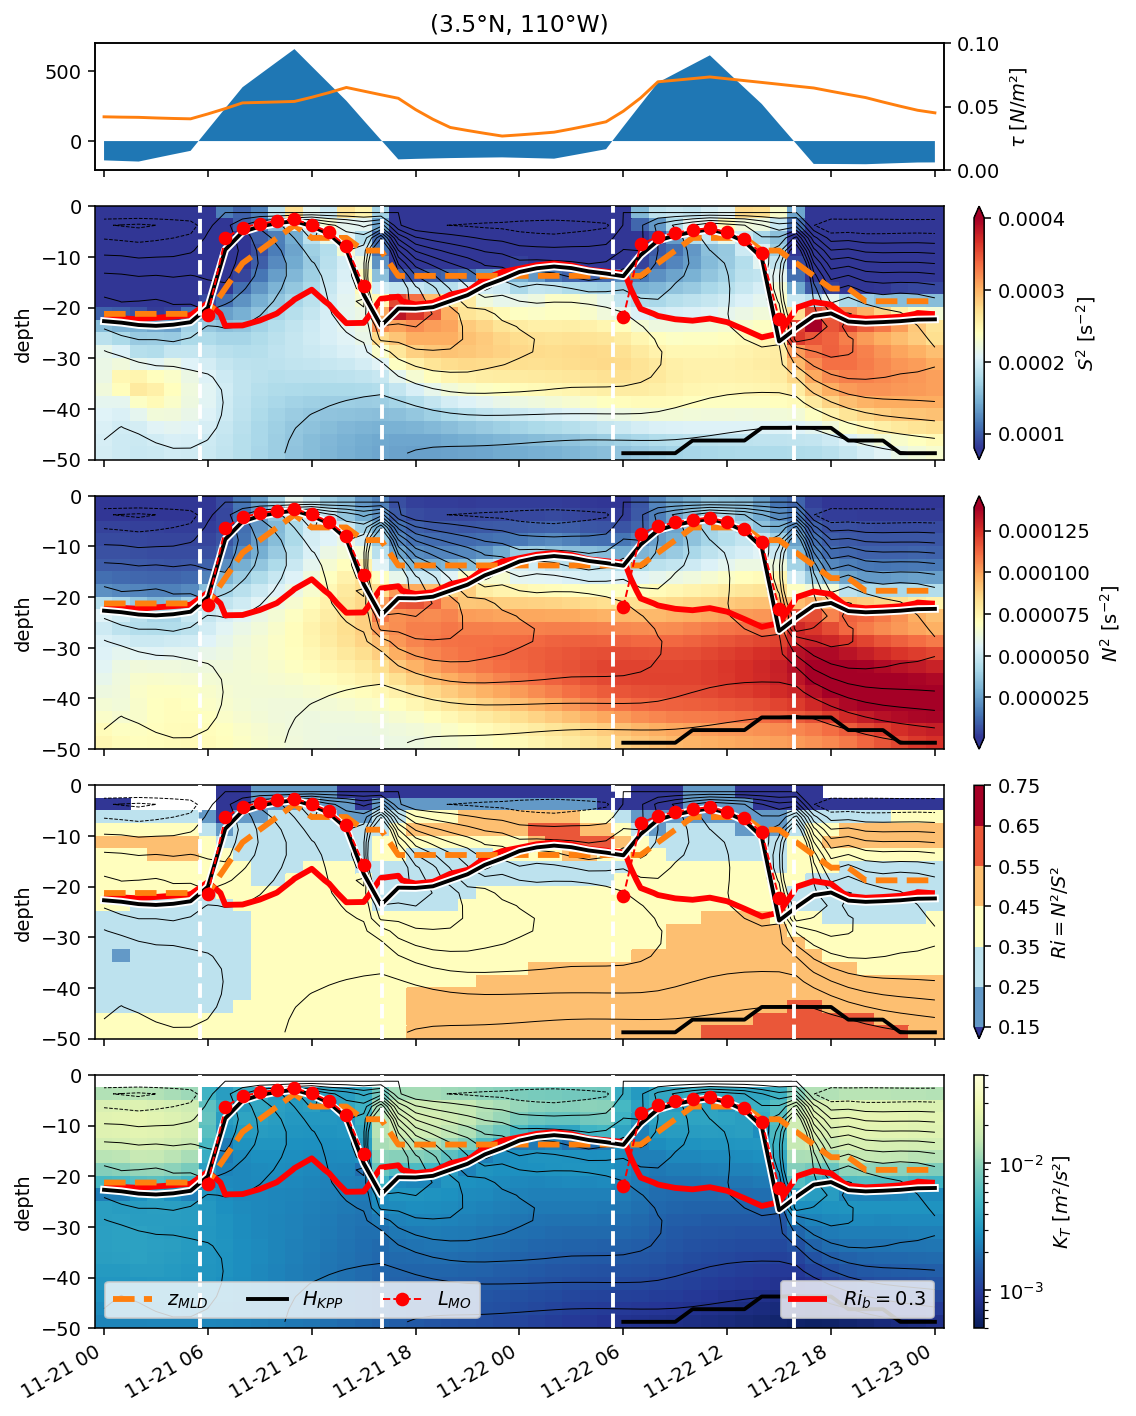
dcl flux vs surface flux#
gcm1.budget["time"] = gcm1.budget.time - pd.Timedelta("7h")
qnet = gcm1.budget.oceQnet.sel(longitude=-110, method="nearest")
# qnet = qnet.isel(time=slice(10)).mean("latitude")
# qnet = qnet.copy(data=qnet.data.map_blocks(np.copy))
period4.sst.isel(longitude=1).sel(latitude=slice(-1, 5)).plot(x="time")
<matplotlib.collections.QuadMesh at 0x2b1332eaf9e8>
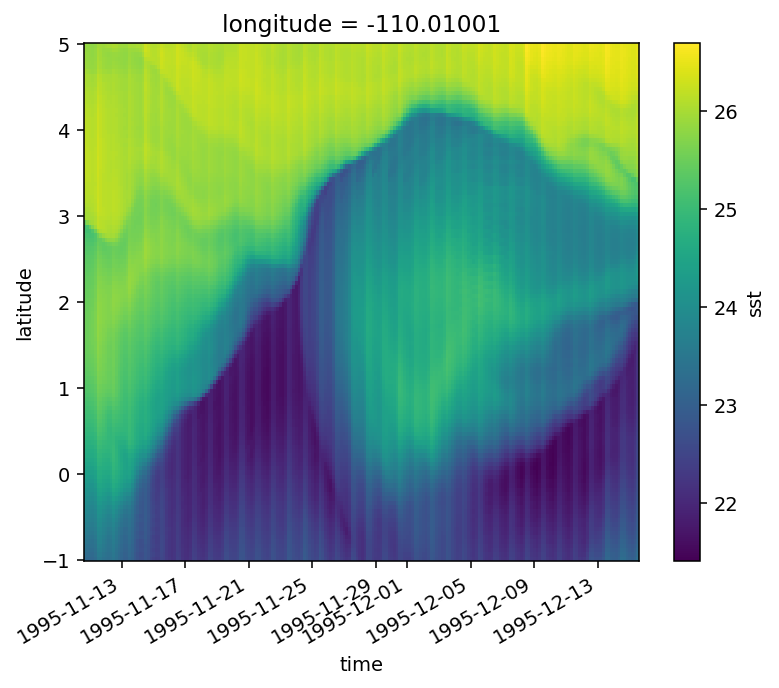
period4["qnet"] = qnet.sel(time=period4.time).expand_dims("longitude")
def visualize(da, nblocks=5, **kwargs):
kwargs.setdefault("color", "order")
kwargs.setdefault("optimize_graph", True)
kwargs.setdefault("rankdir", "LR")
kwargs.setdefault("cmap", "autumn")
da.data.blocks[slice(nblocks)].visualize(**kwargs)
period4.dcl.load()
- time: 210
- latitude: 480
- longitude: 3
- 0.0 0.0 0.0 0.0 0.0 0.0 2.0 0.0 ... 9.0 11.0 11.0 11.0 0.0 0.0 0.0
array([[[ 0., 0., 0.], [ 0., 0., 0.], [ 2., 0., 0.], ..., [ 0., 0., 0.], [ 0., 0., 0.], [ 0., 0., 0.]], [[ 0., 0., 0.], [ 0., 0., 0.], [ 0., 0., 0.], ..., [ 0., 0., 0.], [ 0., 0., 0.], [ 0., 0., 0.]], [[ 0., 0., 0.], [ 0., 0., 0.], [ 0., 0., 0.], ..., [ 0., 0., 0.], [ 0., 0., 0.], [ 0., 0., 0.]], ..., [[ 0., 0., 0.], [ 0., 0., 0.], [ 0., 0., 0.], ..., [ 0., 0., 0.], [ 0., 0., 0.], [ 0., 0., 0.]], [[ 0., 0., 0.], [ 0., 0., 0.], [ 0., 0., 0.], ..., [ 0., 0., 0.], [ 0., 0., 0.], [ 0., 0., 0.]], [[ 0., 0., 0.], [ 8., 8., 8.], [ 8., 7., 8.], ..., [ 9., 10., 9.], [11., 11., 11.], [ 0., 0., 0.]]], dtype=float32) - longitude(longitude)float64-110.1 -110.0 -110.0
array([-110.060043, -110.01001 , -109.959976])
- latitude(latitude)float32-12.0 -11.949896 ... 11.949896 12.0
array([-12. , -11.949896, -11.899791, ..., 11.899791, 11.949896, 12. ], dtype=float32) - time(time)datetime64[ns]1995-11-10T17:00:00 ... 1995-12-15T13:00:00
array(['1995-11-10T17:00:00.000000000', '1995-11-10T21:00:00.000000000', '1995-11-11T01:00:00.000000000', ..., '1995-12-15T05:00:00.000000000', '1995-12-15T09:00:00.000000000', '1995-12-15T13:00:00.000000000'], dtype='datetime64[ns]')
period4["mld"], period4["dcl_base"] = dask.compute(period4.mld, period4.dcl_base)
period4 = period4.sel(time=slice("1995-11-11 00:00", "1995-12-15 00:00"))
latslice = slice(None, None)
sstmask = (period4.sst.isel(longitude=1).sel(latitude=latslice) < 24.3).compute()
period4.sst.isel(longitude=1).where(sstmask).plot(levels=11, x="time")
<matplotlib.collections.QuadMesh at 0x2b12fdddbc18>
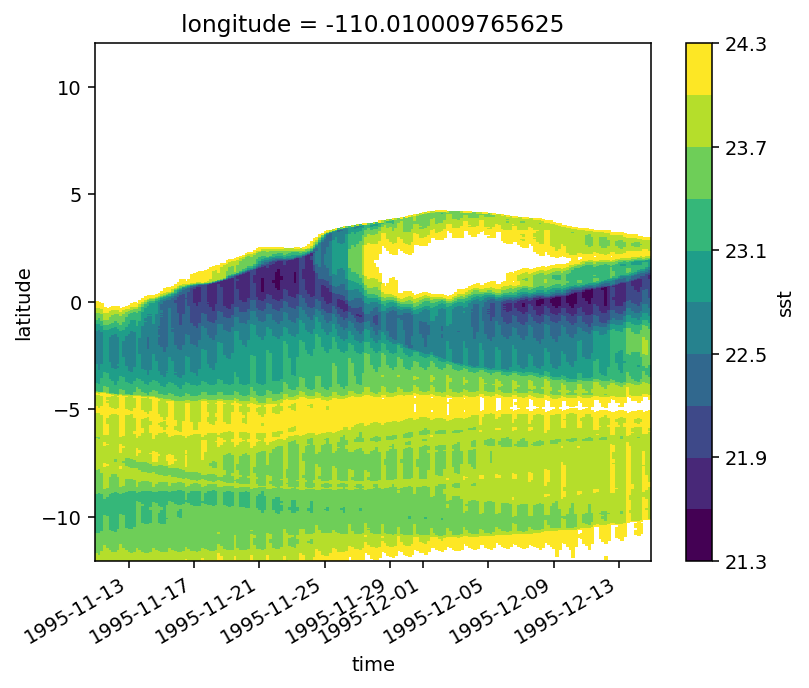
masked = period4.isel(longitude=1).where(sstmask)
dcmask = ((masked.depth > masked.dcl_base) & (masked.depth < masked.mld)).compute()
dcl_jq = masked.Jq.where(sstmask & dcmask)
masked.dcl.where(dcmask).plot.hist(bins=30)
(array([4.70000e+03, 7.83600e+03, 1.29980e+04, 1.52560e+04, 1.78160e+04,
1.13470e+04, 1.10620e+04, 3.17100e+03, 1.66364e+05, 3.42010e+04,
2.79190e+04, 1.96840e+04, 3.16700e+04, 3.10220e+04, 2.97680e+04,
2.74370e+04, 2.47780e+04, 1.82610e+04, 2.73120e+04, 2.48090e+04,
2.26800e+04, 1.91240e+04, 1.08830e+04, 5.12700e+03, 4.89400e+03,
4.30700e+03, 1.89900e+03, 7.07000e+02, 2.46000e+02, 8.60000e+01]),
array([ 2. , 4.8333335, 7.6666665, 10.5 , 13.333333 ,
16.166666 , 19. , 21.833334 , 24.666666 , 27.5 ,
30.333334 , 33.166668 , 36. , 38.833332 , 41.666668 ,
44.5 , 47.333332 , 50.166668 , 53. , 55.833332 ,
58.666668 , 61.5 , 64.333336 , 67.166664 , 70. ,
72.833336 , 75.666664 , 78.5 , 81.333336 , 84.166664 ,
87. ], dtype=float32),
<a list of 30 Patch objects>)
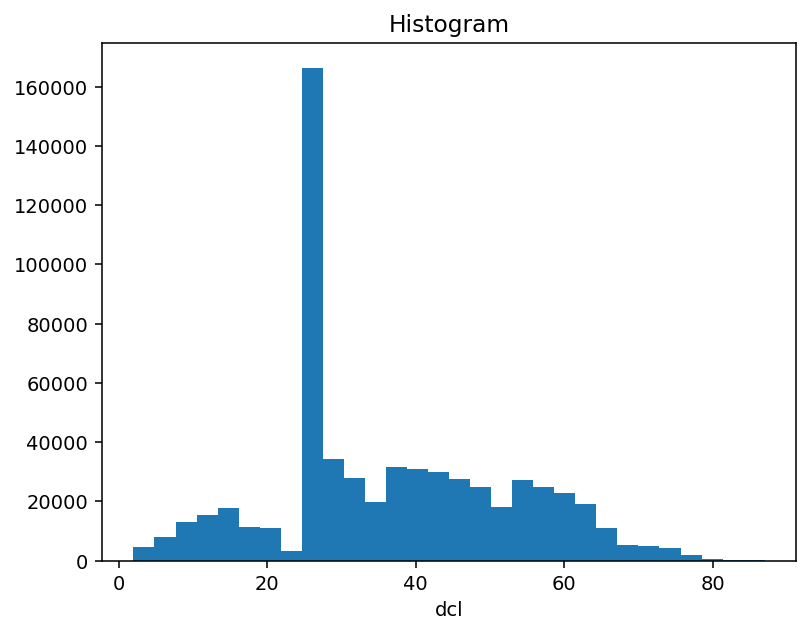
period4.dcl.where(period4.dcl > 0).isel(longitude=1).plot()
<matplotlib.collections.QuadMesh at 0x2b1387a68f28>
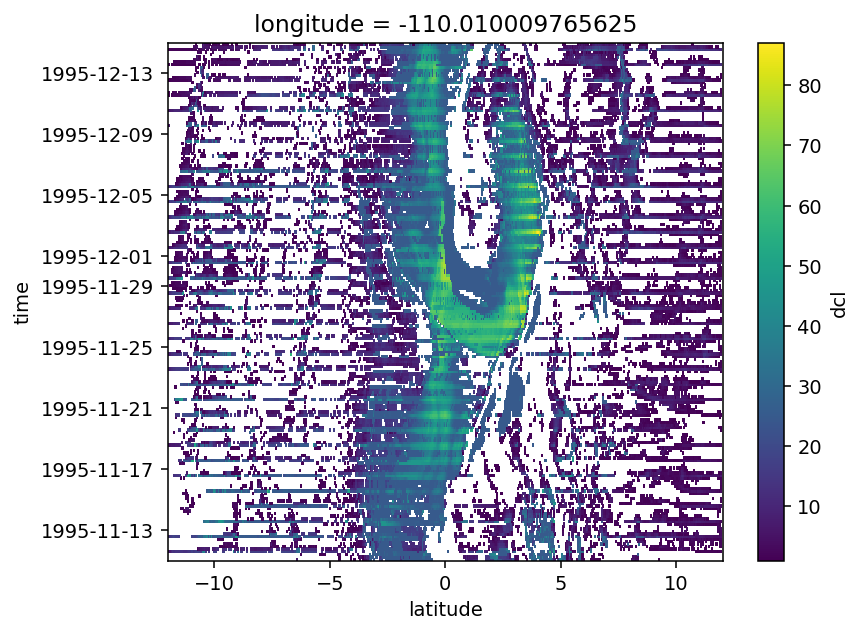
masked.qnet.sum("time").plot(y="latitude")
(-1 * dcl_jq.sum(["depth", "time"]) / 50).plot(y="latitude")
qnet = (period4.isel(longitude=1).qnet).load()
mean_dcl_jq = (-1 * dcl_jq.sum("depth") / 50).fillna(0).mean(["time"]).load()
uprof = (
period4.u.sel(depth=slice(-70, -120))
.isel(longitude=1)
.mean(["depth", "time"])
.load()
)
daily_qnet = qnet.resample(time="D").mean()
daily_qnet.where(daily_qnet > 0).mean("time").plot(y="latitude")
mean_dcl_jq.plot(y="latitude")
ax1 = plt.gca()
ax1.set_facecolor("None")
ax2 = ax1.twiny()
ax2.fill_betweenx(uprof.latitude, uprof.values, color="gray", alpha=0.5)
ax2.set_xlim([-0.5, 1.5])
ax2.set_ylim([-5, 5])
ax2.set_zorder(-1)
ax1.set_xlim([0, 220])
plt.gcf().set_size_inches((3, 5))
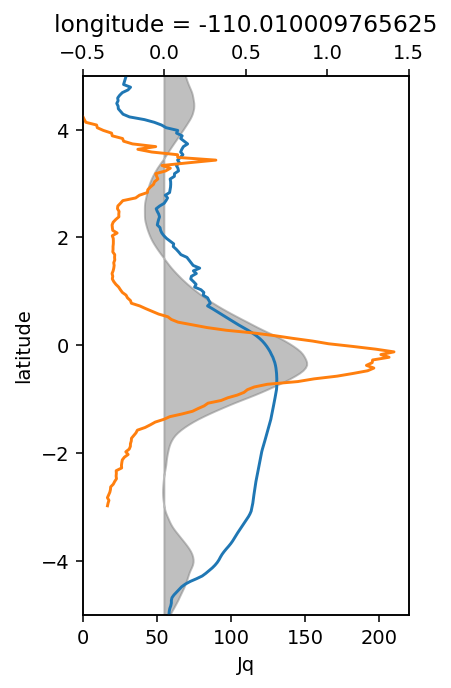
period4.isel(longitude=1).qnet.resample(time="D").mean().plot(x="time")
masked.sst.plot.contour(levels=11, x="time")
dcpy.plots.liney([2.5, 4.25], zorder=10)
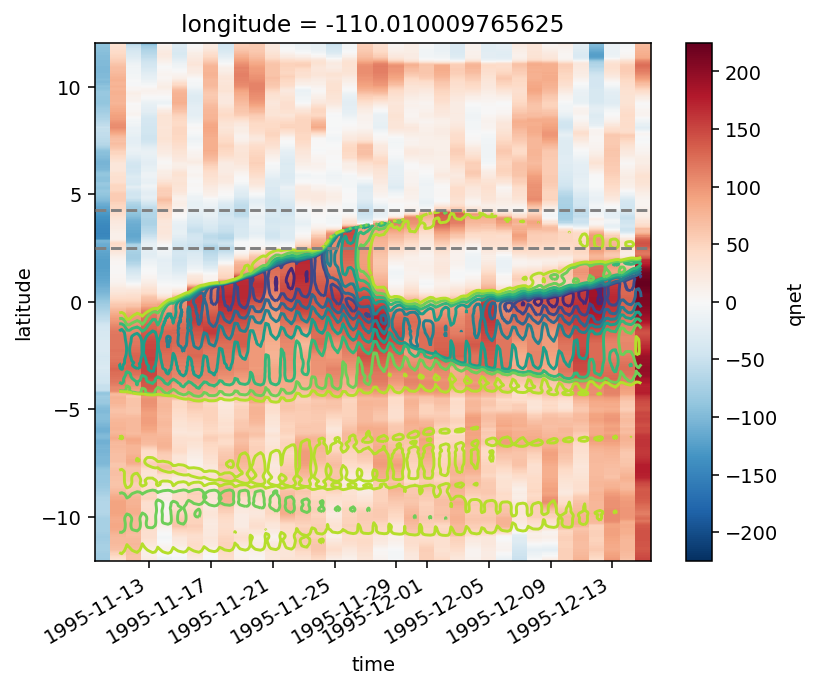
Check 1_hb jq calculation#
tao = xr.open_dataset(
"~/pump/glade/TPOS_MITgcm_1_hb/HOLD/obs_subset/tao-budget-extract.nc"
).load()
metrics = read_metrics("../glade/TPOS_MITgcm_1_hb/")
metrics.dRF.max().compute()
- -2.5
array(-2.5)
(
(
3994
* 1035
* tao.sel(longitude=-110, latitude=0).DFrI_TH.rolling(depth=2).mean()
/ metrics.RAC.sel(longitude=-110, method="nearest", latitude=0)
)
.sel(time=slice("1996-05-19", "1996-05-23"))
.plot(x="time", robust=True)
)
<matplotlib.collections.QuadMesh at 0x2b325d2fba20>
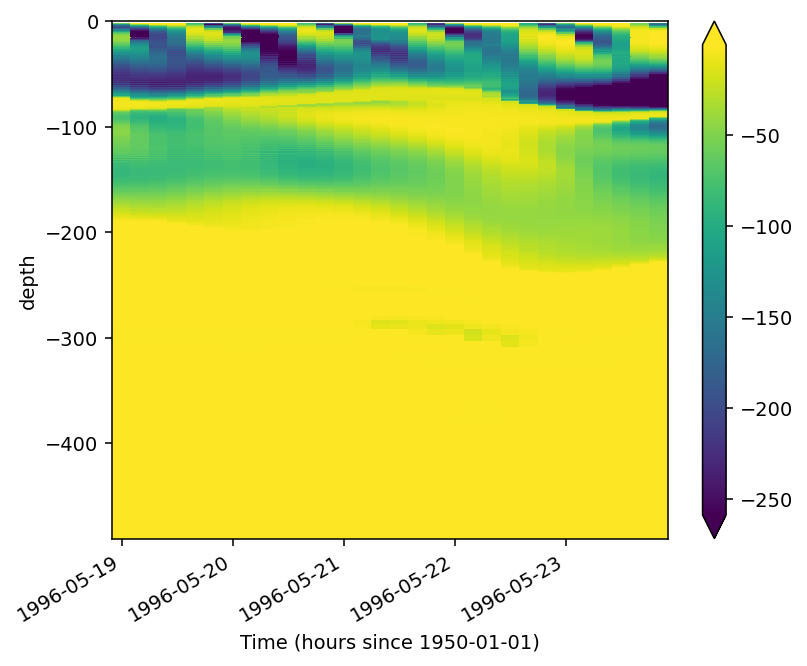
Get surface fluxes for station#
station = ds
jrafull = xr.concat(
[
pump.obs.read_jra(
"/glade/p/nsc/ncgd0043/make_TPOS_MITgcm/JRA_FORCING/1999/JRA55DO*[0-9].nc",
chunks={"time": 1200},
),
pump.obs.read_jra(
"/glade/p/nsc/ncgd0043/make_TPOS_MITgcm/JRA_FORCING/200[0-2]/JRA55DO*[0-9].nc",
chunks={"time": 1200},
),
],
dim="time",
)
jrafull["time"] = jrafull.time - pd.Timedelta("7h")
jra = jrafull.interp(longitude=-110.009, latitude=0.02506, method="linear").sel(
time=slice(station.time[0].values, station.time[-1].values)
)
jra["time"] = jra.time.dt.floor("h")
for var in jra.variables:
if isinstance(jra[var].data, dask.array.Array):
jra[var] = jra[var].copy(data=jra[var].data.map_blocks(np.copy))
jra
- time: 8000
- time(time)datetime64[ns]1998-12-31T18:00:00 ... 2000-05-14T17:00:00
array(['1998-12-31T18:00:00.000000000', '1998-12-31T20:00:00.000000000', '1998-12-31T21:00:00.000000000', ..., '2000-05-14T14:00:00.000000000', '2000-05-14T15:00:00.000000000', '2000-05-14T17:00:00.000000000'], dtype='datetime64[ns]') - longitude()float64-110.0
array(-110.009)
- latitude()float640.02506
array(0.02506)
- huss(time)float32dask.array<chunksize=(2399,), meta=np.ndarray>
- actual_range :
- [1.9999999e-05 2.0845825e-02]
Array Chunk Bytes 32.00 kB 9.60 kB Shape (8000,) (2400,) Count 183 Tasks 4 Chunks Type float32 numpy.ndarray - prra(time)float32dask.array<chunksize=(2400,), meta=np.ndarray>
- actual_range :
- [0. 0.00155959]
Array Chunk Bytes 32.00 kB 9.60 kB Shape (8000,) (2400,) Count 183 Tasks 4 Chunks Type float32 numpy.ndarray - psl(time)float32dask.array<chunksize=(2399,), meta=np.ndarray>
- actual_range :
- [ 94958.15 104364.42]
Array Chunk Bytes 32.00 kB 9.60 kB Shape (8000,) (2400,) Count 183 Tasks 4 Chunks Type float32 numpy.ndarray - rlds(time)float32dask.array<chunksize=(2400,), meta=np.ndarray>
- actual_range :
- [126.48046 442.72263]
Array Chunk Bytes 32.00 kB 9.60 kB Shape (8000,) (2400,) Count 183 Tasks 4 Chunks Type float32 numpy.ndarray - rsds(time)float32dask.array<chunksize=(2400,), meta=np.ndarray>
- actual_range :
- [ 0. 1149.1526]
Array Chunk Bytes 32.00 kB 9.60 kB Shape (8000,) (2400,) Count 183 Tasks 4 Chunks Type float32 numpy.ndarray - tas(time)float32dask.array<chunksize=(2399,), meta=np.ndarray>
- actual_range :
- [235.69489 304.40918]
Array Chunk Bytes 32.00 kB 9.60 kB Shape (8000,) (2400,) Count 183 Tasks 4 Chunks Type float32 numpy.ndarray - uas(time)float32dask.array<chunksize=(2399,), meta=np.ndarray>
- actual_range :
- [-26.107578 28.0601 ]
Array Chunk Bytes 32.00 kB 9.60 kB Shape (8000,) (2400,) Count 183 Tasks 4 Chunks Type float32 numpy.ndarray - vas(time)float32dask.array<chunksize=(2399,), meta=np.ndarray>
- actual_range :
- [-26.301264 20.78898 ]
Array Chunk Bytes 32.00 kB 9.60 kB Shape (8000,) (2400,) Count 183 Tasks 4 Chunks Type float32 numpy.ndarray
- About :
- Created with SOSIE interpolation environement => https://github.com/brodeau/sosie/
jrai = jra.compute().interpolate_na("time").interp(time=station.time)
fluxes = pump.calc.coare_fluxes_jra(station.sel(latitude=0, method="nearest"), jrai)
fluxes.sel(time="1999-05").to_array().plot(x="time", hue="variable")
[<matplotlib.lines.Line2D at 0x2ac8544011d0>,
<matplotlib.lines.Line2D at 0x2ac81a4ca390>,
<matplotlib.lines.Line2D at 0x2ac80b617b70>,
<matplotlib.lines.Line2D at 0x2ac8511004a8>,
<matplotlib.lines.Line2D at 0x2ac7d3a9a0b8>,
<matplotlib.lines.Line2D at 0x2ac802430390>]
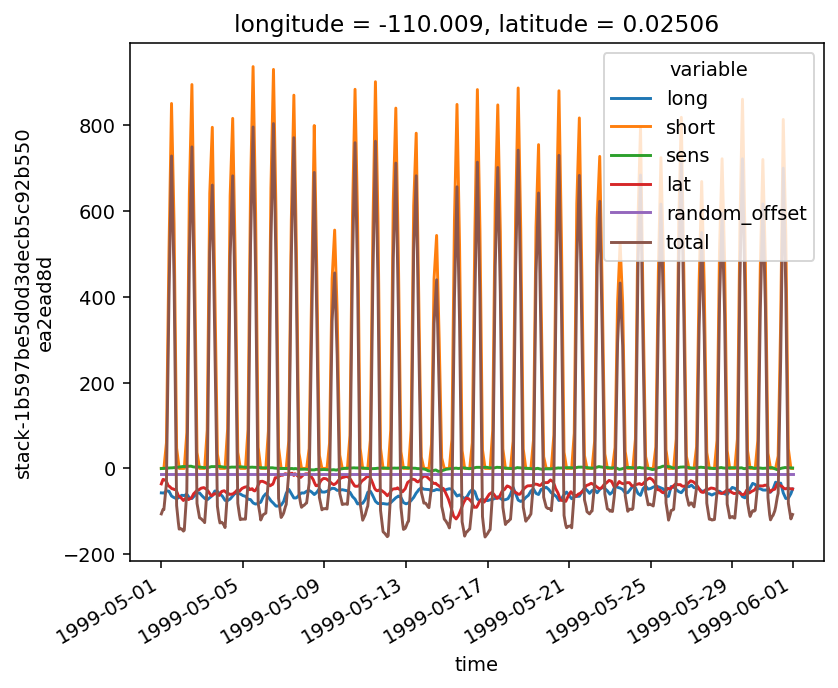
expected = xr.open_mfdataset(
"/glade/campaign/cgd/oce/people/bachman/TPOS_MITgcm_fix3/*00[0-9][0-9]*surf.nc",
parallel=True,
chunks={"time": 1},
)
# expected["time"] = expected.time - pd.Timedelta("7h")
/glade/u/home/dcherian/miniconda3/envs/dcpy/lib/python3.6/site-packages/ipykernel_launcher.py:2: FutureWarning: In xarray version 0.15 the default behaviour of `open_mfdataset`
will change. To retain the existing behavior, pass
combine='nested'. To use future default behavior, pass
combine='by_coords'. See
http://xarray.pydata.org/en/stable/combining.html#combining-multi
/glade/u/home/dcherian/miniconda3/envs/dcpy/lib/python3.6/site-packages/xarray/backends/api.py:941: FutureWarning: The datasets supplied have global dimension coordinates. You may want
to use the new `combine_by_coords` function (or the
`combine='by_coords'` option to `open_mfdataset`) to order the datasets
before concatenation. Alternatively, to continue concatenating based
on the order the datasets are supplied in future, please use the new
`combine_nested` function (or the `combine='nested'` option to
open_mfdataset).
from_openmfds=True,
Things look good! I could take the daily error and distribute that in time uniformly in my hourly net flux time series
actual = fluxes.sel(time=slice(expected.time[0], expected.time[-1]))
# output has means calculated in GMT
# so shift time back to GMT and then calculate daily means.
# first and last points will be weird.
actual["time"] = actual.time + pd.Timedelta("7h")
# actual.total.plot()
(
actual.total.resample(time="D").mean().hvplot()
* expected.TFLUX.sel(latitude=0, longitude=-110, method="nearest").hvplot(x="time")
)
debug eucmax#
yp, y0, ym = dask.compute(*get_euc_bounds(u))
yp.plot(hue="longitude")
sections.eucmax.plot(hue="longitude")
ym.plot(hue="longitude")
[<matplotlib.lines.Line2D at 0x2ac3af343050>,
<matplotlib.lines.Line2D at 0x2ac3e40111d0>,
<matplotlib.lines.Line2D at 0x2ac3ed8dae50>,
<matplotlib.lines.Line2D at 0x2ac3e8886910>]
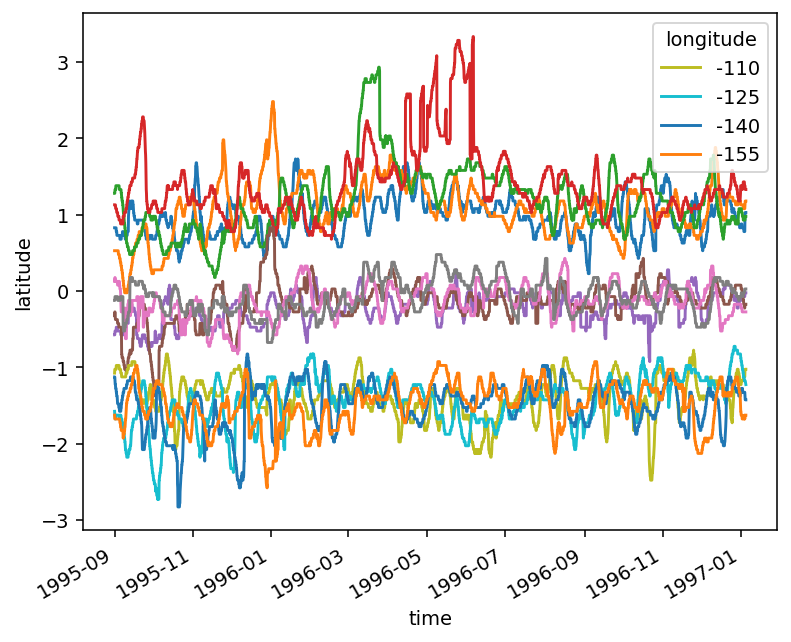
KPP’s deep cycle#
The descending shear layer coincides with a descending PBL. The mixed layer descends later
20 year run stations#
jrafull = pump.obs.read_jra_20()
station = pump.model.model.read_stations_20("../TPOS_MITgcm_fix3/", "*110.000*.nc")
station
- depth: 185
- latitude: 111
- time: 24000
- depth(depth)float32-1.25 -3.75 ... -5758.0986
array([-1.250000e+00, -3.750000e+00, -6.250000e+00, -8.750000e+00, -1.125000e+01, -1.375000e+01, -1.625000e+01, -1.875000e+01, -2.125000e+01, -2.375000e+01, -2.625000e+01, -2.875000e+01, -3.125000e+01, -3.375000e+01, -3.625000e+01, -3.875000e+01, -4.125000e+01, -4.375000e+01, -4.625000e+01, -4.875000e+01, -5.125000e+01, -5.375000e+01, -5.625000e+01, -5.875000e+01, -6.125000e+01, -6.375000e+01, -6.625000e+01, -6.875000e+01, -7.125000e+01, -7.375000e+01, -7.625000e+01, -7.875000e+01, -8.125000e+01, -8.375000e+01, -8.625000e+01, -8.875000e+01, -9.125000e+01, -9.375000e+01, -9.625000e+01, -9.875000e+01, -1.012500e+02, -1.037500e+02, -1.062500e+02, -1.087500e+02, -1.112500e+02, -1.137500e+02, -1.162500e+02, -1.187500e+02, -1.212500e+02, -1.237500e+02, -1.262500e+02, -1.287500e+02, -1.312500e+02, -1.337500e+02, -1.362500e+02, -1.387500e+02, -1.412500e+02, -1.437500e+02, -1.462500e+02, -1.487500e+02, -1.512500e+02, -1.537500e+02, -1.562500e+02, -1.587500e+02, -1.612500e+02, -1.637500e+02, -1.662500e+02, -1.687500e+02, -1.712500e+02, -1.737500e+02, -1.762500e+02, -1.787500e+02, -1.812500e+02, -1.837500e+02, -1.862500e+02, -1.887500e+02, -1.912500e+02, -1.937500e+02, -1.962500e+02, -1.987500e+02, -2.012500e+02, -2.037500e+02, -2.062500e+02, -2.087500e+02, -2.112500e+02, -2.137500e+02, -2.162500e+02, -2.187500e+02, -2.212500e+02, -2.237500e+02, -2.262500e+02, -2.287500e+02, -2.312500e+02, -2.337500e+02, -2.362500e+02, -2.387500e+02, -2.412500e+02, -2.437500e+02, -2.462500e+02, -2.487500e+02, -2.513687e+02, -2.542363e+02, -2.573763e+02, -2.608145e+02, -2.645794e+02, -2.687019e+02, -2.732162e+02, -2.781592e+02, -2.835718e+02, -2.894987e+02, -2.959886e+02, -3.030949e+02, -3.108764e+02, -3.193972e+02, -3.287274e+02, -3.389439e+02, -3.501312e+02, -3.623811e+02, -3.757947e+02, -3.904827e+02, -4.065660e+02, -4.241773e+02, -4.434617e+02, -4.645781e+02, -4.877004e+02, -5.130195e+02, -5.407438e+02, -5.711019e+02, -6.043441e+02, -6.407443e+02, -6.806025e+02, -7.242472e+02, -7.720381e+02, -8.243693e+02, -8.816718e+02, -9.444181e+02, -1.013125e+03, -1.088360e+03, -1.170741e+03, -1.260949e+03, -1.358099e+03, -1.458099e+03, -1.558099e+03, -1.658099e+03, -1.758099e+03, -1.858099e+03, -1.958099e+03, -2.058098e+03, -2.158098e+03, -2.258098e+03, -2.358098e+03, -2.458098e+03, -2.558098e+03, -2.658098e+03, -2.758098e+03, -2.858098e+03, -2.958098e+03, -3.058098e+03, -3.158098e+03, -3.258098e+03, -3.358098e+03, -3.458098e+03, -3.558098e+03, -3.658098e+03, -3.758098e+03, -3.858098e+03, -3.958098e+03, -4.058098e+03, -4.158099e+03, -4.258099e+03, -4.358099e+03, -4.458099e+03, -4.558099e+03, -4.658099e+03, -4.758099e+03, -4.858099e+03, -4.958099e+03, -5.058099e+03, -5.158099e+03, -5.258099e+03, -5.358099e+03, -5.458099e+03, -5.558099e+03, -5.658099e+03, -5.758099e+03], dtype=float32) - longitude()float32...
array(-110.025, dtype=float32)
- latitude(latitude)float64-3.075 -3.025 ... 5.975 6.025
array([-3.075, -3.025, -2.975, -2.825, -2.775, -2.725, -2.575, -2.525, -2.475, -2.325, -2.275, -2.225, -2.075, -2.025, -1.975, -1.825, -1.775, -1.725, -1.575, -1.525, -1.475, -1.325, -1.275, -1.225, -1.075, -1.025, -0.975, -0.825, -0.775, -0.725, -0.575, -0.525, -0.475, -0.325, -0.275, -0.225, -0.075, -0.025, 0.025, 0.175, 0.225, 0.275, 0.425, 0.475, 0.525, 0.675, 0.725, 0.775, 0.925, 0.975, 1.025, 1.175, 1.225, 1.275, 1.425, 1.475, 1.525, 1.675, 1.725, 1.775, 1.925, 1.975, 2.025, 2.175, 2.225, 2.275, 2.425, 2.475, 2.525, 2.675, 2.725, 2.775, 2.925, 2.975, 3.025, 3.175, 3.225, 3.275, 3.425, 3.475, 3.525, 3.675, 3.725, 3.775, 3.925, 3.975, 4.025, 4.175, 4.225, 4.275, 4.425, 4.475, 4.525, 4.675, 4.725, 4.775, 4.925, 4.975, 5.025, 5.175, 5.225, 5.275, 5.425, 5.475, 5.525, 5.675, 5.725, 5.775, 5.925, 5.975, 6.025]) - time(time)datetime64[ns]1998-12-31T18:00:00 ... 2001-09-26T17:00:00
array(['1998-12-31T18:00:00.000000000', '1998-12-31T19:00:00.000000000', '1998-12-31T20:00:00.000000000', ..., '2001-09-26T15:00:00.000000000', '2001-09-26T16:00:00.000000000', '2001-09-26T17:00:00.000000000'], dtype='datetime64[ns]')
- SSH(time, latitude)float32dask.array<chunksize=(6000, 1), meta=np.ndarray>
Array Chunk Bytes 10.66 MB 24.00 kB Shape (24000, 111) (6000, 1) Count 2220 Tasks 444 Chunks Type float32 numpy.ndarray - KPPhbl(time, latitude)float32dask.array<chunksize=(6000, 1), meta=np.ndarray>
Array Chunk Bytes 10.66 MB 24.00 kB Shape (24000, 111) (6000, 1) Count 2220 Tasks 444 Chunks Type float32 numpy.ndarray - u(depth, time, latitude)float32dask.array<chunksize=(185, 6000, 1), meta=np.ndarray>
Array Chunk Bytes 1.97 GB 4.44 MB Shape (185, 24000, 111) (185, 6000, 1) Count 2220 Tasks 444 Chunks Type float32 numpy.ndarray - v(depth, time, latitude)float32dask.array<chunksize=(185, 6000, 1), meta=np.ndarray>
Array Chunk Bytes 1.97 GB 4.44 MB Shape (185, 24000, 111) (185, 6000, 1) Count 2220 Tasks 444 Chunks Type float32 numpy.ndarray - w(depth, time, latitude)float32dask.array<chunksize=(185, 6000, 1), meta=np.ndarray>
Array Chunk Bytes 1.97 GB 4.44 MB Shape (185, 24000, 111) (185, 6000, 1) Count 2220 Tasks 444 Chunks Type float32 numpy.ndarray - theta(depth, time, latitude)float32dask.array<chunksize=(185, 6000, 1), meta=np.ndarray>
Array Chunk Bytes 1.97 GB 4.44 MB Shape (185, 24000, 111) (185, 6000, 1) Count 2220 Tasks 444 Chunks Type float32 numpy.ndarray - salt(depth, time, latitude)float32dask.array<chunksize=(185, 6000, 1), meta=np.ndarray>
Array Chunk Bytes 1.97 GB 4.44 MB Shape (185, 24000, 111) (185, 6000, 1) Count 2220 Tasks 444 Chunks Type float32 numpy.ndarray - DFrI_TH(depth, time, latitude)float32dask.array<chunksize=(185, 6000, 1), meta=np.ndarray>
Array Chunk Bytes 1.97 GB 4.44 MB Shape (185, 24000, 111) (185, 6000, 1) Count 2220 Tasks 444 Chunks Type float32 numpy.ndarray - VISrI_Um(depth, time, latitude)float32dask.array<chunksize=(185, 6000, 1), meta=np.ndarray>
Array Chunk Bytes 1.97 GB 4.44 MB Shape (185, 24000, 111) (185, 6000, 1) Count 2220 Tasks 444 Chunks Type float32 numpy.ndarray - VISrI_Vm(depth, time, latitude)float32dask.array<chunksize=(185, 6000, 1), meta=np.ndarray>
Array Chunk Bytes 1.97 GB 4.44 MB Shape (185, 24000, 111) (185, 6000, 1) Count 2220 Tasks 444 Chunks Type float32 numpy.ndarray - KPPdiffKzT(depth, time, latitude)float32dask.array<chunksize=(185, 6000, 1), meta=np.ndarray>
Array Chunk Bytes 1.97 GB 4.44 MB Shape (185, 24000, 111) (185, 6000, 1) Count 2220 Tasks 444 Chunks Type float32 numpy.ndarray - KPPviscAz(depth, time, latitude)float32dask.array<chunksize=(185, 6000, 1), meta=np.ndarray>
Array Chunk Bytes 1.97 GB 4.44 MB Shape (185, 24000, 111) (185, 6000, 1) Count 2220 Tasks 444 Chunks Type float32 numpy.ndarray - KPPg_TH(depth, time, latitude)float32dask.array<chunksize=(185, 6000, 1), meta=np.ndarray>
Array Chunk Bytes 1.97 GB 4.44 MB Shape (185, 24000, 111) (185, 6000, 1) Count 2220 Tasks 444 Chunks Type float32 numpy.ndarray - Jq(depth, time, latitude)float64dask.array<chunksize=(185, 6000, 1), meta=np.ndarray>
Array Chunk Bytes 3.94 GB 8.88 MB Shape (185, 24000, 111) (185, 6000, 1) Count 6002 Tasks 444 Chunks Type float64 numpy.ndarray - nonlocal_flux(depth, time, latitude)float64dask.array<chunksize=(185, 6000, 1), meta=np.ndarray>
Array Chunk Bytes 3.94 GB 8.88 MB Shape (185, 24000, 111) (185, 6000, 1) Count 3338 Tasks 444 Chunks Type float64 numpy.ndarray - dens(depth, time, latitude)float32dask.array<chunksize=(185, 6000, 1), meta=np.ndarray>
Array Chunk Bytes 1.97 GB 4.44 MB Shape (185, 24000, 111) (185, 6000, 1) Count 4885 Tasks 444 Chunks Type float32 numpy.ndarray
- title :
- Station profile, index (i,j)=(1200,240)
- easting :
- longitude
- northing :
- latitude
frictional shear torque#
state = xr.open_mfdataset(
"/glade/campaign/cgd/oce/people/bachman/TPOS_MITgcm_fix3/File_0[0-4]*buoy.nc",
parallel=True,
)
budget = xr.open_mfdataset(
"/glade/campaign/cgd/oce/people/bachman/TPOS_MITgcm_fix3/File_0[0-4]*[u,v]b.nc",
parallel=True,
)
/glade/u/home/dcherian/miniconda3/envs/dcpy/lib/python3.6/site-packages/ipykernel_launcher.py:1: FutureWarning: In xarray version 0.15 the default behaviour of `open_mfdataset`
will change. To retain the existing behavior, pass
combine='nested'. To use future default behavior, pass
combine='by_coords'. See
http://xarray.pydata.org/en/stable/combining.html#combining-multi
"""Entry point for launching an IPython kernel.
/glade/u/home/dcherian/miniconda3/envs/dcpy/lib/python3.6/site-packages/xarray/backends/api.py:941: FutureWarning: The datasets supplied have global dimension coordinates. You may want
to use the new `combine_by_coords` function (or the
`combine='by_coords'` option to `open_mfdataset`) to order the datasets
before concatenation. Alternatively, to continue concatenating based
on the order the datasets are supplied in future, please use the new
`combine_nested` function (or the `combine='nested'` option to
open_mfdataset).
from_openmfds=True,
/glade/u/home/dcherian/miniconda3/envs/dcpy/lib/python3.6/site-packages/ipykernel_launcher.py:2: FutureWarning: In xarray version 0.15 the default behaviour of `open_mfdataset`
will change. To retain the existing behavior, pass
combine='nested'. To use future default behavior, pass
combine='by_coords'. See
http://xarray.pydata.org/en/stable/combining.html#combining-multi
/glade/u/home/dcherian/miniconda3/envs/dcpy/lib/python3.6/site-packages/xarray/backends/api.py:941: FutureWarning: The datasets supplied have global dimension coordinates. You may want
to use the new `combine_by_coords` function (or the
`combine='by_coords'` option to `open_mfdataset`) to order the datasets
before concatenation. Alternatively, to continue concatenating based
on the order the datasets are supplied in future, please use the new
`combine_nested` function (or the `combine='nested'` option to
open_mfdataset).The datasets supplied require both concatenation and merging. From
xarray version 0.15 this will operation will require either using the
new `combine_nested` function (or the `combine='nested'` option to
open_mfdataset), with a nested list structure such that you can combine
along the dimensions None. Alternatively if your datasets have global
dimension coordinates then you can use the new `combine_by_coords`
function.
from_openmfds=True,
metrics = pump.model.model.read_metrics(
"/glade/campaign/cgd/oce/people/bachman/TPOS_MITgcm_fix3/"
)
metrics = (
metrics.isel(
longitude=slice(40, -40), latitude=slice(40, -40), depth=slice(136)
).assign_coords(
longitude=state.longitude, latitude=state.latitude, depth=state.depth
)
).persist()
VISrI_Um = xr.concat(
[
budget.VISrI_Um,
xr.zeros_like(budget.VISrI_Um.isel(depth=0).drop("depth")).expand_dims(
depth=[-5865.922]
),
],
dim="depth",
)
VISrI_Vm = xr.concat(
[
budget.VISrI_Vm,
xr.zeros_like(budget.VISrI_Vm.isel(depth=0).drop("depth")).expand_dims(
depth=[-5865.922]
),
],
dim="depth",
)
# from http://mailman.mitgcm.org/pipermail/mitgcm-support/2010-December/006921.html
budget["Um_Impl"] = VISrI_Um.diff("depth", label="lower") / (
metrics.rAw * metrics.drF * metrics.hFacW
)
# from http://mailman.mitgcm.org/pipermail/mitgcm-support/2010-December/006921.html
budget["Vm_Impl"] = VISrI_Vm.diff("depth", label="lower") / (
metrics.rAw * metrics.drF * metrics.hFacW
)
state.theta.isel(depth=0).sel(longitude=-110, method="nearest").sel(
latitude=slice(-2, 6), time=slice("1999-Jul", "1999-Nov")
).plot(x="time")
<matplotlib.collections.QuadMesh at 0x2b03bdf443c8>
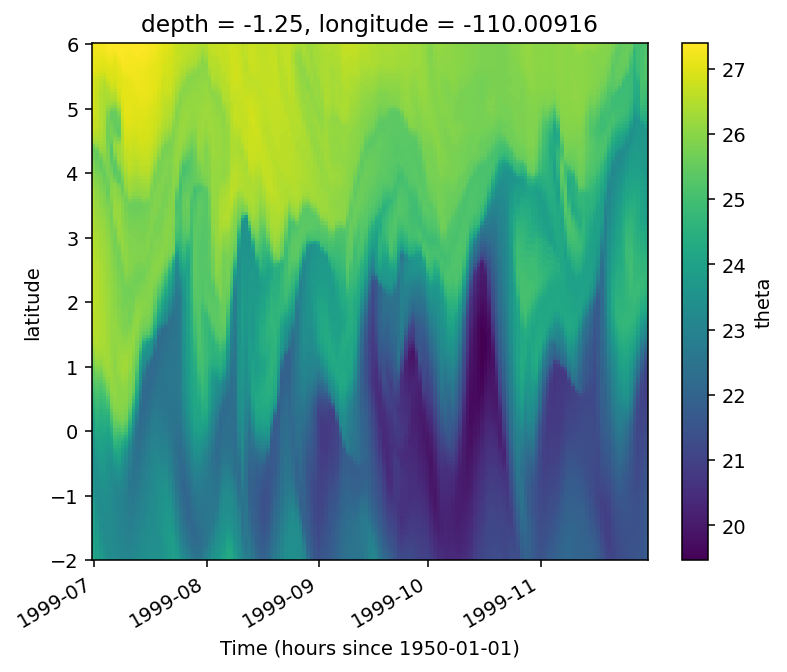
def subset(ds):
return (
ds.sel(time=slice("1999-12-15", "1999-10-15"))
.sel(latitude=slice(-2, 6), depth=slice(-100))
.sel(longitude=-110, method="nearest")
.pipe(dcpy.dask.map_copy)
)
subset(state.v.differentiate("depth")).sel(depth=slice(-60)).mean("depth").plot(
x="time", robust=True
)
subset(state.theta).isel(depth=0).plot.contour(colors="k", linewidths=1, x="time")
<matplotlib.contour.QuadContourSet at 0x2b03bdf21d30>
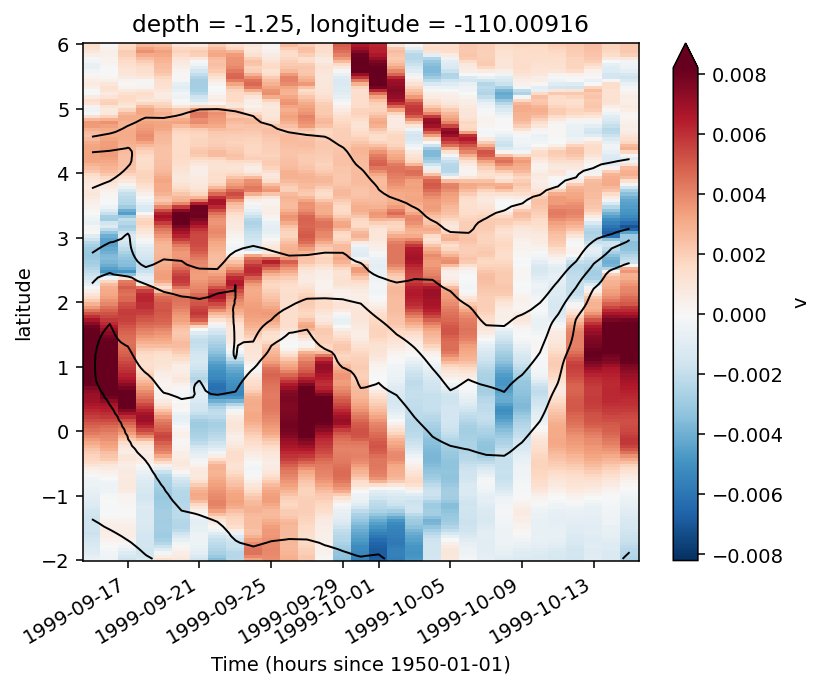
state["dens"] = pump.mdjwf.dens(state.salt, state.theta, np.array([0.0]))
period = (
state.merge(budget[["Um_Diss", "Um_Impl", "Vm_Diss", "Vm_Impl"]])
.sel(time=slice("1999-10-15", "1999-11-15"))
.sel(latitude=slice(-2, 6), depth=slice(-100))
.pipe(dcpy.dask.map_copy)
)
idx = period.indexes["longitude"].get_loc(-110, method="nearest")
period = period.isel(longitude=[idx - 1, idx, idx + 1])
duzdt, dvzdt = dask.compute(*pump.calc.estimate_shear_evolution_terms(period))
period = pump.calc_reduced_shear(period)
period["mld"] = pump.calc.get_mld(period.dens)
period["dcl_base"] = pump.calc.get_dcl_base_Ri(period)
period["dcl"] = period.mld - period.dcl_base
calc uz
calc vz
calc S2
calc N2
calc shred2
Calc Ri
period = period.persist()
f, ax = pump.plot.plot_shear_terms(period, duzdt, dvzdt, mask_dcl=False)
# ax["u"]["shear"].set_xlim((None, "1999-12-06"))
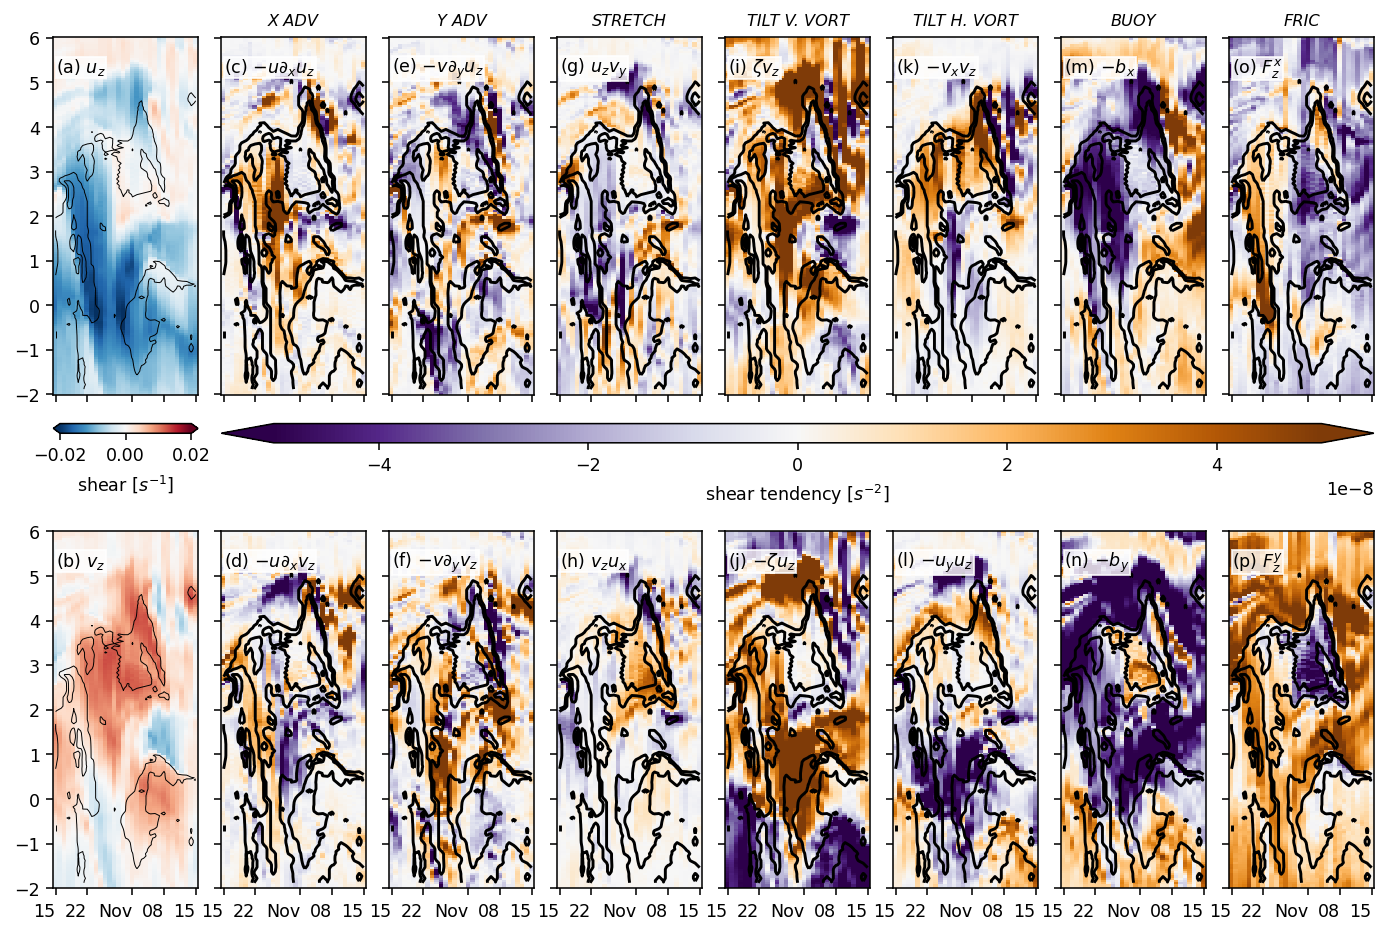
f, ax = pump.plot.plot_shear_terms(period, duzdt, dvzdt, mask_dcl=False)
ax["u"]["shear"].set_xlim((None, "1999-12-06"))
(730072.5, 730094.0)
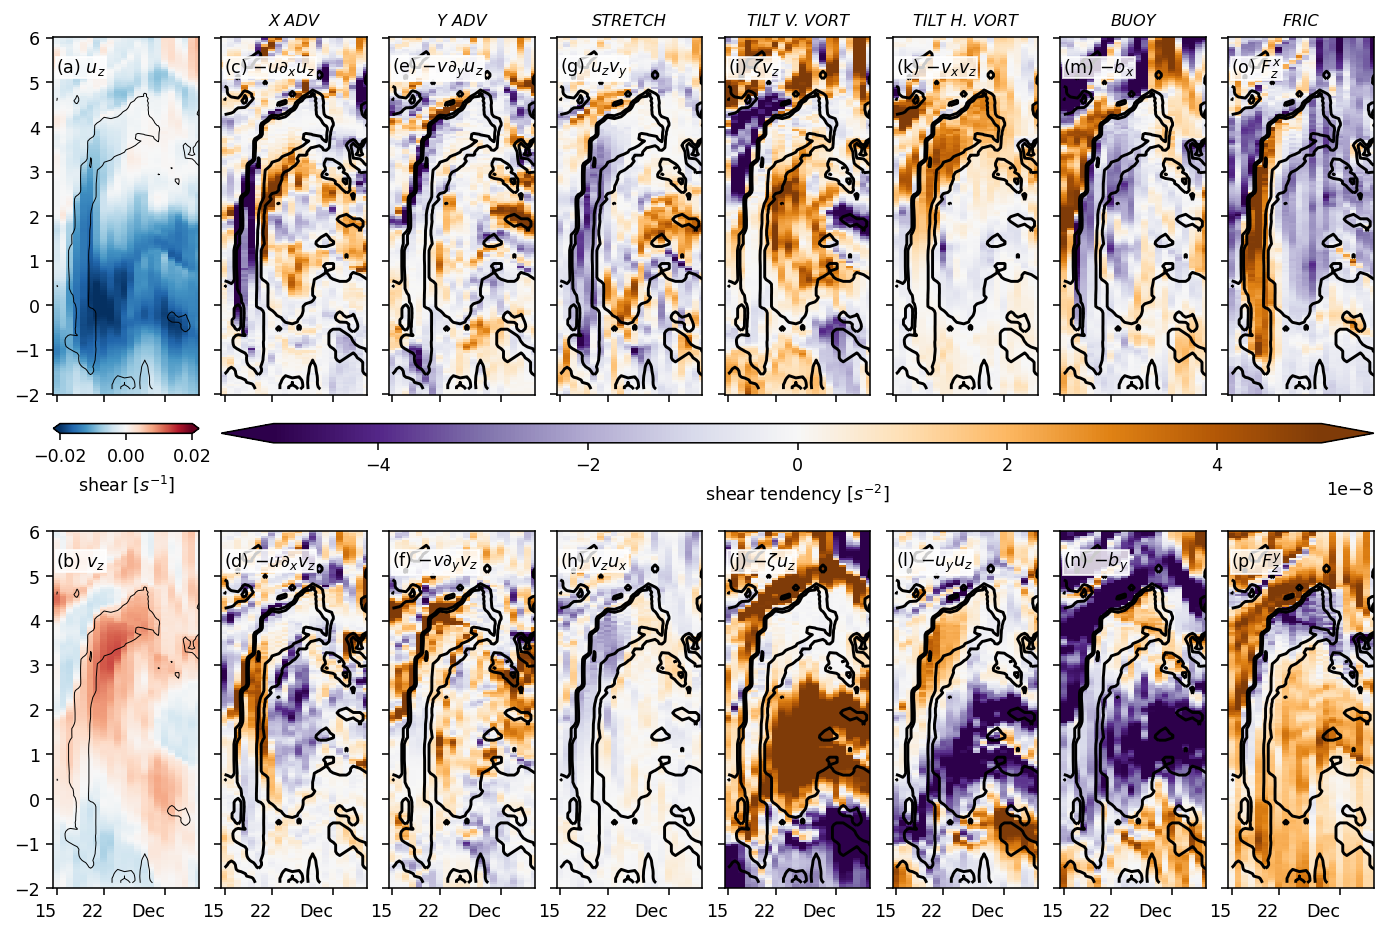
state.v.sel(
latitude=slice(-2, 2),
depth=slice(-80),
longitude=slice(-125, -95),
time=slice("1999-11-09", "2000-01-01"),
).mean(["depth", "latitude"]).plot(x="longitude", robust=True)
pump.plot.plot_reference_speed(plt.gca())
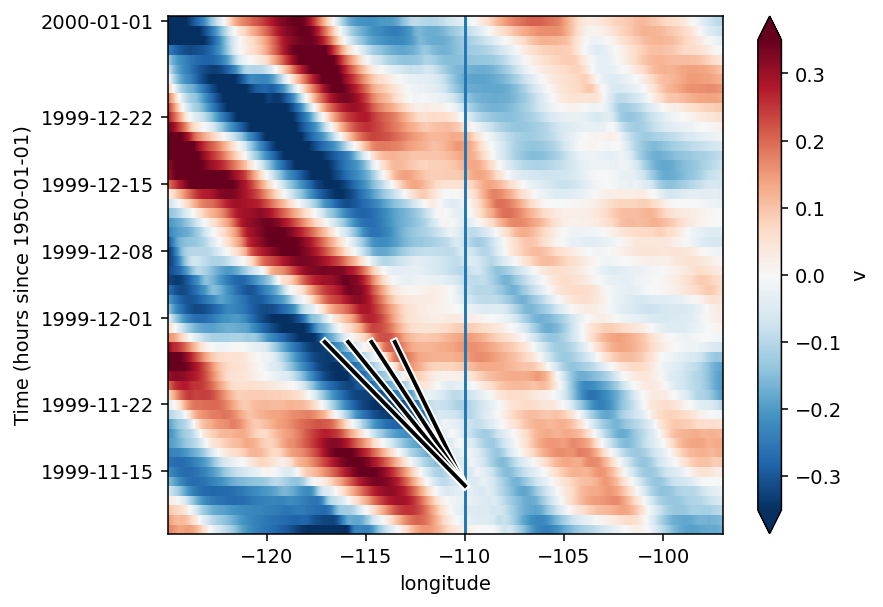
pump.plot.vor_streamplot(period, pump.calc.vorticity(period), stride=2, refspeed=0.3)
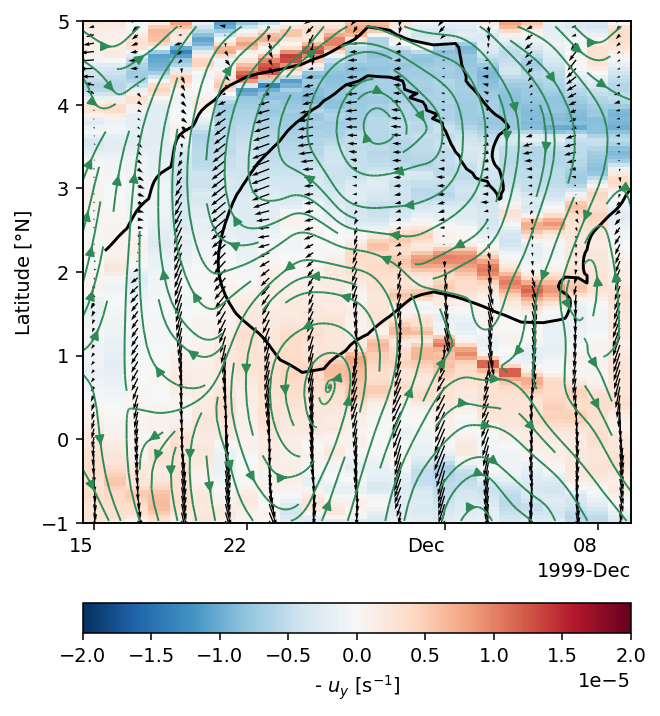
(subset(budget.Vm_Impl)).differentiate("depth").sel(depth=slice(-60)).mean(
"depth"
).plot(x="time", vmin=-5e-8, cmap=mpl.cm.RdBu_r)
subset(state.v.differentiate("depth")).sel(depth=slice(-60)).mean("depth").plot.contour(
colors="k", levels=15, x="time", robust=True
)
<matplotlib.contour.QuadContourSet at 0x2b7f9adf5ed0>
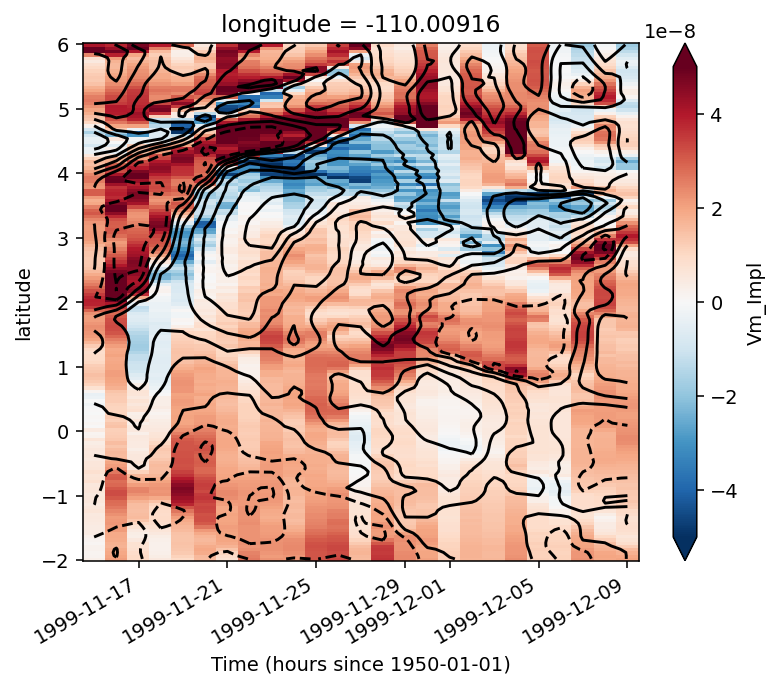
subset(state).theta.isel(depth=0).plot.contourf(levels=21, x="time", robust=True)
<matplotlib.contour.QuadContourSet at 0x2b6e1e7b4190>
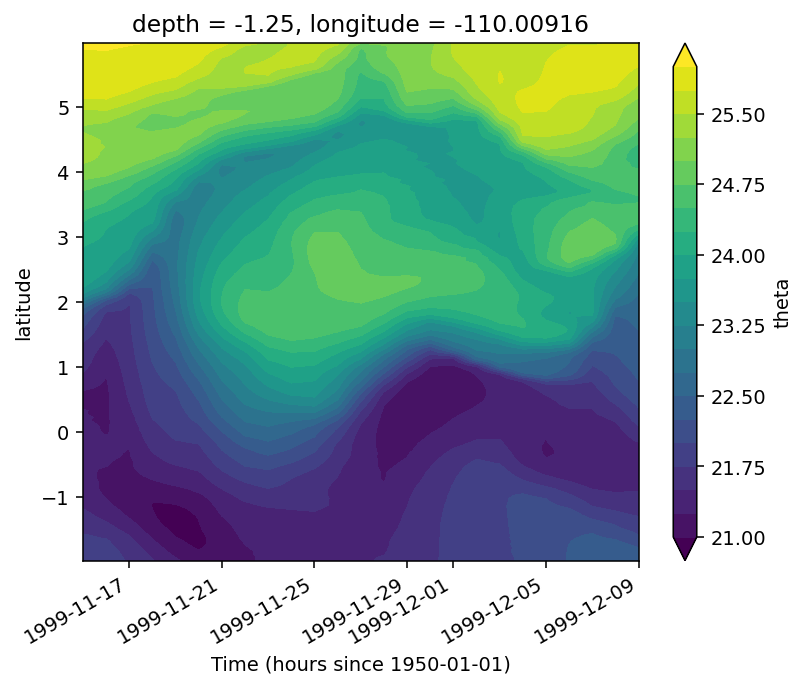
subset(ubvb).VISrI_Vm.sel(latitude=0, method="nearest").sel(depth=slice(-100)).plot(
y="depth", robust=True
)
<matplotlib.collections.QuadMesh at 0x2b6e62631090>
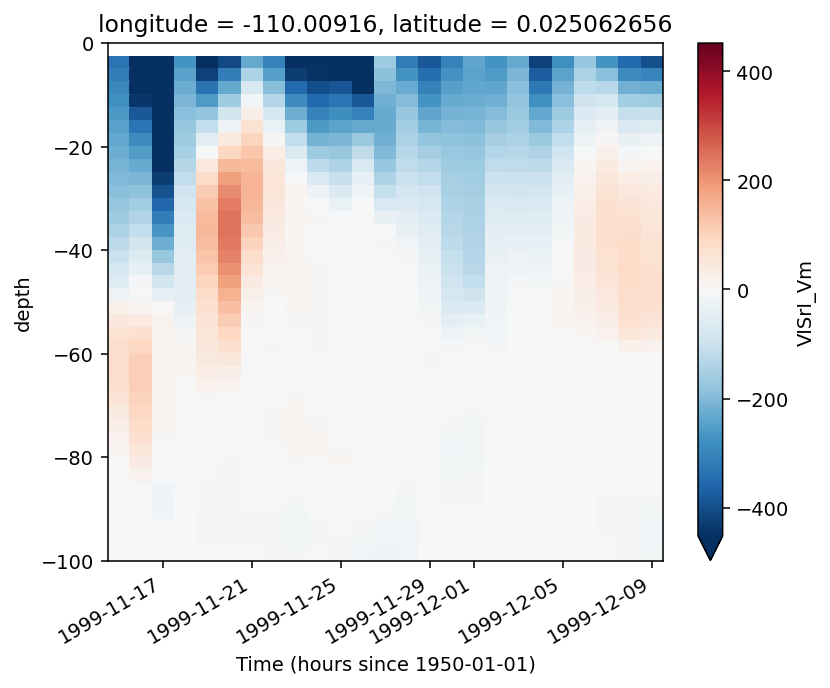
subset(ubvb).Vm_Diss.differentiate("depth").sel(depth=slice(-60)).mean("depth").plot(
x="time", robust=True
)
<matplotlib.collections.QuadMesh at 0x2b6e2c134c90>
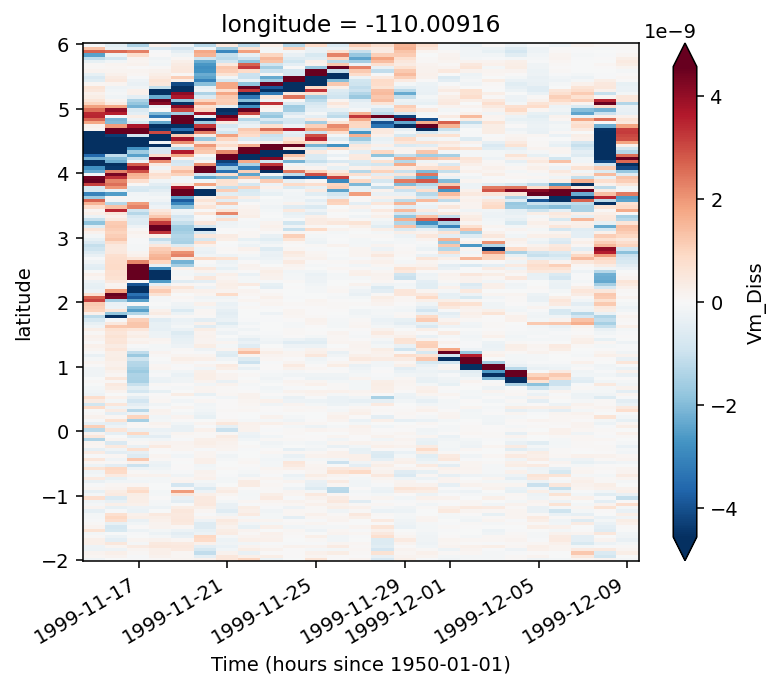
forcing = pump.obs.interp_jra_to_station(jrafull, station)
fluxes, coare = pump.calc.coare_fluxes_jra(station, forcing)
station = station.merge(fluxes, compat="override")
station = station.merge(coare, compat="override")
station = station.merge(forcing, compat="override")
/glade/u/home/dcherian/python/xcoare/xcoare/coare35vn.py:466: RuntimeWarning: invalid value encountered in greater
k = u10 > umax
/glade/u/home/dcherian/python/xcoare/xcoare/coare35vn.py:480: RuntimeWarning: invalid value encountered in greater
charn = np.where(ut > 0, 0.011 + (ut - 10) / (18 - 10) * (0.018 - 0.011), 0.011)
/glade/u/home/dcherian/python/xcoare/xcoare/coare35vn.py:481: RuntimeWarning: invalid value encountered in greater
charn[ut > 18] = 0.018
fluxes.netflux.sel(latitude=0, method="nearest").isel(time=slice(1000)).plot(x="time")
[<matplotlib.lines.Line2D at 0x2b0a34394400>]
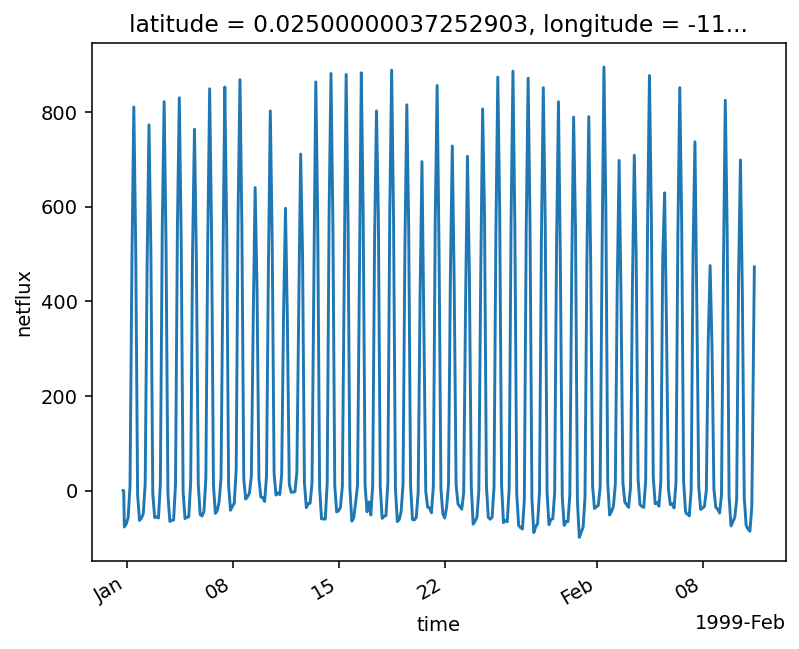
deep cycle plots#
def hvplot_dcl(subset):
flx = subset.netflux.hvplot()
S2 = subset.S2.hvplot(cmap="fire")
N2 = subset.N2.hvplot()
jq = subset.Jq.hvplot.image(x="time")
lines = (
subset.mld.hvplot(color="darkorange", line_style="--", line_width=3)
* (-1 * subset.KPPhbl).hvplot(x="time", color="w", line_width=4)
* (-1 * subset.KPPhbl).hvplot(x="time", color="k", line_width=2)
* subset.dcl_base.hvplot(color="k", line_width=2)
* (-1 * subset.Jq).hvplot.contour(
levels=17, colormap=["black"], line_width=0.5, x="time"
)
)
layout = flx + S2 * lines + N2 * lines + jq * lines
return (layout).opts(shared_axes=True, transpose=True)
hvplot_dcl(station)
WARNING:param.Image03702: Image dimension latitude is not evenly sampled to relative tolerance of 0.001. Please use the QuadMesh element for irregularly sampled data or set a higher tolerance on hv.config.image_rtol or the rtol parameter in the Image constructor.
WARNING:param.Image03702: Image dimension latitude is not evenly sampled to relative tolerance of 0.001. Please use the QuadMesh element for irregularly sampled data or set a higher tolerance on hv.config.image_rtol or the rtol parameter in the Image constructor.
WARNING:param.Image03702: Image dimension latitude is not evenly sampled to relative tolerance of 0.001. Please use the QuadMesh element for irregularly sampled data or set a higher tolerance on hv.config.image_rtol or the rtol parameter in the Image constructor.
---------------------------------------------------------------------------
AttributeError Traceback (most recent call last)
<ipython-input-217-d4f5524c1d25> in <module>
21
22
---> 23 hvplot_dcl(station)
<ipython-input-217-d4f5524c1d25> in hvplot_dcl(subset)
2
3 flx = subset.netflux.hvplot()
----> 4 S2 = subset.S2.hvplot(cmap="fire")
5 N2 = subset.N2.hvplot()
6 jq = subset.Jq.hvplot.image(x="time")
~/miniconda3/envs/dcpy2/lib/python3.7/site-packages/xarray/core/common.py in __getattr__(self, name)
231 return source[name]
232 raise AttributeError(
--> 233 "{!r} object has no attribute {!r}".format(type(self).__name__, name)
234 )
235
AttributeError: 'Dataset' object has no attribute 'S2'
subset = station.sel(latitude=0, method="nearest").sel(
depth=slice(-60), time=slice("1999-01-10", "1999-01-11")
)
pump.plot.plot_dcl(subset)
calc uz
calc vz
calc S2
calc N2
calc shred2
Calc Ri
(<Figure size 1120x1120 with 8 Axes>,
array([[<matplotlib.axes._subplots.AxesSubplot object at 0x2b82520a0a90>],
[<matplotlib.axes._subplots.AxesSubplot object at 0x2b825301af50>],
[<matplotlib.axes._subplots.AxesSubplot object at 0x2b8251bb0c10>],
[<matplotlib.axes._subplots.AxesSubplot object at 0x2b82520d88d0>]],
dtype=object))
/glade/u/home/dcherian/miniconda3/envs/dcpy2/lib/python3.7/site-packages/matplotlib/colors.py:1171: RuntimeWarning: invalid value encountered in less_equal
mask |= resdat <= 0
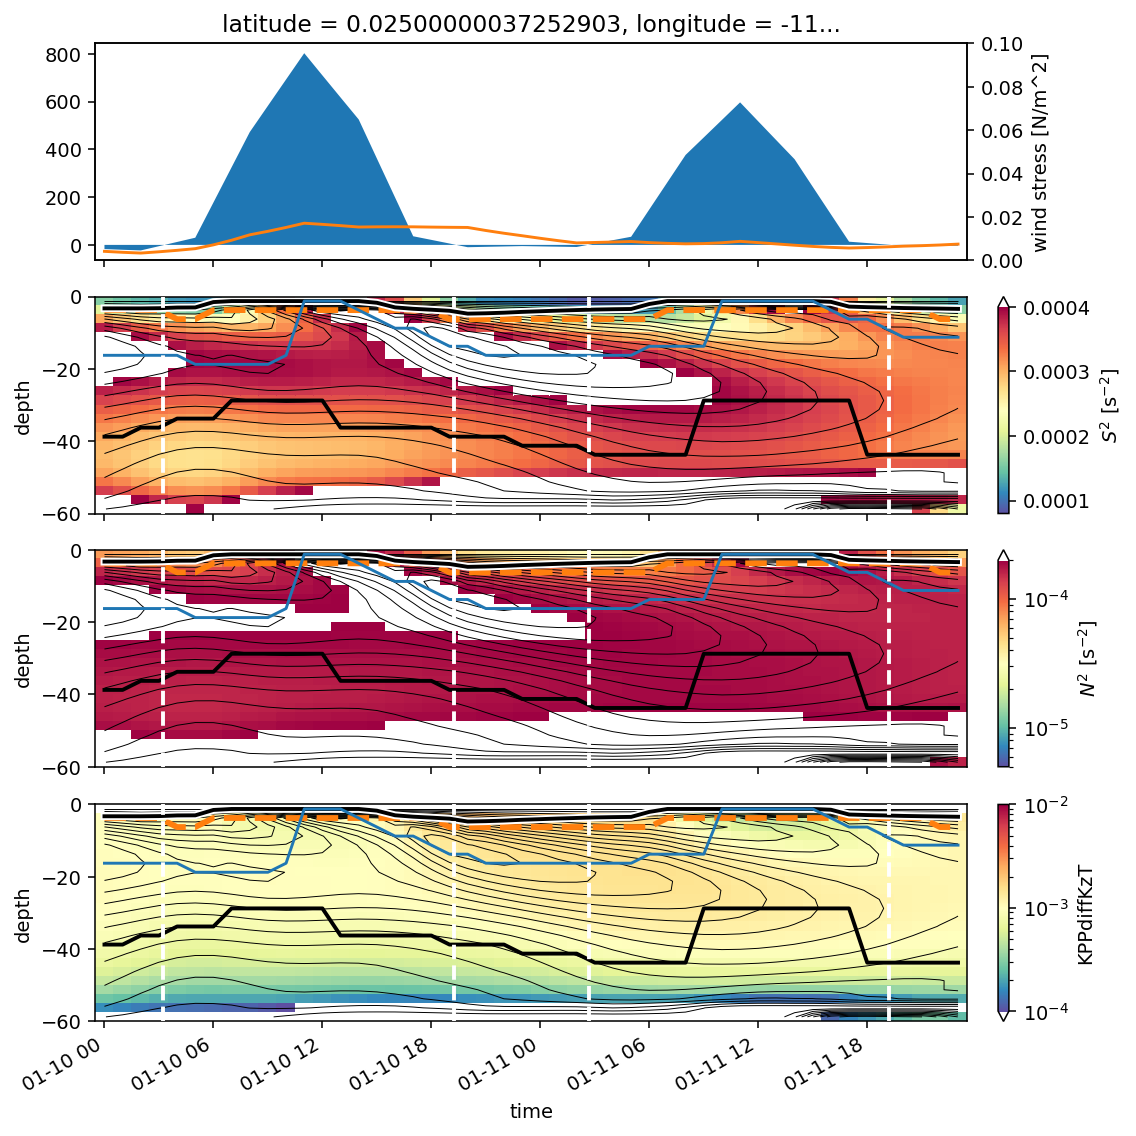
subset = station.sel(latitude=0, method="nearest").sel(
depth=slice(-60), time=slice("1999-10-13", "1999-10-15")
)
plot_dcl(subset)
calc uz
calc vz
calc S2
calc N2
calc shred2
Calc Ri
(<Figure size 1120x1120 with 8 Axes>,
array([[<matplotlib.axes._subplots.AxesSubplot object at 0x2b213b692dd8>],
[<matplotlib.axes._subplots.AxesSubplot object at 0x2b21c0401c50>],
[<matplotlib.axes._subplots.AxesSubplot object at 0x2b2182f40518>],
[<matplotlib.axes._subplots.AxesSubplot object at 0x2b213c663240>]],
dtype=object))
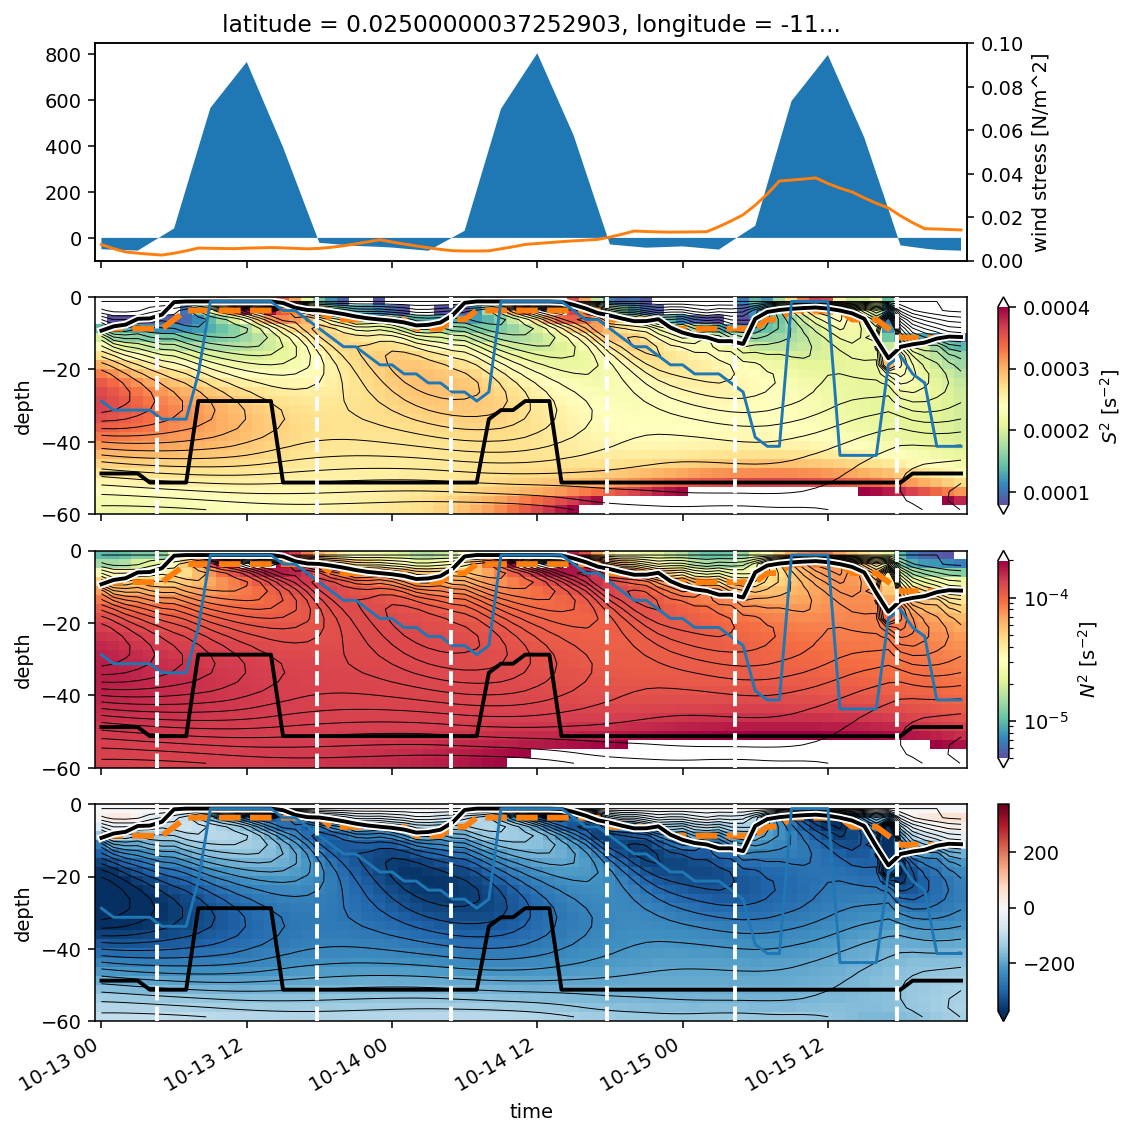
subset = station.sel(latitude=0, method="nearest").sel(
depth=slice(-80), time=slice("1999-03-21 12:00", "1999-03-23 12:00")
)
plot_dcl(subset)
calc uz
calc vz
calc S2
calc N2
calc shred2
Calc Ri
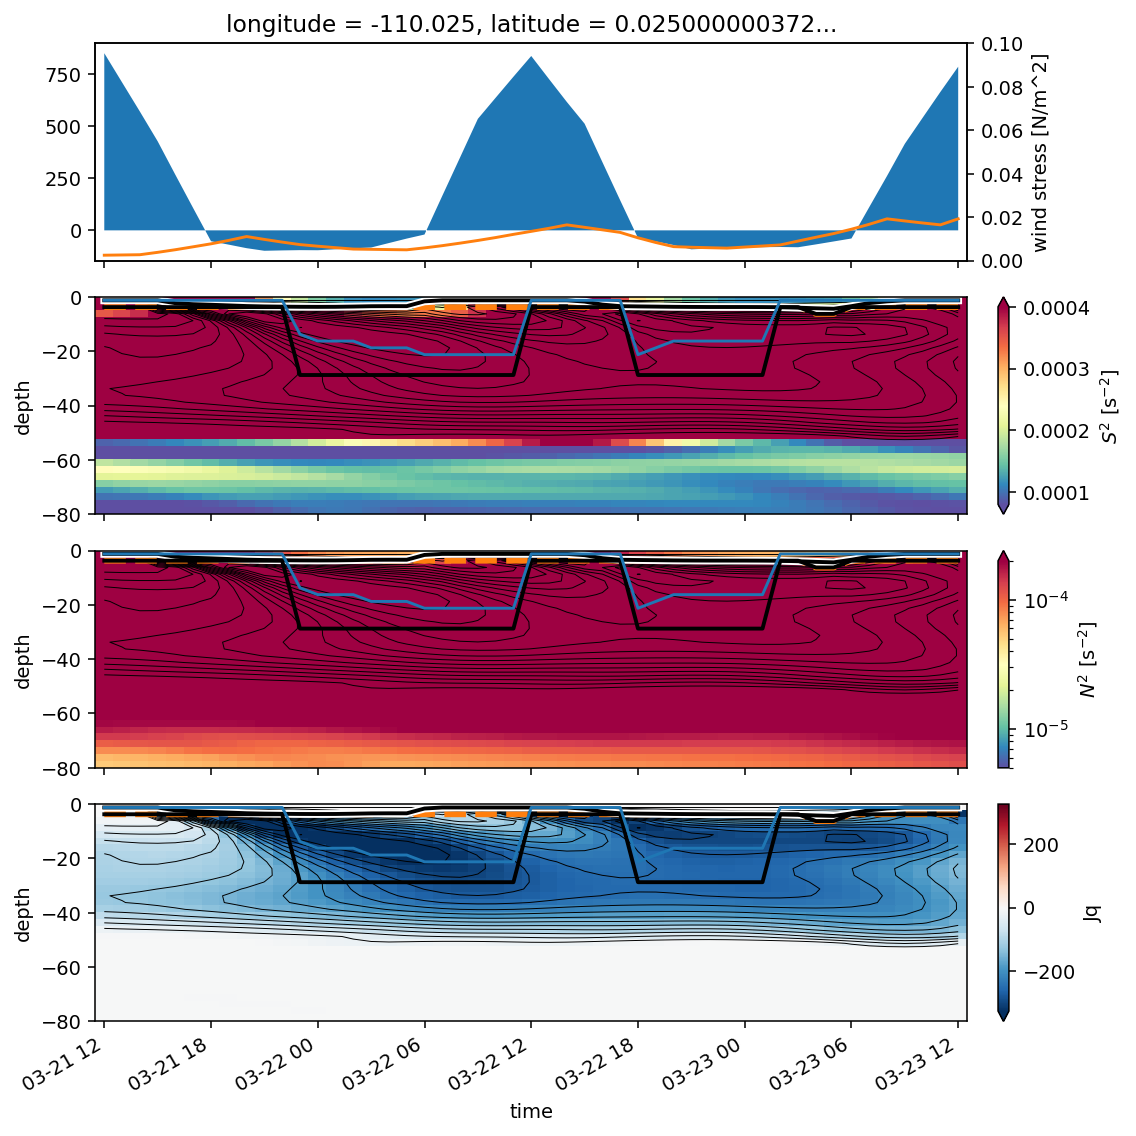
station
<xarray.Dataset>
Dimensions: (depth: 185, latitude: 111, time: 24000)
Coordinates:
* latitude (latitude) float64 -3.075 -3.025 -2.975 ... 5.925 5.975 6.025
* depth (depth) float32 -1.25 -3.75 -6.25 ... -5658.0986 -5758.0986
longitude float32 -110.025
* time (time) datetime64[ns] 1998-12-31T18:00:00 ... 2001-09-26T17:00:00
Data variables:
SSH (time, latitude) float32 dask.array<chunksize=(6000, 1), meta=np.ndarray>
KPPhbl (time, latitude) float32 dask.array<chunksize=(6000, 1), meta=np.ndarray>
u (depth, time, latitude) float32 dask.array<chunksize=(185, 6000, 1), meta=np.ndarray>
v (depth, time, latitude) float32 dask.array<chunksize=(185, 6000, 1), meta=np.ndarray>
w (depth, time, latitude) float32 dask.array<chunksize=(185, 6000, 1), meta=np.ndarray>
theta (depth, time, latitude) float32 dask.array<chunksize=(185, 6000, 1), meta=np.ndarray>
salt (depth, time, latitude) float32 dask.array<chunksize=(185, 6000, 1), meta=np.ndarray>
DFrI_TH (depth, time, latitude) float32 dask.array<chunksize=(185, 6000, 1), meta=np.ndarray>
VISrI_Um (depth, time, latitude) float32 dask.array<chunksize=(185, 6000, 1), meta=np.ndarray>
VISrI_Vm (depth, time, latitude) float32 dask.array<chunksize=(185, 6000, 1), meta=np.ndarray>
KPPdiffKzT (depth, time, latitude) float32 dask.array<chunksize=(185, 6000, 1), meta=np.ndarray>
KPPviscAz (depth, time, latitude) float32 dask.array<chunksize=(185, 6000, 1), meta=np.ndarray>
KPPg_TH (depth, time, latitude) float32 dask.array<chunksize=(185, 6000, 1), meta=np.ndarray>
Jq (depth, time, latitude) float64 dask.array<chunksize=(185, 6000, 1), meta=np.ndarray>
nonlocal_flux (depth, time, latitude) float64 dask.array<chunksize=(185, 6000, 1), meta=np.ndarray>
dens (depth, time, latitude) float32 dask.array<chunksize=(185, 6000, 1), meta=np.ndarray>
long (time, latitude) float64 dask.array<chunksize=(6000, 1), meta=np.ndarray>
short (time, latitude) float64 nan nan nan nan ... nan nan nan nan
sens (time, latitude) float64 dask.array<chunksize=(6000, 1), meta=np.ndarray>
lat (time, latitude) float64 dask.array<chunksize=(6000, 1), meta=np.ndarray>
netflux (time, latitude) float64 dask.array<chunksize=(6000, 1), meta=np.ndarray>
stress (time, latitude) float64 dask.array<chunksize=(6000, 1), meta=np.ndarray>
taux (time, latitude) float64 dask.array<chunksize=(6000, 1), meta=np.ndarray>
tauy (time, latitude) float64 dask.array<chunksize=(6000, 1), meta=np.ndarray>
usr (time, latitude) float64 dask.array<chunksize=(6000, 1), meta=np.ndarray>
tau (time, latitude) float64 dask.array<chunksize=(6000, 1), meta=np.ndarray>
hsb (time, latitude) float64 dask.array<chunksize=(6000, 1), meta=np.ndarray>
hlb (time, latitude) float64 dask.array<chunksize=(6000, 1), meta=np.ndarray>
hbb (time, latitude) float64 dask.array<chunksize=(6000, 1), meta=np.ndarray>
hsbb (time, latitude) float64 dask.array<chunksize=(6000, 1), meta=np.ndarray>
hlwebb (time, latitude) float64 dask.array<chunksize=(6000, 1), meta=np.ndarray>
tsr (time, latitude) float64 dask.array<chunksize=(6000, 1), meta=np.ndarray>
qsr (time, latitude) float64 dask.array<chunksize=(6000, 1), meta=np.ndarray>
zot (time, latitude) float64 dask.array<chunksize=(6000, 1), meta=np.ndarray>
zoq (time, latitude) float64 dask.array<chunksize=(6000, 1), meta=np.ndarray>
Cd (time, latitude) float64 dask.array<chunksize=(6000, 1), meta=np.ndarray>
Ch (time, latitude) float64 dask.array<chunksize=(6000, 1), meta=np.ndarray>
Ce (time, latitude) float64 dask.array<chunksize=(6000, 1), meta=np.ndarray>
L (time, latitude) float64 dask.array<chunksize=(6000, 1), meta=np.ndarray>
zet (time, latitude) float64 dask.array<chunksize=(6000, 1), meta=np.ndarray>
dter (time, latitude) float64 dask.array<chunksize=(6000, 1), meta=np.ndarray>
dqer (time, latitude) float64 dask.array<chunksize=(6000, 1), meta=np.ndarray>
tkt (time, latitude) float64 dask.array<chunksize=(6000, 1), meta=np.ndarray>
Urf (time, latitude) float64 dask.array<chunksize=(6000, 1), meta=np.ndarray>
Trf (time, latitude) float64 dask.array<chunksize=(6000, 1), meta=np.ndarray>
Qrf (time, latitude) float64 dask.array<chunksize=(6000, 1), meta=np.ndarray>
RHrf (time, latitude) float64 dask.array<chunksize=(6000, 1), meta=np.ndarray>
UrfN (time, latitude) float64 dask.array<chunksize=(6000, 1), meta=np.ndarray>
Rnl (time, latitude) float64 dask.array<chunksize=(6000, 1), meta=np.ndarray>
Le (time, latitude) float64 dask.array<chunksize=(6000, 1), meta=np.ndarray>
rhoa (time, latitude) float64 dask.array<chunksize=(6000, 1), meta=np.ndarray>
UN (time, latitude) float64 dask.array<chunksize=(6000, 1), meta=np.ndarray>
U10 (time, latitude) float64 dask.array<chunksize=(6000, 1), meta=np.ndarray>
U10N (time, latitude) float64 dask.array<chunksize=(6000, 1), meta=np.ndarray>
Cdn_10 (time, latitude) float64 dask.array<chunksize=(6000, 1), meta=np.ndarray>
Chn_10 (time, latitude) float64 dask.array<chunksize=(6000, 1), meta=np.ndarray>
Cen_10 (time, latitude) float64 dask.array<chunksize=(6000, 1), meta=np.ndarray>
RF (time, latitude) float64 dask.array<chunksize=(6000, 1), meta=np.ndarray>
Qs (time, latitude) float64 dask.array<chunksize=(6000, 1), meta=np.ndarray>
Evap (time, latitude) float64 dask.array<chunksize=(6000, 1), meta=np.ndarray>
T10 (time, latitude) float64 dask.array<chunksize=(6000, 1), meta=np.ndarray>
Q10 (time, latitude) float64 dask.array<chunksize=(6000, 1), meta=np.ndarray>
RH10 (time, latitude) float64 dask.array<chunksize=(6000, 1), meta=np.ndarray>
huss (time, latitude) float64 nan nan nan nan ... nan nan nan nan
psl (time, latitude) float64 nan nan nan nan ... nan nan nan nan
tas (time, latitude) float64 nan nan nan nan ... nan nan nan nan
uas (time, latitude) float64 nan nan nan nan ... nan nan nan nan
vas (time, latitude) float64 nan nan nan nan ... nan nan nan nan
prra (time, latitude) float64 nan nan nan nan ... nan nan nan nan
rlds (time, latitude) float64 nan nan nan nan ... nan nan nan nan
rsds (time, latitude) float64 nan nan nan nan ... nan nan nan nan
Attributes:
title: Station profile, index (i,j)=(1200,240)
easting: longitude
northing: latitudesubset = station.sel(latitude=0, method="nearest").sel(
depth=slice(-50), time=slice("1999-05-19 00:00", "1999-05-22 00:00")
)
pump.plot.plot_dcl(subset)
calc uz
calc vz
calc S2
calc N2
calc shred2
Calc Ri
(<Figure size 1120x1400 with 10 Axes>,
array([[<matplotlib.axes._subplots.AxesSubplot object at 0x2b0a48953e80>],
[<matplotlib.axes._subplots.AxesSubplot object at 0x2b0a4959ceb8>],
[<matplotlib.axes._subplots.AxesSubplot object at 0x2b0a4a728b70>],
[<matplotlib.axes._subplots.AxesSubplot object at 0x2b0a4d50d550>],
[<matplotlib.axes._subplots.AxesSubplot object at 0x2b0a4bde5ef0>]],
dtype=object))
/glade/u/home/dcherian/miniconda3/envs/dcpy/lib/python3.6/site-packages/matplotlib/colors.py:1171: RuntimeWarning: invalid value encountered in less_equal
mask |= resdat <= 0
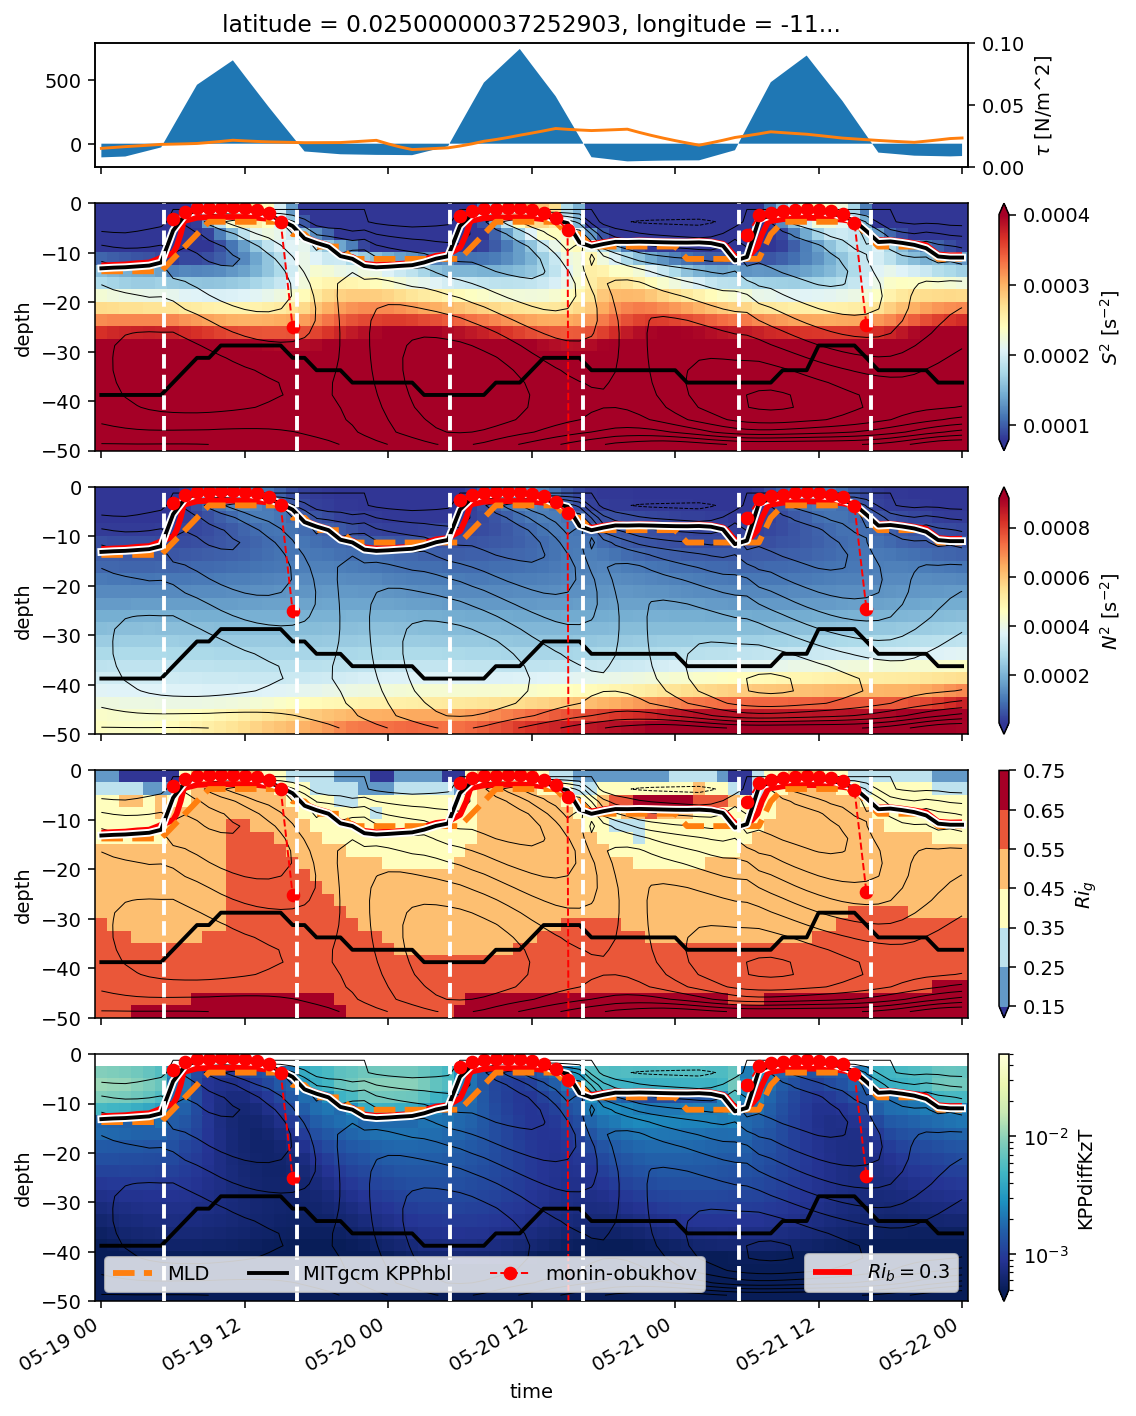
station.sel(latitude=3.5, method="nearest").sel(
depth=slice(-200), time=slice("1999-11-21 00:00", "1999-11-23 00:00")
).to_zarr("nov-1999-station.zarr", consolidated=True)
subset = station.sel(latitude=3.5, method="nearest").sel(
depth=slice(-50), time=slice("1999-11-21 00:00", "1999-11-23 00:00")
)
f, ax = pump.plot.plot_dcl(subset)
ax[0, 0].set_title("(3.5°N, -110°W)")
calc uz
calc vz
calc S2
calc N2
calc shred2
Calc Ri
(<Figure size 1120x1400 with 10 Axes>,
array([[<matplotlib.axes._subplots.AxesSubplot object at 0x2b82ac447410>],
[<matplotlib.axes._subplots.AxesSubplot object at 0x2b82ac711310>],
[<matplotlib.axes._subplots.AxesSubplot object at 0x2b82ae67c950>],
[<matplotlib.axes._subplots.AxesSubplot object at 0x2b82ac715390>],
[<matplotlib.axes._subplots.AxesSubplot object at 0x2b82ac6fec90>]],
dtype=object))
/glade/u/home/dcherian/miniconda3/envs/dcpy2/lib/python3.7/site-packages/matplotlib/colors.py:1171: RuntimeWarning: invalid value encountered in less_equal
mask |= resdat <= 0
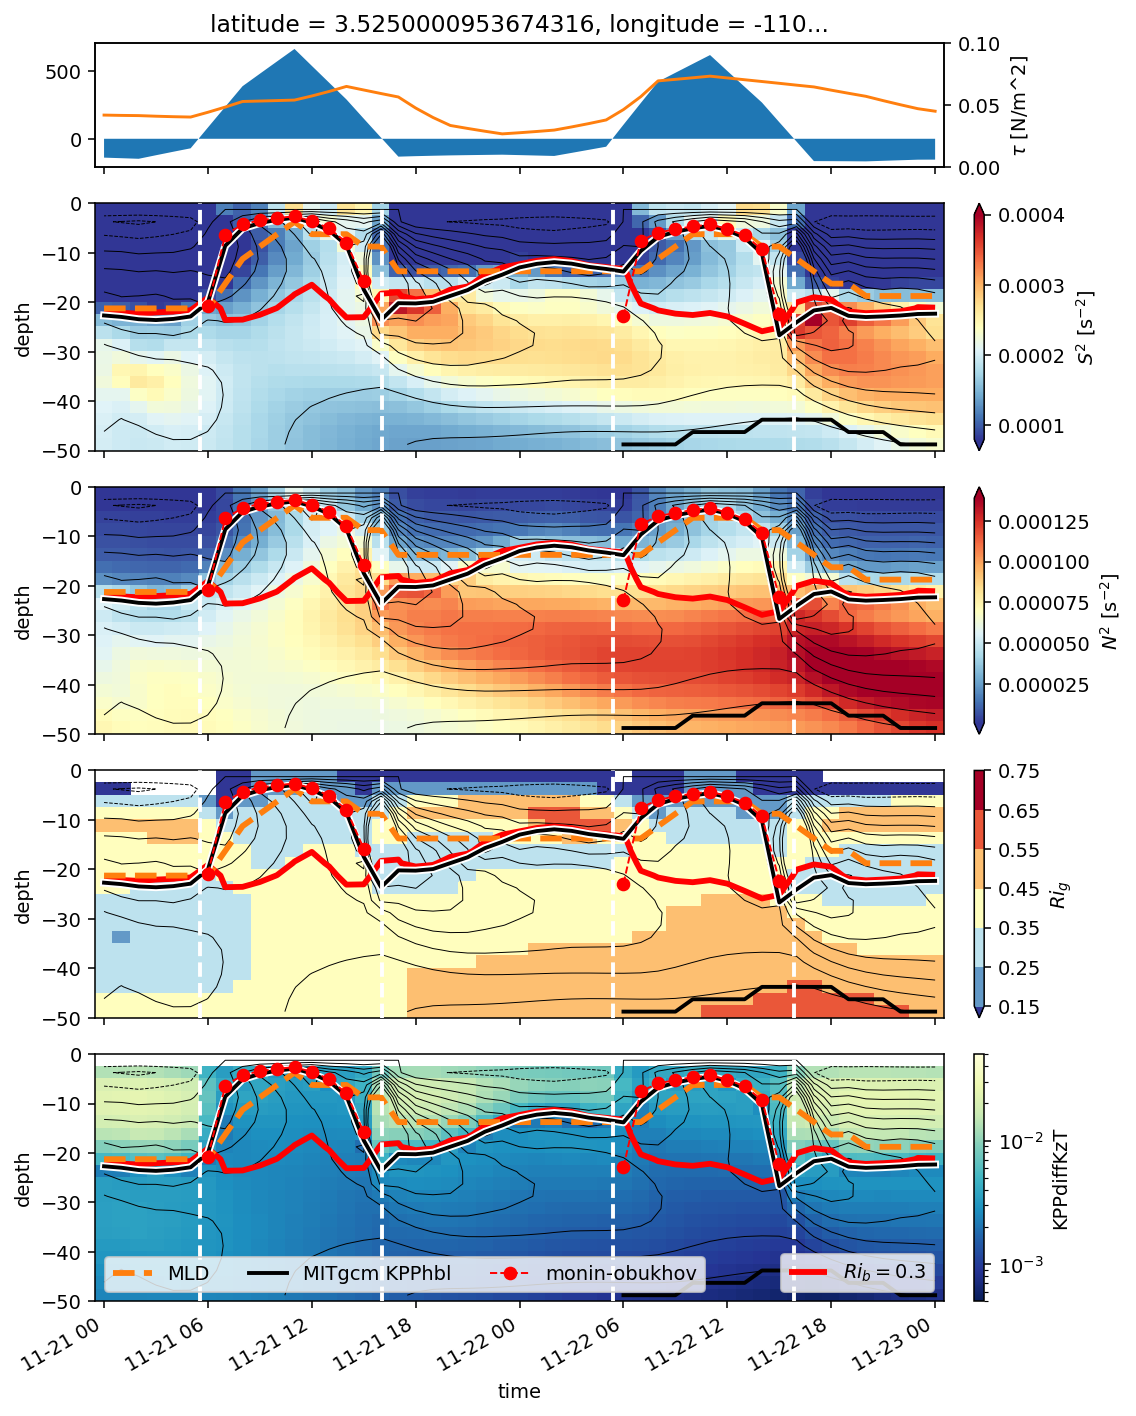
subset = station.sel(latitude=0, method="nearest").sel(
depth=slice(-60), time=slice("1999-05-14 12:00", "1999-05-19 12:00")
)
plot_dcl(subset)
calc uz
calc vz
calc S2
calc N2
calc shred2
Calc Ri
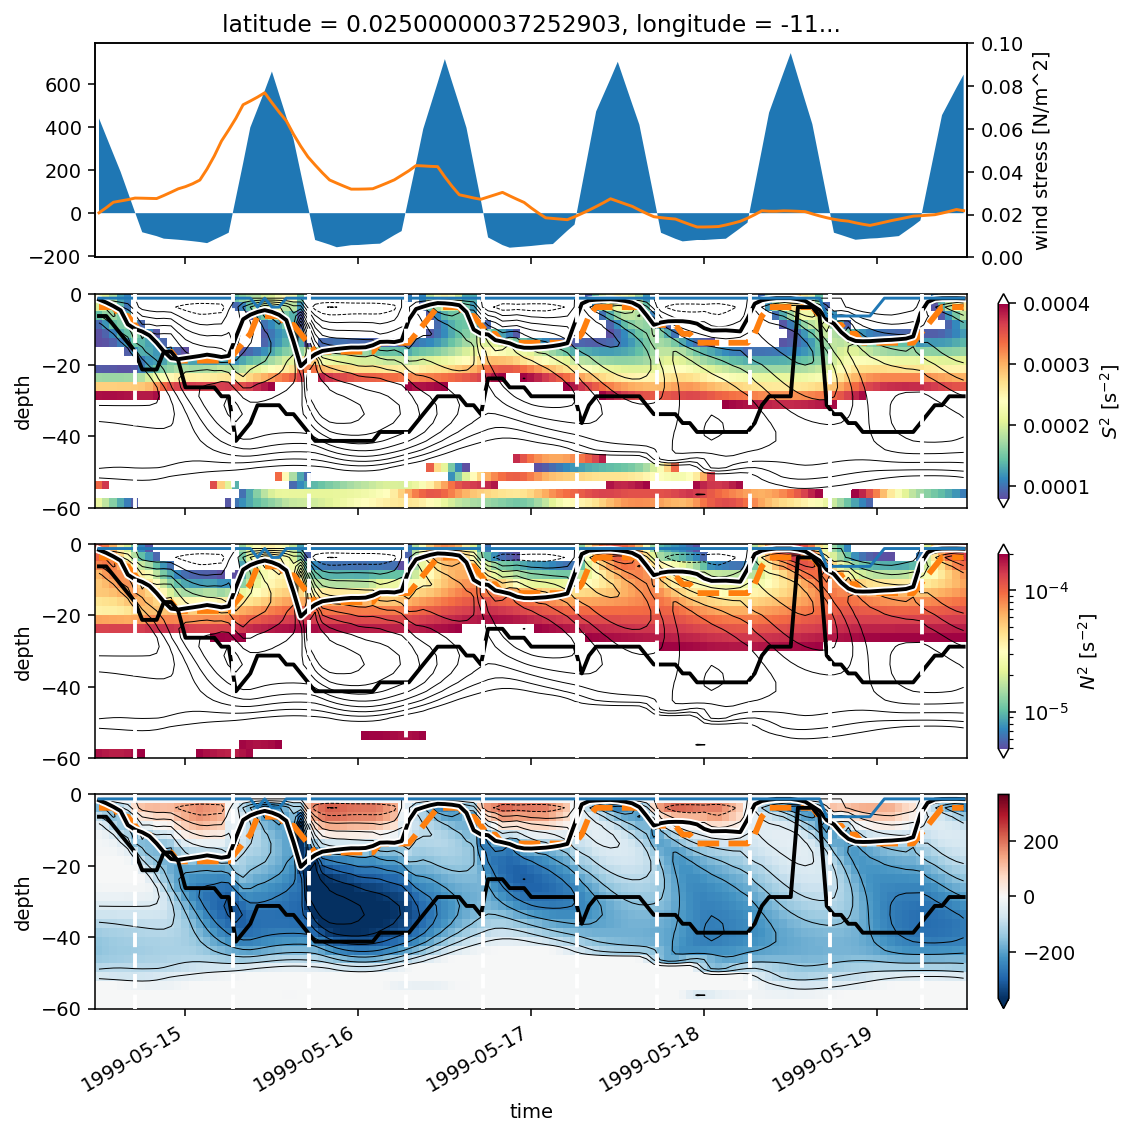
subset = station.sel(latitude=3.5, method="nearest").sel(
depth=slice(-80), time=slice("1999-10-14", "1999-11-14")
)
plot_dcl(subset, shear_max=False, zeros_flux=False, lw=1)
plt.gcf().set_size_inches((10, 8))
---------------------------------------------------------------------------
TypeError Traceback (most recent call last)
<ipython-input-137-49c0a699a7bf> in <module>
1 subset = station.sel(latitude=3.5, method="nearest").sel(depth=slice(-80), time=slice("1999-10-14", "1999-11-14"))
2
----> 3 plot_dcl(subset, shear_max=False, zeros_flux=False, lw=1)
4 plt.gcf().set_size_inches((10,8))
TypeError: plot_dcl() got an unexpected keyword argument 'lw'
station.theta.isel(depth=0).sel(latitude=3.5, method="nearest").sel(
time=slice("1999-12-14", "2000-01-14")
).plot(
x="time",
)
[<matplotlib.lines.Line2D at 0x2b2188d085c0>]
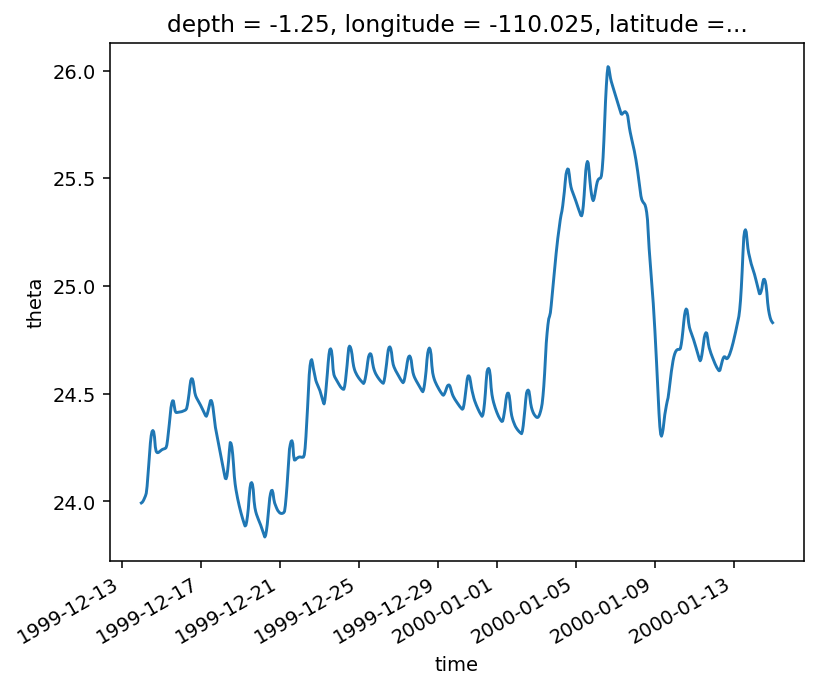
subset = station.sel(latitude=3.5, method="nearest").sel(
depth=slice(-80), time=slice("1999-10-14", "1999-11-14")
)
f, axx = plot_dcl(subset, shear_max=False, lw=1, zeros_flux=False)
f.set_size_inches((11, 8))
calc uz
calc vz
calc S2
calc N2
calc shred2
Calc Ri
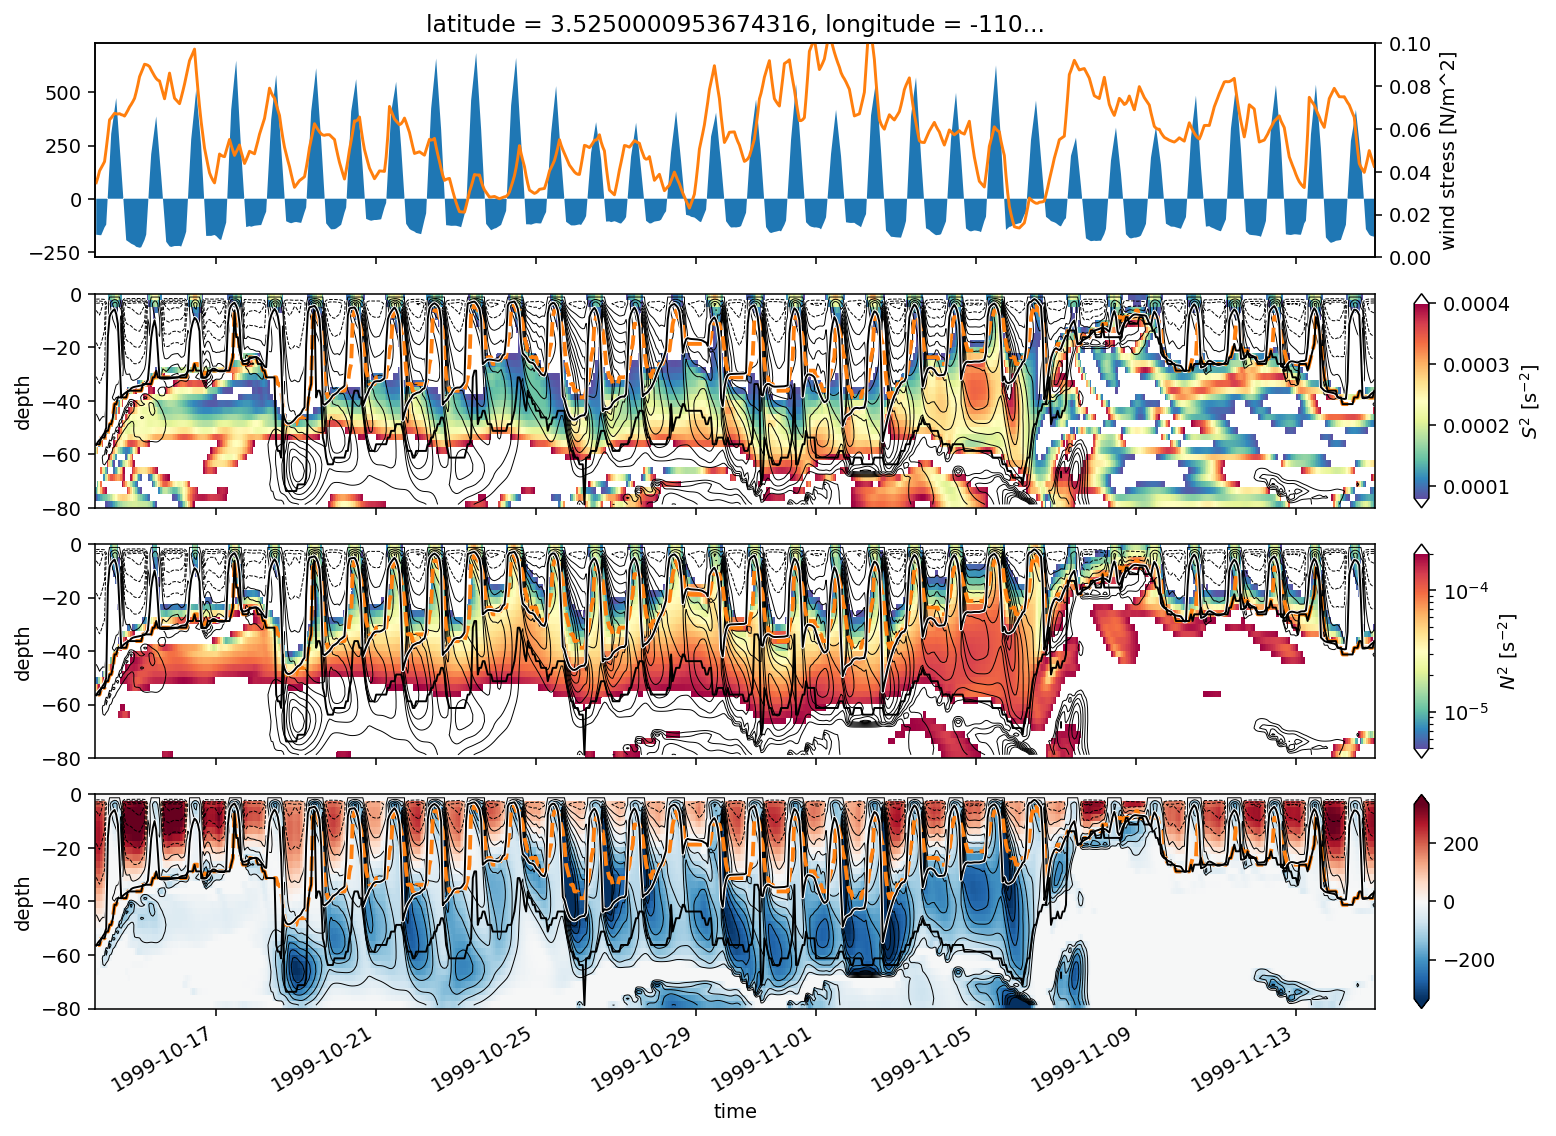
subset = station.sel(latitude=0, method="nearest").sel(
depth=slice(-40), time=slice("1999-10-13 12:00", "1999-10-15 12:00")
)
pump.plot.plot_dcl(subset, shear_max=False)
calc uz
calc vz
calc S2
calc N2
calc shred2
Calc Ri
(<Figure size 1120x1120 with 8 Axes>,
array([[<matplotlib.axes._subplots.AxesSubplot object at 0x2b826d6cf210>],
[<matplotlib.axes._subplots.AxesSubplot object at 0x2b826e5ccfd0>],
[<matplotlib.axes._subplots.AxesSubplot object at 0x2b826e5d7b10>],
[<matplotlib.axes._subplots.AxesSubplot object at 0x2b826e5f3a50>]],
dtype=object))
/glade/u/home/dcherian/miniconda3/envs/dcpy2/lib/python3.7/site-packages/matplotlib/colors.py:1171: RuntimeWarning: invalid value encountered in less_equal
mask |= resdat <= 0
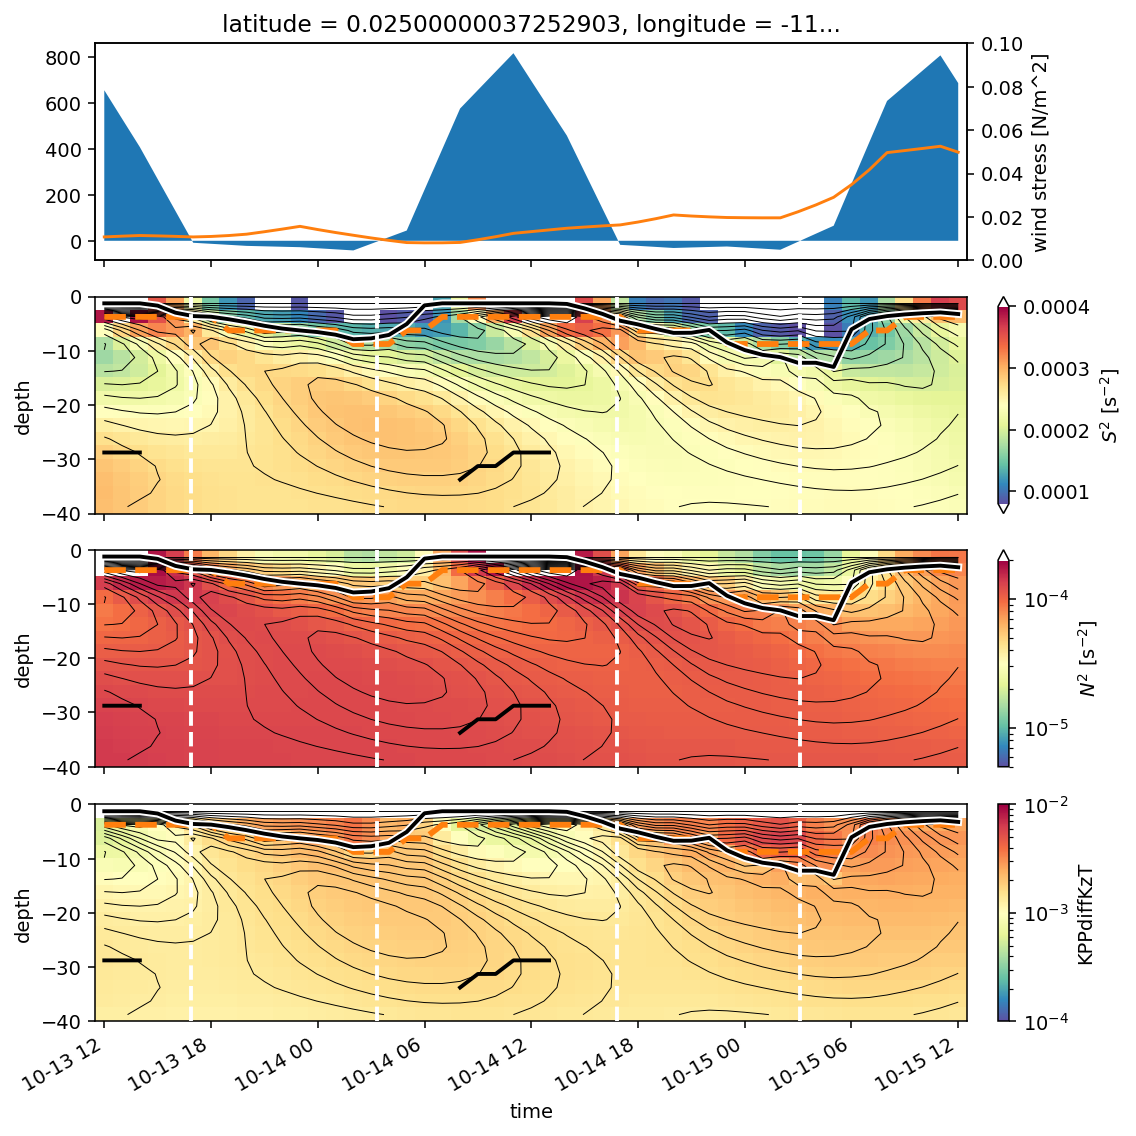
subset = station.sel(
depth=slice(-40), time=slice("1999-05-14 12:00", "1999-05-17 12:00")
)
pump.plot.plot_dcl(subset, shear_max=False)
calc uz
calc vz
calc S2
calc N2
calc shred2
Calc Ri
---------------------------------------------------------------------------
NameError Traceback (most recent call last)
<ipython-input-53-3feb20bb07c2> in <module>
3 )
4
----> 5 pump.plot.plot_dcl(subset, shear_max=False)
~/pump/pump/plot.py in plot_dcl(subset, shear_max, zeros_flux, lw, kpp_terms)
690
691 if kpp_terms:
--> 692 kpp = calc_kpp_hbl(sub)
693
694 f, axx = plt.subplots(
NameError: name 'sub' is not defined
subset = station.sel(latitude=3.5, method="nearest").sel(
depth=slice(-40), time=slice("1999-11-21", "1999-11-22")
)
subset
- depth: 16
- time: 48
- depth(depth)float32-1.25 -3.75 -6.25 ... -36.25 -38.75
array([ -1.25, -3.75, -6.25, -8.75, -11.25, -13.75, -16.25, -18.75, -21.25, -23.75, -26.25, -28.75, -31.25, -33.75, -36.25, -38.75], dtype=float32) - longitude()float32...
array(-110.025, dtype=float32)
- latitude()float643.525
array(3.5250001)
- time(time)datetime64[ns]1999-11-21 ... 1999-11-22T23:00:00
array(['1999-11-21T00:00:00.000000000', '1999-11-21T01:00:00.000000000', '1999-11-21T02:00:00.000000000', '1999-11-21T03:00:00.000000000', '1999-11-21T04:00:00.000000000', '1999-11-21T05:00:00.000000000', '1999-11-21T06:00:00.000000000', '1999-11-21T07:00:00.000000000', '1999-11-21T08:00:00.000000000', '1999-11-21T09:00:00.000000000', '1999-11-21T10:00:00.000000000', '1999-11-21T11:00:00.000000000', '1999-11-21T12:00:00.000000000', '1999-11-21T13:00:00.000000000', '1999-11-21T14:00:00.000000000', '1999-11-21T15:00:00.000000000', '1999-11-21T16:00:00.000000000', '1999-11-21T17:00:00.000000000', '1999-11-21T18:00:00.000000000', '1999-11-21T19:00:00.000000000', '1999-11-21T20:00:00.000000000', '1999-11-21T21:00:00.000000000', '1999-11-21T22:00:00.000000000', '1999-11-21T23:00:00.000000000', '1999-11-22T00:00:00.000000000', '1999-11-22T01:00:00.000000000', '1999-11-22T02:00:00.000000000', '1999-11-22T03:00:00.000000000', '1999-11-22T04:00:00.000000000', '1999-11-22T05:00:00.000000000', '1999-11-22T06:00:00.000000000', '1999-11-22T07:00:00.000000000', '1999-11-22T08:00:00.000000000', '1999-11-22T09:00:00.000000000', '1999-11-22T10:00:00.000000000', '1999-11-22T11:00:00.000000000', '1999-11-22T12:00:00.000000000', '1999-11-22T13:00:00.000000000', '1999-11-22T14:00:00.000000000', '1999-11-22T15:00:00.000000000', '1999-11-22T16:00:00.000000000', '1999-11-22T17:00:00.000000000', '1999-11-22T18:00:00.000000000', '1999-11-22T19:00:00.000000000', '1999-11-22T20:00:00.000000000', '1999-11-22T21:00:00.000000000', '1999-11-22T22:00:00.000000000', '1999-11-22T23:00:00.000000000'], dtype='datetime64[ns]')
- SSH(time)float32dask.array<chunksize=(48,), meta=np.ndarray>
Array Chunk Bytes 192 B 192 B Shape (48,) (48,) Count 2225 Tasks 1 Chunks Type float32 numpy.ndarray - KPPhbl(time)float32dask.array<chunksize=(48,), meta=np.ndarray>
Array Chunk Bytes 192 B 192 B Shape (48,) (48,) Count 2225 Tasks 1 Chunks Type float32 numpy.ndarray - u(depth, time)float32dask.array<chunksize=(16, 48), meta=np.ndarray>
Array Chunk Bytes 3.07 kB 3.07 kB Shape (16, 48) (16, 48) Count 2225 Tasks 1 Chunks Type float32 numpy.ndarray - v(depth, time)float32dask.array<chunksize=(16, 48), meta=np.ndarray>
Array Chunk Bytes 3.07 kB 3.07 kB Shape (16, 48) (16, 48) Count 2225 Tasks 1 Chunks Type float32 numpy.ndarray - w(depth, time)float32dask.array<chunksize=(16, 48), meta=np.ndarray>
Array Chunk Bytes 3.07 kB 3.07 kB Shape (16, 48) (16, 48) Count 2225 Tasks 1 Chunks Type float32 numpy.ndarray - theta(depth, time)float32dask.array<chunksize=(16, 48), meta=np.ndarray>
Array Chunk Bytes 3.07 kB 3.07 kB Shape (16, 48) (16, 48) Count 2225 Tasks 1 Chunks Type float32 numpy.ndarray - salt(depth, time)float32dask.array<chunksize=(16, 48), meta=np.ndarray>
Array Chunk Bytes 3.07 kB 3.07 kB Shape (16, 48) (16, 48) Count 2225 Tasks 1 Chunks Type float32 numpy.ndarray - DFrI_TH(depth, time)float32dask.array<chunksize=(16, 48), meta=np.ndarray>
Array Chunk Bytes 3.07 kB 3.07 kB Shape (16, 48) (16, 48) Count 2225 Tasks 1 Chunks Type float32 numpy.ndarray - VISrI_Um(depth, time)float32dask.array<chunksize=(16, 48), meta=np.ndarray>
Array Chunk Bytes 3.07 kB 3.07 kB Shape (16, 48) (16, 48) Count 2225 Tasks 1 Chunks Type float32 numpy.ndarray - VISrI_Vm(depth, time)float32dask.array<chunksize=(16, 48), meta=np.ndarray>
Array Chunk Bytes 3.07 kB 3.07 kB Shape (16, 48) (16, 48) Count 2225 Tasks 1 Chunks Type float32 numpy.ndarray - KPPdiffKzT(depth, time)float32dask.array<chunksize=(16, 48), meta=np.ndarray>
Array Chunk Bytes 3.07 kB 3.07 kB Shape (16, 48) (16, 48) Count 2225 Tasks 1 Chunks Type float32 numpy.ndarray - KPPviscAz(depth, time)float32dask.array<chunksize=(16, 48), meta=np.ndarray>
Array Chunk Bytes 3.07 kB 3.07 kB Shape (16, 48) (16, 48) Count 2225 Tasks 1 Chunks Type float32 numpy.ndarray - KPPg_TH(depth, time)float32dask.array<chunksize=(16, 48), meta=np.ndarray>
Array Chunk Bytes 3.07 kB 3.07 kB Shape (16, 48) (16, 48) Count 2225 Tasks 1 Chunks Type float32 numpy.ndarray - Jq(depth, time)float64dask.array<chunksize=(16, 48), meta=np.ndarray>
Array Chunk Bytes 6.14 kB 6.14 kB Shape (16, 48) (16, 48) Count 6007 Tasks 1 Chunks Type float64 numpy.ndarray - nonlocal_flux(depth, time)float64dask.array<chunksize=(16, 48), meta=np.ndarray>
Array Chunk Bytes 6.14 kB 6.14 kB Shape (16, 48) (16, 48) Count 3343 Tasks 1 Chunks Type float64 numpy.ndarray - long(time)float64dask.array<chunksize=(48,), meta=np.ndarray>
Array Chunk Bytes 384 B 384 B Shape (48,) (48,) Count 5778 Tasks 1 Chunks Type float64 numpy.ndarray - short(time)float640.0 0.0 0.0 0.0 ... 0.0 0.0 0.0
array([ 0. , 0. , 0. , 0. , 26.67723925, 53.3544785 , 80.03171775, 234.07998805, 388.12825834, 542.17652864, 637.58096106, 732.98539349, 828.38982591, 705.72158814, 583.05335038, 460.38511261, 313.98412565, 167.5831387 , 21.18215175, 14.1214345 , 7.06071725, 0. , 0. , 0. , 0. , 0. , 0. , 0. , 29.58307234, 59.16614469, 88.74921703, 268.283195 , 447.81717296, 627.35115093, 693.29195576, 759.23276058, 825.17356541, 705.6597719 , 586.1459784 , 466.6321849 , 318.92149786, 171.21081082, 23.50012379, 15.66674919, 7.8333746 , 0. , 0. , 0. ]) - sens(time)float64dask.array<chunksize=(48,), meta=np.ndarray>
Array Chunk Bytes 384 B 384 B Shape (48,) (48,) Count 1093602 Tasks 1 Chunks Type float64 numpy.ndarray - lat(time)float64dask.array<chunksize=(48,), meta=np.ndarray>
Array Chunk Bytes 384 B 384 B Shape (48,) (48,) Count 1093602 Tasks 1 Chunks Type float64 numpy.ndarray - random_offset()float64-12.5
array(-12.5)
- netflux(time)float64dask.array<chunksize=(48,), meta=np.ndarray>
Array Chunk Bytes 384 B 384 B Shape (48,) (48,) Count 1108256 Tasks 1 Chunks Type float64 numpy.ndarray - stress(time)float64dask.array<chunksize=(48,), meta=np.ndarray>
- long_name :
- wind stress
- units :
- N/m^2
Array Chunk Bytes 384 B 384 B Shape (48,) (48,) Count 1093158 Tasks 1 Chunks Type float64 numpy.ndarray
- title :
- Station profile, index (i,j)=(1200,240)
- easting :
- longitude
- northing :
- latitude
subset = station.sel(latitude=3.5, method="nearest").sel(
depth=slice(-40), time=slice("1999-11-21", "1999-11-22")
)
f, axx = plot_dcl(subset, shear_max=False, lw=1.5)
calc uz
calc vz
calc S2
calc N2
calc shred2
Calc Ri
/glade/u/home/dcherian/miniconda3/envs/dcpy2/lib/python3.7/site-packages/matplotlib/colors.py:1171: RuntimeWarning: invalid value encountered in less_equal
mask |= resdat <= 0
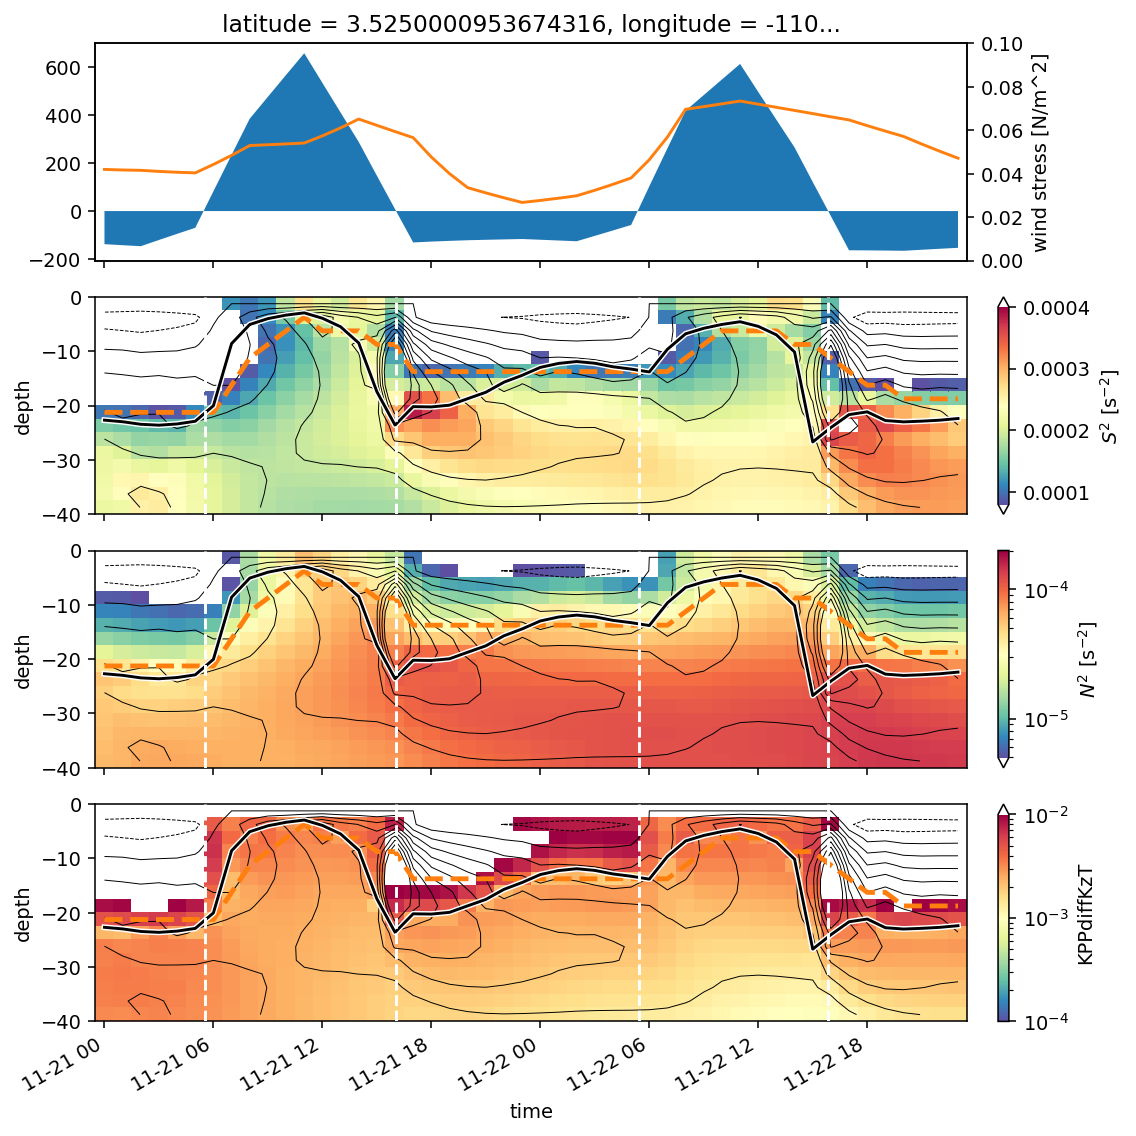
station.sel(latitude=3.5, method="nearest").sel(
time=slice("1999-10-21 11:00", "1999-10-21 18:00"), depth=slice(-100)
).v.plot()
<matplotlib.collections.QuadMesh at 0x2ba0c58020d0>
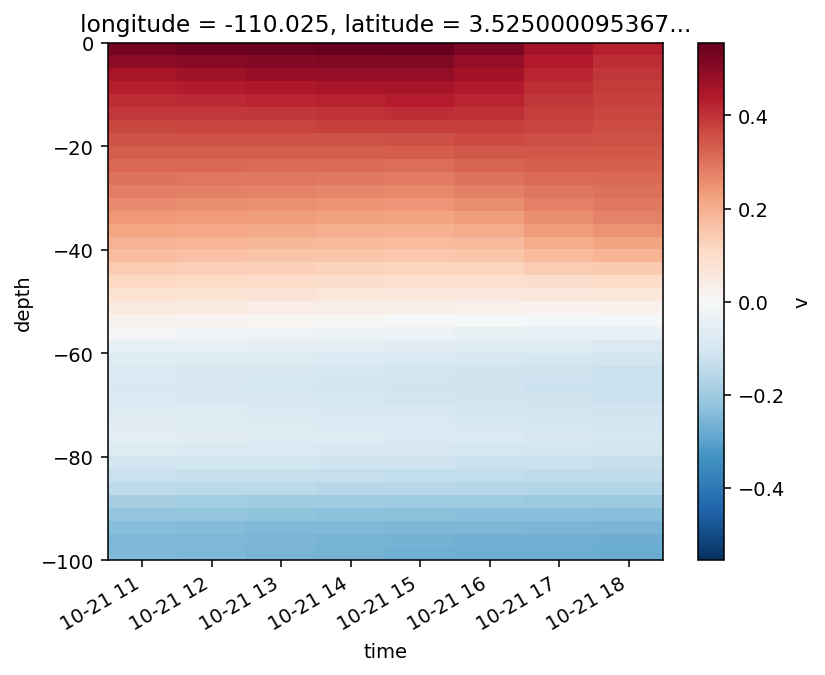
station.sel(latitude=3.5, method="nearest").sel(
time=slice("1999-10-21 11:00", "1999-10-21 18:00"), depth=slice(-100)
).KPPdiffKzT.plot(x="time", robust=True, norm=mpl.colors.LogNorm(1e-5, 5e-3))
<matplotlib.collections.QuadMesh at 0x2ba0c335a3d0>
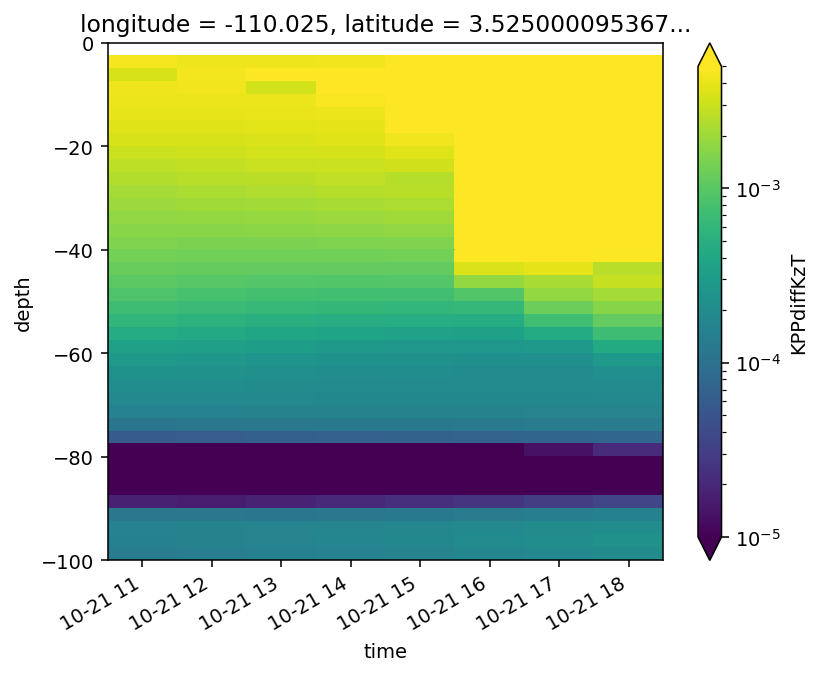
(
station.sel(latitude=3.5, method="nearest")
.sel(time=slice("1999-10-21 11:00", "1999-10-21 18:00"))
.KPPdiffKzT.plot.line(
hue="time", xscale="log", y="depth", ylim=(-100, 0), xlim=(1e-6, None)
)
)
[<matplotlib.lines.Line2D at 0x2ba0c59ba790>,
<matplotlib.lines.Line2D at 0x2ba0c354a110>,
<matplotlib.lines.Line2D at 0x2ba0c2c365d0>,
<matplotlib.lines.Line2D at 0x2ba0c3beee10>,
<matplotlib.lines.Line2D at 0x2ba094f7b290>,
<matplotlib.lines.Line2D at 0x2ba0c4766c90>,
<matplotlib.lines.Line2D at 0x2ba0c4766e50>,
<matplotlib.lines.Line2D at 0x2ba0c4766b90>]
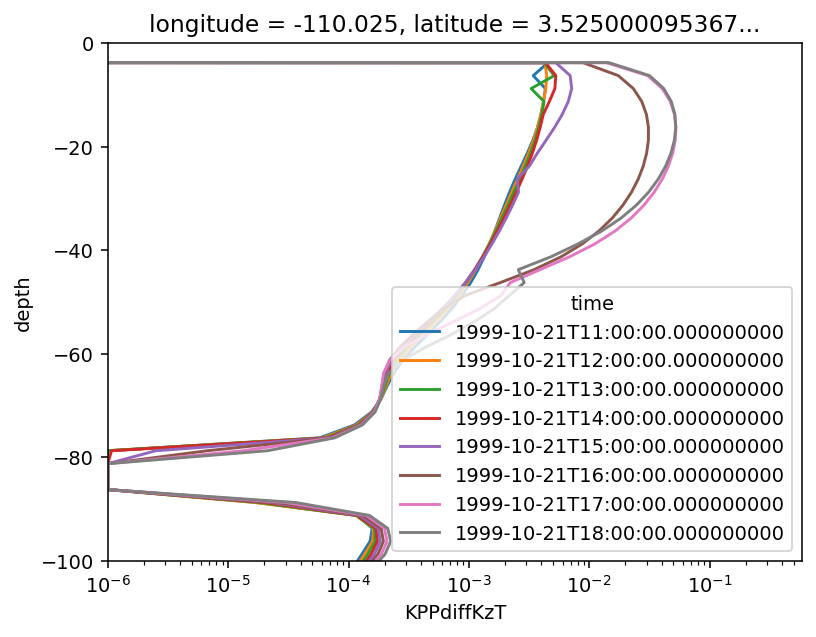
subset = station.sel(latitude=3.5, method="nearest").sel(
depth=slice(-80), time=slice("1999-11-21", "1999-11-22")
)
f, axx = plot_dcl(subset, shear_max=False, lw=1)
axx.flat[-1].set_ylim(-45, 0)
calc uz
calc vz
calc S2
calc N2
calc shred2
Calc Ri
(-45.0, 0.0)
/glade/u/home/dcherian/miniconda3/envs/dcpy2/lib/python3.7/site-packages/matplotlib/colors.py:1171: RuntimeWarning: invalid value encountered in less_equal
mask |= resdat <= 0
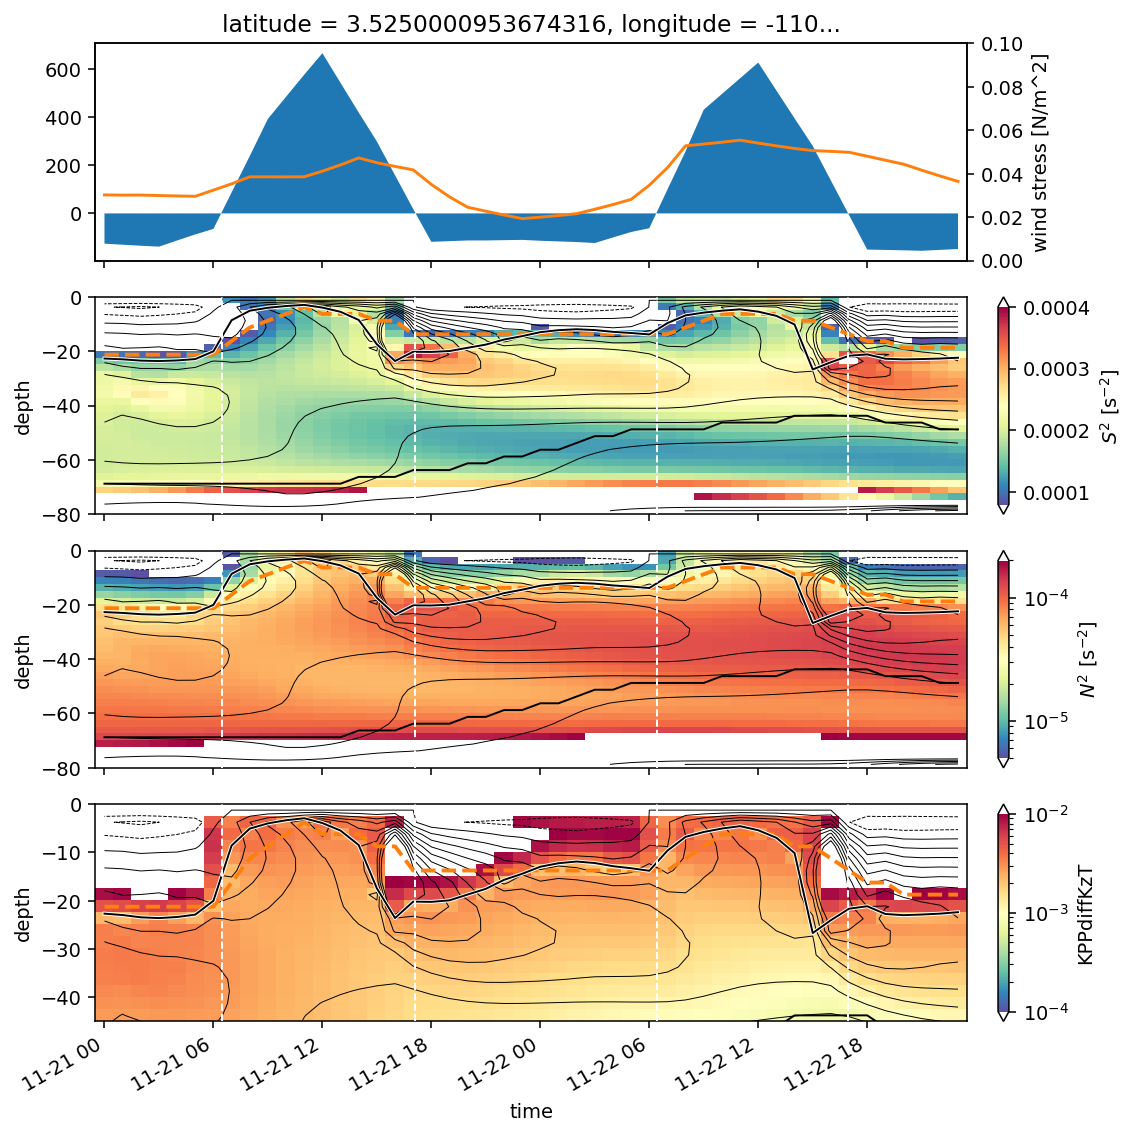
subset.KPPdiffKzT.where(subset.KPPdiffKzT > 0).plot(
x="time", vmin=1e-4, robust=True, norm=mpl.colors.LogNorm(), cmap=mpl.cm.Spectral_r
)
<matplotlib.collections.QuadMesh at 0x2ba4dc5bd910>
/glade/u/home/dcherian/miniconda3/envs/dcpy2/lib/python3.7/site-packages/matplotlib/colors.py:1171: RuntimeWarning: invalid value encountered in less_equal
mask |= resdat <= 0
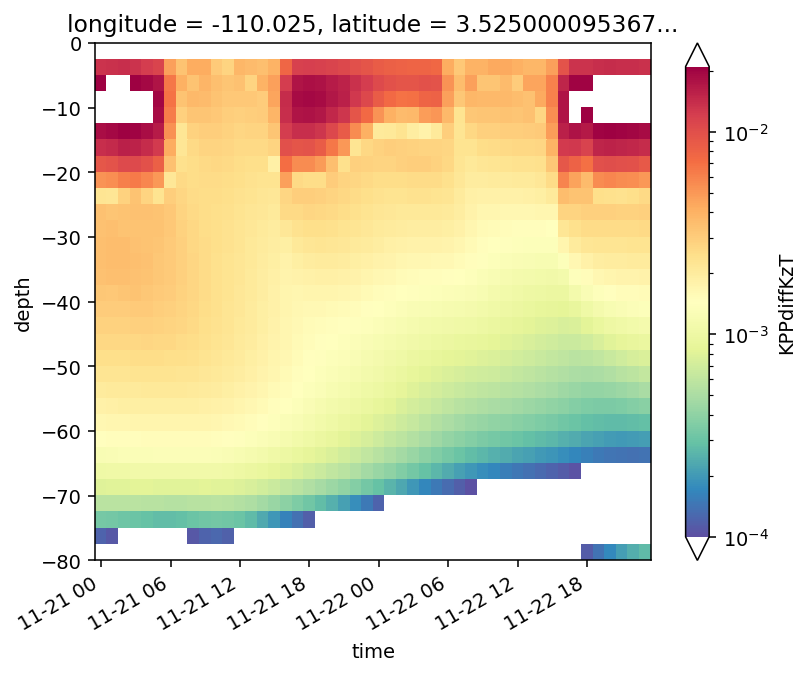
wind = forcing.sel(latitude=3.5, method="nearest").sel(time=subset.time)[
["uas", "vas"]
] # .assign_coords(latitude=xr.full_like(subset.time, 3.5))
quiver(wind.expand_dims("latitude"), u="uas", v="vas", x="time", y="latitude")
quiver(
subset[["u", "v"]].isel(depth=5).expand_dims("latitude").compute(),
u="u",
v="v",
x="time",
y="latitude",
scale=6,
color="r",
)
<matplotlib.quiver.Quiver at 0x2aef0f765690>
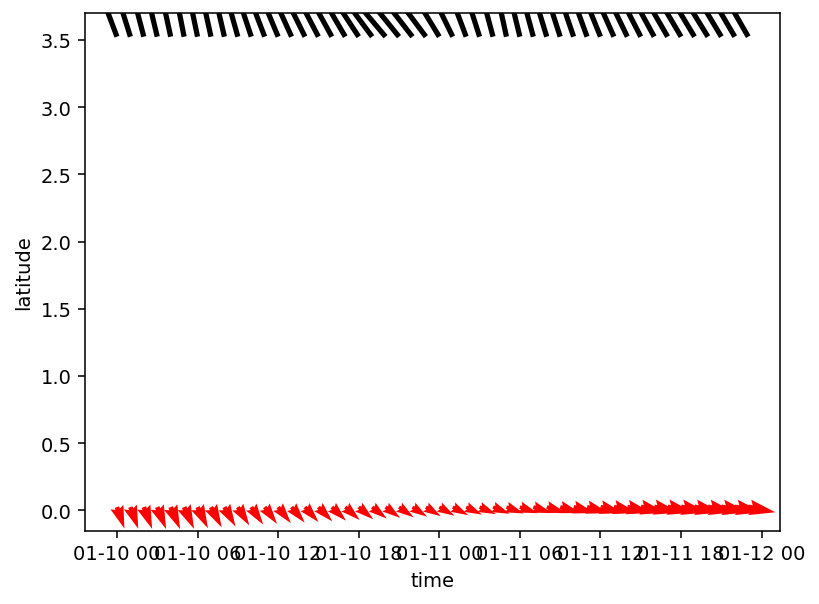
Inferring KPP hbl#
offeq = (
station.sel(latitude=3.5, method="nearest")
.sel(depth=slice(-150), time=slice("1999-11-21", "1999-11-22"))
.pipe(pump.calc_reduced_shear)
)
eq = (
station.sel(latitude=0, method="nearest")
.sel(depth=slice(-150), time=slice("1999-11-21", "1999-11-22"))
.pipe(pump.calc_reduced_shear)
)
calc uz
calc vz
calc S2
calc N2
calc shred2
Calc Ri
calc uz
calc vz
calc S2
calc N2
calc shred2
Calc Ri
subset = eq[
[
"u",
"v",
"theta",
"salt",
"tau",
"usr",
"uas",
"vas",
"netflux",
"short",
"KPPhbl",
"Jq",
"KPPdiffKzT",
"taux",
"tauy",
]
].compute()
subset_o = offeq[
[
"u",
"v",
"theta",
"salt",
"tau",
"usr",
"uas",
"vas",
"netflux",
"short",
"KPPhbl",
"Jq",
"KPPdiffKzT",
"taux",
"tauy",
]
].load()
pump.plot.debug_kpp_plot(subset_o.isel(depth=slice(25), time=slice(240)))
/glade/u/home/dcherian/miniconda3/envs/dcpy2/lib/python3.7/site-packages/xarray/core/computation.py:604: RuntimeWarning: divide by zero encountered in log10
result_data = func(*input_data)
/glade/u/home/dcherian/miniconda3/envs/dcpy2/lib/python3.7/site-packages/xarray/plot/plot.py:906: UserWarning: The following kwargs were not used by contour: 'label'
primitive = ax.contour(x, y, z, **kwargs)
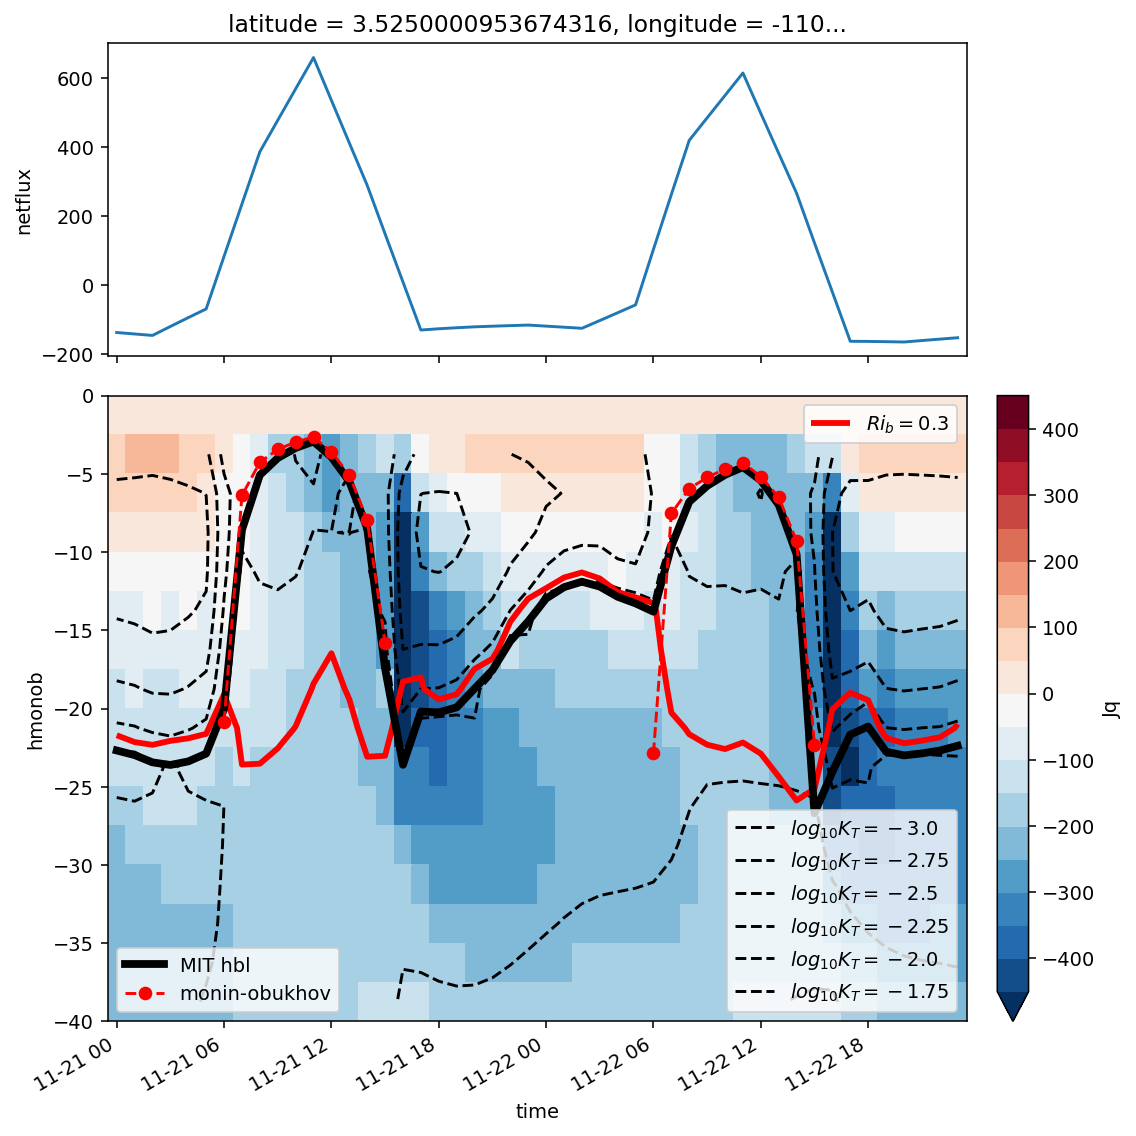
subset = (
station.sel(latitude=0, method="nearest")
.sel(time=slice("1999-05-19", "1999-05-21"))[
[
"u",
"v",
"theta",
"salt",
"tau",
"usr",
"uas",
"vas",
"netflux",
"short",
"KPPhbl",
"Jq",
"KPPdiffKzT",
"taux",
"tauy",
]
]
.load()
)
pump.plot.debug_kpp_plot(subset.sel(depth=slice(-40)))
/glade/u/home/dcherian/miniconda3/envs/dcpy2/lib/python3.7/site-packages/xarray/core/computation.py:604: RuntimeWarning: divide by zero encountered in log10
result_data = func(*input_data)
/glade/u/home/dcherian/miniconda3/envs/dcpy2/lib/python3.7/site-packages/xarray/plot/plot.py:906: UserWarning: The following kwargs were not used by contour: 'label'
primitive = ax.contour(x, y, z, **kwargs)
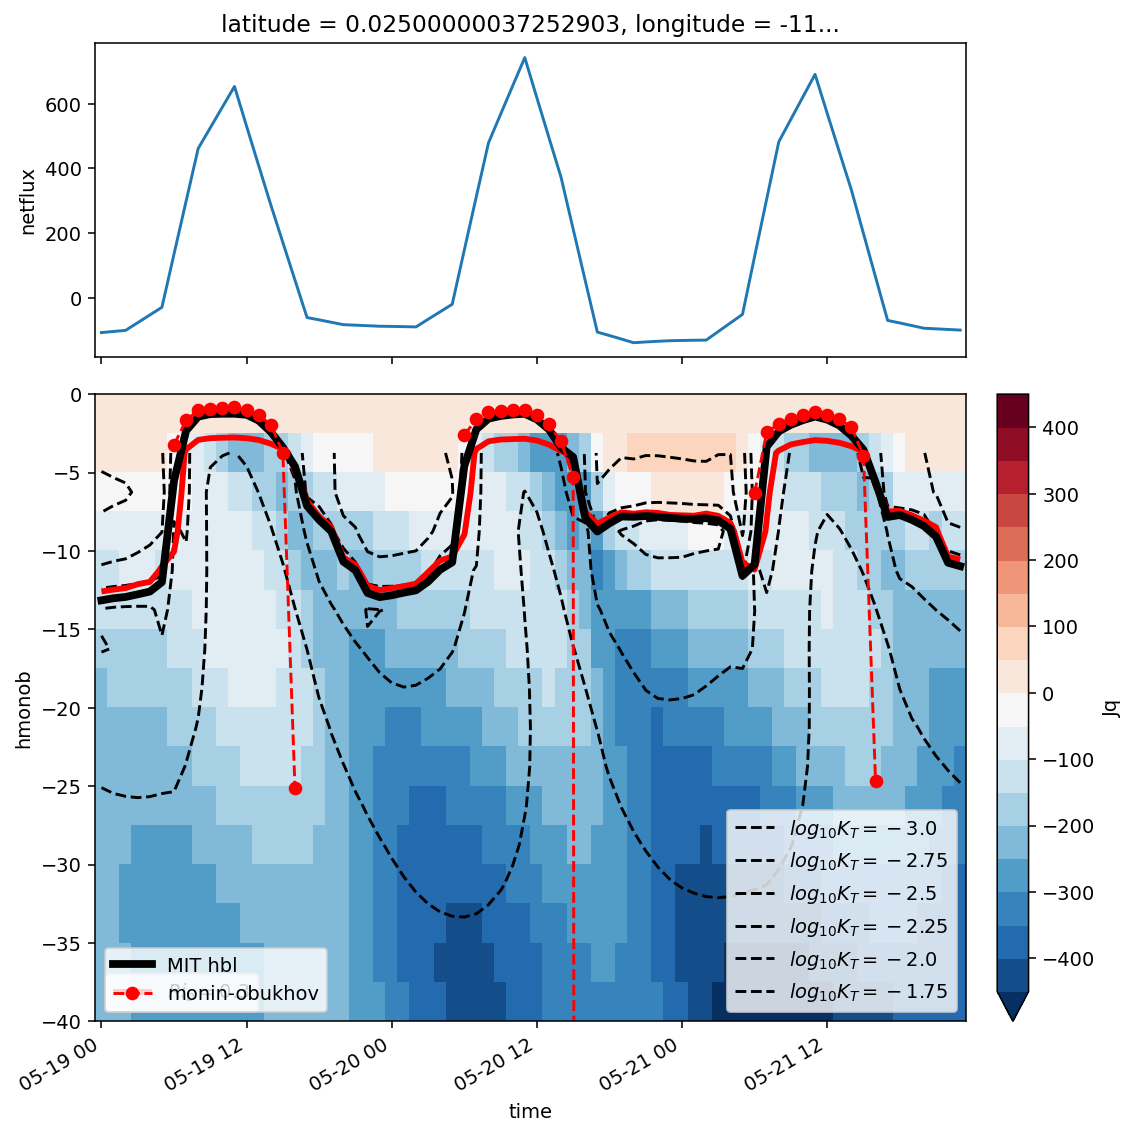
pump.calc.calc_kpp_terms(subset_o.isel(time=slice(120)), debug=False)
21.562137693168097
hbl_top = 23.75, hbl_bottom = 21.25
21.508353306605443
hbl_top = 23.75, hbl_bottom = 21.25
21.645652719144437
hbl_top = 23.75, hbl_bottom = 21.25
21.71008658196208
hbl_top = 23.75, hbl_bottom = 21.25
22.01677270574992
hbl_top = 23.75, hbl_bottom = 21.25
21.948488957295535
hbl_top = 23.75, hbl_bottom = 21.25
22.08246661873677
hbl_top = 23.75, hbl_bottom = 21.25
22.145413632993883
hbl_top = 23.75, hbl_bottom = 21.25
22.195302295606304
hbl_top = 23.75, hbl_bottom = 21.25
22.066310006841196
hbl_top = 23.75, hbl_bottom = 21.25
22.24133188754695
hbl_top = 23.75, hbl_bottom = 21.25
22.323145858177032
hbl_top = 23.75, hbl_bottom = 21.25
22.054759928208135
hbl_top = 23.75, hbl_bottom = 21.25
21.74766525119885
hbl_top = 23.75, hbl_bottom = 21.25
21.96514183635163
hbl_top = 23.75, hbl_bottom = 21.25
22.06654327265203
hbl_top = 23.75, hbl_bottom = 21.25
21.947758413989142
hbl_top = 23.75, hbl_bottom = 21.25
21.63542539179921
hbl_top = 23.75, hbl_bottom = 21.25
21.819160014704995
hbl_top = 23.75, hbl_bottom = 21.25
21.905131451567286
hbl_top = 23.75, hbl_bottom = 21.25
21.675680029445495
hbl_top = 23.75, hbl_bottom = 21.25
21.399447172041846
hbl_top = 23.75, hbl_bottom = 21.25
21.548286334707633
hbl_top = 23.75, hbl_bottom = 21.25
21.61795460845824
hbl_top = 23.75, hbl_bottom = 21.25
20.37833714859105
hbl_top = 21.25, hbl_bottom = 18.75
19.140231830217452
hbl_top = 21.25, hbl_bottom = 18.75
19.096249865203298
hbl_top = 21.25, hbl_bottom = 18.75
23.382178043646125
hbl_top = 23.75, hbl_bottom = 21.25
23.50966158578035
hbl_top = 23.75, hbl_bottom = 21.25
23.585500953976588
hbl_top = 23.75, hbl_bottom = 21.25
23.175004482337314
hbl_top = 23.75, hbl_bottom = 21.25
23.384766310970008
hbl_top = 23.75, hbl_bottom = 21.25
23.528257604716416
hbl_top = 23.75, hbl_bottom = 21.25
22.072581679580615
hbl_top = 23.75, hbl_bottom = 21.25
22.34555184575829
hbl_top = 23.75, hbl_bottom = 21.25
22.547326046697705
hbl_top = 23.75, hbl_bottom = 21.25
20.566370443381764
hbl_top = 21.25, hbl_bottom = 18.75
20.885728731343622
hbl_top = 21.25, hbl_bottom = 18.75
21.135747235870983
hbl_top = 21.25, hbl_bottom = 18.75
17.714394601459023
hbl_top = 18.75, hbl_bottom = 16.25
18.10017036092813
hbl_top = 18.75, hbl_bottom = 16.25
18.414005608084878
hbl_top = 18.75, hbl_bottom = 16.25
15.924321361017425
hbl_top = 16.25, hbl_bottom = 13.75
16.223217566875334
hbl_top = 16.25, hbl_bottom = 13.75
16.467129401164126
hbl_top = 18.75, hbl_bottom = 16.25
19.072772221913507
hbl_top = 21.25, hbl_bottom = 18.75
19.274353175531903
hbl_top = 21.25, hbl_bottom = 18.75
19.40389903137693
hbl_top = 21.25, hbl_bottom = 18.75
23.00510599628578
hbl_top = 23.75, hbl_bottom = 21.25
23.081517310258004
hbl_top = 23.75, hbl_bottom = 21.25
25.29325671831957
hbl_top = 26.25, hbl_bottom = 23.75
23.0226086847083
hbl_top = 23.75, hbl_bottom = 21.25
20.552656354372083
hbl_top = 21.25, hbl_bottom = 18.75
18.28252336519945
hbl_top = 18.75, hbl_bottom = 16.25
18.779560889008007
hbl_top = 21.25, hbl_bottom = 18.75
18.008655349586295
hbl_top = 18.75, hbl_bottom = 16.25
19.280331854438167
hbl_top = 21.25, hbl_bottom = 18.75
19.309814493463044
hbl_top = 21.25, hbl_bottom = 18.75
19.41810992085268
hbl_top = 21.25, hbl_bottom = 18.75
18.85041107862146
hbl_top = 21.25, hbl_bottom = 18.75
18.960659903799932
hbl_top = 21.25, hbl_bottom = 18.75
19.089269173136927
hbl_top = 21.25, hbl_bottom = 18.75
17.199039569411184
hbl_top = 18.75, hbl_bottom = 16.25
17.34087264407167
hbl_top = 18.75, hbl_bottom = 16.25
17.46837905655693
hbl_top = 18.75, hbl_bottom = 16.25
16.576202668448467
hbl_top = 18.75, hbl_bottom = 16.25
16.72000617012054
hbl_top = 18.75, hbl_bottom = 16.25
16.82070902151038
hbl_top = 18.75, hbl_bottom = 16.25
14.311303502352393
hbl_top = 16.25, hbl_bottom = 13.75
14.449883474952593
hbl_top = 16.25, hbl_bottom = 13.75
12.97664444256843
hbl_top = 13.75, hbl_bottom = 11.25
12.308063213597052
hbl_top = 13.75, hbl_bottom = 11.25
11.629846090776118
hbl_top = 13.75, hbl_bottom = 11.25
11.302498463693176
hbl_top = 13.75, hbl_bottom = 11.25
11.689271294818639
hbl_top = 13.75, hbl_bottom = 11.25
12.551872559607364
hbl_top = 13.75, hbl_bottom = 11.25
12.899624972263439
hbl_top = 13.75, hbl_bottom = 11.25
15.320320872532465
hbl_top = 16.25, hbl_bottom = 13.75
13.266098910964843
hbl_top = 13.75, hbl_bottom = 11.25
20.185909412052297
hbl_top = 21.25, hbl_bottom = 18.75
20.263276129684527
hbl_top = 21.25, hbl_bottom = 18.75
21.451838066266646
hbl_top = 23.75, hbl_bottom = 21.25
21.572420735693957
hbl_top = 23.75, hbl_bottom = 21.25
21.646085937821635
hbl_top = 23.75, hbl_bottom = 21.25
22.099115445591085
hbl_top = 23.75, hbl_bottom = 21.25
22.229340914866313
hbl_top = 23.75, hbl_bottom = 21.25
22.312718087711616
hbl_top = 23.75, hbl_bottom = 21.25
22.356680388175935
hbl_top = 23.75, hbl_bottom = 21.25
22.497350973679385
hbl_top = 23.75, hbl_bottom = 21.25
22.591083279557186
hbl_top = 23.75, hbl_bottom = 21.25
21.9087378738579
hbl_top = 23.75, hbl_bottom = 21.25
22.06556794313892
hbl_top = 23.75, hbl_bottom = 21.25
22.173620796320574
hbl_top = 23.75, hbl_bottom = 21.25
22.669471057444387
hbl_top = 23.75, hbl_bottom = 21.25
22.799594958203578
hbl_top = 23.75, hbl_bottom = 21.25
22.8833885305723
hbl_top = 23.75, hbl_bottom = 21.25
24.208945276986924
hbl_top = 26.25, hbl_bottom = 23.75
24.299756917753438
hbl_top = 26.25, hbl_bottom = 23.75
24.353854355505064
hbl_top = 26.25, hbl_bottom = 23.75
25.84316562291642
hbl_top = 26.25, hbl_bottom = 23.75
25.87783520542498
hbl_top = 26.25, hbl_bottom = 23.75
26.962273062442545
hbl_top = 28.75, hbl_bottom = 26.25
25.19759209741487
hbl_top = 26.25, hbl_bottom = 23.75
25.151653710482968
hbl_top = 26.25, hbl_bottom = 23.75
25.130125445174507
hbl_top = 26.25, hbl_bottom = 23.75
21.668189094329772
hbl_top = 23.75, hbl_bottom = 21.25
19.98708492183505
hbl_top = 21.25, hbl_bottom = 18.75
20.045446275133962
hbl_top = 21.25, hbl_bottom = 18.75
19.427630219412183
hbl_top = 21.25, hbl_bottom = 18.75
18.75707976358253
hbl_top = 21.25, hbl_bottom = 18.75
18.9889746172224
hbl_top = 21.25, hbl_bottom = 18.75
19.599299529504425
hbl_top = 21.25, hbl_bottom = 18.75
19.266948848627543
hbl_top = 21.25, hbl_bottom = 18.75
19.47056143556383
hbl_top = 21.25, hbl_bottom = 18.75
21.684969131391153
hbl_top = 23.75, hbl_bottom = 21.25
21.659742256487426
hbl_top = 23.75, hbl_bottom = 21.25
21.808345541212656
hbl_top = 23.75, hbl_bottom = 21.25
21.877846769970848
hbl_top = 23.75, hbl_bottom = 21.25
22.023883452697486
hbl_top = 23.75, hbl_bottom = 21.25
22.034244267607754
hbl_top = 23.75, hbl_bottom = 21.25
22.157669929831194
hbl_top = 23.75, hbl_bottom = 21.25
22.215620204514106
hbl_top = 23.75, hbl_bottom = 21.25
21.831126611702437
hbl_top = 23.75, hbl_bottom = 21.25
21.86102003826511
hbl_top = 23.75, hbl_bottom = 21.25
21.993609792830966
hbl_top = 23.75, hbl_bottom = 21.25
22.05571209633549
hbl_top = 23.75, hbl_bottom = 21.25
21.572837583359252
hbl_top = 23.75, hbl_bottom = 21.25
21.627671765482592
hbl_top = 23.75, hbl_bottom = 21.25
21.772180410250826
hbl_top = 23.75, hbl_bottom = 21.25
21.83976707521497
hbl_top = 23.75, hbl_bottom = 21.25
20.797675805190554
hbl_top = 21.25, hbl_bottom = 18.75
20.703021585772692
hbl_top = 21.25, hbl_bottom = 18.75
20.989311927329435
hbl_top = 21.25, hbl_bottom = 18.75
- depth: 60
- time: 48
- time(time)datetime64[ns]1999-11-21 ... 1999-11-22T23:00:00
array(['1999-11-21T00:00:00.000000000', '1999-11-21T01:00:00.000000000', '1999-11-21T02:00:00.000000000', '1999-11-21T03:00:00.000000000', '1999-11-21T04:00:00.000000000', '1999-11-21T05:00:00.000000000', '1999-11-21T06:00:00.000000000', '1999-11-21T07:00:00.000000000', '1999-11-21T08:00:00.000000000', '1999-11-21T09:00:00.000000000', '1999-11-21T10:00:00.000000000', '1999-11-21T11:00:00.000000000', '1999-11-21T12:00:00.000000000', '1999-11-21T13:00:00.000000000', '1999-11-21T14:00:00.000000000', '1999-11-21T15:00:00.000000000', '1999-11-21T16:00:00.000000000', '1999-11-21T17:00:00.000000000', '1999-11-21T18:00:00.000000000', '1999-11-21T19:00:00.000000000', '1999-11-21T20:00:00.000000000', '1999-11-21T21:00:00.000000000', '1999-11-21T22:00:00.000000000', '1999-11-21T23:00:00.000000000', '1999-11-22T00:00:00.000000000', '1999-11-22T01:00:00.000000000', '1999-11-22T02:00:00.000000000', '1999-11-22T03:00:00.000000000', '1999-11-22T04:00:00.000000000', '1999-11-22T05:00:00.000000000', '1999-11-22T06:00:00.000000000', '1999-11-22T07:00:00.000000000', '1999-11-22T08:00:00.000000000', '1999-11-22T09:00:00.000000000', '1999-11-22T10:00:00.000000000', '1999-11-22T11:00:00.000000000', '1999-11-22T12:00:00.000000000', '1999-11-22T13:00:00.000000000', '1999-11-22T14:00:00.000000000', '1999-11-22T15:00:00.000000000', '1999-11-22T16:00:00.000000000', '1999-11-22T17:00:00.000000000', '1999-11-22T18:00:00.000000000', '1999-11-22T19:00:00.000000000', '1999-11-22T20:00:00.000000000', '1999-11-22T21:00:00.000000000', '1999-11-22T22:00:00.000000000', '1999-11-22T23:00:00.000000000'], dtype='datetime64[ns]') - latitude()float643.525
array(3.5250001)
- longitude()float32-110.025
array(-110.025, dtype=float32)
- depth(depth)float32-1.25 -3.75 ... -146.25 -148.75
array([ -1.25, -3.75, -6.25, -8.75, -11.25, -13.75, -16.25, -18.75, -21.25, -23.75, -26.25, -28.75, -31.25, -33.75, -36.25, -38.75, -41.25, -43.75, -46.25, -48.75, -51.25, -53.75, -56.25, -58.75, -61.25, -63.75, -66.25, -68.75, -71.25, -73.75, -76.25, -78.75, -81.25, -83.75, -86.25, -88.75, -91.25, -93.75, -96.25, -98.75, -101.25, -103.75, -106.25, -108.75, -111.25, -113.75, -116.25, -118.75, -121.25, -123.75, -126.25, -128.75, -131.25, -133.75, -136.25, -138.75, -141.25, -143.75, -146.25, -148.75], dtype=float32)
- hbl(time)float3222.5 22.5 22.5 ... 22.5 22.5 20.0
- units :
- m
- long_name :
- KPP boundary layer depth
array([22.5 , 22.5 , 22.5 , 22.5 , 22.5 , 22.5 , 20. , 6.381697 , 4.263205 , 3.4403372, 2.9695106, 2.6451426, 3.6016703, 5.0653596, 7.9433293, 15.794245 , 17.5 , 17.5 , 20. , 20. , 17.5 , 17.5 , 15. , 12.5 , 12.5 , 12.5 , 12.5 , 12.5 , 12.5 , 12.5 , 12.5 , 7.532503 , 5.94778 , 5.227539 , 4.692258 , 4.279661 , 5.1836925, 6.4958186, 9.302697 , 22.322956 , 20. , 20. , 20. , 22.5 , 22.5 , 22.5 , 22.5 , 20. ], dtype=float32) - hekman(time)float32nan nan nan nan ... nan nan nan nan
- units :
- m
- long_name :
- Ekman depth
array([ nan, nan, nan, nan, nan, nan, 4.5774882e+17, 4.7896335e+17, 5.0082648e+17, 5.0251086e+17, 5.0428256e+17, 5.0616406e+17, 5.2138254e+17, 5.3779629e+17, 5.5541012e+17, 5.4295485e+17, nan, nan, nan, nan, nan, nan, nan, nan, nan, nan, nan, nan, nan, nan, 4.6887079e+17, 5.1898498e+17, 5.7419720e+17, 5.7926588e+17, 5.8443565e+17, 5.8969482e+17, 5.8385772e+17, 5.7795458e+17, 5.7205707e+17, 5.6601821e+17, nan, nan, nan, nan, nan, nan, nan, nan], dtype=float32) - hmonob(time)float32nan nan nan nan ... nan nan nan nan
- units :
- m
- long_name :
- Monin Obukhov length scale
array([ nan, nan, nan, nan, nan, nan, 20.855568 , 6.381697 , 4.263205 , 3.4403372, 2.9695106, 2.6451426, 3.6016703, 5.0653596, 7.9433293, 15.794245 , nan, nan, nan, nan, nan, nan, nan, nan, nan, nan, nan, nan, nan, nan, 22.86214 , 7.532503 , 5.94778 , 5.227539 , 4.692258 , 4.279661 , 5.1836925, 6.4958186, 9.302697 , 22.322956 , nan, nan, nan, nan, nan, nan, nan, nan], dtype=float32) - hunlimit(time)float3222.5 22.5 22.5 ... 22.5 22.5 20.0
- units :
- m
- long_name :
- KPP boundary layer depth before limiting to min(hekman, hmonob) under stable forcing
array([22.5, 22.5, 22.5, 22.5, 22.5, 22.5, 20. , 22.5, 22.5, 22.5, 20. , 17.5, 17.5, 20. , 22.5, 22.5, 17.5, 17.5, 20. , 20. , 17.5, 17.5, 15. , 12.5, 12.5, 12.5, 12.5, 12.5, 12.5, 12.5, 12.5, 20. , 22.5, 22.5, 22.5, 22.5, 22.5, 25. , 25. , 25. , 20. , 20. , 20. , 22.5, 22.5, 22.5, 22.5, 20. ], dtype=float32) - Rib(time, depth)float32-0.0 -0.0043675723 ... 10.773784
- long_name :
- KPP bulk Ri
array([[-0.0000000e+00, -4.3675723e-03, 4.2244170e-02, ..., 7.7815323e+00, 7.8425851e+00, 7.8425851e+00], [-0.0000000e+00, -6.9185831e-03, 3.6911014e-02, ..., 7.9089103e+00, 7.9628172e+00, 7.9628172e+00], [-0.0000000e+00, -1.2001271e-02, 3.7520770e-02, ..., 8.1349211e+00, 8.1810265e+00, 8.1810265e+00], ..., [-0.0000000e+00, 1.5479587e-03, 6.0123704e-02, ..., 1.0430234e+01, 1.0703924e+01, 1.0703924e+01], [-0.0000000e+00, 3.2030668e-03, 5.7468832e-02, ..., 1.0437504e+01, 1.0726508e+01, 1.0726508e+01], [-0.0000000e+00, 1.6819524e-03, 6.5243363e-02, ..., 1.0474560e+01, 1.0773784e+01, 1.0773784e+01]], dtype=float32) - db(time, depth)float32-0.0 -7.231339e-07 ... 0.0
- long_name :
- KPP bulk Ri Δb
array([[-0.0000000e+00, -7.2313389e-07, 2.6032822e-05, ..., 4.0595579e+00, 4.1478744e+00, 0.0000000e+00], [-0.0000000e+00, -1.0847009e-06, 2.2778719e-05, ..., 4.0506921e+00, 4.1388516e+00, 0.0000000e+00], [-0.0000000e+00, -1.8078348e-06, 2.2778719e-05, ..., 4.0408864e+00, 4.1288724e+00, 0.0000000e+00], ..., [-0.0000000e+00, 3.6156695e-07, 4.6642137e-05, ..., 4.2691140e+00, 4.3606405e+00, 0.0000000e+00], [-0.0000000e+00, 7.2313389e-07, 4.3388034e-05, ..., 4.2715244e+00, 4.3630934e+00, 0.0000000e+00], [-0.0000000e+00, 3.6156695e-07, 4.6642137e-05, ..., 4.2739353e+00, 4.3653803e+00, 0.0000000e+00]], dtype=float32) - dV2(time, depth)float320.0 4.941014e-05 ... 0.37995458 0.0
- long_name :
- KPP bulk Ri ΔV^2 (resolved)
array([[0.0000000e+00, 4.9410140e-05, 2.7091338e-04, ..., 4.9504235e-01, 5.0191677e-01, 0.0000000e+00], [0.0000000e+00, 5.0319199e-05, 2.7736116e-04, ..., 4.8523474e-01, 4.9237049e-01, 0.0000000e+00], [0.0000000e+00, 4.8988302e-05, 2.6826747e-04, ..., 4.6952727e-01, 4.7700959e-01, 0.0000000e+00], ..., [0.0000000e+00, 6.2482315e-05, 3.4160132e-04, ..., 3.8168761e-01, 3.7987494e-01, 0.0000000e+00], [0.0000000e+00, 5.9221282e-05, 3.2668465e-04, ..., 3.8159496e-01, 3.7949473e-01, 0.0000000e+00], [0.0000000e+00, 5.5920602e-05, 3.1129509e-04, ..., 3.8229433e-01, 3.7995458e-01, 0.0000000e+00]], dtype=float32) - dVt2(time, depth)float320.00038809222 0.00011615871 ... 0.0
- long_name :
- KPP bulk Ri ΔV_t^2 (unresolved)
array([[0.00038809, 0.00011616, 0.00034533, ..., 0.02664895, 0.02697443, 0. ], [0.0003921 , 0.00010646, 0.00033976, ..., 0.02693341, 0.02740182, 0. ], [0.00039596, 0.00010165, 0.00033883, ..., 0.02720605, 0.0276792 , 0. ], ..., [0.00041859, 0.00017109, 0.00043417, ..., 0.02761424, 0.02751215, 0. ], [0.00041561, 0.00016654, 0.0004283 , ..., 0.02765273, 0.02726333, 0. ], [0.00041283, 0.00015905, 0.0004036 , ..., 0.02573573, 0.02523087, 0. ]], dtype=float32) - KT(time, depth)float320.0050009997 0.012616122 ... 1e-06
array([[5.0009997e-03, 1.2616122e-02, 1.9529518e-02, ..., 1.0000000e-06, 1.0000000e-06, 1.0000000e-06], [5.0009997e-03, 1.2785150e-02, 1.9790806e-02, ..., 1.0000000e-06, 1.0000000e-06, 1.0000000e-06], [5.0009997e-03, 1.2957962e-02, 2.0076469e-02, ..., 1.0000000e-06, 1.0000000e-06, 1.0000000e-06], ..., [4.9999743e-03, 1.3126186e-02, 2.0311574e-02, ..., 1.0000000e-06, 1.0000000e-06, 1.0000000e-06], [4.9964371e-03, 1.3064079e-02, 2.0179978e-02, ..., 1.0000000e-06, 1.0000000e-06, 1.0000000e-06], [4.9997200e-03, 1.2097055e-02, 1.8087992e-02, ..., 1.0000000e-06, 1.0000000e-06, 1.0000000e-06]], dtype=float32) - KM(time, depth)float320.0050999997 0.008073231 ... 1e-04
array([[5.09999972e-03, 8.07323121e-03, 1.25805112e-02, ..., 9.99999975e-05, 9.99999975e-05, 9.99999975e-05], [5.09999972e-03, 8.12131632e-03, 1.26566077e-02, ..., 9.99999975e-05, 9.99999975e-05, 9.99999975e-05], [5.09999972e-03, 8.18027463e-03, 1.27679305e-02, ..., 9.99999975e-05, 9.99999975e-05, 9.99999975e-05], ..., [5.09897433e-03, 8.72506946e-03, 1.35796582e-02, ..., 9.99999975e-05, 9.99999975e-05, 9.99999975e-05], [5.09543717e-03, 8.56258348e-03, 1.32943578e-02, ..., 9.99999975e-05, 9.99999975e-05, 9.99999975e-05], [5.09872008e-03, 8.02413933e-03, 1.21125169e-02, ..., 9.99999975e-05, 9.99999975e-05, 9.99999975e-05]], dtype=float32)
h = pump.calc.calc_kpp_terms(subset_o.isel(time=slice(120)))
h.hbl.plot(marker=".")
oldh.hbl.plot(color="r")
subset_o.KPPhbl.plot(yincrease=False)
plt.legend(["with interp", "no interp", "MIT"])
plt.gcf().savefig("../images/kpp-interp-check.png")
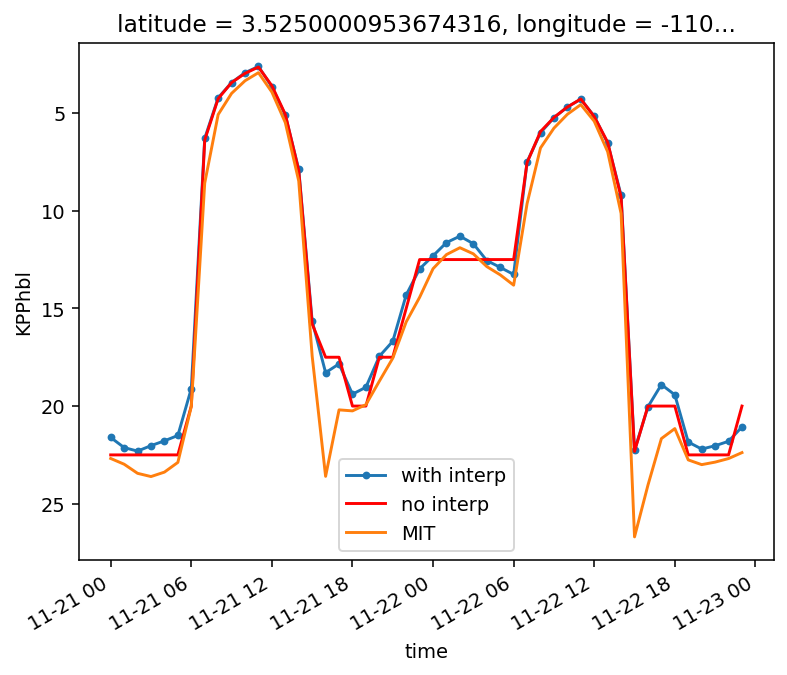
KPP boundary layer depth vs Monin Obukhov length vs Rib contour over 20 years.#
import pump.KPP
kpp = pump.calc.calc_kpp_terms(
station.sel(latitude=[0, 3.5], method="nearest")
.sel(time=slice("1999-01-02", "1999-12-30"))
.chunk({"depth": -1, "time": 1000}),
debug=False,
)
kpp["hmonob"] = kpp.hmonob.where(kpp.hmonob < 100)
kpp.load(scheduler=client)
- depth: 125
- latitude: 2
- time: 8712
- depth(depth)float32-1.25 -3.75 ... -487.70044
array([ -1.25 , -3.75 , -6.25 , -8.75 , -11.25 , -13.75 , -16.25 , -18.75 , -21.25 , -23.75 , -26.25 , -28.75 , -31.25 , -33.75 , -36.25 , -38.75 , -41.25 , -43.75 , -46.25 , -48.75 , -51.25 , -53.75 , -56.25 , -58.75 , -61.25 , -63.75 , -66.25 , -68.75 , -71.25 , -73.75 , -76.25 , -78.75 , -81.25 , -83.75 , -86.25 , -88.75 , -91.25 , -93.75 , -96.25 , -98.75 , -101.25 , -103.75 , -106.25 , -108.75 , -111.25 , -113.75 , -116.25 , -118.75 , -121.25 , -123.75 , -126.25 , -128.75 , -131.25 , -133.75 , -136.25 , -138.75 , -141.25 , -143.75 , -146.25 , -148.75 , -151.25 , -153.75 , -156.25 , -158.75 , -161.25 , -163.75 , -166.25 , -168.75 , -171.25 , -173.75 , -176.25 , -178.75 , -181.25 , -183.75 , -186.25 , -188.75 , -191.25 , -193.75 , -196.25 , -198.75 , -201.25 , -203.75 , -206.25 , -208.75 , -211.25 , -213.75 , -216.25 , -218.75 , -221.25 , -223.75 , -226.25 , -228.75 , -231.25 , -233.75 , -236.25 , -238.75 , -241.25 , -243.75 , -246.25 , -248.75 , -251.36874, -254.2363 , -257.37625, -260.8145 , -264.5794 , -268.70193, -273.21616, -278.1592 , -283.57184, -289.4987 , -295.98856, -303.0949 , -310.8764 , -319.39716, -328.72736, -338.94394, -350.13116, -362.3811 , -375.79474, -390.4827 , -406.56604, -424.17734, -443.4617 , -464.57806, -487.70044], dtype=float32) - longitude()float32-110.025
array(-110.025, dtype=float32)
- latitude(latitude)float640.025 3.525
array([0.025, 3.525])
- time(time)datetime64[ns]1999-01-02 ... 1999-12-30T23:00:00
array(['1999-01-02T00:00:00.000000000', '1999-01-02T01:00:00.000000000', '1999-01-02T02:00:00.000000000', ..., '1999-12-30T21:00:00.000000000', '1999-12-30T22:00:00.000000000', '1999-12-30T23:00:00.000000000'], dtype='datetime64[ns]')
- hbl(time, latitude)float325.0 10.0 5.0 10.0 ... 30.0 7.5 32.5
- units :
- m
- long_name :
- KPP boundary layer depth
array([[ 5. , 10. ], [ 5. , 10. ], [ 5. , 15. ], ..., [ 7.5, 30. ], [ 7.5, 30. ], [ 7.5, 32.5]], dtype=float32) - hekman(time, latitude)float32nan nan nan nan ... nan nan nan nan
- units :
- m
- long_name :
- Ekman depth
array([[nan, nan], [nan, nan], [nan, nan], ..., [nan, nan], [nan, nan], [nan, nan]], dtype=float32) - hmonob(time, latitude)float32nan nan nan nan ... nan nan nan nan
- units :
- m
- long_name :
- Monin Obukhov length scale
array([[nan, nan], [nan, nan], [nan, nan], ..., [nan, nan], [nan, nan], [nan, nan]], dtype=float32) - hunlimit(time, latitude)float325.0 10.0 5.0 10.0 ... 30.0 7.5 32.5
- units :
- m
- long_name :
- KPP boundary layer depth before limiting to min(hekman, hmonob) under stable forcing
array([[ 5. , 10. ], [ 5. , 10. ], [ 5. , 15. ], ..., [ 7.5, 30. ], [ 7.5, 30. ], [ 7.5, 32.5]], dtype=float32) - Rib(time, latitude, depth)float32-0.0 0.2503229 ... 235.58582
- long_name :
- KPP bulk Ri
array([[[-0.0000000e+00, 2.5032291e-01, 4.8184463e-01, ..., 8.5198547e+01, 7.9783852e+01, 7.9783852e+01], [-0.0000000e+00, 6.3407227e-02, 1.6666980e-01, ..., 1.4464644e+02, 1.5555121e+02, 1.5555121e+02]], [[-0.0000000e+00, 2.1697785e-01, 4.8251191e-01, ..., 8.2865799e+01, 7.7752548e+01, 7.7752548e+01], [-0.0000000e+00, 2.3602573e-02, 1.5087619e-01, ..., 1.4718178e+02, 1.5820285e+02, 1.5820285e+02]], [[-0.0000000e+00, 2.0862587e-01, 4.8596352e-01, ..., 7.9324699e+01, 7.4693375e+01, 7.4693375e+01], [-0.0000000e+00, 2.6829834e-03, 7.4484199e-02, ..., 1.4657593e+02, 1.5752759e+02, 1.5752759e+02]], ..., [[-0.0000000e+00, 1.5106463e-01, 2.1721765e-01, ..., 3.3305534e+01, 3.4165131e+01, 3.4165131e+01], [-0.0000000e+00, -2.2021918e-02, -1.3400100e-02, ..., 2.3884598e+02, 2.4341263e+02, 2.4341263e+02]], [[-0.0000000e+00, 1.3765422e-01, 2.0930561e-01, ..., 3.3610939e+01, 3.4511612e+01, 3.4511612e+01], [-0.0000000e+00, -2.6850004e-02, -2.5710473e-02, ..., 2.3948860e+02, 2.4501222e+02, 2.4501222e+02]], [[-0.0000000e+00, 1.3321401e-01, 2.0516455e-01, ..., 3.3925499e+01, 3.4867664e+01, 3.4867664e+01], [-0.0000000e+00, -2.7953496e-02, -3.2485351e-02, ..., 2.2933173e+02, 2.3558582e+02, 2.3558582e+02]]], dtype=float32) - db(time, latitude, depth)float32-0.0 0.0002921461 ... 18.329153 0.0
- long_name :
- KPP bulk Ri Δb
array([[[-0.00000000e+00, 2.92146113e-04, 2.81154457e-03, ..., 9.64758301e+00, 1.02288885e+01, 0.00000000e+00], [-0.00000000e+00, 1.15701423e-05, 6.94208575e-05, ..., 2.16456642e+01, 2.28267021e+01, 0.00000000e+00]], [[-0.00000000e+00, 1.93799890e-04, 2.28510308e-03, ..., 9.60716248e+00, 1.01870747e+01, 0.00000000e+00], [-0.00000000e+00, 4.33880359e-06, 6.36357872e-05, ..., 2.16410599e+01, 2.28218784e+01, 0.00000000e+00]], [[-0.00000000e+00, 1.47519313e-04, 1.86857802e-03, ..., 9.57851028e+00, 1.01570539e+01, 0.00000000e+00], [-0.00000000e+00, 3.61566947e-07, 2.71175213e-05, ..., 2.15756779e+01, 2.27569656e+01, 0.00000000e+00]], ..., [[-0.00000000e+00, 9.97924799e-05, 5.81399654e-04, ..., 1.48661089e+01, 1.56966076e+01, 0.00000000e+00], [-0.00000000e+00, -3.25410269e-06, -5.42350426e-06, ..., 1.73361778e+01, 1.83598938e+01, 0.00000000e+00]], [[-0.00000000e+00, 8.53298043e-05, 5.14871324e-04, ..., 1.48435965e+01, 1.56708765e+01, 0.00000000e+00], [-0.00000000e+00, -4.70037048e-06, -9.76230785e-06, ..., 1.73198528e+01, 1.83443890e+01, 0.00000000e+00]], [[-0.00000000e+00, 7.52059277e-05, 4.62805707e-04, ..., 1.48244095e+01, 1.56507730e+01, 0.00000000e+00], [-0.00000000e+00, -5.42350426e-06, -1.19317092e-05, ..., 1.73048019e+01, 1.83291531e+01, 0.00000000e+00]]], dtype=float32) - dV2(time, latitude, depth)float320.0 0.00049714063 ... 0.0
- long_name :
- KPP bulk Ri ΔV^2 (resolved)
array([[[0.00000000e+00, 4.97140631e-04, 4.21184534e-03, ..., 8.76374915e-02, 9.84975249e-02, 0.00000000e+00], [0.00000000e+00, 2.31424783e-05, 6.10678326e-05, ..., 1.04122072e-01, 1.02895468e-01, 0.00000000e+00]], [[0.00000000e+00, 2.98121187e-04, 3.22474726e-03, ..., 9.06843692e-02, 1.01800725e-01, 0.00000000e+00], [0.00000000e+00, 2.88854189e-05, 6.92425747e-05, ..., 1.00757688e-01, 9.96746123e-02, 0.00000000e+00]], [[0.00000000e+00, 1.77986658e-04, 2.44946941e-03, ..., 9.58900973e-02, 1.07278921e-01, 0.00000000e+00], [0.00000000e+00, 8.93922697e-06, 3.50564369e-05, ..., 9.83087644e-02, 9.73211378e-02, 0.00000000e+00]], ..., [[0.00000000e+00, 2.94306810e-04, 1.71662017e-03, ..., 4.11460787e-01, 4.27512527e-01, 0.00000000e+00], [0.00000000e+00, 3.77778924e-05, 1.74939283e-04, ..., 6.99972967e-03, 9.26842261e-03, 0.00000000e+00]], [[0.00000000e+00, 2.84027221e-04, 1.57086982e-03, ..., 4.07791436e-01, 4.23078984e-01, 0.00000000e+00], [0.00000000e+00, 3.93800074e-05, 1.75155816e-04, ..., 7.55817862e-03, 9.58914496e-03, 0.00000000e+00]], [[0.00000000e+00, 2.54923420e-04, 1.42970495e-03, ..., 4.04223919e-01, 4.18756485e-01, 0.00000000e+00], [0.00000000e+00, 4.20315264e-05, 1.81414740e-04, ..., 8.54127109e-03, 1.03969378e-02, 0.00000000e+00]]], dtype=float32) - dVt2(time, latitude, depth)float320.00014306219 0.00066993636 ... 0.0
- long_name :
- KPP bulk Ri ΔV_t^2 (unresolved)
array([[[0.00014306, 0.00066994, 0.00162312, ..., 0.02559898, 0.02970997, 0. ], [0.0003225 , 0.00015933, 0.00035545, ..., 0.04552326, 0.04385172, 0. ]], [[0.00014078, 0.00059506, 0.0015111 , ..., 0.02525203, 0.02921846, 0. ], [0.00032754, 0.00015494, 0.00035253, ..., 0.04627858, 0.04458245, 0. ]], [[0.00013828, 0.00052911, 0.00139563, ..., 0.02486057, 0.02870441, 0. ], [0.00033144, 0.00012582, 0.00032901, ..., 0.04888919, 0.04714222, 0. ]], ..., [[0.00021248, 0.00036629, 0.00095996, ..., 0.03489474, 0.03192103, 0. ], [0.00026127, 0.00010999, 0.0002298 , ..., 0.06558336, 0.06615862, 0. ]], [[0.00020689, 0.00033586, 0.00088903, ..., 0.0338385 , 0.03099648, 0. ], [0.00026154, 0.00013568, 0.00020455, ..., 0.06476197, 0.06528218, 0. ]], [[0.00020105, 0.00030963, 0.00082607, ..., 0.03274563, 0.03010559, 0. ], [0.00026222, 0.00015199, 0.00018588, ..., 0.06691624, 0.06740551, 0. ]]], dtype=float32) - KT(time, latitude, depth)float320.00012966603 ... 1e-06
array([[[1.29666034e-04, 2.18233955e-03, 9.19872400e-05, ..., 9.99999997e-07, 9.99999997e-07, 9.99999997e-07], [5.88858093e-04, 7.83956889e-03, 7.58001441e-03, ..., 9.99999997e-07, 9.99999997e-07, 9.99999997e-07]], [[1.40170687e-05, 2.16404232e-03, 1.03821752e-04, ..., 9.99999997e-07, 9.99999997e-07, 9.99999997e-07], [4.34163306e-03, 8.00566562e-03, 7.86850788e-03, ..., 9.99999997e-07, 9.99999997e-07, 9.99999997e-07]], [[9.99999997e-07, 2.14412622e-03, 1.17710180e-04, ..., 9.99999997e-07, 9.99999997e-07, 9.99999997e-07], [4.95108636e-03, 1.13102421e-02, 1.49047645e-02, ..., 9.99999997e-07, 9.99999997e-07, 9.99999997e-07]], ..., [[2.24266201e-03, 4.82293451e-03, 3.10947536e-03, ..., 9.99999997e-07, 9.99999997e-07, 9.99999997e-07], [5.00099966e-03, 1.46211786e-02, 2.62511652e-02, ..., 9.99999997e-07, 9.99999997e-07, 9.99999997e-07]], [[2.71571265e-03, 4.70282603e-03, 3.04097799e-03, ..., 9.99999997e-07, 9.99999997e-07, 9.99999997e-07], [5.00099966e-03, 1.45563791e-02, 2.61273608e-02, ..., 9.99999997e-07, 9.99999997e-07, 9.99999997e-07]], [[2.78192759e-03, 4.58586263e-03, 2.99450336e-03, ..., 9.99999997e-07, 9.99999997e-07, 9.99999997e-07], [5.00099966e-03, 1.46936942e-02, 2.76978035e-02, ..., 9.99999997e-07, 9.99999997e-07, 9.99999997e-07]]], dtype=float32) - KM(time, latitude, depth)float320.00022866603 ... 1e-04
array([[[2.28666031e-04, 1.07810984e-03, 1.90987237e-04, ..., 9.99999975e-05, 9.99999975e-05, 9.99999975e-05], [6.87858090e-04, 3.68432608e-03, 3.92221520e-03, ..., 9.99999975e-05, 9.99999975e-05, 9.99999975e-05]], [[1.13017064e-04, 1.06433465e-03, 2.02821742e-04, ..., 9.99999975e-05, 9.99999975e-05, 9.99999975e-05], [4.44063311e-03, 3.84459435e-03, 4.20552772e-03, ..., 9.99999975e-05, 9.99999975e-05, 9.99999975e-05]], [[9.99999975e-05, 1.05444994e-03, 2.16710177e-04, ..., 9.99999975e-05, 9.99999975e-05, 9.99999975e-05], [5.05008642e-03, 5.27657289e-03, 7.19794771e-03, ..., 9.99999975e-05, 9.99999975e-05, 9.99999975e-05]], ..., [[2.34166207e-03, 3.19488416e-03, 2.35595019e-03, ..., 9.99999975e-05, 9.99999975e-05, 9.99999975e-05], [5.09999972e-03, 9.05576814e-03, 1.57470144e-02, ..., 9.99999975e-05, 9.99999975e-05, 9.99999975e-05]], [[2.81471270e-03, 3.11372965e-03, 2.30692979e-03, ..., 9.99999975e-05, 9.99999975e-05, 9.99999975e-05], [5.09999972e-03, 9.21308808e-03, 1.60208605e-02, ..., 9.99999975e-05, 9.99999975e-05, 9.99999975e-05]], [[2.88092764e-03, 3.03988135e-03, 2.28201272e-03, ..., 9.99999975e-05, 9.99999975e-05, 9.99999975e-05], [5.09999972e-03, 9.49921738e-03, 1.70747973e-02, ..., 9.99999975e-05, 9.99999975e-05, 9.99999975e-05]]], dtype=float32)
kpp = pump.calc.calc_kpp_terms(
station.sel(latitude=[3.5], method="nearest")
.sel(time=slice("1999-01-02", "1999-01-06"))
.chunk({"depth": -1, "time": 1000}),
debug=True,
)
---------------------------------------------------------------------------
KeyboardInterrupt Traceback (most recent call last)
<ipython-input-75-276c3fdda056> in <module>
3 .sel(time=slice("1999-01-02", "1999-01-06"))
4 .chunk({"depth": -1, "time": 1000}),
----> 5 debug=True,
6 )
~/pump/pump/calc.py in calc_kpp_terms(station, debug)
1132 h.dVt2.attrs["long_name"] = "KPP bulk Ri ΔV_t^2 (unresolved)"
1133 if debug:
-> 1134 h.hbl.plot()
1135 # kpp.KPPhbl.plot()
1136 station.KPPhbl.plot()
~/miniconda3/envs/dcpy2/lib/python3.7/site-packages/xarray/plot/plot.py in __call__(self, **kwargs)
444
445 def __call__(self, **kwargs):
--> 446 return plot(self._da, **kwargs)
447
448 @functools.wraps(hist)
~/miniconda3/envs/dcpy2/lib/python3.7/site-packages/xarray/plot/plot.py in plot(darray, row, col, col_wrap, ax, hue, rtol, subplot_kws, **kwargs)
162
163 """
--> 164 darray = darray.squeeze().compute()
165
166 plot_dims = set(darray.dims)
~/miniconda3/envs/dcpy2/lib/python3.7/site-packages/xarray/core/dataarray.py in compute(self, **kwargs)
826 """
827 new = self.copy(deep=False)
--> 828 return new.load(**kwargs)
829
830 def persist(self, **kwargs) -> "DataArray":
~/miniconda3/envs/dcpy2/lib/python3.7/site-packages/xarray/core/dataarray.py in load(self, **kwargs)
800 dask.array.compute
801 """
--> 802 ds = self._to_temp_dataset().load(**kwargs)
803 new = self._from_temp_dataset(ds)
804 self._variable = new._variable
~/miniconda3/envs/dcpy2/lib/python3.7/site-packages/xarray/core/dataset.py in load(self, **kwargs)
652
653 # evaluate all the dask arrays simultaneously
--> 654 evaluated_data = da.compute(*lazy_data.values(), **kwargs)
655
656 for k, data in zip(lazy_data, evaluated_data):
~/miniconda3/envs/dcpy2/lib/python3.7/site-packages/dask/base.py in compute(*args, **kwargs)
435 keys = [x.__dask_keys__() for x in collections]
436 postcomputes = [x.__dask_postcompute__() for x in collections]
--> 437 results = schedule(dsk, keys, **kwargs)
438 return repack([f(r, *a) for r, (f, a) in zip(results, postcomputes)])
439
~/miniconda3/envs/dcpy2/lib/python3.7/site-packages/distributed/client.py in get(self, dsk, keys, restrictions, loose_restrictions, resources, sync, asynchronous, direct, retries, priority, fifo_timeout, actors, **kwargs)
2593 should_rejoin = False
2594 try:
-> 2595 results = self.gather(packed, asynchronous=asynchronous, direct=direct)
2596 finally:
2597 for f in futures.values():
~/miniconda3/envs/dcpy2/lib/python3.7/site-packages/distributed/client.py in gather(self, futures, errors, direct, asynchronous)
1892 direct=direct,
1893 local_worker=local_worker,
-> 1894 asynchronous=asynchronous,
1895 )
1896
~/miniconda3/envs/dcpy2/lib/python3.7/site-packages/distributed/client.py in sync(self, func, asynchronous, callback_timeout, *args, **kwargs)
776 else:
777 return sync(
--> 778 self.loop, func, *args, callback_timeout=callback_timeout, **kwargs
779 )
780
~/miniconda3/envs/dcpy2/lib/python3.7/site-packages/distributed/utils.py in sync(loop, func, callback_timeout, *args, **kwargs)
343 else:
344 while not e.is_set():
--> 345 e.wait(10)
346 if error[0]:
347 typ, exc, tb = error[0]
~/miniconda3/envs/dcpy2/lib/python3.7/threading.py in wait(self, timeout)
550 signaled = self._flag
551 if not signaled:
--> 552 signaled = self._cond.wait(timeout)
553 return signaled
554
~/miniconda3/envs/dcpy2/lib/python3.7/threading.py in wait(self, timeout)
298 else:
299 if timeout > 0:
--> 300 gotit = waiter.acquire(True, timeout)
301 else:
302 gotit = waiter.acquire(False)
KeyboardInterrupt:
kpp.hbl.sel(time="1999-01").plot.line(hue="latitude")
[<matplotlib.lines.Line2D at 0x2b543fbe8490>,
<matplotlib.lines.Line2D at 0x2b543658ad10>]
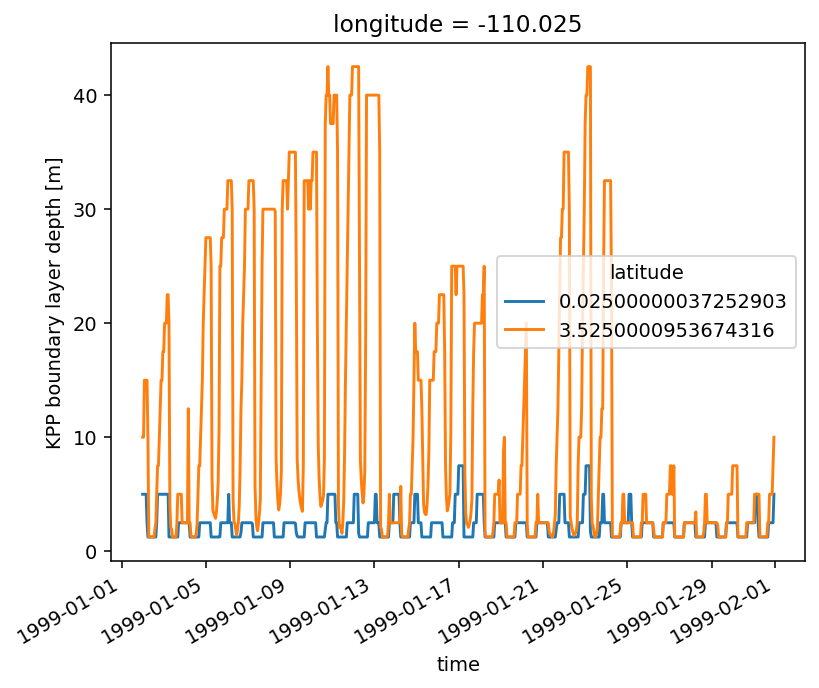
xr.Dataset(
{"mit": station.KPPhbl.reindex_like(kpp.hbl), "smyth": kpp.hbl}
).plot.scatter(x="mit", y="smyth", hue="latitude", hue_style="discrete", s=4)
dcpy.plots.line45()
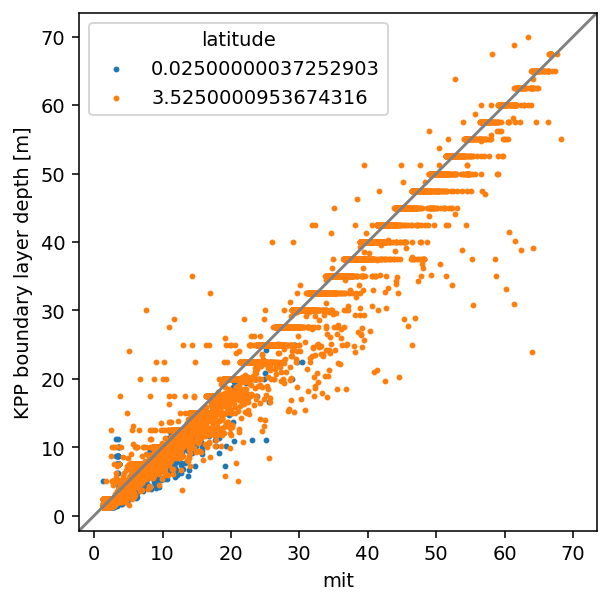
kpp.hunlimit.hvplot.line() * kpp.hmonob.hvplot.line()
v2 = (
(station.v.sel(time=dh.time, depth=slice(-100), latitude=slice(-2, 2)) ** 2)
.mean(["depth", "latitude"])
.compute()
)
v2.attrs["long_name"] = "$v^2$"
v2
- time: 1802
- 0.011888596 0.012170398 0.015604051 ... 0.024090406 0.023737494
array([0.0118886 , 0.0121704 , 0.01560405, ..., 0.03052988, 0.02409041, 0.02373749], dtype=float32) - longitude()float32-110.025
array(-110.025, dtype=float32)
- time(time)datetime64[ns]1999-01-03T07:00:00 ... 1999-12-30T08:00:00
array(['1999-01-03T07:00:00.000000000', '1999-01-03T08:00:00.000000000', '1999-01-05T07:00:00.000000000', ..., '1999-12-29T14:00:00.000000000', '1999-12-30T07:00:00.000000000', '1999-12-30T08:00:00.000000000'], dtype='datetime64[ns]')
- long_name :
- $v^2$
v = station.v.sel(time=dh.time, depth=slice(-100), latitude=slice(-2, 2)).compute()
tiwv = pump.calc.tiw_avg_filter_v(v.sel(latitude=[0], method="nearest"))
/glade/u/home/dcherian/python/xfilter/xfilter/xfilter.py:175: UserWarning: The 'gappy' kwarg is now deprecated.
warnings.warn("The 'gappy' kwarg is now deprecated.")
tiwv.mean("latitude").plot(x="time")
v.mean(["latitude", "depth"]).plot(x="time")
[<matplotlib.lines.Line2D at 0x2b0a3540cc18>]
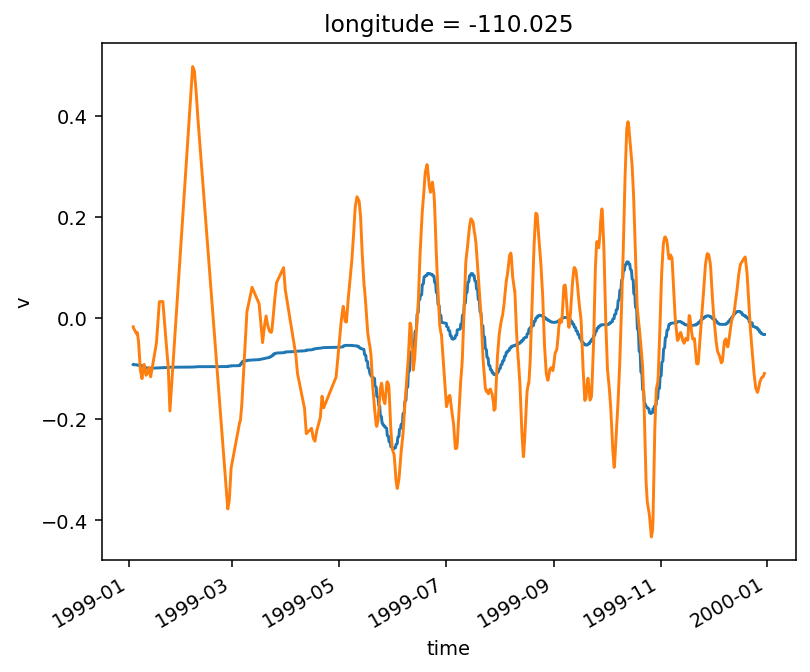
xfilter.bandpass(
v.chunk({"time": -1}),
coord="time",
freq=[1 / 15, 1 / 50],
cycles_per="D",
num_discard=0,
).plot()
(array([ 27751., 63152., 90067., 218473., 704834., 1188229.,
783223., 270191., 102573., 11347.]),
array([-0.19458834, -0.15993737, -0.1252864 , -0.09063542, -0.05598445,
-0.02133348, 0.01331749, 0.04796846, 0.08261943, 0.11727041,
0.15192138]),
<a list of 10 Patch objects>)
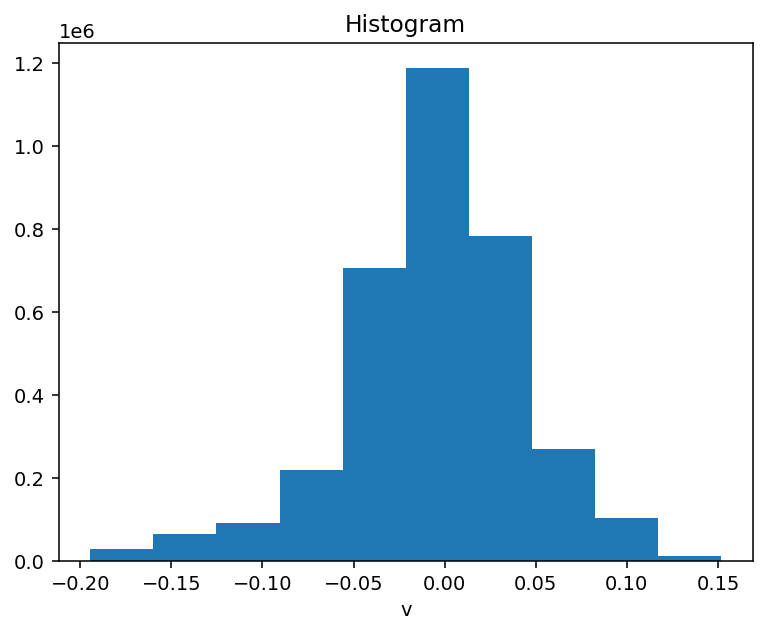
station.theta.reindex_like(kpp[["time"]]).isel(
depth=0, time=slice(None, None, 24)
).plot(x="time", robust=True)
(2 * v2 / v2.max()).plot.line(x="time")
[<matplotlib.lines.Line2D at 0x2b0a355ff0f0>]
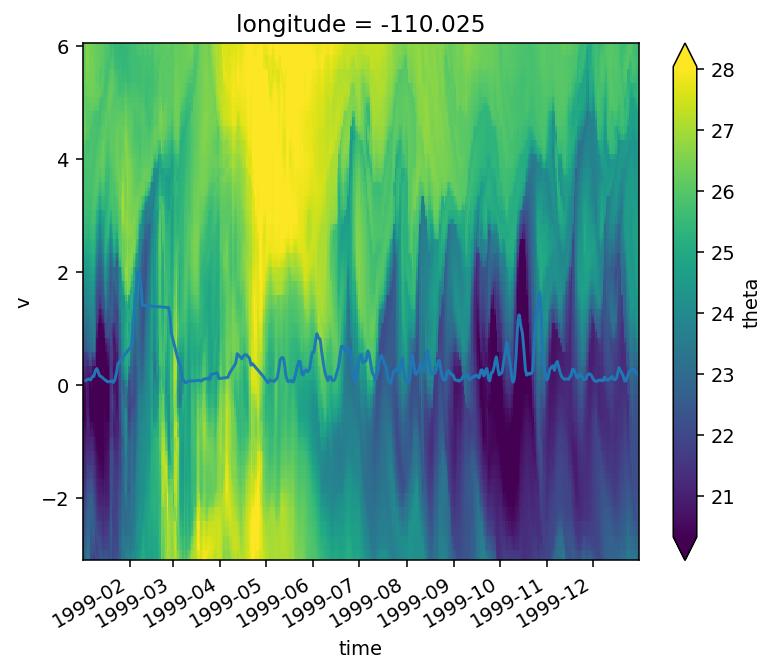
v2.plot.line(hue="latitude")
[<matplotlib.lines.Line2D at 0x2b0a34eb54e0>]
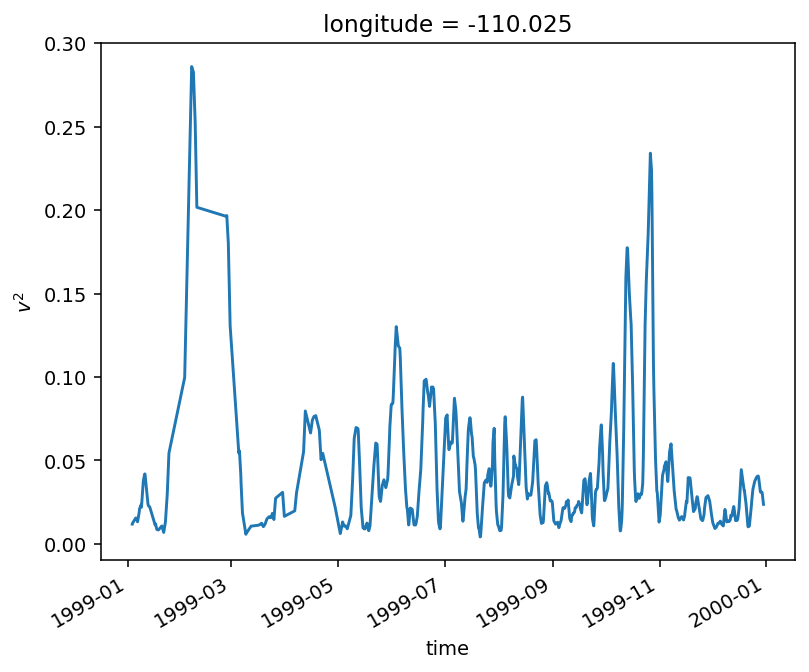
dh = kpp.hunlimit - kpp.hmonob
dh = dh.where(dh > 0, drop=True)
dh = dh.to_dataset(name="dh").merge(v2)
dh.dh.plot.hist(bins=100)
dh["month"] = dh.time.dt.month
dh = dh.assign_coords(latitude=[0, 3.5])
dh.dh.attrs["long_name"] = "$H_{0.3} - L_{MO}$"
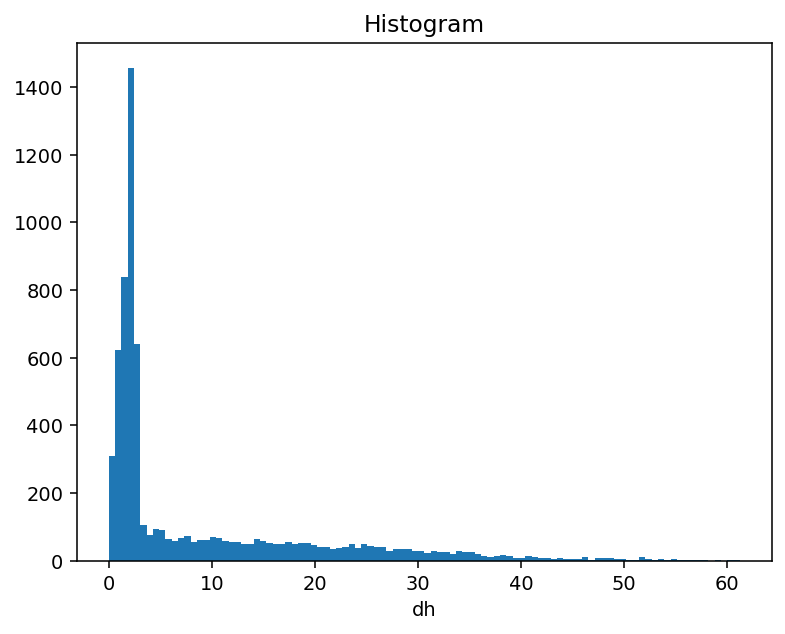
import seaborn as sns
df = dh.to_dataframe()
sns.catplot(data=df.reset_index(), x="month", y="dh", kind="box", hue="latitude")
<seaborn.axisgrid.FacetGrid at 0x2b0a49b521d0>
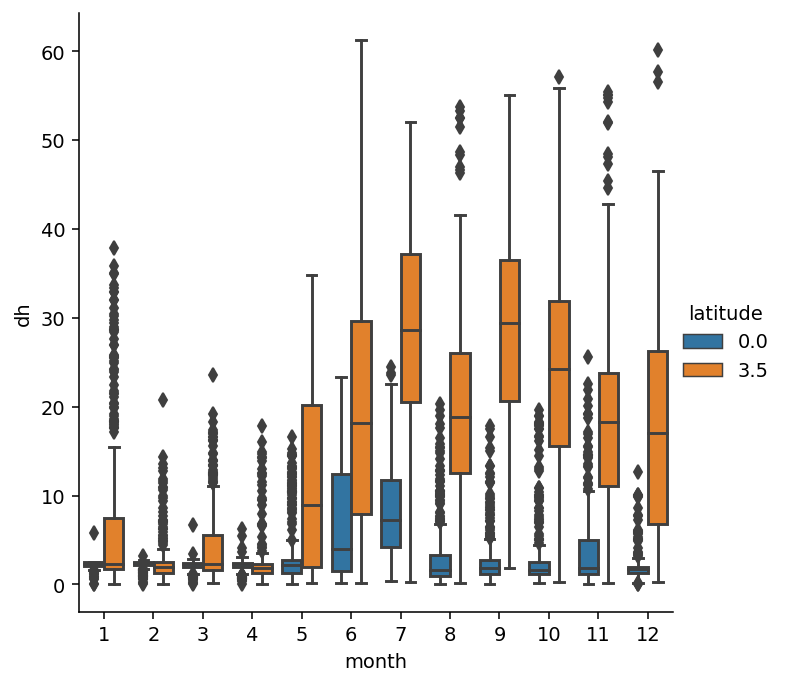
dh.sortby("latitude", ascending=False).plot.scatter(
row="latitude", x="month", y="dh", s=3
)
<xarray.plot.facetgrid.FacetGrid at 0x2b0a48768240>
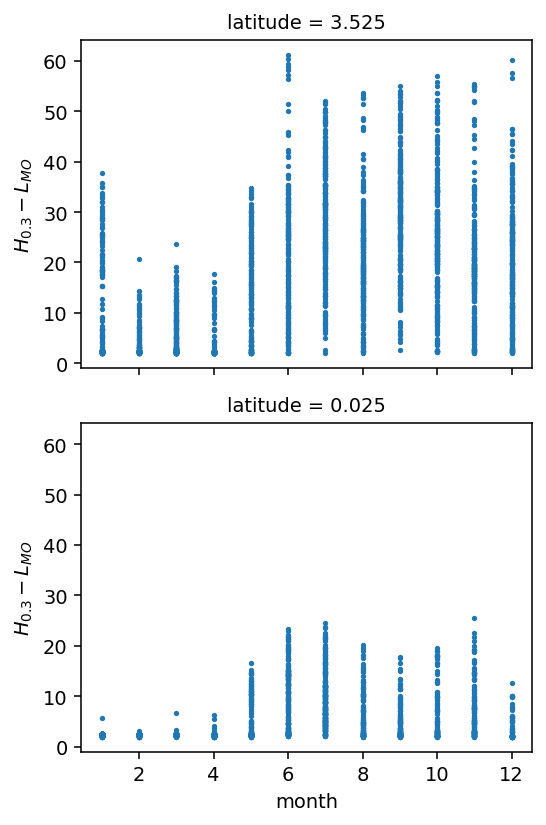
kpp.hunlimit.plot.hist()
kpp.hbl.plot.hist()
(array([3095., 1072., 1050., 935., 878., 586., 537., 315., 187.,
57.]),
array([ 1.25 , 8.125, 15. , 21.875, 28.75 , 35.625, 42.5 , 49.375,
56.25 , 63.125, 70. ], dtype=float32),
<a list of 10 Patch objects>)
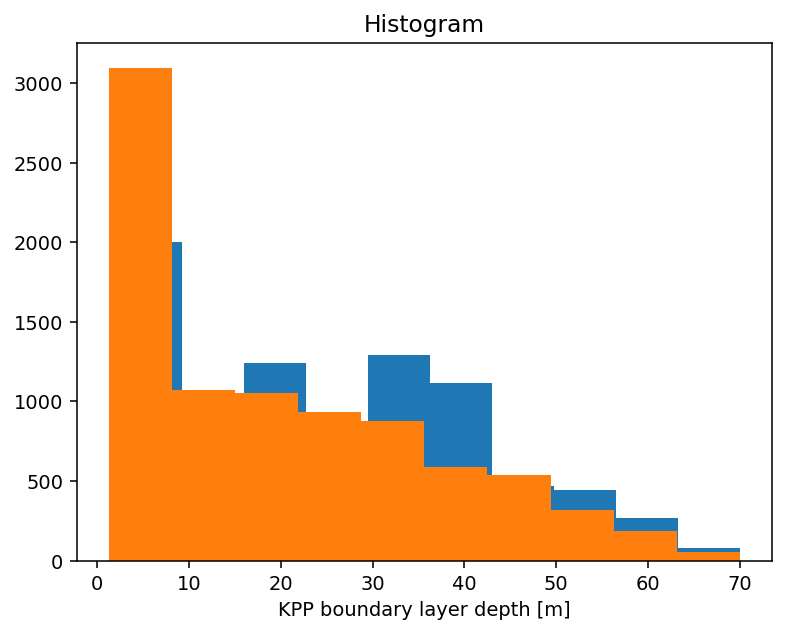
Debugging: Double check with augmented output#
exf = xr.open_mfdataset(
"/glade/scratch/bachman/TPOS_MITgcm_20_year/HOLD/*sfc.nc", parallel=True
)
/glade/u/home/dcherian/miniconda3/envs/dcpy/lib/python3.6/site-packages/ipykernel_launcher.py:2: FutureWarning: In xarray version 0.15 the default behaviour of `open_mfdataset`
will change. To retain the existing behavior, pass
combine='nested'. To use future default behavior, pass
combine='by_coords'. See
http://xarray.pydata.org/en/stable/combining.html#combining-multi
/glade/u/home/dcherian/miniconda3/envs/dcpy/lib/python3.6/site-packages/xarray/backends/api.py:941: FutureWarning: The datasets supplied have global dimension coordinates. You may want
to use the new `combine_by_coords` function (or the
`combine='by_coords'` option to `open_mfdataset`) to order the datasets
before concatenation. Alternatively, to continue concatenating based
on the order the datasets are supplied in future, please use the new
`combine_nested` function (or the `combine='nested'` option to
open_mfdataset).The datasets supplied require both concatenation and merging. From
xarray version 0.15 this will operation will require either using the
new `combine_nested` function (or the `combine='nested'` option to
open_mfdataset), with a nested list structure such that you can combine
along the dimensions None. Alternatively if your datasets have global
dimension coordinates then you can use the new `combine_by_coords`
function.
from_openmfds=True,
kpp2 = xr.open_mfdataset(
"/glade/scratch/bachman/TPOS_MITgcm_20_year/HOLD/*KPP2D.nc",
chunks=500,
parallel=True,
concat_dim="time",
)
kpp3 = xr.open_mfdataset(
"/glade/scratch/bachman/TPOS_MITgcm_20_year/HOLD/*KPP3D.nc",
chunks=500,
parallel=True,
concat_dim="time",
)
/glade/u/home/dcherian/miniconda3/envs/dcpy/lib/python3.6/site-packages/ipykernel_launcher.py:5: FutureWarning: In xarray version 0.15 the default behaviour of `open_mfdataset`
will change. To retain the existing behavior, pass
combine='nested'. To use future default behavior, pass
combine='by_coords'. See
http://xarray.pydata.org/en/stable/combining.html#combining-multi
"""
/glade/u/home/dcherian/miniconda3/envs/dcpy/lib/python3.6/site-packages/xarray/backends/api.py:941: FutureWarning: Also `open_mfdataset` will no longer accept a `concat_dim` argument.
To get equivalent behaviour from now on please use the new
`combine_nested` function instead (or the `combine='nested'` option to
`open_mfdataset`).The datasets supplied have global dimension coordinates. You may want
to use the new `combine_by_coords` function (or the
`combine='by_coords'` option to `open_mfdataset`) to order the datasets
before concatenation. Alternatively, to continue concatenating based
on the order the datasets are supplied in future, please use the new
`combine_nested` function (or the `combine='nested'` option to
open_mfdataset).The datasets supplied require both concatenation and merging. From
xarray version 0.15 this will operation will require either using the
new `combine_nested` function (or the `combine='nested'` option to
open_mfdataset), with a nested list structure such that you can combine
along the dimensions None. Alternatively if your datasets have global
dimension coordinates then you can use the new `combine_by_coords`
function.
from_openmfds=True,
/glade/u/home/dcherian/miniconda3/envs/dcpy/lib/python3.6/site-packages/ipykernel_launcher.py:11: FutureWarning: In xarray version 0.15 the default behaviour of `open_mfdataset`
will change. To retain the existing behavior, pass
combine='nested'. To use future default behavior, pass
combine='by_coords'. See
http://xarray.pydata.org/en/stable/combining.html#combining-multi
# This is added back by InteractiveShellApp.init_path()
/glade/u/home/dcherian/miniconda3/envs/dcpy/lib/python3.6/site-packages/xarray/backends/api.py:941: FutureWarning: Also `open_mfdataset` will no longer accept a `concat_dim` argument.
To get equivalent behaviour from now on please use the new
`combine_nested` function instead (or the `combine='nested'` option to
`open_mfdataset`).The datasets supplied have global dimension coordinates. You may want
to use the new `combine_by_coords` function (or the
`combine='by_coords'` option to `open_mfdataset`) to order the datasets
before concatenation. Alternatively, to continue concatenating based
on the order the datasets are supplied in future, please use the new
`combine_nested` function (or the `combine='nested'` option to
open_mfdataset).The datasets supplied require both concatenation and merging. From
xarray version 0.15 this will operation will require either using the
new `combine_nested` function (or the `combine='nested'` option to
open_mfdataset), with a nested list structure such that you can combine
along the dimensions None. Alternatively if your datasets have global
dimension coordinates then you can use the new `combine_by_coords`
function.
from_openmfds=True,
eq = (
station.sel(latitude=0, method="nearest")
.sel(depth=slice(-150))
.pipe(pump.calc_reduced_shear)[
[
"u",
"v",
"theta",
"salt",
"dens",
"tau",
"usr",
"uas",
"vas",
"wind_angle",
"netflux",
"short",
"KPPhbl",
"taux",
"tauy",
]
]
)
calc uz
calc vz
calc S2
calc N2
calc shred2
Calc Ri
aug = xr.merge([kpp2, kpp3])
aug["time"] = aug.time + pd.Timedelta("23h")
aug
kppeq = aug.sel(longitude=eq.longitude, latitude=3.5, method="nearest") # .load()
kppeq
- depth: 136
- time: 169
- time(time)datetime64[ns]1999-09-08 ... 1999-09-15
array(['1999-09-08T00:00:00.000000000', '1999-09-08T01:00:00.000000000', '1999-09-08T02:00:00.000000000', '1999-09-08T03:00:00.000000000', '1999-09-08T04:00:00.000000000', '1999-09-08T05:00:00.000000000', '1999-09-08T06:00:00.000000000', '1999-09-08T07:00:00.000000000', '1999-09-08T08:00:00.000000000', '1999-09-08T09:00:00.000000000', '1999-09-08T10:00:00.000000000', '1999-09-08T11:00:00.000000000', '1999-09-08T12:00:00.000000000', '1999-09-08T13:00:00.000000000', '1999-09-08T14:00:00.000000000', '1999-09-08T15:00:00.000000000', '1999-09-08T16:00:00.000000000', '1999-09-08T17:00:00.000000000', '1999-09-08T18:00:00.000000000', '1999-09-08T19:00:00.000000000', '1999-09-08T20:00:00.000000000', '1999-09-08T21:00:00.000000000', '1999-09-08T22:00:00.000000000', '1999-09-08T23:00:00.000000000', '1999-09-09T00:00:00.000000000', '1999-09-09T01:00:00.000000000', '1999-09-09T02:00:00.000000000', '1999-09-09T03:00:00.000000000', '1999-09-09T04:00:00.000000000', '1999-09-09T05:00:00.000000000', '1999-09-09T06:00:00.000000000', '1999-09-09T07:00:00.000000000', '1999-09-09T08:00:00.000000000', '1999-09-09T09:00:00.000000000', '1999-09-09T10:00:00.000000000', '1999-09-09T11:00:00.000000000', '1999-09-09T12:00:00.000000000', '1999-09-09T13:00:00.000000000', '1999-09-09T14:00:00.000000000', '1999-09-09T15:00:00.000000000', '1999-09-09T16:00:00.000000000', '1999-09-09T17:00:00.000000000', '1999-09-09T18:00:00.000000000', '1999-09-09T19:00:00.000000000', '1999-09-09T20:00:00.000000000', '1999-09-09T21:00:00.000000000', '1999-09-09T22:00:00.000000000', '1999-09-09T23:00:00.000000000', '1999-09-10T00:00:00.000000000', '1999-09-10T01:00:00.000000000', '1999-09-10T02:00:00.000000000', '1999-09-10T03:00:00.000000000', '1999-09-10T04:00:00.000000000', '1999-09-10T05:00:00.000000000', '1999-09-10T06:00:00.000000000', '1999-09-10T07:00:00.000000000', '1999-09-10T08:00:00.000000000', '1999-09-10T09:00:00.000000000', '1999-09-10T10:00:00.000000000', '1999-09-10T11:00:00.000000000', '1999-09-10T12:00:00.000000000', '1999-09-10T13:00:00.000000000', '1999-09-10T14:00:00.000000000', '1999-09-10T15:00:00.000000000', '1999-09-10T16:00:00.000000000', '1999-09-10T17:00:00.000000000', '1999-09-10T18:00:00.000000000', '1999-09-10T19:00:00.000000000', '1999-09-10T20:00:00.000000000', '1999-09-10T21:00:00.000000000', '1999-09-10T22:00:00.000000000', '1999-09-10T23:00:00.000000000', '1999-09-11T00:00:00.000000000', '1999-09-11T01:00:00.000000000', '1999-09-11T02:00:00.000000000', '1999-09-11T03:00:00.000000000', '1999-09-11T04:00:00.000000000', '1999-09-11T05:00:00.000000000', '1999-09-11T06:00:00.000000000', '1999-09-11T07:00:00.000000000', '1999-09-11T08:00:00.000000000', '1999-09-11T09:00:00.000000000', '1999-09-11T10:00:00.000000000', '1999-09-11T11:00:00.000000000', '1999-09-11T12:00:00.000000000', '1999-09-11T13:00:00.000000000', '1999-09-11T14:00:00.000000000', '1999-09-11T15:00:00.000000000', '1999-09-11T16:00:00.000000000', '1999-09-11T17:00:00.000000000', '1999-09-11T18:00:00.000000000', '1999-09-11T19:00:00.000000000', '1999-09-11T20:00:00.000000000', '1999-09-11T21:00:00.000000000', '1999-09-11T22:00:00.000000000', '1999-09-11T23:00:00.000000000', '1999-09-12T00:00:00.000000000', '1999-09-12T01:00:00.000000000', '1999-09-12T02:00:00.000000000', '1999-09-12T03:00:00.000000000', '1999-09-12T04:00:00.000000000', '1999-09-12T05:00:00.000000000', '1999-09-12T06:00:00.000000000', '1999-09-12T07:00:00.000000000', '1999-09-12T08:00:00.000000000', '1999-09-12T09:00:00.000000000', '1999-09-12T10:00:00.000000000', '1999-09-12T11:00:00.000000000', '1999-09-12T12:00:00.000000000', '1999-09-12T13:00:00.000000000', '1999-09-12T14:00:00.000000000', '1999-09-12T15:00:00.000000000', '1999-09-12T16:00:00.000000000', '1999-09-12T17:00:00.000000000', '1999-09-12T18:00:00.000000000', '1999-09-12T19:00:00.000000000', '1999-09-12T20:00:00.000000000', '1999-09-12T21:00:00.000000000', '1999-09-12T22:00:00.000000000', '1999-09-12T23:00:00.000000000', '1999-09-13T00:00:00.000000000', '1999-09-13T01:00:00.000000000', '1999-09-13T02:00:00.000000000', '1999-09-13T03:00:00.000000000', '1999-09-13T04:00:00.000000000', '1999-09-13T05:00:00.000000000', '1999-09-13T06:00:00.000000000', '1999-09-13T07:00:00.000000000', '1999-09-13T08:00:00.000000000', '1999-09-13T09:00:00.000000000', '1999-09-13T10:00:00.000000000', '1999-09-13T11:00:00.000000000', '1999-09-13T12:00:00.000000000', '1999-09-13T13:00:00.000000000', '1999-09-13T14:00:00.000000000', '1999-09-13T15:00:00.000000000', '1999-09-13T16:00:00.000000000', '1999-09-13T17:00:00.000000000', '1999-09-13T18:00:00.000000000', '1999-09-13T19:00:00.000000000', '1999-09-13T20:00:00.000000000', '1999-09-13T21:00:00.000000000', '1999-09-13T22:00:00.000000000', '1999-09-13T23:00:00.000000000', '1999-09-14T00:00:00.000000000', '1999-09-14T01:00:00.000000000', '1999-09-14T02:00:00.000000000', '1999-09-14T03:00:00.000000000', '1999-09-14T04:00:00.000000000', '1999-09-14T05:00:00.000000000', '1999-09-14T06:00:00.000000000', '1999-09-14T07:00:00.000000000', '1999-09-14T08:00:00.000000000', '1999-09-14T09:00:00.000000000', '1999-09-14T10:00:00.000000000', '1999-09-14T11:00:00.000000000', '1999-09-14T12:00:00.000000000', '1999-09-14T13:00:00.000000000', '1999-09-14T14:00:00.000000000', '1999-09-14T15:00:00.000000000', '1999-09-14T16:00:00.000000000', '1999-09-14T17:00:00.000000000', '1999-09-14T18:00:00.000000000', '1999-09-14T19:00:00.000000000', '1999-09-14T20:00:00.000000000', '1999-09-14T21:00:00.000000000', '1999-09-14T22:00:00.000000000', '1999-09-14T23:00:00.000000000', '1999-09-15T00:00:00.000000000'], dtype='datetime64[ns]') - longitude()float32-110.00916
array(-110.00916, dtype=float32)
- latitude()float323.4837093
array(3.4837093, dtype=float32)
- depth(depth)float32-1.25 -3.75 ... -881.6718 -944.4181
array([ -1.25 , -3.75 , -6.25 , -8.75 , -11.25 , -13.75 , -16.25 , -18.75 , -21.25 , -23.75 , -26.25 , -28.75 , -31.25 , -33.75 , -36.25 , -38.75 , -41.25 , -43.75 , -46.25 , -48.75 , -51.25 , -53.75 , -56.25 , -58.75 , -61.25 , -63.75 , -66.25 , -68.75 , -71.25 , -73.75 , -76.25 , -78.75 , -81.25 , -83.75 , -86.25 , -88.75 , -91.25 , -93.75 , -96.25 , -98.75 , -101.25 , -103.75 , -106.25 , -108.75 , -111.25 , -113.75 , -116.25 , -118.75 , -121.25 , -123.75 , -126.25 , -128.75 , -131.25 , -133.75 , -136.25 , -138.75 , -141.25 , -143.75 , -146.25 , -148.75 , -151.25 , -153.75 , -156.25 , -158.75 , -161.25 , -163.75 , -166.25 , -168.75 , -171.25 , -173.75 , -176.25 , -178.75 , -181.25 , -183.75 , -186.25 , -188.75 , -191.25 , -193.75 , -196.25 , -198.75 , -201.25 , -203.75 , -206.25 , -208.75 , -211.25 , -213.75 , -216.25 , -218.75 , -221.25 , -223.75 , -226.25 , -228.75 , -231.25 , -233.75 , -236.25 , -238.75 , -241.25 , -243.75 , -246.25 , -248.75 , -251.36874, -254.2363 , -257.37625, -260.8145 , -264.5794 , -268.70193, -273.21616, -278.1592 , -283.57184, -289.4987 , -295.98856, -303.0949 , -310.8764 , -319.39716, -328.72736, -338.94394, -350.13116, -362.3811 , -375.79474, -390.4827 , -406.56604, -424.17734, -443.4617 , -464.57806, -487.70044, -513.0195 , -540.7438 , -571.1019 , -604.3441 , -640.7443 , -680.6025 , -724.2472 , -772.03815, -824.36926, -881.6718 , -944.4181 ], dtype=float32)
- KPPhbl(time)float32dask.array<chunksize=(1,), meta=np.ndarray>
Array Chunk Bytes 676 B 8 B Shape (169,) (2,) Count 3874 Tasks 168 Chunks Type float32 numpy.ndarray - KPPfrac(time)float32dask.array<chunksize=(1,), meta=np.ndarray>
Array Chunk Bytes 676 B 8 B Shape (169,) (2,) Count 3874 Tasks 168 Chunks Type float32 numpy.ndarray - KPPbo(time)float32dask.array<chunksize=(1,), meta=np.ndarray>
Array Chunk Bytes 676 B 8 B Shape (169,) (2,) Count 3874 Tasks 168 Chunks Type float32 numpy.ndarray - KPPbosol(time)float32dask.array<chunksize=(1,), meta=np.ndarray>
Array Chunk Bytes 676 B 8 B Shape (169,) (2,) Count 3874 Tasks 168 Chunks Type float32 numpy.ndarray - KPPviscA(time, depth)float32dask.array<chunksize=(1, 136), meta=np.ndarray>
Array Chunk Bytes 91.94 kB 1.09 kB Shape (169, 136) (2, 136) Count 4044 Tasks 168 Chunks Type float32 numpy.ndarray - KPPdiffT(time, depth)float32dask.array<chunksize=(1, 136), meta=np.ndarray>
Array Chunk Bytes 91.94 kB 1.09 kB Shape (169, 136) (2, 136) Count 4044 Tasks 168 Chunks Type float32 numpy.ndarray - KPPdbsfc(time, depth)float32dask.array<chunksize=(1, 136), meta=np.ndarray>
Array Chunk Bytes 91.94 kB 1.09 kB Shape (169, 136) (2, 136) Count 4044 Tasks 168 Chunks Type float32 numpy.ndarray - KPPbfsfc(time, depth)float32dask.array<chunksize=(1, 136), meta=np.ndarray>
Array Chunk Bytes 91.94 kB 1.09 kB Shape (169, 136) (2, 136) Count 4044 Tasks 168 Chunks Type float32 numpy.ndarray - KPPRi(time, depth)float32dask.array<chunksize=(1, 136), meta=np.ndarray>
Array Chunk Bytes 91.94 kB 1.09 kB Shape (169, 136) (2, 136) Count 4044 Tasks 168 Chunks Type float32 numpy.ndarray - KPPdbloc(time, depth)float32dask.array<chunksize=(1, 136), meta=np.ndarray>
Array Chunk Bytes 91.94 kB 1.09 kB Shape (169, 136) (2, 136) Count 4044 Tasks 168 Chunks Type float32 numpy.ndarray
kppeq.KPPhbl.load()
kppeq.KPPRi.load()
- time: 169
- depth: 136
- nan -0.072856516 -0.049158316 -0.010265699 ... nan nan nan nan
array([[ nan, -7.28565156e-02, -4.91583161e-02, ..., 4.15663185e+01, 4.27496376e+01, 4.35260162e+01], [ nan, -9.19454768e-02, -7.40848482e-02, ..., 4.33817825e+01, 4.47163200e+01, 4.55936394e+01], [ nan, -1.04447804e-01, -9.60322767e-02, ..., 4.47098045e+01, 4.61663933e+01, 4.71218681e+01], ..., [ nan, -3.40390988e-02, -3.26437652e-02, ..., 1.78085266e+02, 2.02577866e+02, 2.19549545e+02], [ nan, -6.18767738e-02, -7.47275874e-02, ..., 5.50265236e+01, 5.69808998e+01, 5.80998001e+01], [ nan, nan, nan, ..., nan, nan, nan]], dtype=float32) - time(time)datetime64[ns]1999-09-08 ... 1999-09-15
array(['1999-09-08T00:00:00.000000000', '1999-09-08T01:00:00.000000000', '1999-09-08T02:00:00.000000000', '1999-09-08T03:00:00.000000000', '1999-09-08T04:00:00.000000000', '1999-09-08T05:00:00.000000000', '1999-09-08T06:00:00.000000000', '1999-09-08T07:00:00.000000000', '1999-09-08T08:00:00.000000000', '1999-09-08T09:00:00.000000000', '1999-09-08T10:00:00.000000000', '1999-09-08T11:00:00.000000000', '1999-09-08T12:00:00.000000000', '1999-09-08T13:00:00.000000000', '1999-09-08T14:00:00.000000000', '1999-09-08T15:00:00.000000000', '1999-09-08T16:00:00.000000000', '1999-09-08T17:00:00.000000000', '1999-09-08T18:00:00.000000000', '1999-09-08T19:00:00.000000000', '1999-09-08T20:00:00.000000000', '1999-09-08T21:00:00.000000000', '1999-09-08T22:00:00.000000000', '1999-09-08T23:00:00.000000000', '1999-09-09T00:00:00.000000000', '1999-09-09T01:00:00.000000000', '1999-09-09T02:00:00.000000000', '1999-09-09T03:00:00.000000000', '1999-09-09T04:00:00.000000000', '1999-09-09T05:00:00.000000000', '1999-09-09T06:00:00.000000000', '1999-09-09T07:00:00.000000000', '1999-09-09T08:00:00.000000000', '1999-09-09T09:00:00.000000000', '1999-09-09T10:00:00.000000000', '1999-09-09T11:00:00.000000000', '1999-09-09T12:00:00.000000000', '1999-09-09T13:00:00.000000000', '1999-09-09T14:00:00.000000000', '1999-09-09T15:00:00.000000000', '1999-09-09T16:00:00.000000000', '1999-09-09T17:00:00.000000000', '1999-09-09T18:00:00.000000000', '1999-09-09T19:00:00.000000000', '1999-09-09T20:00:00.000000000', '1999-09-09T21:00:00.000000000', '1999-09-09T22:00:00.000000000', '1999-09-09T23:00:00.000000000', '1999-09-10T00:00:00.000000000', '1999-09-10T01:00:00.000000000', '1999-09-10T02:00:00.000000000', '1999-09-10T03:00:00.000000000', '1999-09-10T04:00:00.000000000', '1999-09-10T05:00:00.000000000', '1999-09-10T06:00:00.000000000', '1999-09-10T07:00:00.000000000', '1999-09-10T08:00:00.000000000', '1999-09-10T09:00:00.000000000', '1999-09-10T10:00:00.000000000', '1999-09-10T11:00:00.000000000', '1999-09-10T12:00:00.000000000', '1999-09-10T13:00:00.000000000', '1999-09-10T14:00:00.000000000', '1999-09-10T15:00:00.000000000', '1999-09-10T16:00:00.000000000', '1999-09-10T17:00:00.000000000', '1999-09-10T18:00:00.000000000', '1999-09-10T19:00:00.000000000', '1999-09-10T20:00:00.000000000', '1999-09-10T21:00:00.000000000', '1999-09-10T22:00:00.000000000', '1999-09-10T23:00:00.000000000', '1999-09-11T00:00:00.000000000', '1999-09-11T01:00:00.000000000', '1999-09-11T02:00:00.000000000', '1999-09-11T03:00:00.000000000', '1999-09-11T04:00:00.000000000', '1999-09-11T05:00:00.000000000', '1999-09-11T06:00:00.000000000', '1999-09-11T07:00:00.000000000', '1999-09-11T08:00:00.000000000', '1999-09-11T09:00:00.000000000', '1999-09-11T10:00:00.000000000', '1999-09-11T11:00:00.000000000', '1999-09-11T12:00:00.000000000', '1999-09-11T13:00:00.000000000', '1999-09-11T14:00:00.000000000', '1999-09-11T15:00:00.000000000', '1999-09-11T16:00:00.000000000', '1999-09-11T17:00:00.000000000', '1999-09-11T18:00:00.000000000', '1999-09-11T19:00:00.000000000', '1999-09-11T20:00:00.000000000', '1999-09-11T21:00:00.000000000', '1999-09-11T22:00:00.000000000', '1999-09-11T23:00:00.000000000', '1999-09-12T00:00:00.000000000', '1999-09-12T01:00:00.000000000', '1999-09-12T02:00:00.000000000', '1999-09-12T03:00:00.000000000', '1999-09-12T04:00:00.000000000', '1999-09-12T05:00:00.000000000', '1999-09-12T06:00:00.000000000', '1999-09-12T07:00:00.000000000', '1999-09-12T08:00:00.000000000', '1999-09-12T09:00:00.000000000', '1999-09-12T10:00:00.000000000', '1999-09-12T11:00:00.000000000', '1999-09-12T12:00:00.000000000', '1999-09-12T13:00:00.000000000', '1999-09-12T14:00:00.000000000', '1999-09-12T15:00:00.000000000', '1999-09-12T16:00:00.000000000', '1999-09-12T17:00:00.000000000', '1999-09-12T18:00:00.000000000', '1999-09-12T19:00:00.000000000', '1999-09-12T20:00:00.000000000', '1999-09-12T21:00:00.000000000', '1999-09-12T22:00:00.000000000', '1999-09-12T23:00:00.000000000', '1999-09-13T00:00:00.000000000', '1999-09-13T01:00:00.000000000', '1999-09-13T02:00:00.000000000', '1999-09-13T03:00:00.000000000', '1999-09-13T04:00:00.000000000', '1999-09-13T05:00:00.000000000', '1999-09-13T06:00:00.000000000', '1999-09-13T07:00:00.000000000', '1999-09-13T08:00:00.000000000', '1999-09-13T09:00:00.000000000', '1999-09-13T10:00:00.000000000', '1999-09-13T11:00:00.000000000', '1999-09-13T12:00:00.000000000', '1999-09-13T13:00:00.000000000', '1999-09-13T14:00:00.000000000', '1999-09-13T15:00:00.000000000', '1999-09-13T16:00:00.000000000', '1999-09-13T17:00:00.000000000', '1999-09-13T18:00:00.000000000', '1999-09-13T19:00:00.000000000', '1999-09-13T20:00:00.000000000', '1999-09-13T21:00:00.000000000', '1999-09-13T22:00:00.000000000', '1999-09-13T23:00:00.000000000', '1999-09-14T00:00:00.000000000', '1999-09-14T01:00:00.000000000', '1999-09-14T02:00:00.000000000', '1999-09-14T03:00:00.000000000', '1999-09-14T04:00:00.000000000', '1999-09-14T05:00:00.000000000', '1999-09-14T06:00:00.000000000', '1999-09-14T07:00:00.000000000', '1999-09-14T08:00:00.000000000', '1999-09-14T09:00:00.000000000', '1999-09-14T10:00:00.000000000', '1999-09-14T11:00:00.000000000', '1999-09-14T12:00:00.000000000', '1999-09-14T13:00:00.000000000', '1999-09-14T14:00:00.000000000', '1999-09-14T15:00:00.000000000', '1999-09-14T16:00:00.000000000', '1999-09-14T17:00:00.000000000', '1999-09-14T18:00:00.000000000', '1999-09-14T19:00:00.000000000', '1999-09-14T20:00:00.000000000', '1999-09-14T21:00:00.000000000', '1999-09-14T22:00:00.000000000', '1999-09-14T23:00:00.000000000', '1999-09-15T00:00:00.000000000'], dtype='datetime64[ns]') - longitude()float32-110.00916
array(-110.00916, dtype=float32)
- latitude()float323.4837093
array(3.4837093, dtype=float32)
- depth(depth)float32-1.25 -3.75 ... -881.6718 -944.4181
array([ -1.25 , -3.75 , -6.25 , -8.75 , -11.25 , -13.75 , -16.25 , -18.75 , -21.25 , -23.75 , -26.25 , -28.75 , -31.25 , -33.75 , -36.25 , -38.75 , -41.25 , -43.75 , -46.25 , -48.75 , -51.25 , -53.75 , -56.25 , -58.75 , -61.25 , -63.75 , -66.25 , -68.75 , -71.25 , -73.75 , -76.25 , -78.75 , -81.25 , -83.75 , -86.25 , -88.75 , -91.25 , -93.75 , -96.25 , -98.75 , -101.25 , -103.75 , -106.25 , -108.75 , -111.25 , -113.75 , -116.25 , -118.75 , -121.25 , -123.75 , -126.25 , -128.75 , -131.25 , -133.75 , -136.25 , -138.75 , -141.25 , -143.75 , -146.25 , -148.75 , -151.25 , -153.75 , -156.25 , -158.75 , -161.25 , -163.75 , -166.25 , -168.75 , -171.25 , -173.75 , -176.25 , -178.75 , -181.25 , -183.75 , -186.25 , -188.75 , -191.25 , -193.75 , -196.25 , -198.75 , -201.25 , -203.75 , -206.25 , -208.75 , -211.25 , -213.75 , -216.25 , -218.75 , -221.25 , -223.75 , -226.25 , -228.75 , -231.25 , -233.75 , -236.25 , -238.75 , -241.25 , -243.75 , -246.25 , -248.75 , -251.36874, -254.2363 , -257.37625, -260.8145 , -264.5794 , -268.70193, -273.21616, -278.1592 , -283.57184, -289.4987 , -295.98856, -303.0949 , -310.8764 , -319.39716, -328.72736, -338.94394, -350.13116, -362.3811 , -375.79474, -390.4827 , -406.56604, -424.17734, -443.4617 , -464.57806, -487.70044, -513.0195 , -540.7438 , -571.1019 , -604.3441 , -640.7443 , -680.6025 , -724.2472 , -772.03815, -824.36926, -881.6718 , -944.4181 ], dtype=float32)
kppeq.KPPRi.sel(depth=slice(-150)).plot(y="depth", vmin=0.1, center=0.3)
(-1 * kppeq.KPPhbl).plot()
[<matplotlib.lines.Line2D at 0x2ad5a69346a0>]
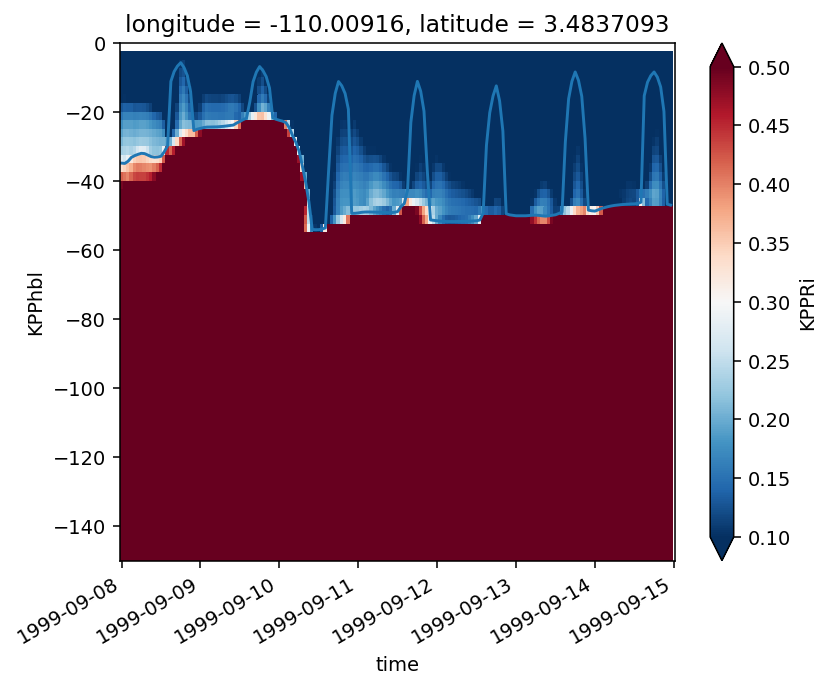
eq = eq.sel(time=kppeq.time.values)
itime = 13
subset = eq.isel(time=slice(1, None)).isel(time=itime).sel(depth=slice(-50)).compute()
Rib = KPP.kpp(
subset.u.values,
subset.v.values,
subset.theta.values,
subset.salt.values,
subset.depth.values,
np.arange(0, subset.depth[-1] - 2.5, -2.5),
subset.taux.values / 1025,
subset.tauy.values / 1025,
-(subset.netflux - subset.short).values / 1035 / 3999,
xr.zeros_like(subset.netflux).values,
-subset.short.values / 1035 / 3999,
COR=0,
hbl=12,
debug=True,
r1=0.62,
amu1=0.6,
r2=1 - 0.62,
amu2=20,
sigma=subset.dens.values - 1000,
rho0=1035,
)
plt.figure()
plt.plot(Rib, subset.depth)
kppeq.KPPRi.isel(time=itime).sel(depth=slice(-50)).plot(y="depth")
using given sigma
Net sfc buoyancy flux (without shortwave) : 8.00e-08 m²/s³, Shortwave buoyancy flux: -1.57e-07 m²/s³
kbl=5, ksl=0
surface layer: T=22.981, S=34.409, σ=23.491, Z=-1.250, U=-0.862, V=-0.200
dV2 = 0.8859959840774536, dVt2 = 0.001069049035243624
hbl_top = 3.75, hbl_bottom = 1.25
ustar = 3.391e-03 m/s
--- hekman: 237385246872857568.00, monin-obukhov: 4.22
--- hbl before limiting: 2.50
--- hbl after limiting: 2.50
kbl=2, ksl=0
surface layer: T=22.981, S=34.409, σ=23.491, Z=-1.250, U=-0.862, V=-0.200
dV2 = 0.8859959840774536, dVt2 = 0.0015779611668915864
hbl_top = 3.75, hbl_bottom = 1.25
ustar = 3.391e-03 m/s
--- hekman: 237385246872857568.00, monin-obukhov: 4.22
--- hbl before limiting: 2.50
--- hbl after limiting: 2.50
kbl=2, ksl=0
surface layer: T=22.981, S=34.409, σ=23.491, Z=-1.250, U=-0.862, V=-0.200
dV2 = 0.8859959840774536, dVt2 = 0.0020708721121411094
hbl_top = 3.75, hbl_bottom = 1.25
ustar = 3.391e-03 m/s
--- hekman: 237385246872857568.00, monin-obukhov: 4.22
--- hbl before limiting: 2.50
--- hbl after limiting: 2.50
[<matplotlib.lines.Line2D at 0x2aba11f6f4a8>]
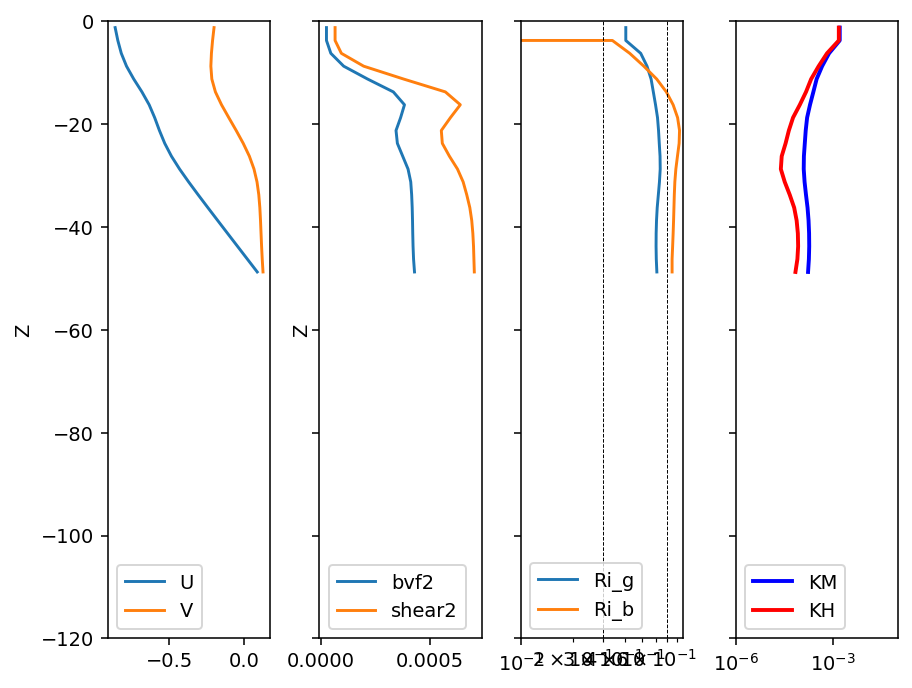
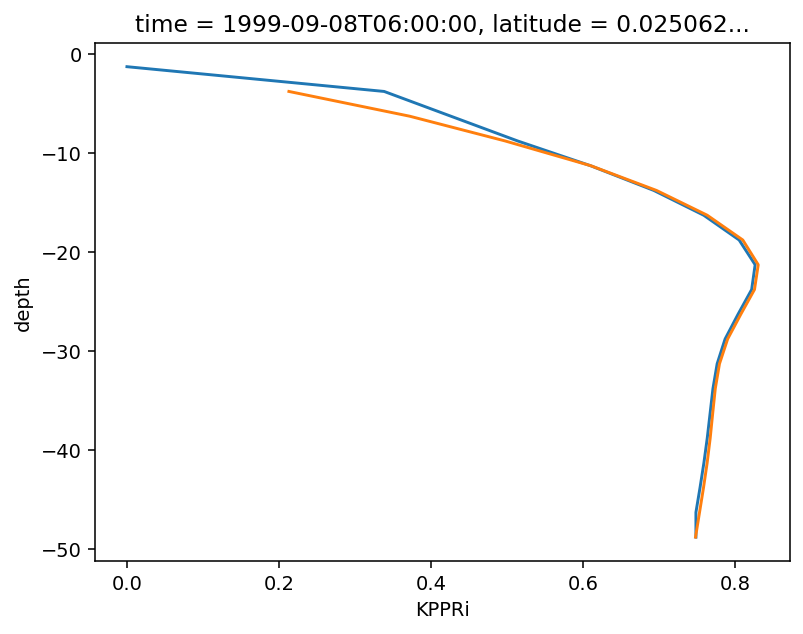
subset = eq.compute() # WTF
hbl = xr.apply_ufunc(
KPP.kpp,
subset.u,
subset.v,
subset.theta,
subset.salt,
subset.depth,
np.arange(0, subset.depth[-1] - 2.5, -2.5),
subset.taux / 1035,
subset.tauy / 1035,
-(subset.netflux - subset.short) / 1035 / 3999,
xr.zeros_like(subset.netflux),
-subset.short / 1035 / 3999,
kwargs=dict(COR=0, hbl=12, debug=False, r1=0.62, amu1=0.6, r2=1 - 0.62, amu2=20),
vectorize=True,
input_core_dims=[["depth"]] * 5
+ [["depth2"]]
+ [
[],
]
* 5,
# output_core_dims=[["time"]]
)
Todo#
Compare diffusivities before TIW and after TIW
Compare shear before and after TIW
Does the change in sign of velocity matter at the equator? (usl -u(h)). Is u the same sign in the hbl at the equator too?