Deep submesoscales in 1/100°?#
Are there submesoscale features in the deep eq ocean? Do we resolve them with coarser vertical spacing?
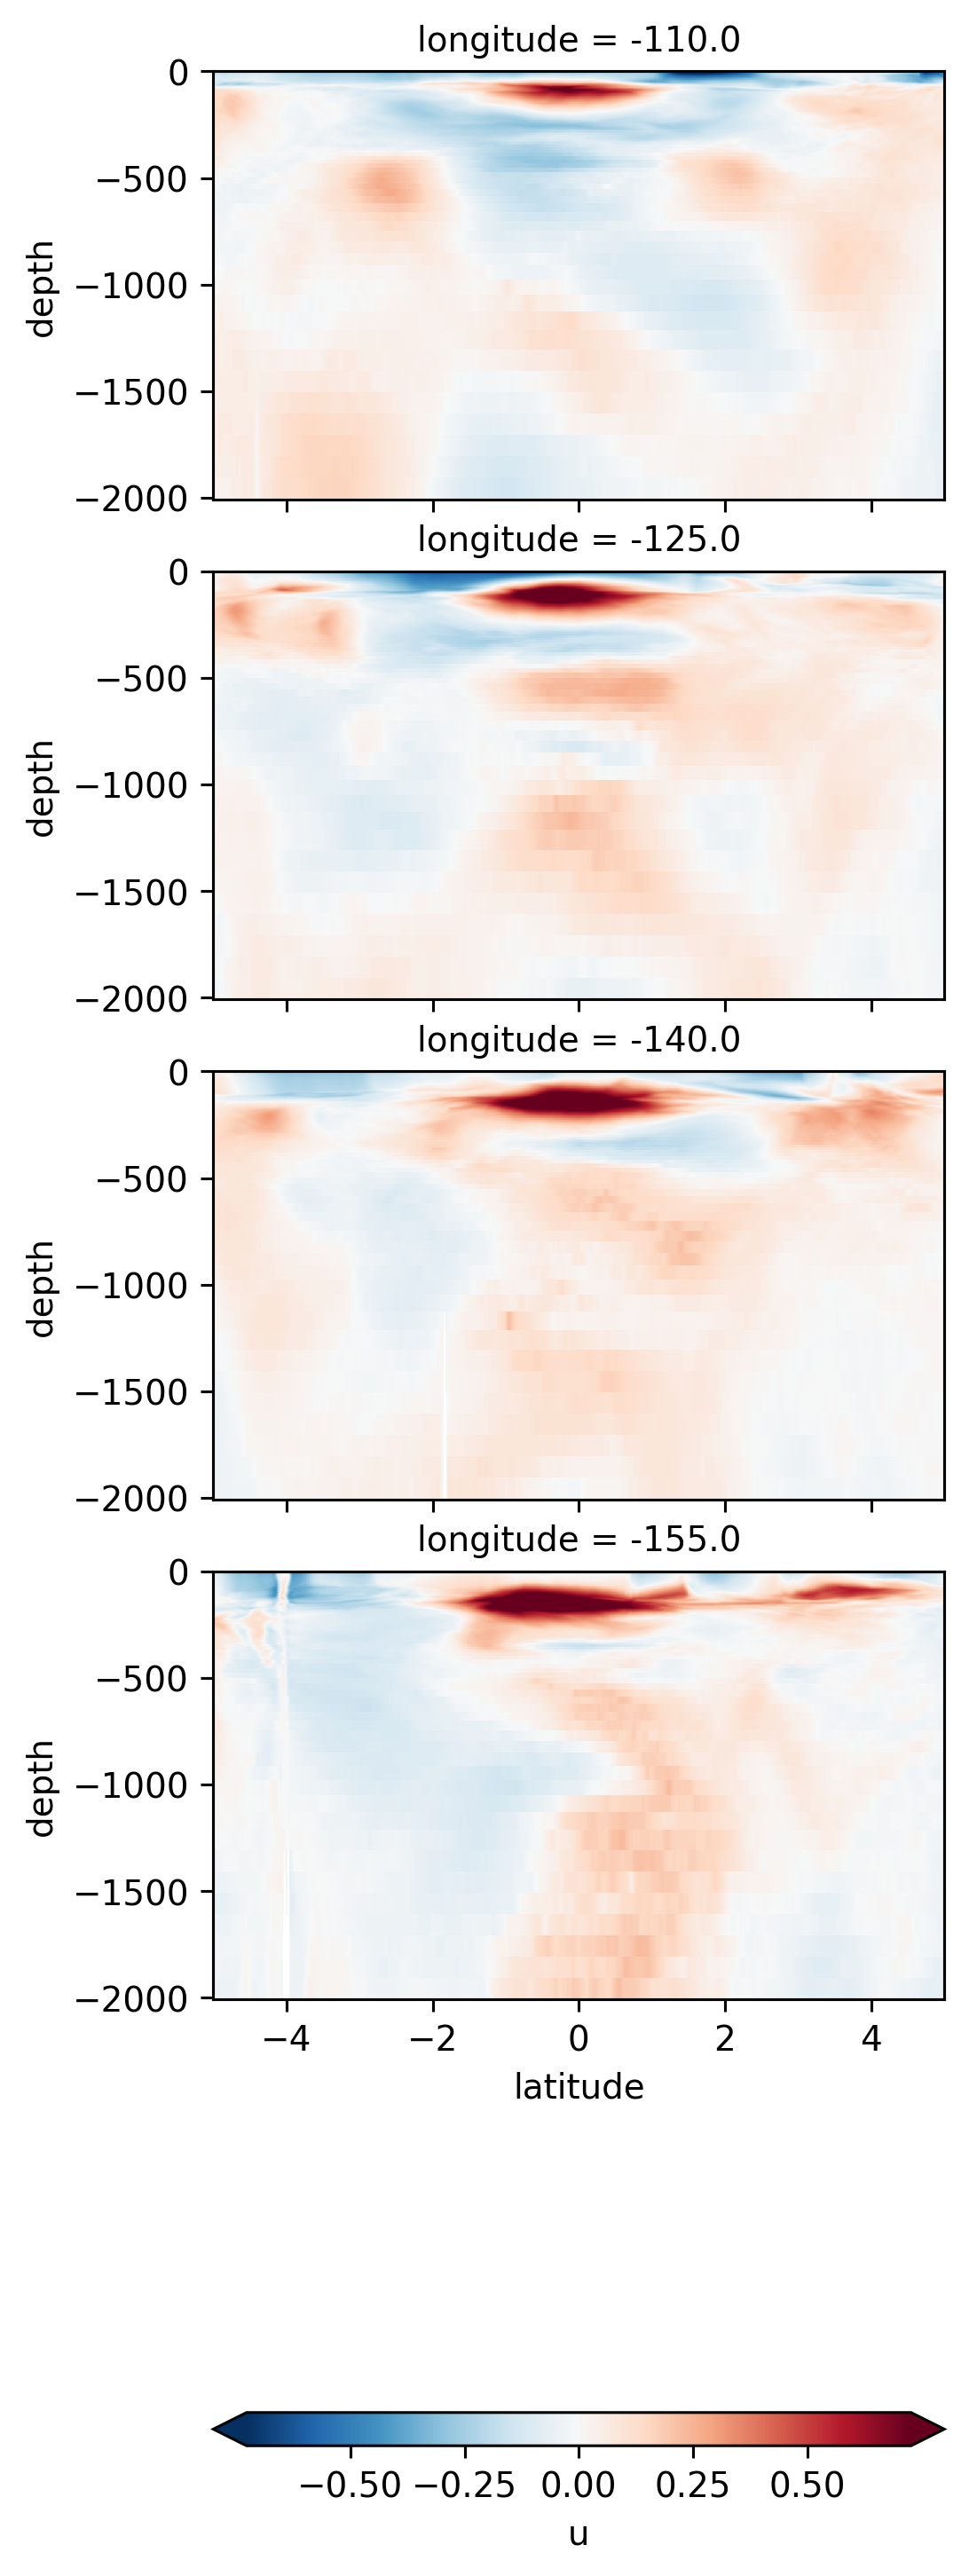
May be some fronty things close to the equator, but our vertical resolution gets coarse (≈40m at 500m depth), so we may not be resolving things properly
Setup#
%config InlineBackend.figure_format = "retina"
%matplotlib inline
%load_ext autoreload
%autoreload 2

import dask
import distributed
import matplotlib as mpl
import matplotlib.pyplot as plt
import numpy as np
import seawater as sw

import cf_xarray

import dcpy
import facetgrid
import xarray as xr

# import xmitgcm

# import pump

mpl.rcParams["savefig.dpi"] = 300
mpl.rcParams["savefig.bbox"] = "tight"
mpl.rcParams["figure.dpi"] = 140

xr.set_options(keep_attrs=True)
<xarray.core.options.set_options at 0x7f43eb4a8550>
cluster = distributed.LocalCluster(
    n_workers=24,
    processes=True,
    threads_per_worker=1,
    local_directory="/home/dcherian/.dask_worker/",
    dashboard_address=":9999",
    memory_limit="10GB",
)
cluster
client = distributed.Client(cluster)
Read data#
dirname = "/home/dcherian/pump/TPOS_MITgcm_HR/"
ds = xr.open_mfdataset(
    f"{dirname}/cmpr_*.nc",
    parallel=True,
    data_vars="minimal",
    coords="minimal",
    compat="override",
    chunks={"longitude": 1500, "latitude": 240},
)
Ro#
f = dcpy.oceans.coriolis(ds.latitude)
vor = ds.v.differentiate("longitude") / 110e3 - ds.u.differentiate("latitude") / 105e3
Ro = vor / f
Ro.attrs["long_name"] = "$Ro = ζ/f$"
Ro
<xarray.DataArray (time: 141, depth: 185, latitude: 2400, longitude: 7500)>
dask.array<truediv, shape=(141, 185, 2400, 7500), dtype=float32, chunksize=(1, 185, 240, 1500), chunktype=numpy.ndarray>
Coordinates:
  * latitude   (latitude) float32 -12.0 -11.99 -11.98 ... 11.98 11.99 12.0
  * longitude  (longitude) float32 -170.0 -170.0 -170.0 ... -95.02 -95.01 -95.0
  * depth      (depth) float32 -1.25 -3.75 -6.25 ... -5.658e+03 -5.758e+03
  * time       (time) datetime64[ns] 1995-11-07T08:00:00 ... 1995-11-30T16:00:00
Attributes:
    long_name:  $Ro = ζ/f$
xarray.DataArray
- time: 141
- depth: 185
- latitude: 2400
- longitude: 7500
- dask.array<chunksize=(1, 185, 240, 1500), meta=np.ndarray>
Array Chunk Bytes 1.88 TB 266.40 MB Shape (141, 185, 2400, 7500) (1, 185, 240, 1500) Count 165273 Tasks 7050 Chunks Type float32 numpy.ndarray - latitude(latitude)float32-12.0 -11.99 -11.98 ... 11.99 12.0
array([-12. , -11.989996, -11.979992, ..., 11.979992, 11.989996, 12. ], dtype=float32) - longitude(longitude)float32-170.0 -170.0 ... -95.01 -95.0
array([-170. , -169.99 , -169.98 , ..., -95.020004, -95.01 , -95. ], dtype=float32) - depth(depth)float32-1.25 -3.75 ... -5.758e+03
array([-1.250000e+00, -3.750000e+00, -6.250000e+00, -8.750000e+00, -1.125000e+01, -1.375000e+01, -1.625000e+01, -1.875000e+01, -2.125000e+01, -2.375000e+01, -2.625000e+01, -2.875000e+01, -3.125000e+01, -3.375000e+01, -3.625000e+01, -3.875000e+01, -4.125000e+01, -4.375000e+01, -4.625000e+01, -4.875000e+01, -5.125000e+01, -5.375000e+01, -5.625000e+01, -5.875000e+01, -6.125000e+01, -6.375000e+01, -6.625000e+01, -6.875000e+01, -7.125000e+01, -7.375000e+01, -7.625000e+01, -7.875000e+01, -8.125000e+01, -8.375000e+01, -8.625000e+01, -8.875000e+01, -9.125000e+01, -9.375000e+01, -9.625000e+01, -9.875000e+01, -1.012500e+02, -1.037500e+02, -1.062500e+02, -1.087500e+02, -1.112500e+02, -1.137500e+02, -1.162500e+02, -1.187500e+02, -1.212500e+02, -1.237500e+02, -1.262500e+02, -1.287500e+02, -1.312500e+02, -1.337500e+02, -1.362500e+02, -1.387500e+02, -1.412500e+02, -1.437500e+02, -1.462500e+02, -1.487500e+02, -1.512500e+02, -1.537500e+02, -1.562500e+02, -1.587500e+02, -1.612500e+02, -1.637500e+02, -1.662500e+02, -1.687500e+02, -1.712500e+02, -1.737500e+02, -1.762500e+02, -1.787500e+02, -1.812500e+02, -1.837500e+02, -1.862500e+02, -1.887500e+02, -1.912500e+02, -1.937500e+02, -1.962500e+02, -1.987500e+02, -2.012500e+02, -2.037500e+02, -2.062500e+02, -2.087500e+02, -2.112500e+02, -2.137500e+02, -2.162500e+02, -2.187500e+02, -2.212500e+02, -2.237500e+02, -2.262500e+02, -2.287500e+02, -2.312500e+02, -2.337500e+02, -2.362500e+02, -2.387500e+02, -2.412500e+02, -2.437500e+02, -2.462500e+02, -2.487500e+02, -2.513687e+02, -2.542363e+02, -2.573763e+02, -2.608145e+02, -2.645794e+02, -2.687019e+02, -2.732162e+02, -2.781592e+02, -2.835718e+02, -2.894987e+02, -2.959886e+02, -3.030949e+02, -3.108764e+02, -3.193972e+02, -3.287274e+02, -3.389439e+02, -3.501312e+02, -3.623811e+02, -3.757947e+02, -3.904827e+02, -4.065660e+02, -4.241773e+02, -4.434617e+02, -4.645781e+02, -4.877004e+02, -5.130195e+02, -5.407438e+02, -5.711019e+02, -6.043441e+02, -6.407443e+02, -6.806025e+02, -7.242472e+02, -7.720381e+02, -8.243693e+02, -8.816718e+02, -9.444181e+02, -1.013125e+03, -1.088360e+03, -1.170741e+03, -1.260949e+03, -1.358099e+03, -1.458099e+03, -1.558099e+03, -1.658099e+03, -1.758099e+03, -1.858099e+03, -1.958099e+03, -2.058098e+03, -2.158098e+03, -2.258098e+03, -2.358098e+03, -2.458098e+03, -2.558098e+03, -2.658098e+03, -2.758098e+03, -2.858098e+03, -2.958098e+03, -3.058098e+03, -3.158098e+03, -3.258098e+03, -3.358098e+03, -3.458098e+03, -3.558098e+03, -3.658098e+03, -3.758098e+03, -3.858098e+03, -3.958098e+03, -4.058098e+03, -4.158099e+03, -4.258099e+03, -4.358099e+03, -4.458099e+03, -4.558099e+03, -4.658099e+03, -4.758099e+03, -4.858099e+03, -4.958099e+03, -5.058099e+03, -5.158099e+03, -5.258099e+03, -5.358099e+03, -5.458099e+03, -5.558099e+03, -5.658099e+03, -5.758099e+03], dtype=float32) - time(time)datetime64[ns]1995-11-07T08:00:00 ... 1995-11-...
- long_name :
- Time (hours since 1950-01-01)
- standard_name :
- time
- axis :
- T
- _CoordinateAxisType :
- Time
array(['1995-11-07T08:00:00.000000000', '1995-11-07T12:00:00.000000000',
       '1995-11-07T16:00:00.000000000', '1995-11-07T20:00:00.000000000',
       '1995-11-08T00:00:00.000000000', '1995-11-08T04:00:00.000000000',
       '1995-11-08T08:00:00.000000000', '1995-11-08T12:00:00.000000000',
       '1995-11-08T16:00:00.000000000', '1995-11-08T20:00:00.000000000',
       '1995-11-09T00:00:00.000000000', '1995-11-09T04:00:00.000000000',
       '1995-11-09T08:00:00.000000000', '1995-11-09T12:00:00.000000000',
       '1995-11-09T16:00:00.000000000', '1995-11-09T20:00:00.000000000',
       '1995-11-10T00:00:00.000000000', '1995-11-10T04:00:00.000000000',
       '1995-11-10T08:00:00.000000000', '1995-11-10T12:00:00.000000000',
       '1995-11-10T16:00:00.000000000', '1995-11-10T20:00:00.000000000',
       '1995-11-11T00:00:00.000000000', '1995-11-11T04:00:00.000000000',
       '1995-11-11T08:00:00.000000000', '1995-11-11T12:00:00.000000000',
       '1995-11-11T16:00:00.000000000', '1995-11-11T20:00:00.000000000',
       '1995-11-12T00:00:00.000000000', '1995-11-12T04:00:00.000000000',
       '1995-11-12T08:00:00.000000000', '1995-11-12T12:00:00.000000000',
       '1995-11-12T16:00:00.000000000', '1995-11-12T20:00:00.000000000',
       '1995-11-13T00:00:00.000000000', '1995-11-13T04:00:00.000000000',
       '1995-11-13T08:00:00.000000000', '1995-11-13T12:00:00.000000000',
       '1995-11-13T16:00:00.000000000', '1995-11-13T20:00:00.000000000',
       '1995-11-14T00:00:00.000000000', '1995-11-14T04:00:00.000000000',
       '1995-11-14T08:00:00.000000000', '1995-11-14T12:00:00.000000000',
       '1995-11-14T16:00:00.000000000', '1995-11-14T20:00:00.000000000',
       '1995-11-15T00:00:00.000000000', '1995-11-15T04:00:00.000000000',
       '1995-11-15T08:00:00.000000000', '1995-11-15T12:00:00.000000000',
       '1995-11-15T16:00:00.000000000', '1995-11-15T20:00:00.000000000',
       '1995-11-16T00:00:00.000000000', '1995-11-16T04:00:00.000000000',
       '1995-11-16T08:00:00.000000000', '1995-11-16T12:00:00.000000000',
       '1995-11-16T16:00:00.000000000', '1995-11-16T20:00:00.000000000',
       '1995-11-17T00:00:00.000000000', '1995-11-17T04:00:00.000000000',
       '1995-11-17T08:00:00.000000000', '1995-11-17T12:00:00.000000000',
       '1995-11-17T16:00:00.000000000', '1995-11-17T20:00:00.000000000',
       '1995-11-18T00:00:00.000000000', '1995-11-18T04:00:00.000000000',
       '1995-11-18T08:00:00.000000000', '1995-11-18T12:00:00.000000000',
       '1995-11-18T16:00:00.000000000', '1995-11-18T20:00:00.000000000',
       '1995-11-19T00:00:00.000000000', '1995-11-19T04:00:00.000000000',
       '1995-11-19T08:00:00.000000000', '1995-11-19T12:00:00.000000000',
       '1995-11-19T16:00:00.000000000', '1995-11-19T20:00:00.000000000',
       '1995-11-20T00:00:00.000000000', '1995-11-20T04:00:00.000000000',
       '1995-11-20T08:00:00.000000000', '1995-11-20T12:00:00.000000000',
       '1995-11-20T16:00:00.000000000', '1995-11-20T20:00:00.000000000',
       '1995-11-21T00:00:00.000000000', '1995-11-21T04:00:00.000000000',
       '1995-11-21T08:00:00.000000000', '1995-11-21T12:00:00.000000000',
       '1995-11-21T16:00:00.000000000', '1995-11-21T20:00:00.000000000',
       '1995-11-22T00:00:00.000000000', '1995-11-22T04:00:00.000000000',
       '1995-11-22T08:00:00.000000000', '1995-11-22T12:00:00.000000000',
       '1995-11-22T16:00:00.000000000', '1995-11-22T20:00:00.000000000',
       '1995-11-23T00:00:00.000000000', '1995-11-23T04:00:00.000000000',
       '1995-11-23T08:00:00.000000000', '1995-11-23T12:00:00.000000000',
       '1995-11-23T16:00:00.000000000', '1995-11-23T20:00:00.000000000',
       '1995-11-24T00:00:00.000000000', '1995-11-24T04:00:00.000000000',
       '1995-11-24T08:00:00.000000000', '1995-11-24T12:00:00.000000000',
       '1995-11-24T16:00:00.000000000', '1995-11-24T20:00:00.000000000',
       '1995-11-25T00:00:00.000000000', '1995-11-25T04:00:00.000000000',
       '1995-11-25T08:00:00.000000000', '1995-11-25T12:00:00.000000000',
       '1995-11-25T16:00:00.000000000', '1995-11-25T20:00:00.000000000',
       '1995-11-26T00:00:00.000000000', '1995-11-26T04:00:00.000000000',
       '1995-11-26T08:00:00.000000000', '1995-11-26T12:00:00.000000000',
       '1995-11-26T16:00:00.000000000', '1995-11-26T20:00:00.000000000',
       '1995-11-27T00:00:00.000000000', '1995-11-27T04:00:00.000000000',
       '1995-11-27T08:00:00.000000000', '1995-11-27T12:00:00.000000000',
       '1995-11-27T16:00:00.000000000', '1995-11-27T20:00:00.000000000',
       '1995-11-28T00:00:00.000000000', '1995-11-28T04:00:00.000000000',
       '1995-11-28T08:00:00.000000000', '1995-11-28T12:00:00.000000000',
       '1995-11-28T16:00:00.000000000', '1995-11-28T20:00:00.000000000',
       '1995-11-29T00:00:00.000000000', '1995-11-29T04:00:00.000000000',
       '1995-11-29T08:00:00.000000000', '1995-11-29T12:00:00.000000000',
       '1995-11-29T16:00:00.000000000', '1995-11-29T20:00:00.000000000',
       '1995-11-30T00:00:00.000000000', '1995-11-30T04:00:00.000000000',
       '1995-11-30T08:00:00.000000000', '1995-11-30T12:00:00.000000000',
       '1995-11-30T16:00:00.000000000'], dtype='datetime64[ns]')
- long_name :
- $Ro = ζ/f$
Scott’s \(Ro\)
\begin{equation} Ro = \frac{|ζ|}{|ζ| + |f|} \end{equation}
sRo = np.abs(vor) / (np.abs(vor) + np.abs(f))
sRo.attrs["long_name"] = "$Ro = |ζ| / (|ζ| + |f|)$"
\(u\) lat-depth sections#
kwargs = dict(
    robust=True,
    vmin=0,
    vmax=0.8,
    cmap=mpl.cm.Spectral_r,
    cbar_kwargs={"orientation": "horizontal"},
)
ds.u.sel(longitude=[-110, -125, -140, -155], method="nearest").sel(
    latitude=slice(-5, 5), depth=slice(-2000)
).isel(time=50).plot(
    y="depth",
    x="latitude",
    row="longitude",
    robust=True,
    cbar_kwargs={"orientation": "horizontal"},
)
<xarray.plot.facetgrid.FacetGrid at 0x7f4552b2b7f0>
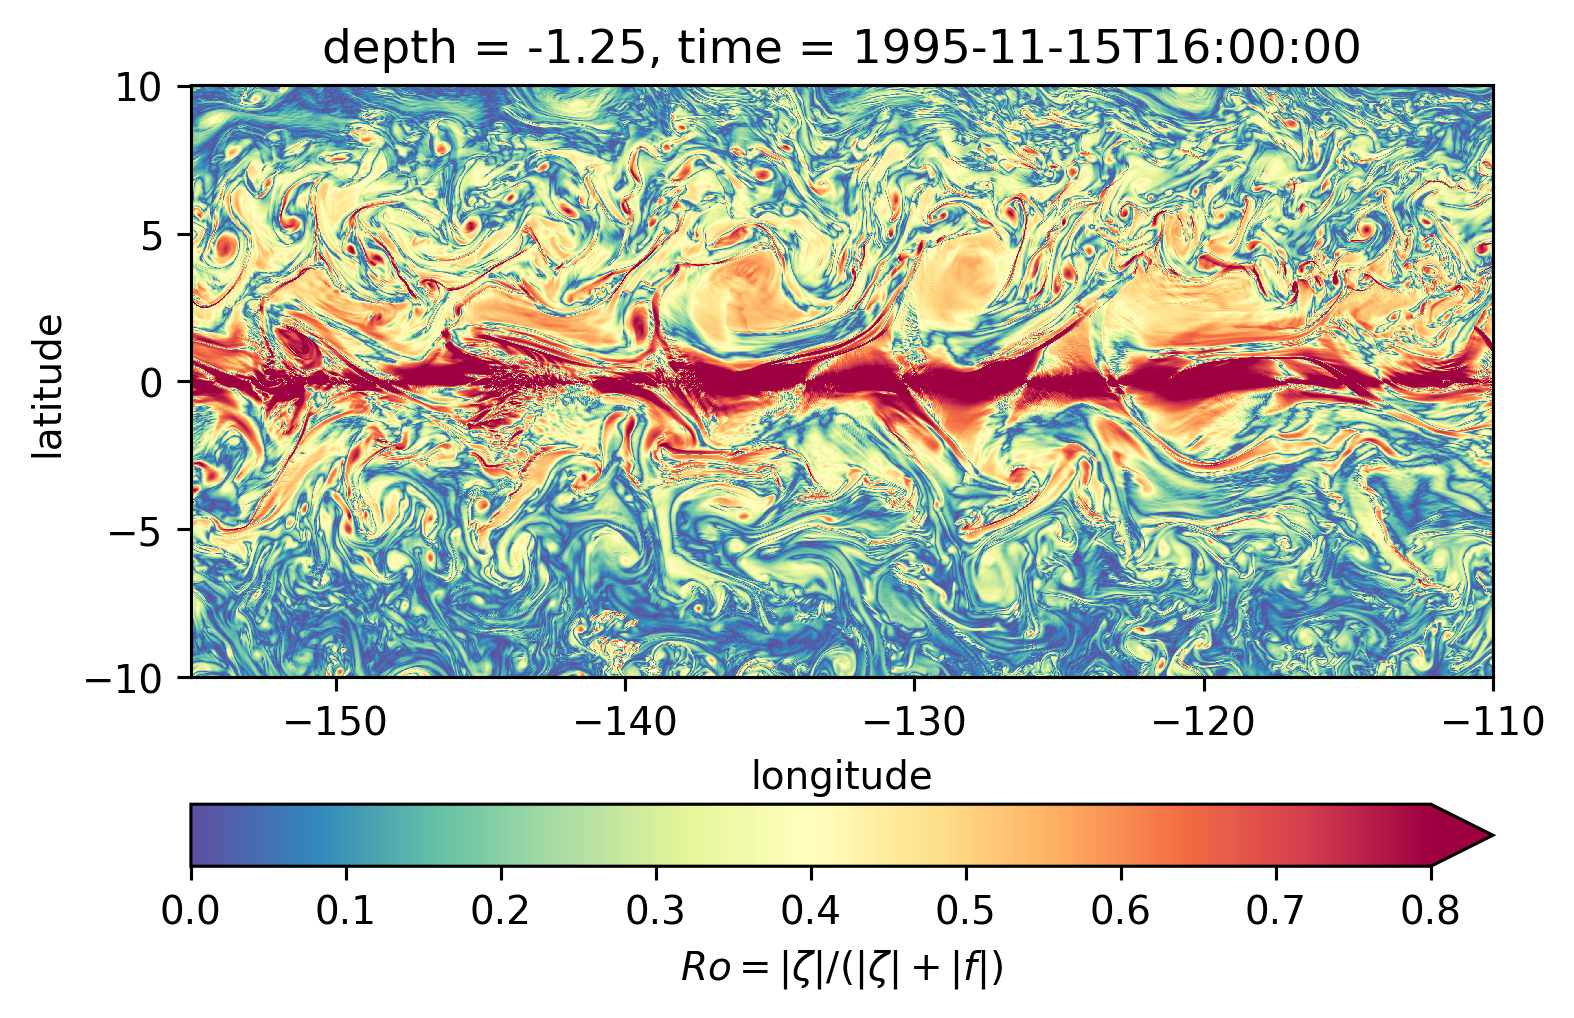
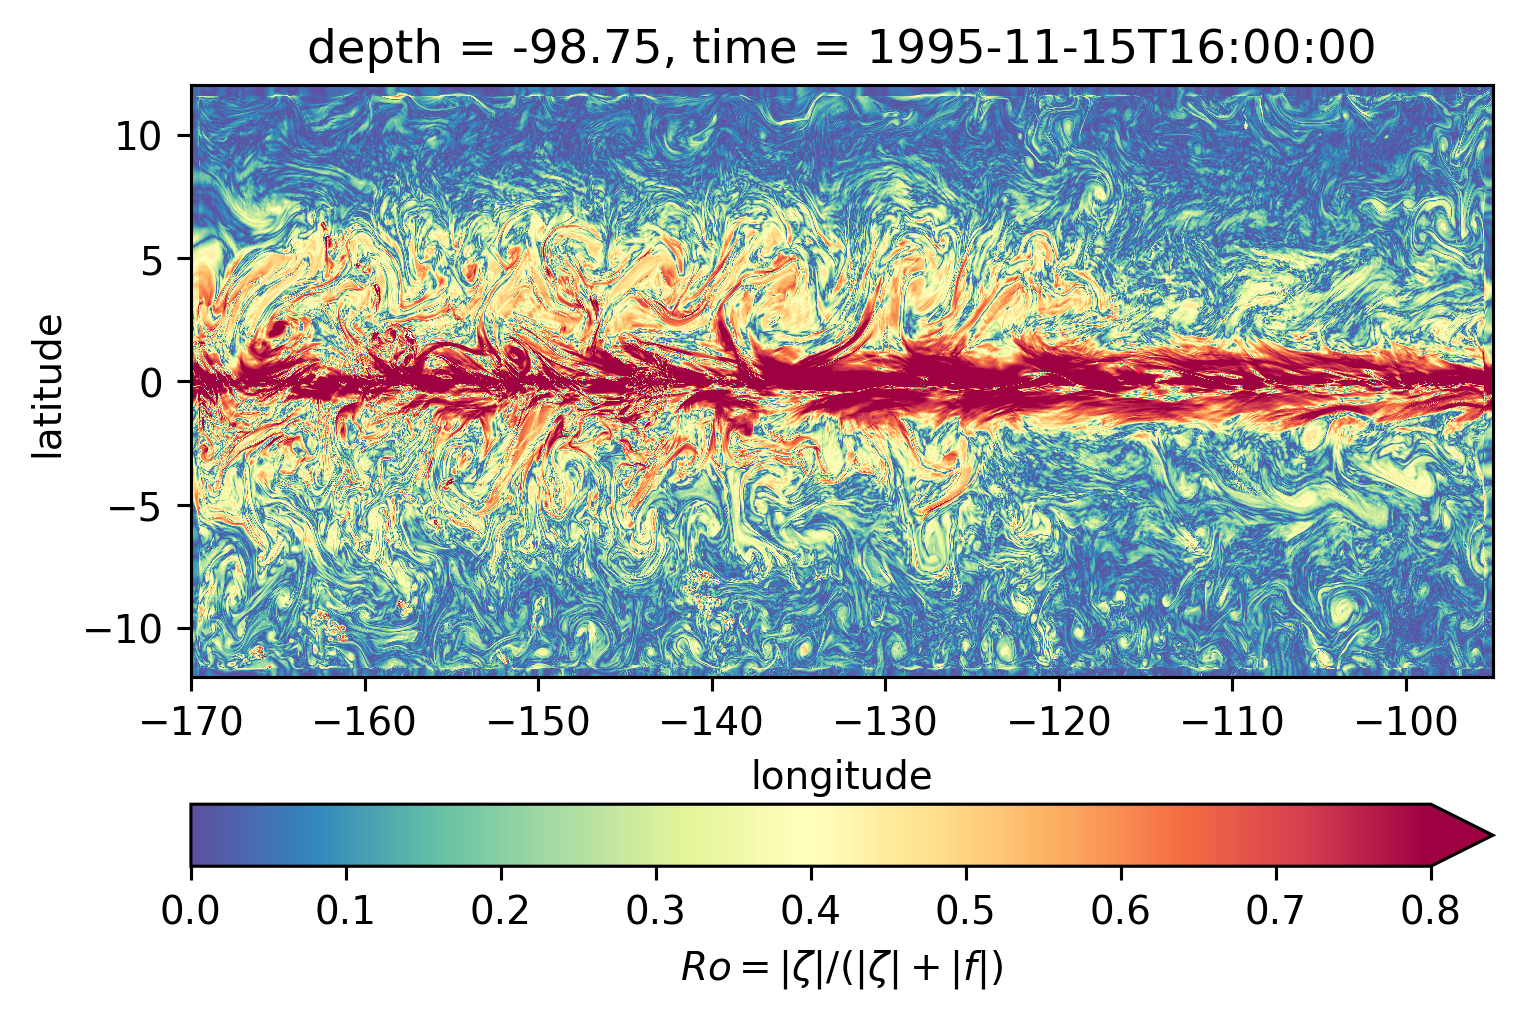
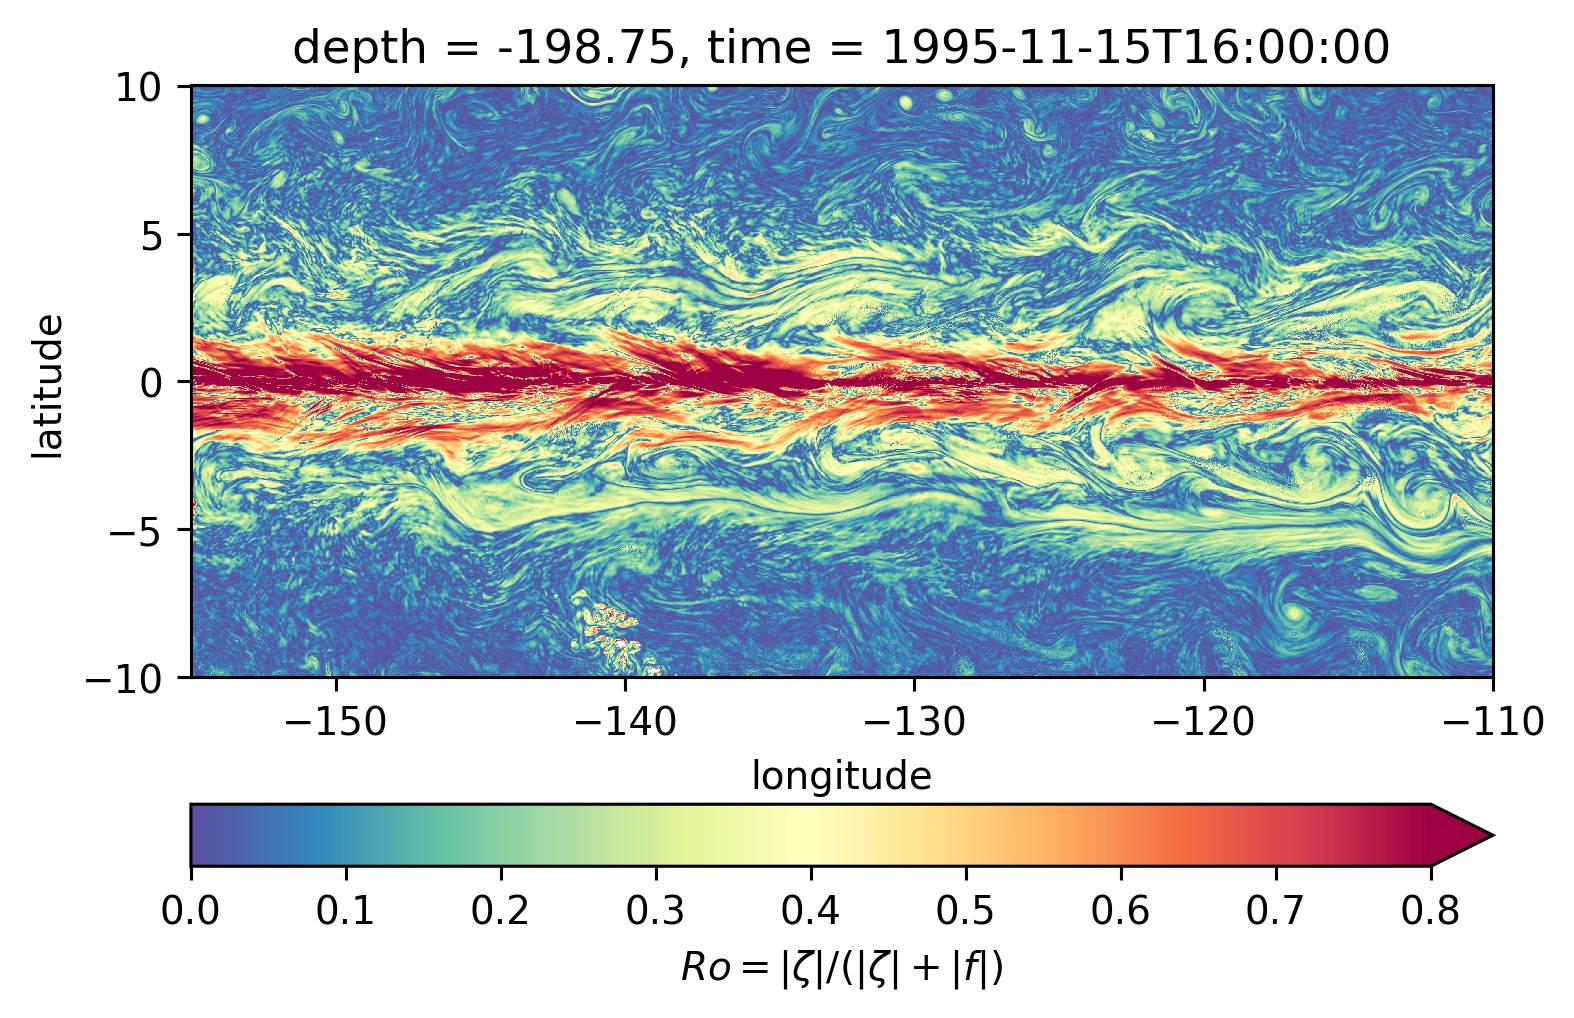
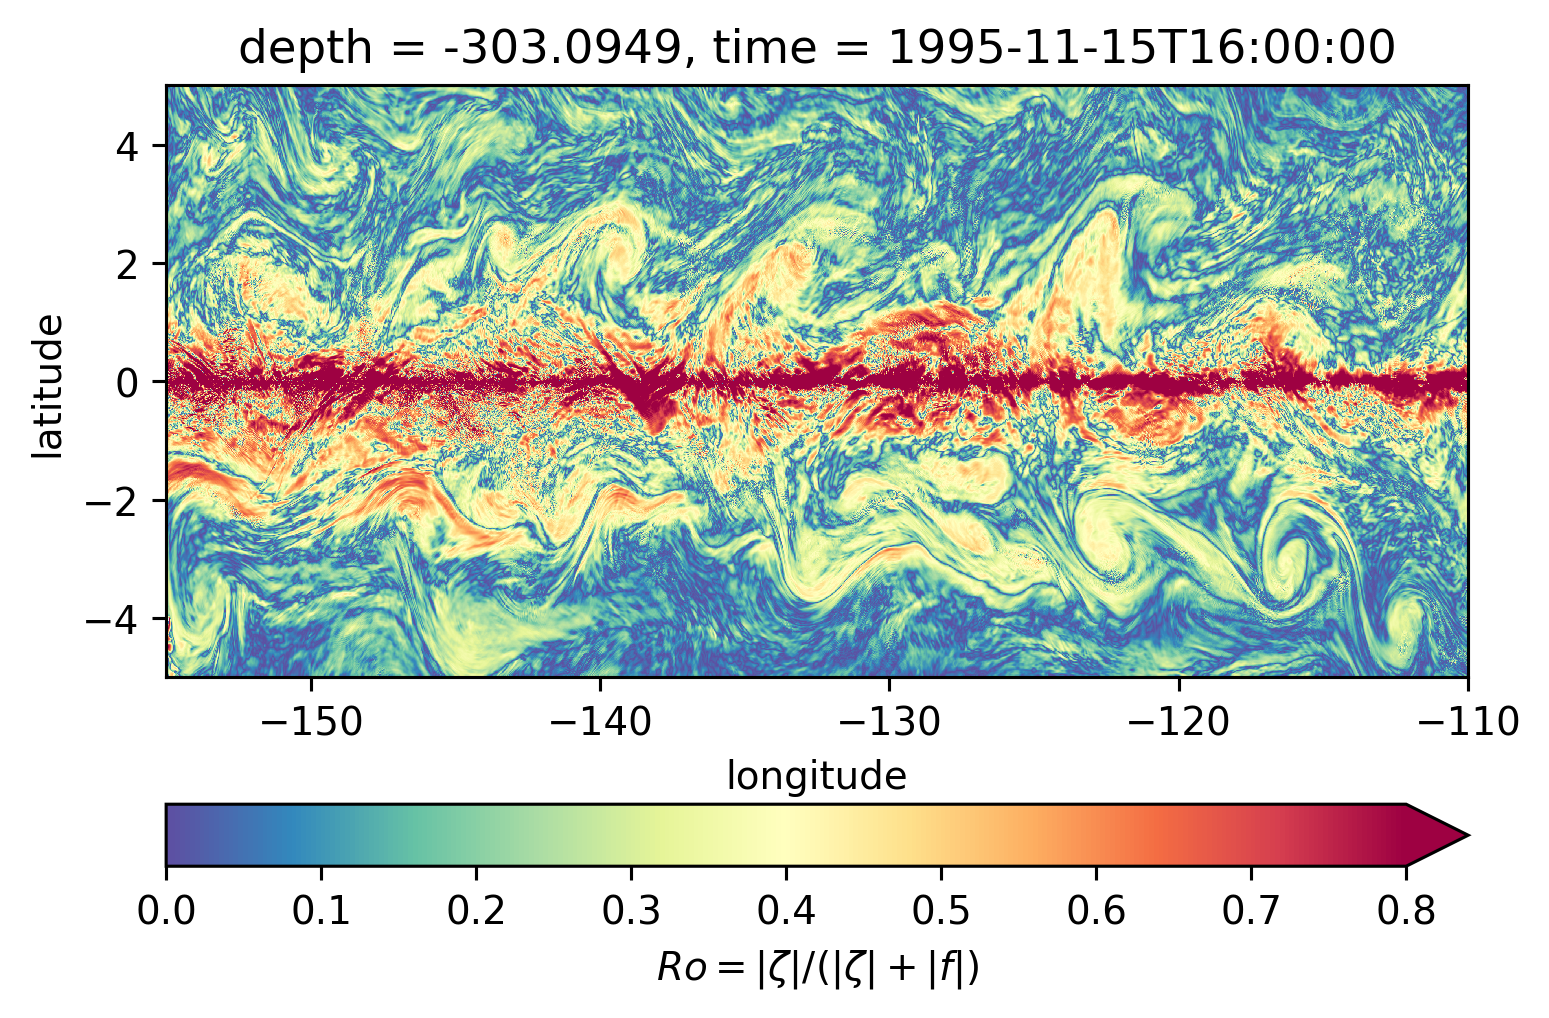
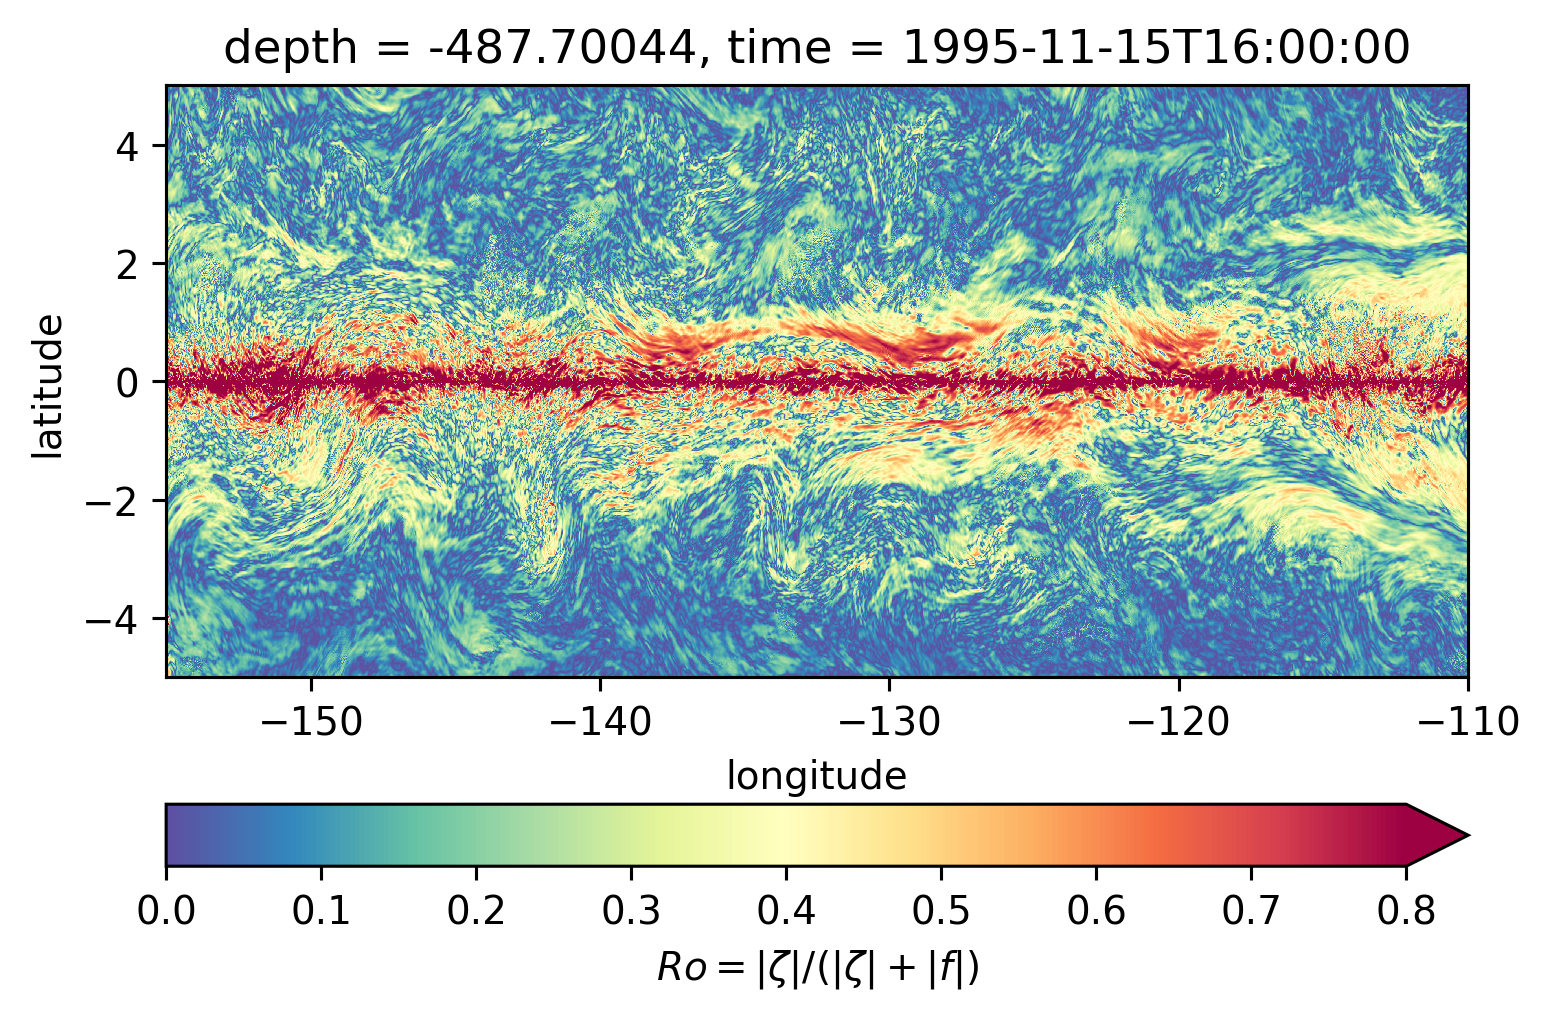
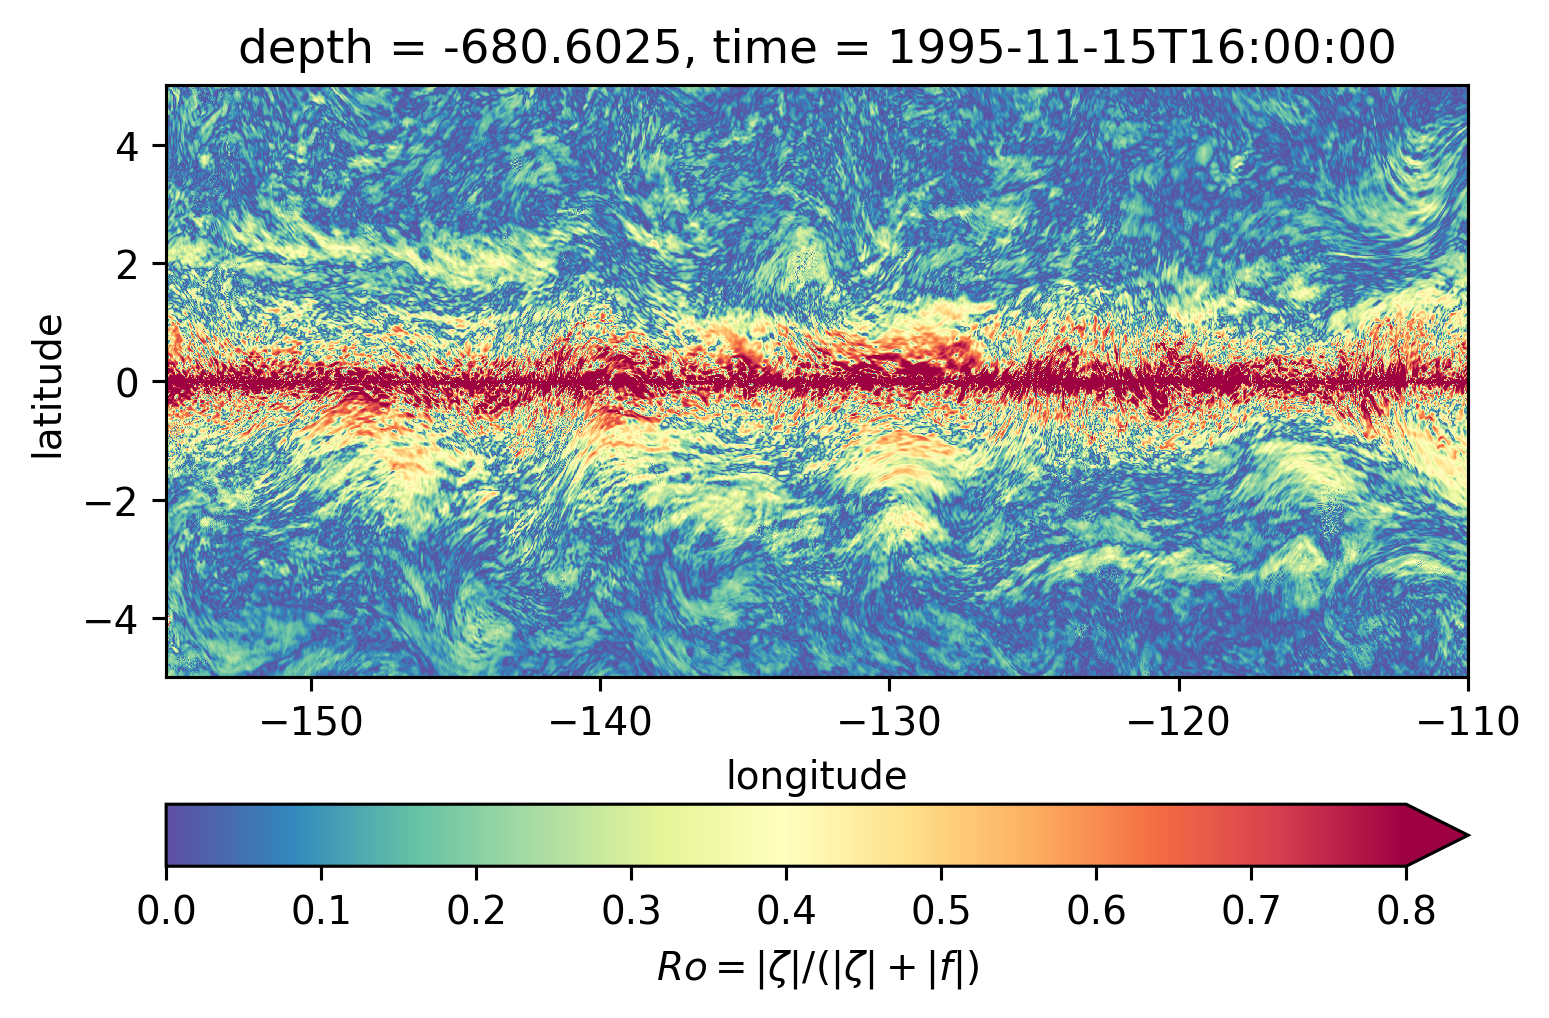
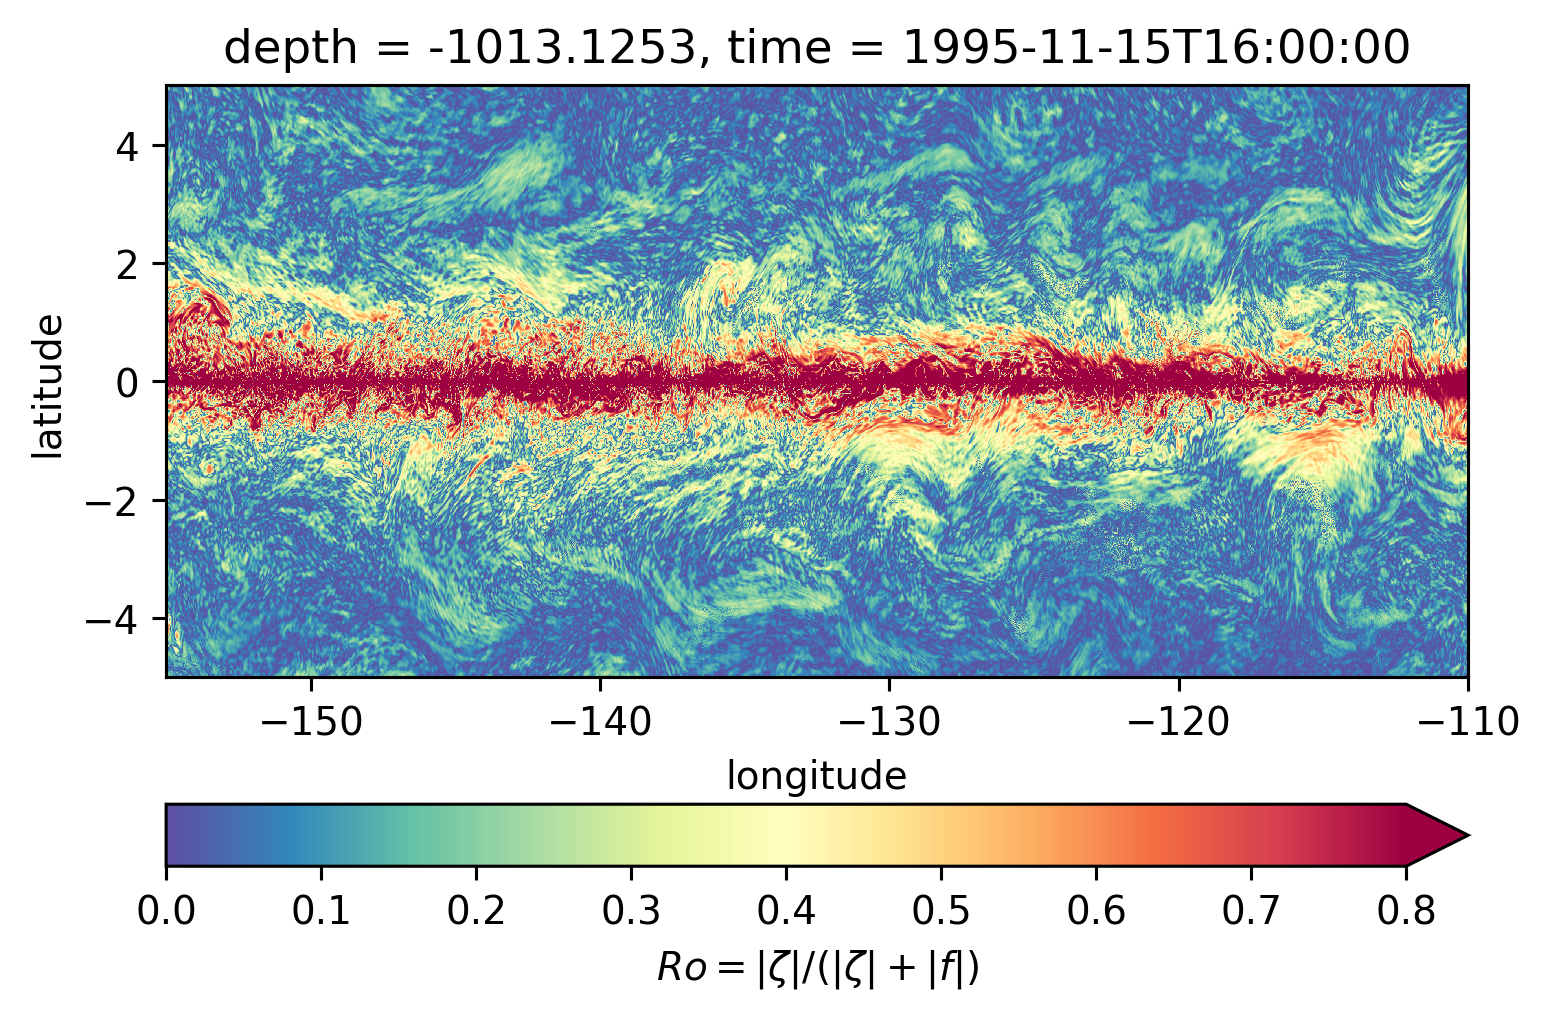
Scott \(Ro\) maps#
Looks more “fronty” at depth
subset = sRo.sel(latitude=slice(-10, 10), longitude=slice(-155, -110))
subset.isel(time=50).sel(depth=0, method="nearest").plot(**kwargs)
<matplotlib.collections.QuadMesh at 0x7f461efdd580>
sRo.isel(time=50).sel(depth=-100, method="nearest").plot(**kwargs)
<matplotlib.collections.QuadMesh at 0x7f47b6c28f70>
subset.isel(time=50).sel(depth=-200, method="nearest").plot(**kwargs)
<matplotlib.collections.QuadMesh at 0x7f4284573d60>
for depth in [-300, -500, -700, -1000]:
    plt.figure()
    subset.isel(time=50).sel(depth=depth, method="nearest").plot(ylim=(-5, 5), **kwargs)
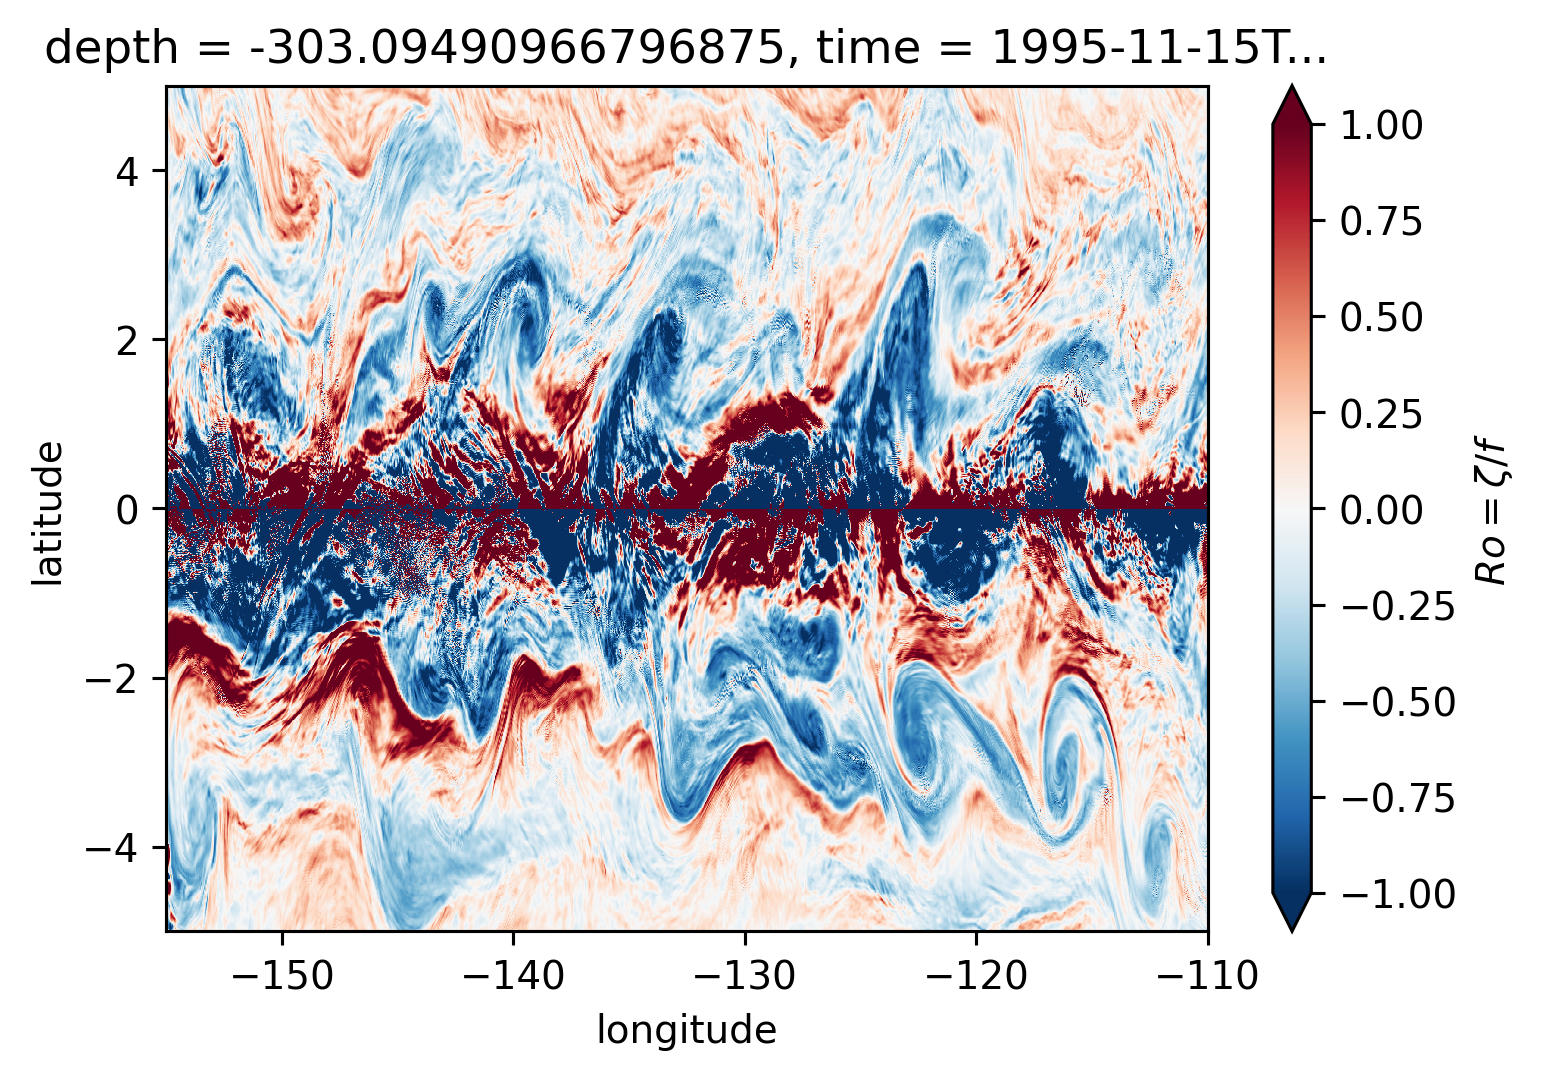
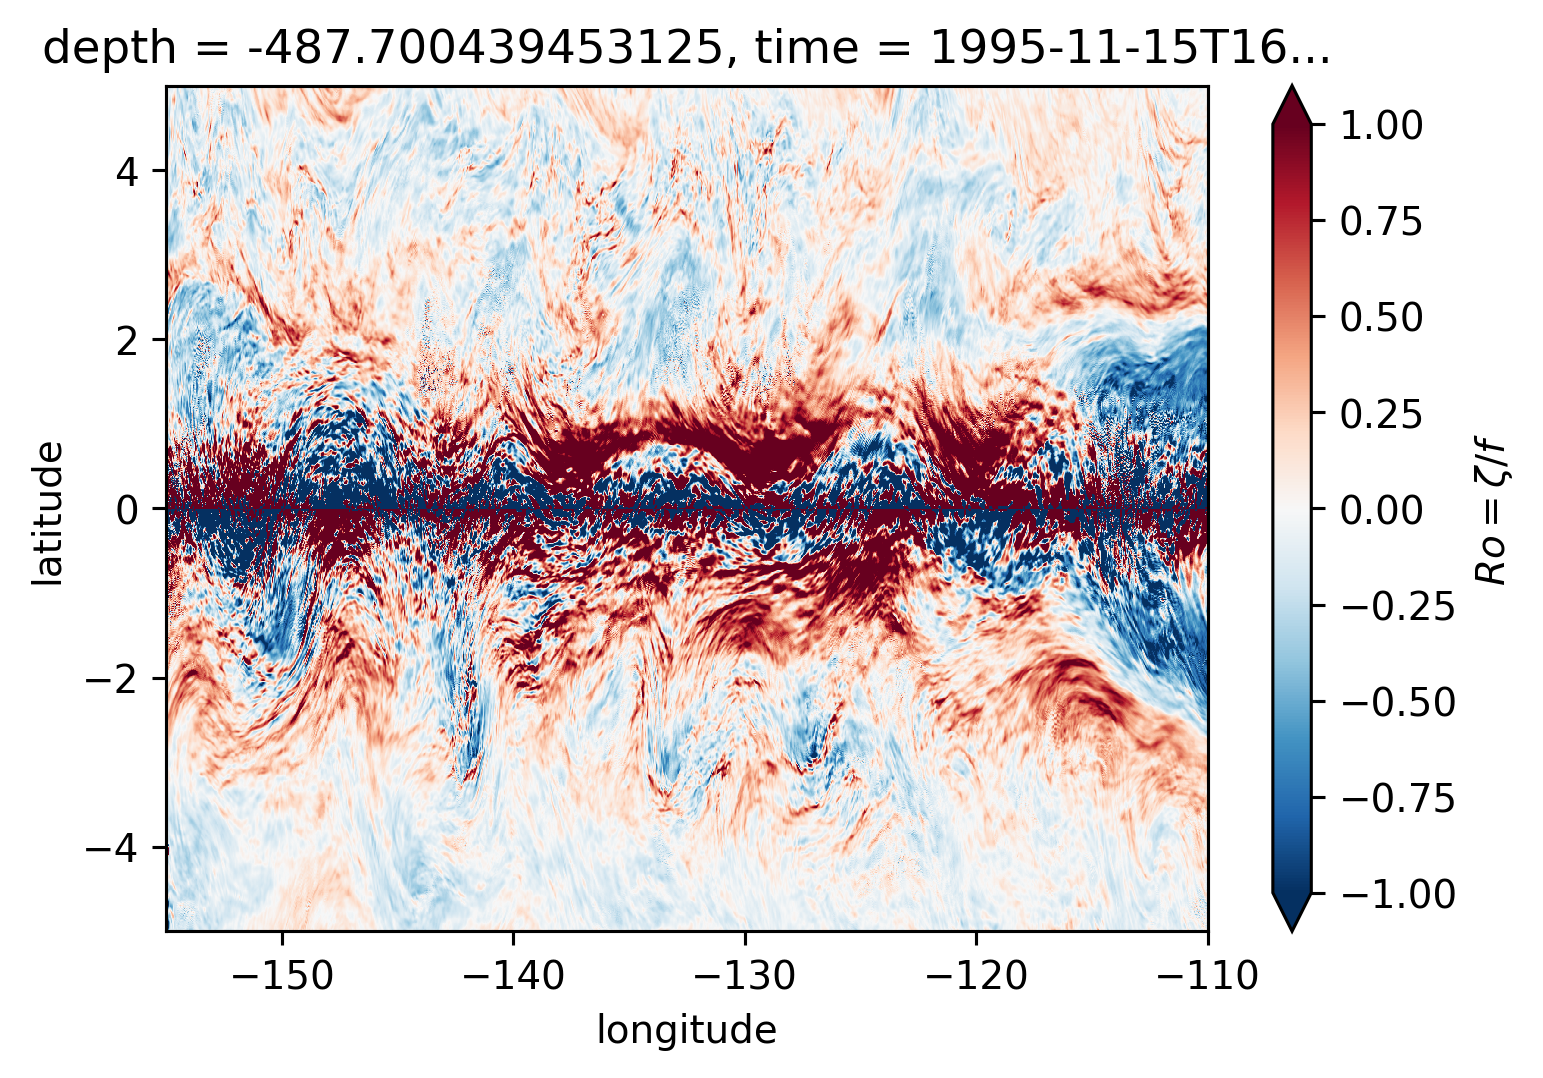
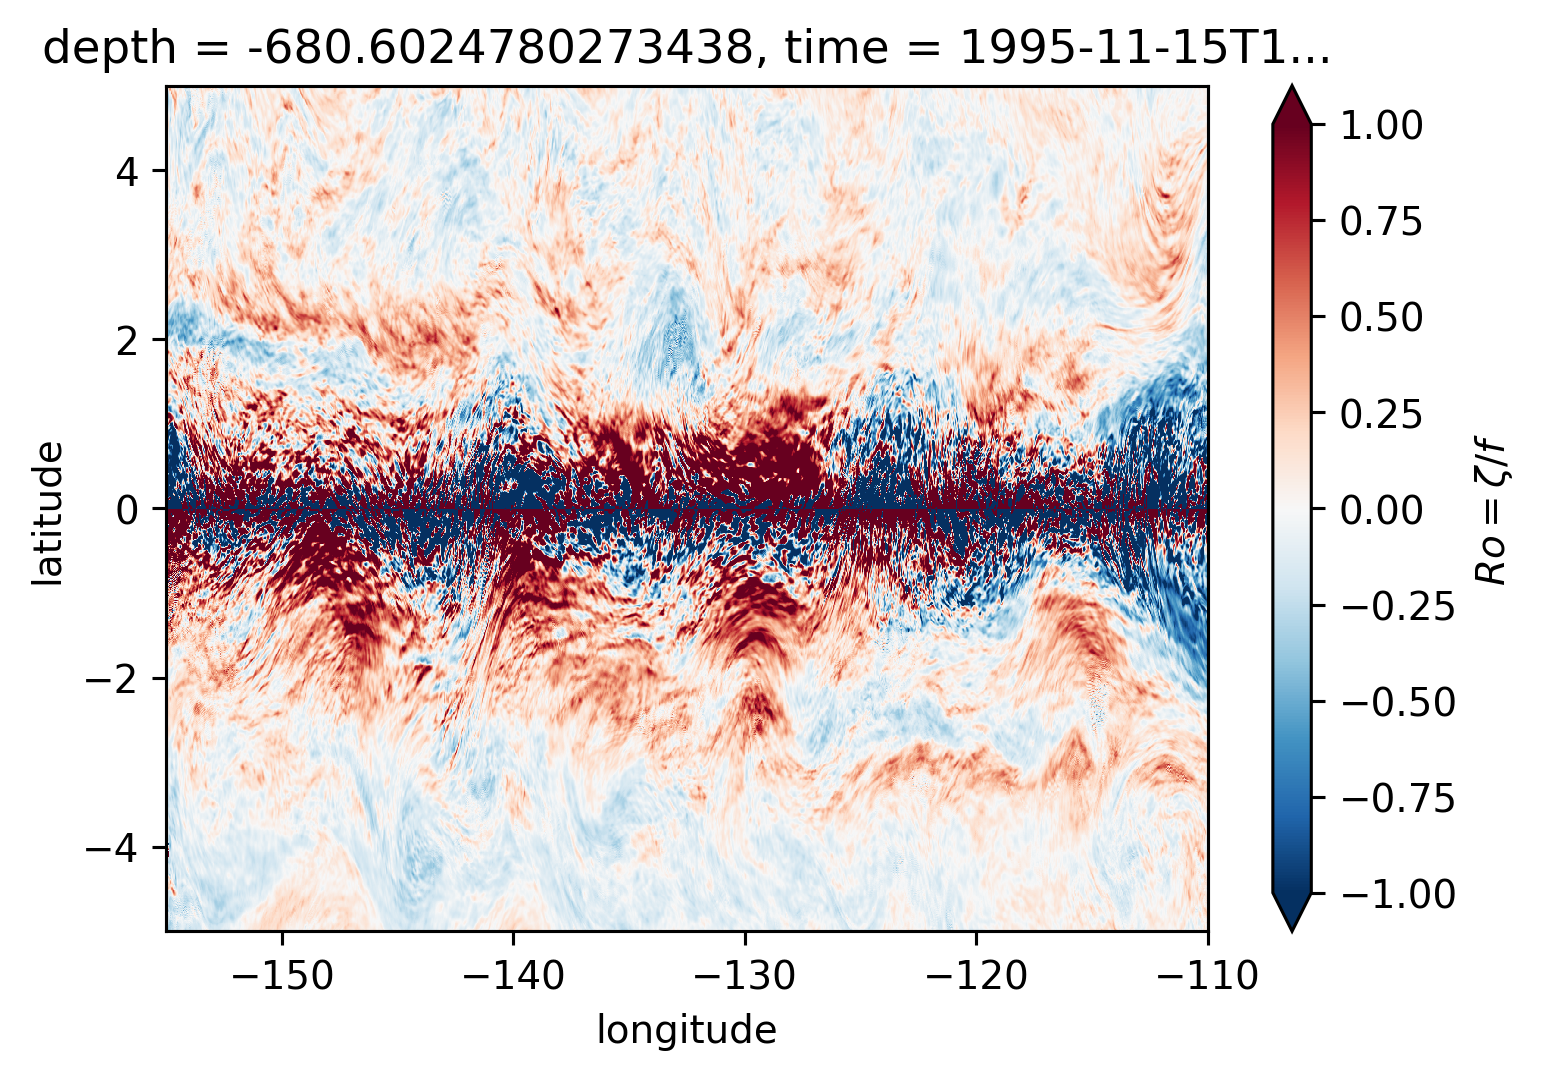
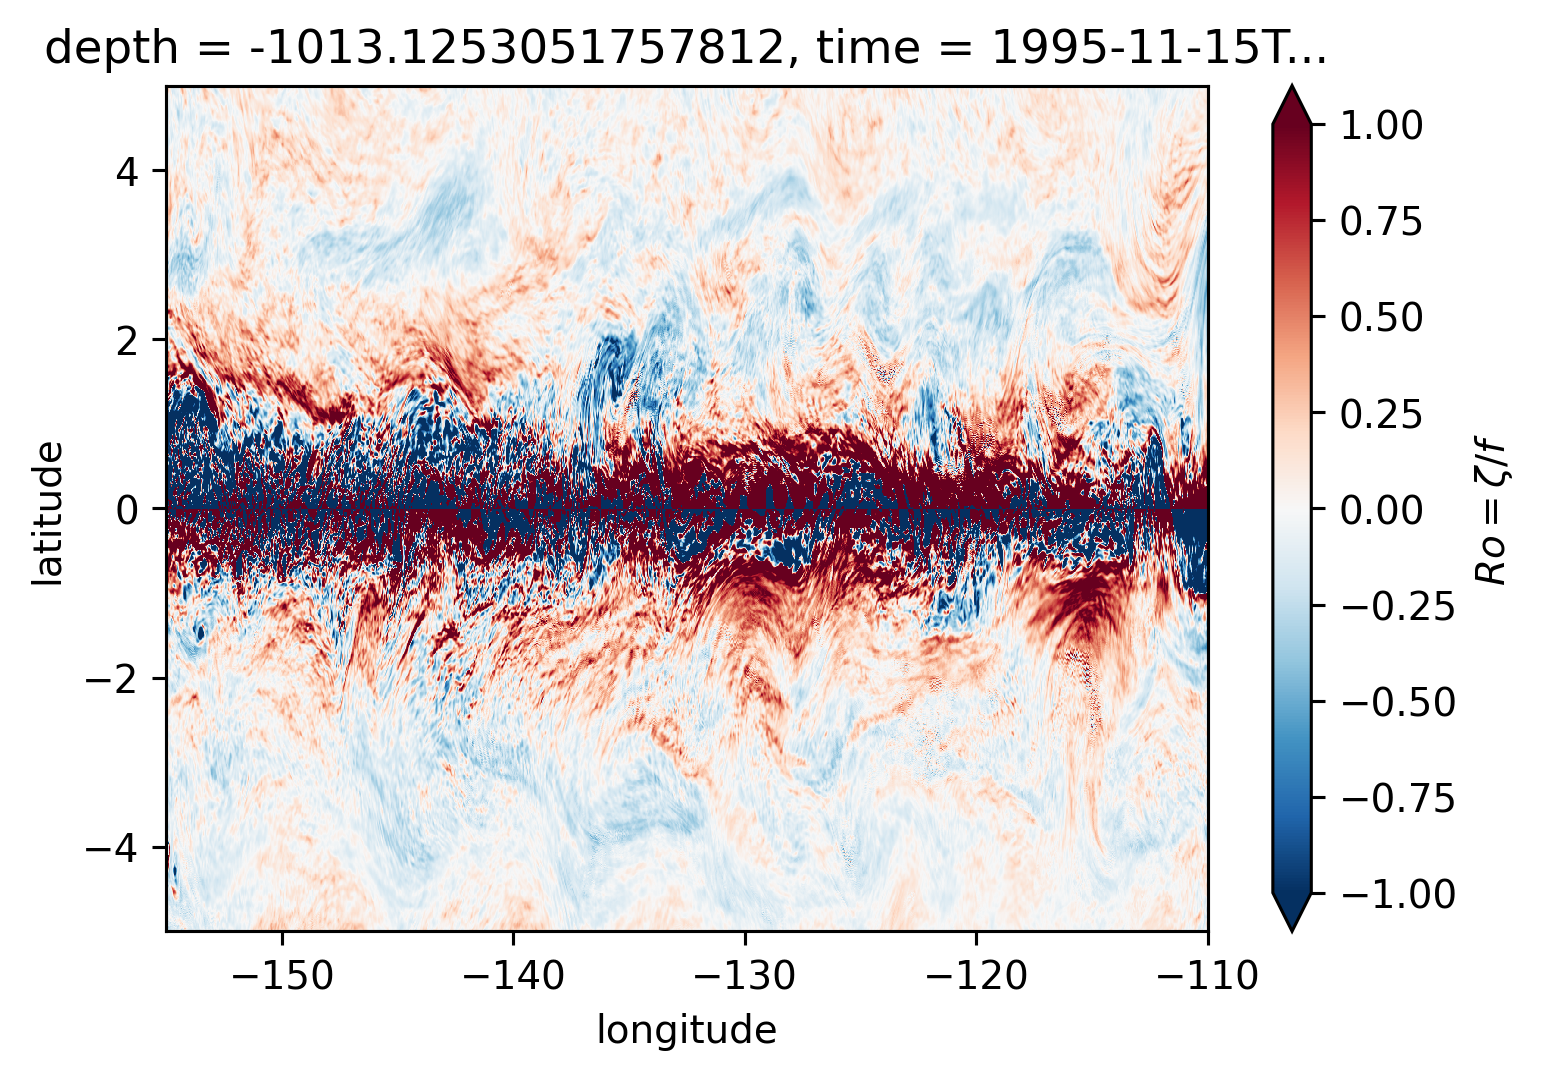
Ro maps at depth#
for depth in [-300, -500, -700, -1000]:
    plt.figure()
    Ro.reindex_like(subset).isel(time=50).sel(depth=depth, method="nearest").plot(
        ylim=(-5, 5),
        cmap=mpl.cm.RdBu_r,
        vmin=-1,
        vmax=1,
    )
/home/dcherian/miniconda3/envs/dcpy/lib/python3.8/site-packages/xarray/core/indexing.py:1375: PerformanceWarning: Slicing is producing a large chunk. To accept the large
chunk and silence this warning, set the option
    >>> with dask.config.set(**{'array.slicing.split_large_chunks': False}):
    ...     array[indexer]

To avoid creating the large chunks, set the option
    >>> with dask.config.set(**{'array.slicing.split_large_chunks': True}):
    ...     array[indexer]
  value = value[(slice(None),) * axis + (subkey,)]
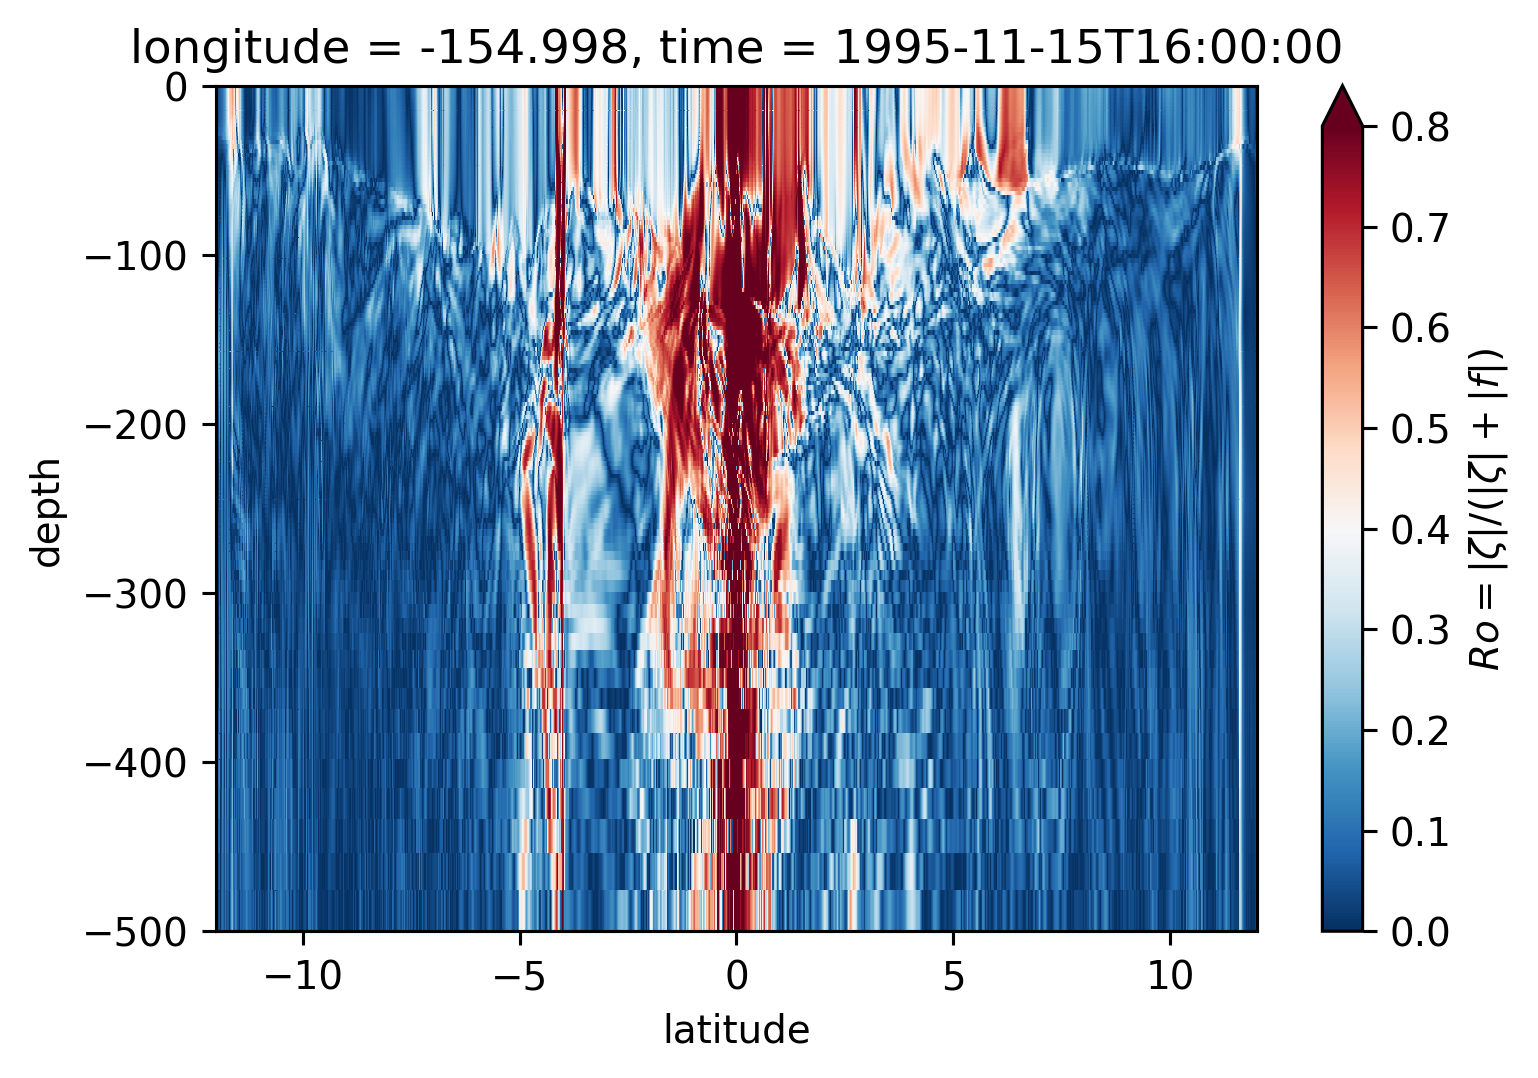
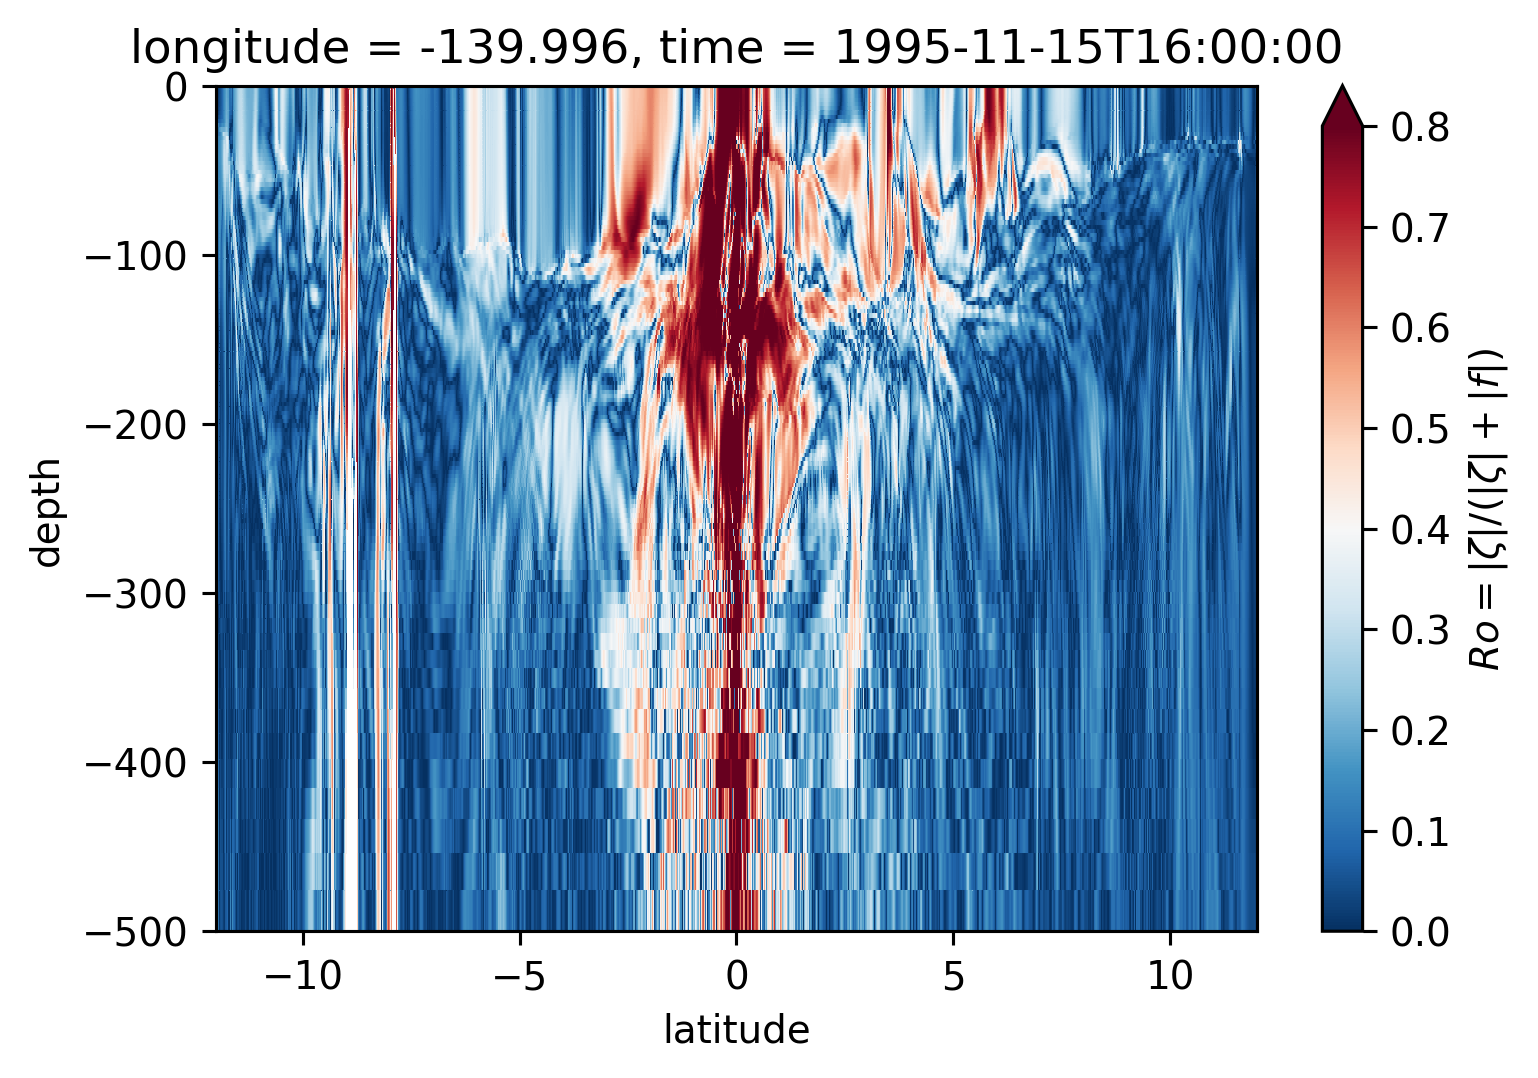
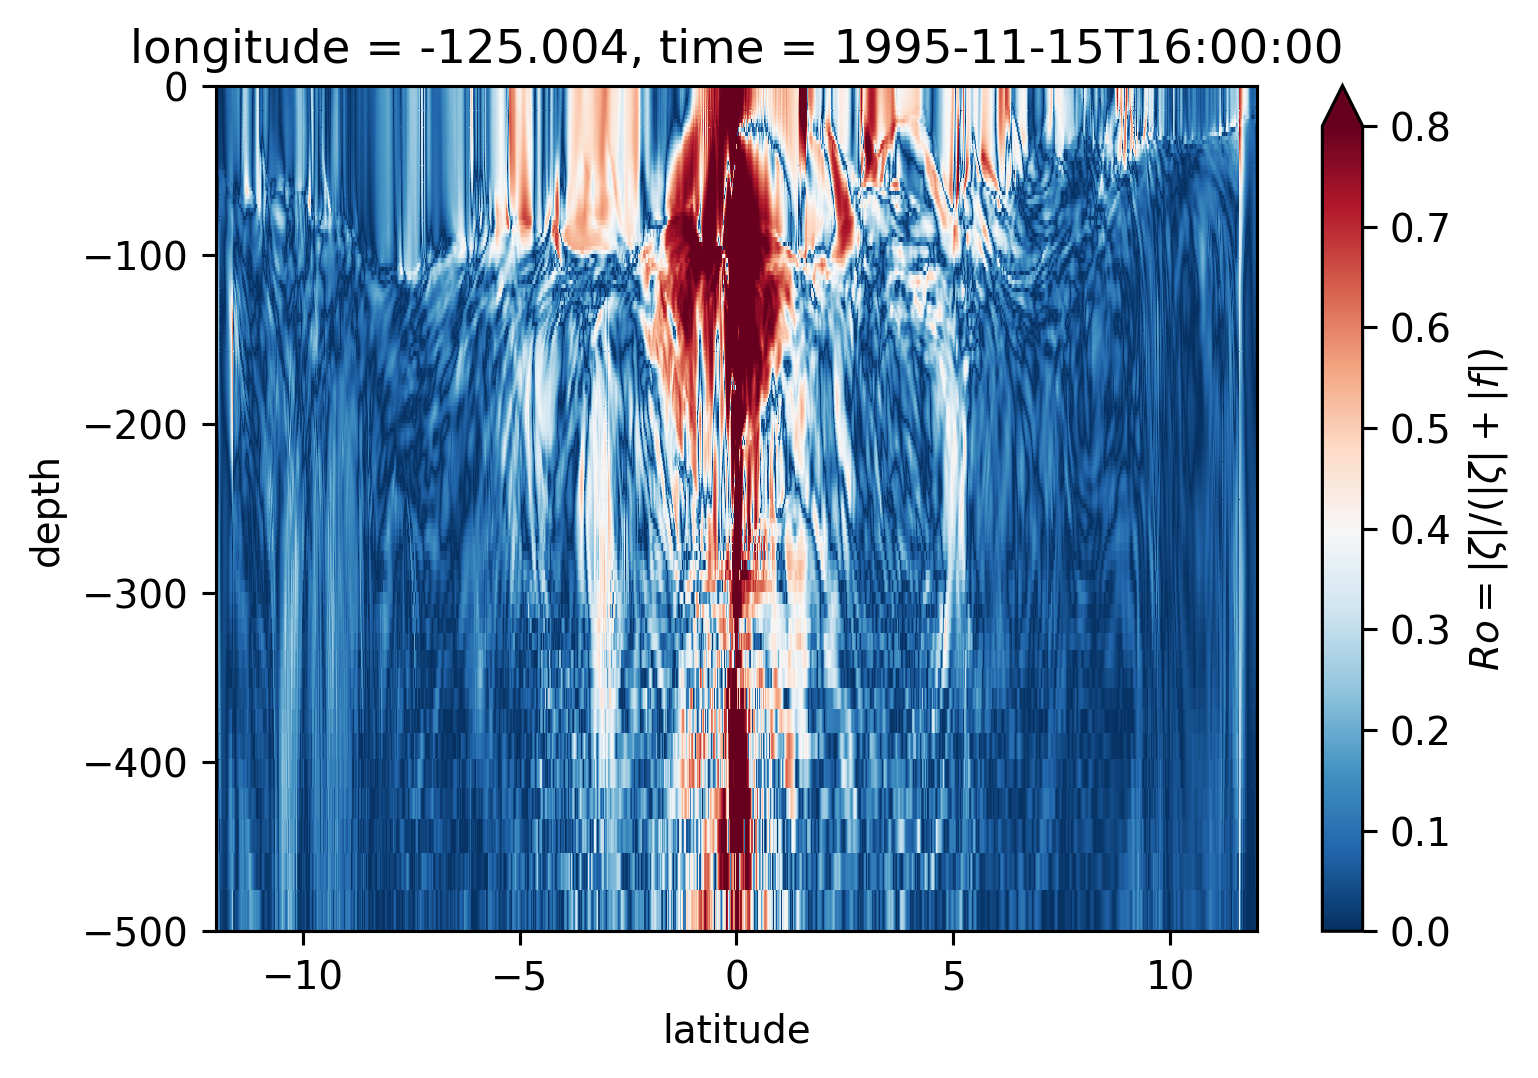
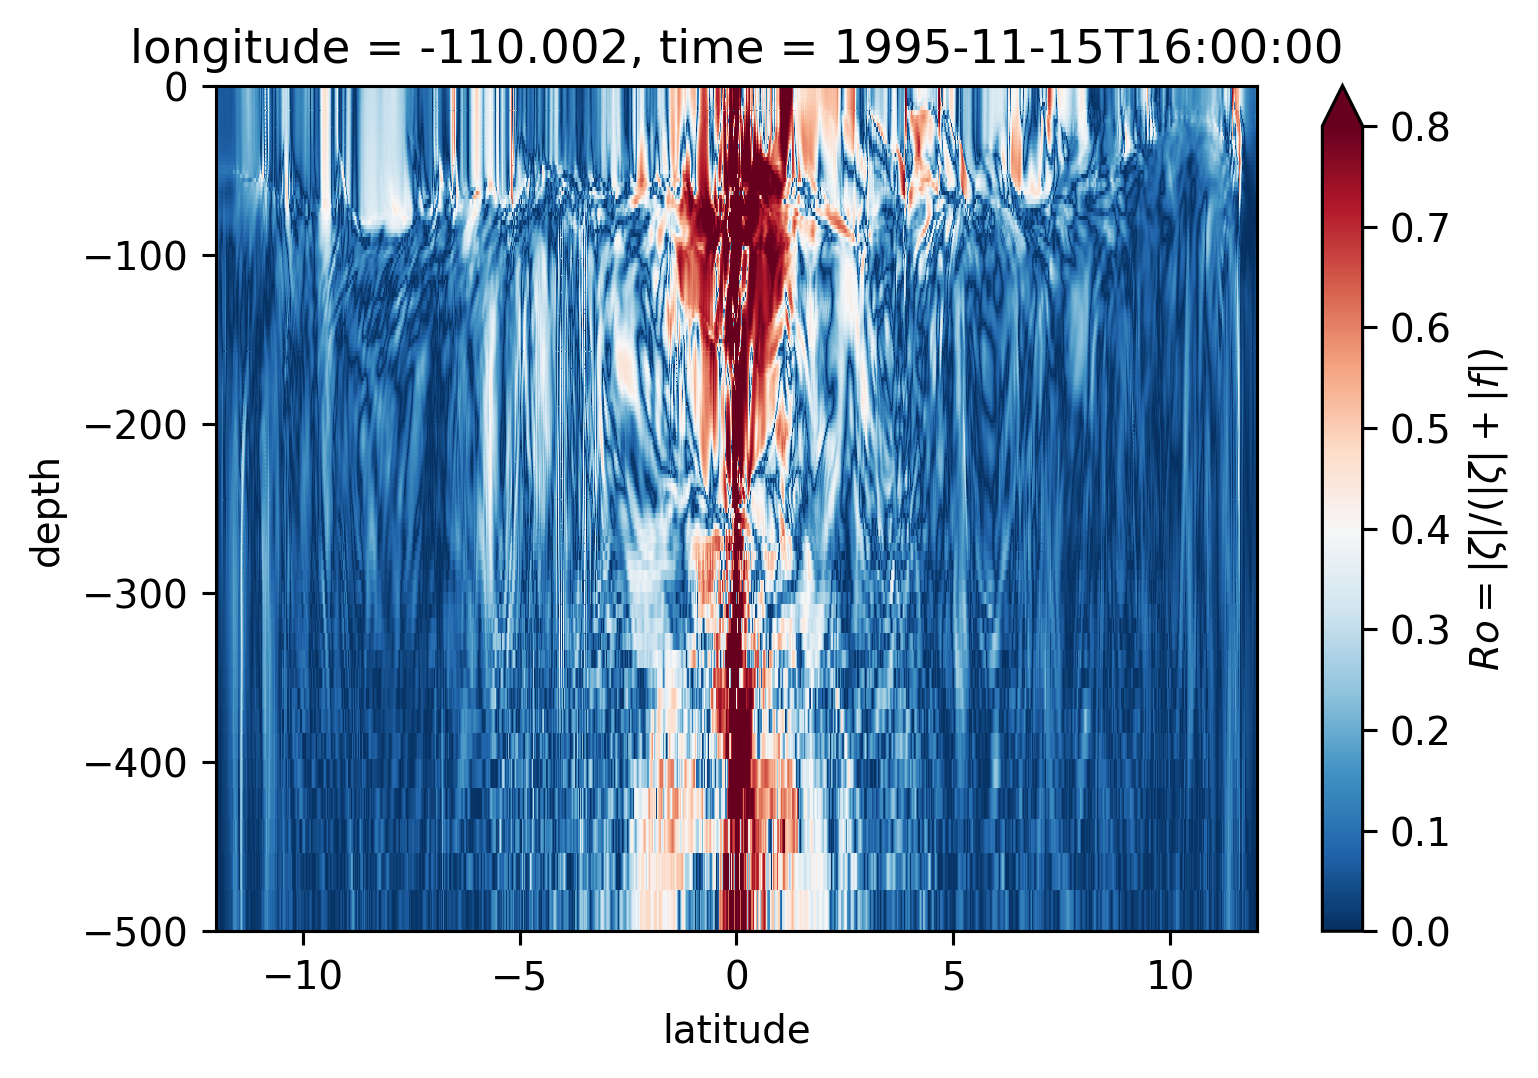
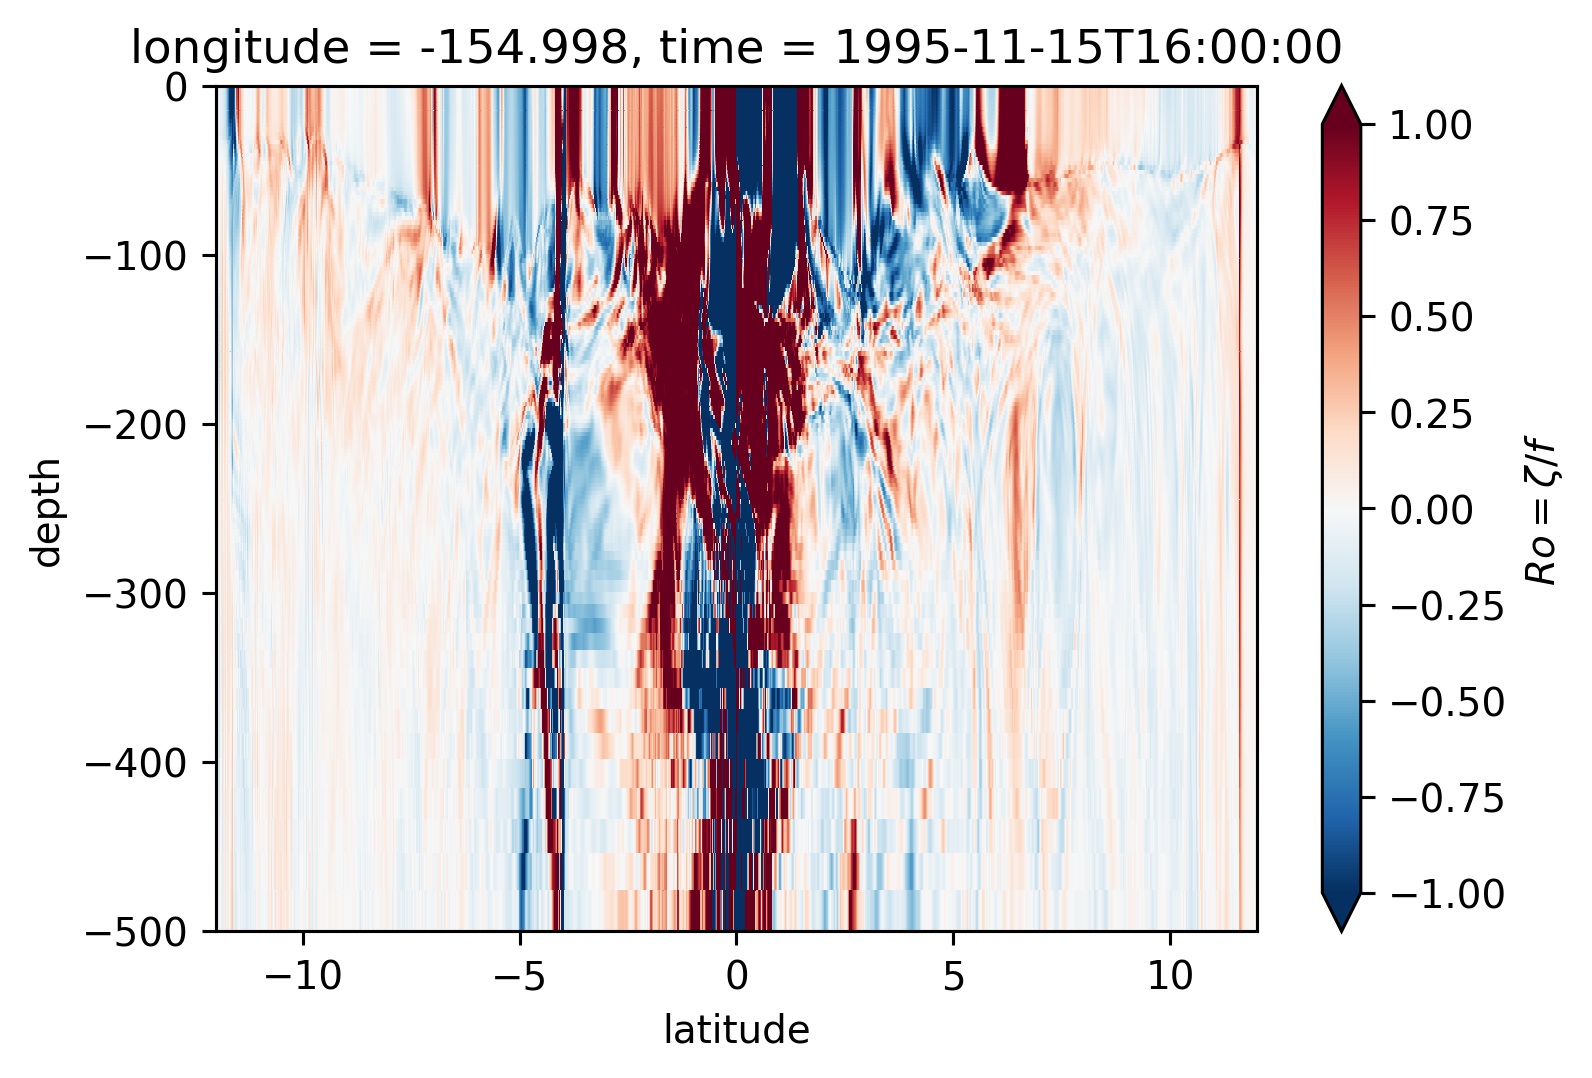
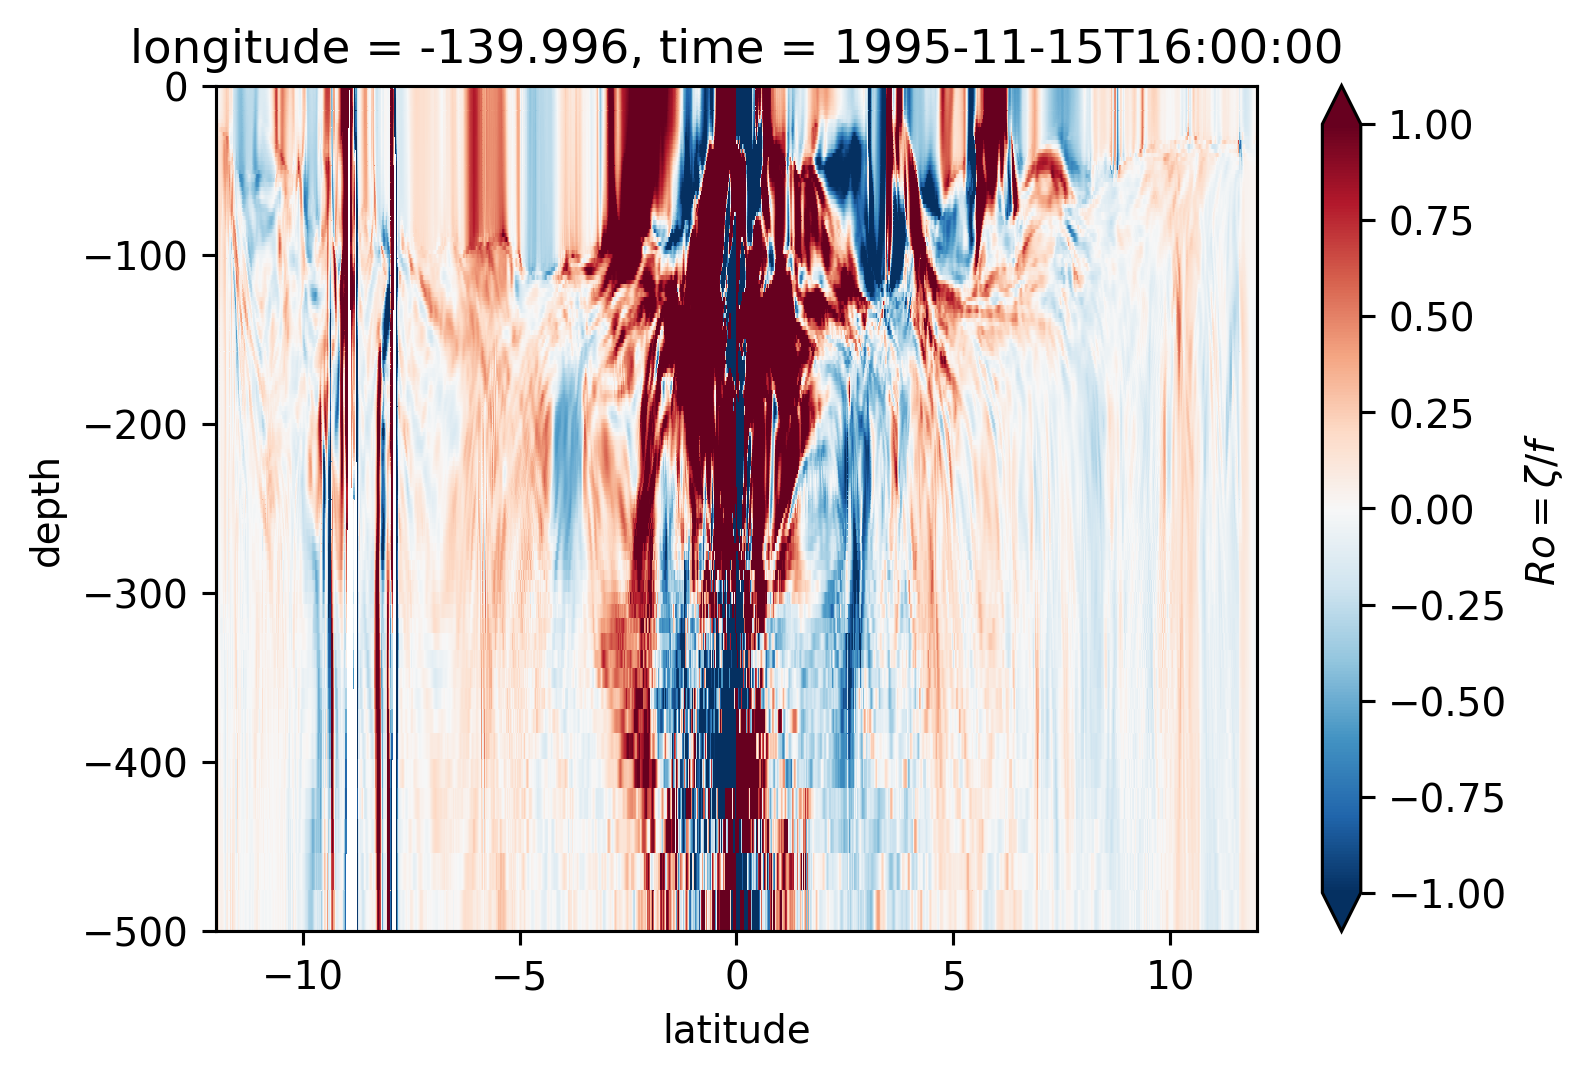
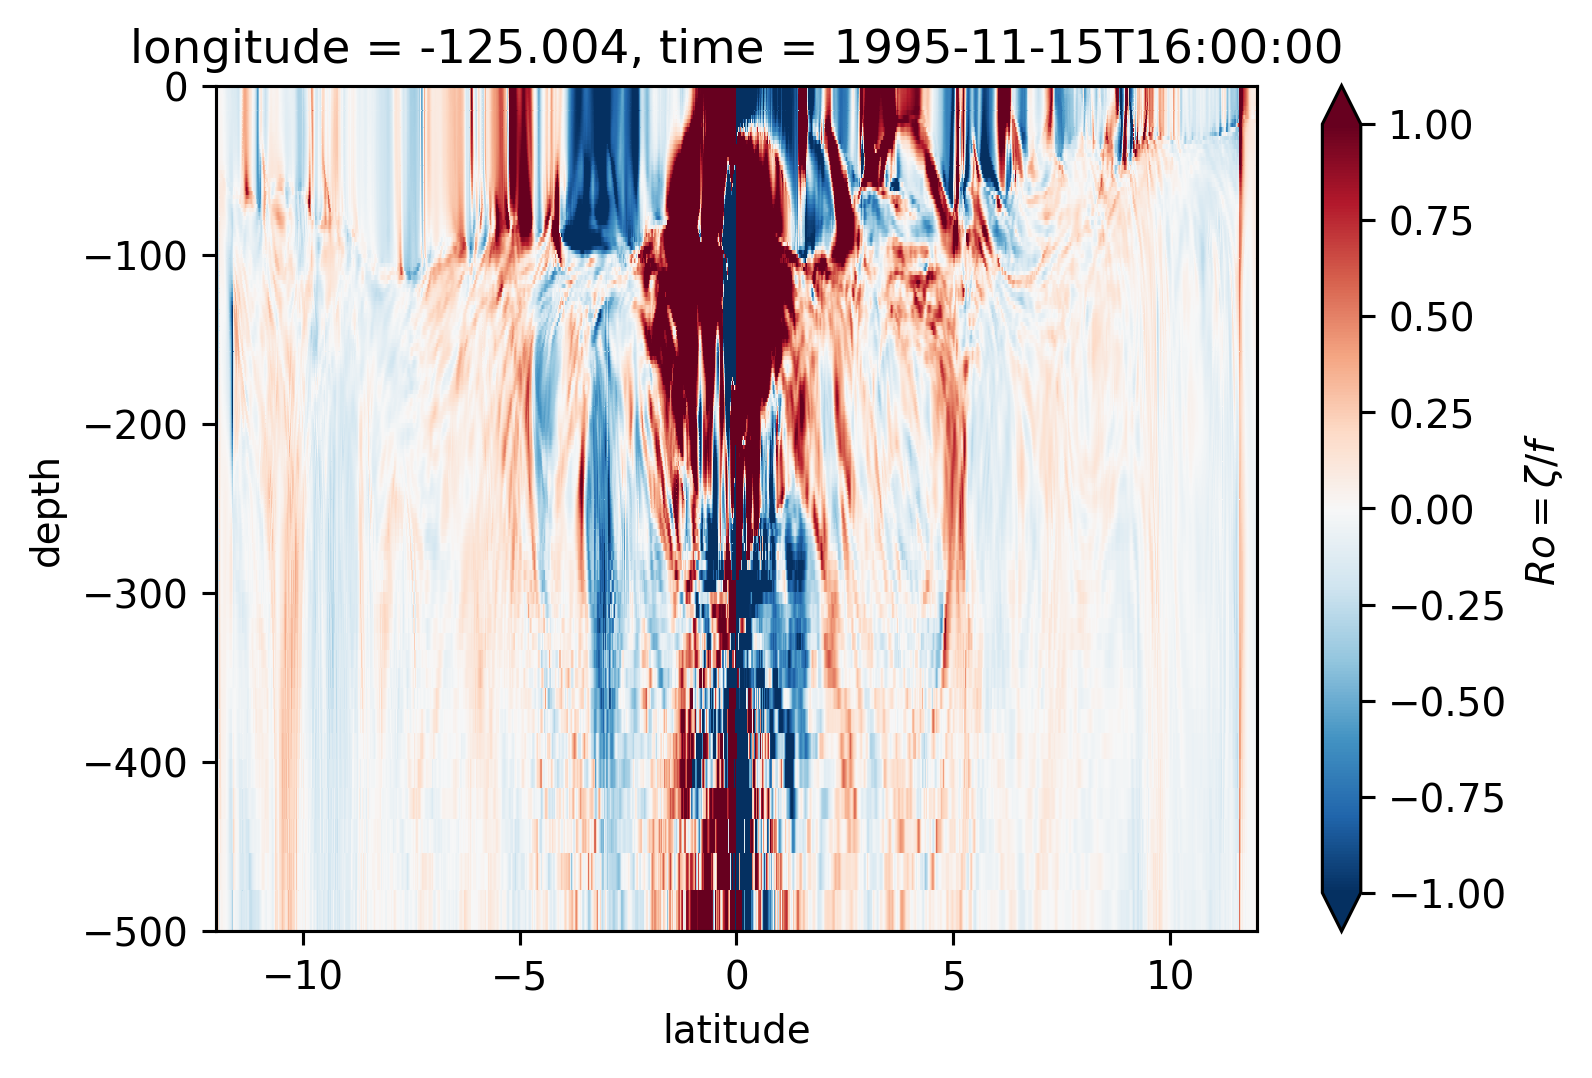
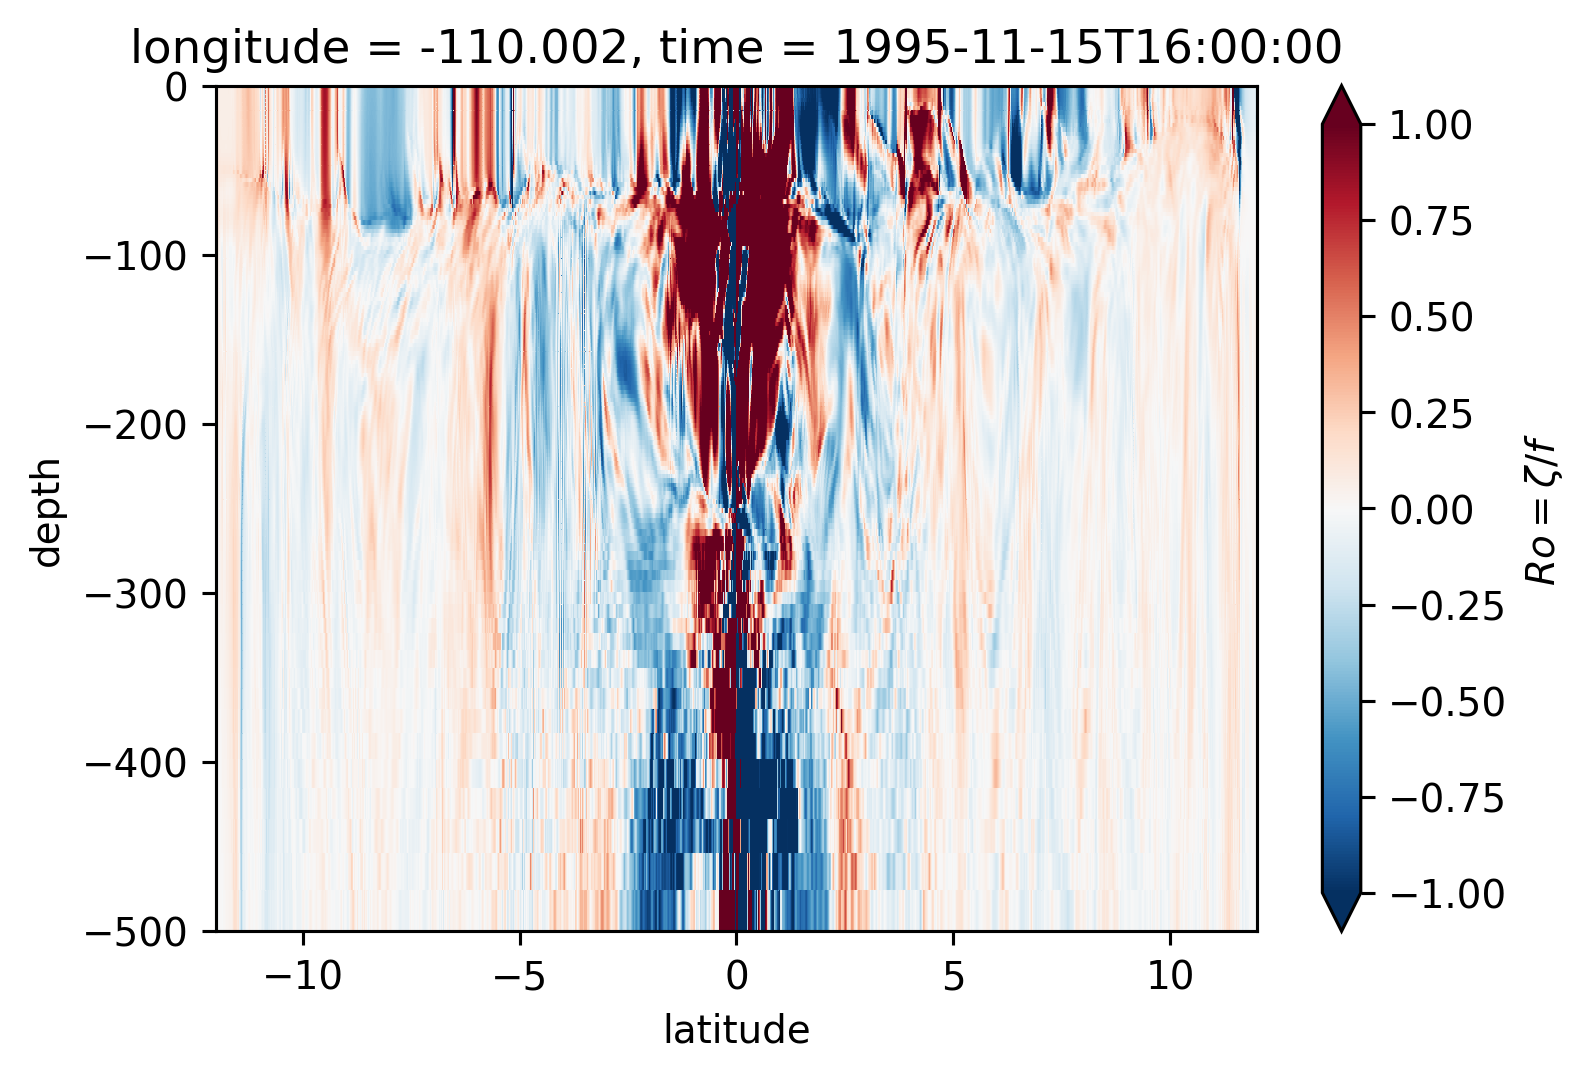
Ro Lat-depth plots#
There may be some interesting things in 1°S-1°N, but our vertical resolution is coarse below 250m
for longitude in [-155, -140, -125, -110]:
    plt.figure()
    Ro.isel(time=50).sel(longitude=longitude, method="nearest").plot(
        ylim=(-500, 0), vmin=-1, vmax=1, cmap=mpl.cm.RdBu_r, y="depth"
    )
for longitude in [-155, -140, -125, -110]:
    plt.figure()
    sRo.isel(time=50).sel(longitude=longitude, method="nearest").plot(
        ylim=(-500, 0), vmin=0, vmax=0.8, cmap=mpl.cm.RdBu_r, y="depth"
    )