miχpods - TAO#
eulerian 0-40m control volume
focus on Jq
use model chl / double exponentials
χpod notes:
eps = 0 at -39
119m in 2015
%load_ext watermark
import glob
import os
import dask
import dcpy
import distributed
import matplotlib as mpl
import matplotlib.pyplot as plt
import numpy as np
import pump
import xarray as xr
from pump import mixpods
dask.config.set({"array.slicing.split_large_chunks": False})
mpl.rcParams["figure.dpi"] = 140
xr.set_options(keep_attrs=True)
gcmdir = "/glade/campaign/cgd/oce/people/bachman/TPOS_1_20_20_year/OUTPUT/" # MITgcm output directory
stationdirname = gcmdir
import holoviews as hv
hv.notebook_extension("bokeh")
%watermark -iv
The watermark extension is already loaded. To reload it, use:
%reload_ext watermark


dcpy : 0.1.dev385+g121534c
json : 2.0.9
pandas : 1.5.3
ipywidgets : 8.0.4
sys : 3.10.8 | packaged by conda-forge | (main, Nov 22 2022, 08:26:04) [GCC 10.4.0]
distributed: 2023.1.0
dask : 2023.1.0
holoviews : 1.15.4
flox : 0.6.8
xarray : 2023.1.0
numpy : 1.23.5
pump : 0.1
matplotlib : 3.6.3
import dask_jobqueue
if "client" in locals():
client.close()
del client
if "cluster" in locals():
cluster.close()
cluster = dask_jobqueue.PBSCluster(
cores=4, # The number of cores you want
memory="23GB", # Amount of memory
processes=1, # How many processes
queue="casper", # The type of queue to utilize (/glade/u/apps/dav/opt/usr/bin/execcasper)
local_directory="/local_scratch/pbs.$PBS_JOBID",
log_directory="/glade/scratch/dcherian/dask/", # Use your local directory
resource_spec="select=1:ncpus=4:mem=23GB", # Specify resources
project="ncgd0011", # Input your project ID here
walltime="02:00:00", # Amount of wall time
interface="ib0", # Interface to use
)
cluster.adapt(minimum_jobs=2, maximum_jobs=8)
# cluster.scale(4)
client = distributed.Client(cluster)
client
Client
Client-cf4e8ab4-b86c-11ed-b502-3cecef1b11dc
| Connection method: Cluster object | Cluster type: dask_jobqueue.PBSCluster |
| Dashboard: https://jupyterhub.hpc.ucar.edu/stable/user/dcherian/proxy/8787/status |
Cluster Info
PBSCluster
89ecd7ea
| Dashboard: https://jupyterhub.hpc.ucar.edu/stable/user/dcherian/proxy/8787/status | Workers: 0 |
| Total threads: 0 | Total memory: 0 B |
Scheduler Info
Scheduler
Scheduler-66a8b606-6a4b-4ce3-b06d-f73f7f8e6465
| Comm: tcp://10.12.206.2:46770 | Workers: 0 |
| Dashboard: https://jupyterhub.hpc.ucar.edu/stable/user/dcherian/proxy/8787/status | Total threads: 0 |
| Started: Just now | Total memory: 0 B |
Workers
%autoreload
tao_gridded = mixpods.load_tao()
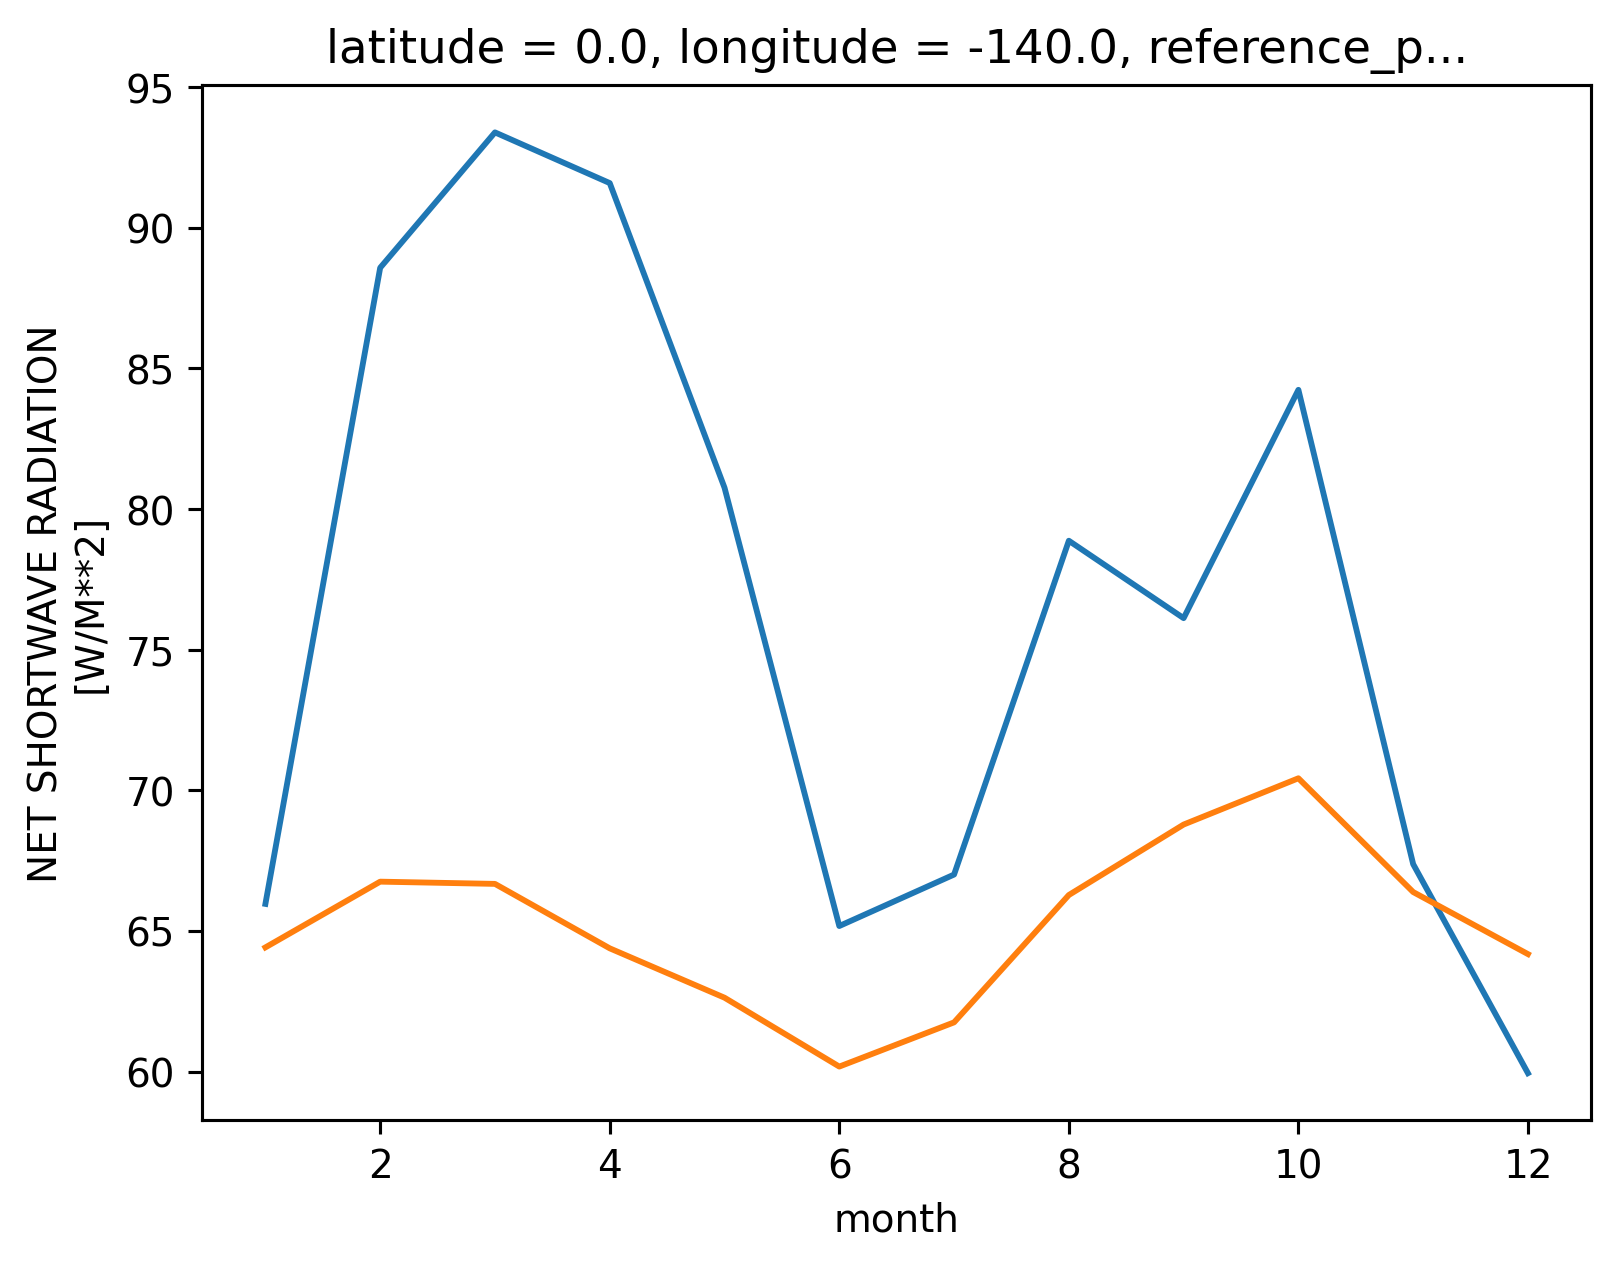
tao_gridded["Ih"] = 0.45 * tao_gridded.swnet * np.exp(-0.04 * np.abs(tao_gridded.mldT))
/glade/u/home/dcherian/miniconda3/envs/pump/lib/python3.10/site-packages/xarray/core/dataset.py:256: UserWarning: The specified Dask chunks separate the stored chunks along dimension "depth" starting at index 42. This could degrade performance. Instead, consider rechunking after loading.
warnings.warn(
/glade/u/home/dcherian/miniconda3/envs/pump/lib/python3.10/site-packages/xarray/core/dataset.py:256: UserWarning: The specified Dask chunks separate the stored chunks along dimension "time" starting at index 199726. This could degrade performance. Instead, consider rechunking after loading.
warnings.warn(
/glade/u/home/dcherian/miniconda3/envs/pump/lib/python3.10/site-packages/xarray/core/dataset.py:256: UserWarning: The specified Dask chunks separate the stored chunks along dimension "longitude" starting at index 2. This could degrade performance. Instead, consider rechunking after loading.
warnings.warn(
tao_gridded["Ih"] = 0.45 * tao_gridded.swnet * np.exp(-0.04 * np.abs(tao_gridded.mldT))
tao_gridded.Ih.groupby("time.month").mean().plot()
tao_gridded["Ih"] = 0.45 * tao_gridded.swnet * np.exp(-0.04 * 15)
tao_gridded.Ih.groupby("time.month").mean().plot()
[<matplotlib.lines.Line2D at 0x2b2bcc1bc880>]
Check masking#
From Sally:
ind = find(chihr.time > datenum(2007,1,14,10,25,0),1,'first');
chihr.Jq(3,ind) = NaN;
chihr.eps(3,ind) = NaN;
chihr.Kt(3,ind) = NaN;
ind = find(chihr.time > datenum(2007,1,28,14,25,0),1,'first');
chihr.Jq(4,ind) = NaN;
chihr.eps(4,ind) = NaN;
chihr.Kt(4,ind) = NaN;
%autoreload
chi = mixpods.read_chipod_mat_file(
os.path.expanduser("~/work/pump/datasets/microstructure/chipods_0_140W_hourly.mat")
)
chi
<xarray.Dataset>
Dimensions: (depth: 7, time: 128756)
Coordinates:
* depth (depth) float64 29.0 39.0 49.0 59.0 69.0 89.0 119.0
* time (time) datetime64[ns] 2005-09-23T04:30:00 ... 2020-05-31T23:30:00
Data variables:
Jq (time, depth) float64 -4.549 nan -0.0657 nan ... nan nan nan nan
KT (time, depth) float64 9.694e-05 nan 1.4e-06 nan ... nan nan nan nan
N2 (time, depth) float64 3.798e-05 nan 4.135e-05 nan ... nan nan nan
T (time, depth) float64 25.56 nan 25.31 nan nan ... nan nan nan nan
chi (time, depth) float64 2.708e-08 nan 4.073e-10 nan ... nan nan nan
dTdz (time, depth) float64 0.01282 nan 0.01419 nan ... nan nan nan nan
eps (time, depth) float64 1.657e-08 nan 2.357e-10 nan ... nan nan nanxarray.Dataset
- depth: 7
- time: 128756
- depth(depth)float6429.0 39.0 49.0 59.0 69.0 89.0 119.0
- axis :
- Z
- positive :
- down
array([ 29., 39., 49., 59., 69., 89., 119.])
- time(time)datetime64[ns]2005-09-23T04:30:00 ... 2020-05-...
- axis :
- T
- standard_name :
- time
array(['2005-09-23T04:30:00.000000000', '2005-09-23T05:30:00.000000000', '2005-09-23T06:30:00.000000000', ..., '2020-05-31T21:30:00.000000000', '2020-05-31T22:30:00.000000000', '2020-05-31T23:30:00.000000000'], dtype='datetime64[ns]')
- Jq(time, depth)float64-4.549 nan -0.0657 ... nan nan nan
array([[ -4.54932371, nan, -0.06569762, ..., nan, -1.85457704, nan], [-16.37203995, nan, -0.080956 , ..., nan, -5.2049935 , nan], [-23.9366487 , nan, -0.07778456, ..., nan, -2.22962776, nan], ..., [ nan, nan, nan, ..., nan, nan, nan], [ nan, nan, nan, ..., nan, nan, nan], [ nan, nan, nan, ..., nan, nan, nan]]) - KT(time, depth)float649.694e-05 nan 1.4e-06 ... nan nan
- standard_name :
- ocean_vertical_heat_diffusivity
array([[9.69412508e-05, nan, 1.40005393e-06, ..., nan, 8.04935155e-06, nan], [3.95227442e-04, nan, 1.49476348e-06, ..., nan, 2.38733489e-05, nan], [7.45841293e-04, nan, 1.60608911e-06, ..., nan, 1.18334467e-05, nan], ..., [ nan, nan, nan, ..., nan, nan, nan], [ nan, nan, nan, ..., nan, nan, nan], [ nan, nan, nan, ..., nan, nan, nan]]) - N2(time, depth)float643.798e-05 nan 4.135e-05 ... nan nan
array([[3.79834246e-05, nan, 4.13460771e-05, ..., nan, 1.65159681e-04, nan], [4.15890454e-05, nan, 4.44176951e-05, ..., nan, 1.72427071e-04, nan], [3.28784995e-05, nan, 4.21102361e-05, ..., nan, 1.53967780e-04, nan], ..., [ nan, nan, nan, ..., nan, nan, nan], [ nan, nan, nan, ..., nan, nan, nan], [ nan, nan, nan, ..., nan, nan, nan]]) - T(time, depth)float6425.56 nan 25.31 nan ... nan nan nan
array([[25.56315052, nan, 25.31183159, ..., nan, 24.39803403, nan], [25.56676681, nan, 25.30604519, ..., nan, 24.35174395, nan], [25.53080021, nan, 25.29494317, ..., nan, 24.33841534, nan], ..., [ nan, nan, nan, ..., nan, nan, nan], [ nan, nan, nan, ..., nan, nan, nan], [ nan, nan, nan, ..., nan, nan, nan]]) - chi(time, depth)float642.708e-08 nan 4.073e-10 ... nan nan
array([[2.70762728e-08, nan, 4.07340582e-10, ..., nan, 5.20677144e-08, nan], [9.25025624e-08, nan, 5.86562376e-10, ..., nan, 1.40759953e-07, nan], [1.04674898e-07, nan, 5.24675110e-10, ..., nan, 5.66922996e-08, nan], ..., [ nan, nan, nan, ..., nan, nan, nan], [ nan, nan, nan, ..., nan, nan, nan], [ nan, nan, nan, ..., nan, nan, nan]]) - dTdz(time, depth)float640.01282 nan 0.01419 ... nan nan nan
array([[0.01281748, nan, 0.01419076, ..., nan, 0.0581683 , nan], [0.01402541, nan, 0.01530269, ..., nan, 0.06086101, nan], [0.0110931 , nan, 0.01450203, ..., nan, 0.05424165, nan], ..., [ nan, nan, nan, ..., nan, nan, nan], [ nan, nan, nan, ..., nan, nan, nan], [ nan, nan, nan, ..., nan, nan, nan]]) - eps(time, depth)float641.657e-08 nan 2.357e-10 ... nan nan
array([[1.65670857e-08, nan, 2.35675866e-10, ..., nan, 6.47865832e-09, nan], [6.42763900e-08, nan, 2.92546293e-10, ..., nan, 1.83704474e-08, nan], [1.00581787e-07, nan, 2.79577757e-10, ..., nan, 7.79422764e-09, nan], ..., [ nan, nan, nan, ..., nan, nan, nan], [ nan, nan, nan, ..., nan, nan, nan], [ nan, nan, nan, ..., nan, nan, nan]])
- depthPandasIndex
PandasIndex(Float64Index([29.0, 39.0, 49.0, 59.0, 69.0, 89.0, 119.0], dtype='float64', name='depth'))
- timePandasIndex
PandasIndex(DatetimeIndex(['2005-09-23 04:30:00', '2005-09-23 05:30:00', '2005-09-23 06:30:00', '2005-09-23 07:30:00', '2005-09-23 08:30:00', '2005-09-23 09:30:00', '2005-09-23 10:30:00', '2005-09-23 11:30:00', '2005-09-23 12:30:00', '2005-09-23 13:30:00', ... '2020-05-31 14:30:00', '2020-05-31 15:30:00', '2020-05-31 16:30:00', '2020-05-31 17:30:00', '2020-05-31 18:30:00', '2020-05-31 19:30:00', '2020-05-31 20:30:00', '2020-05-31 21:30:00', '2020-05-31 22:30:00', '2020-05-31 23:30:00'], dtype='datetime64[ns]', name='time', length=128756, freq=None))
import holoviews as hv
kwargs = dict(groupby="time.year", by="depth", grid=True, aspect=10, frame_height=100)
(
# chi.chi.hvplot.line(**kwargs, logy=True, ylim=(1e-11, 1e-3))
chi.eps.hvplot.line(**kwargs, logy=True, ylim=(1e-11, 1e-3))
+ chi.KT.hvplot.line(**kwargs, logy=True, ylim=(1e-11, 10))
+ chi.Jq.hvplot.line(**kwargs)
+ chi.dTdz.hvplot.line(**kwargs)
).opts(
hv.opts.Overlay(legend_cols=2, legend_position="top"),
hv.opts.Layout(sizing_mode="stretch_width"),
).cols(
1
)
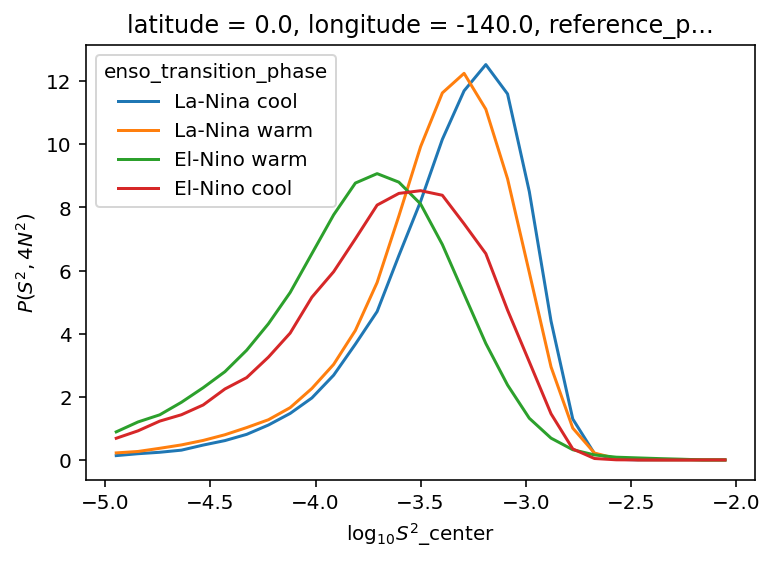
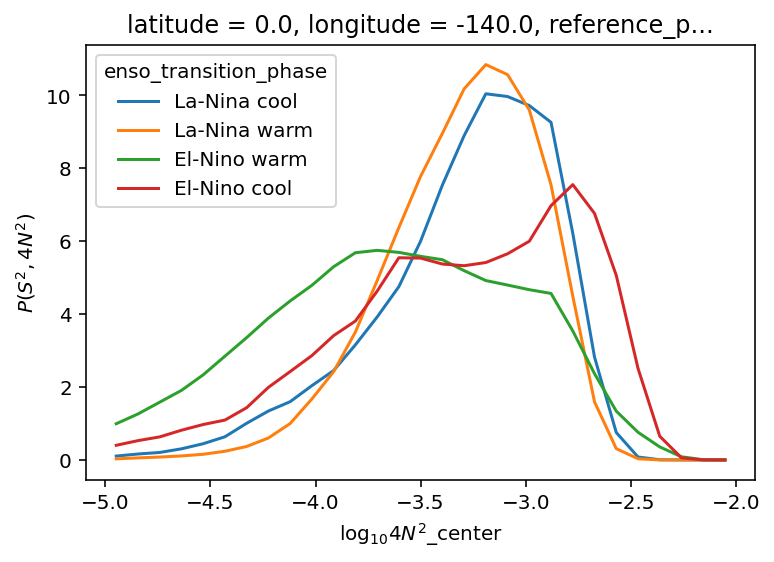
ε-Ri histograms#
I think I’m missing some low Ri values.
%autoreload
tao_gridded = mixpods.load_tao()
tao_gridded
/glade/u/home/dcherian/miniconda3/envs/pump/lib/python3.10/site-packages/cf_xarray/accessor.py:2109: AccessorRegistrationWarning: registration of accessor <class 'cf_xarray.accessor.CFDatasetAccessor'> under name 'cf' for type <class 'xarray.core.dataset.Dataset'> is overriding a preexisting attribute with the same name.
class CFDatasetAccessor(CFAccessor):
/glade/u/home/dcherian/miniconda3/envs/pump/lib/python3.10/site-packages/cf_xarray/accessor.py:2605: AccessorRegistrationWarning: registration of accessor <class 'cf_xarray.accessor.CFDataArrayAccessor'> under name 'cf' for type <class 'xarray.core.dataarray.DataArray'> is overriding a preexisting attribute with the same name.
class CFDataArrayAccessor(CFAccessor):
/glade/u/home/dcherian/miniconda3/envs/pump/lib/python3.10/site-packages/xarray/core/dataset.py:256: UserWarning: The specified Dask chunks separate the stored chunks along dimension "depth" starting at index 42. This could degrade performance. Instead, consider rechunking after loading.
warnings.warn(
/glade/u/home/dcherian/miniconda3/envs/pump/lib/python3.10/site-packages/xarray/core/dataset.py:256: UserWarning: The specified Dask chunks separate the stored chunks along dimension "time" starting at index 199726. This could degrade performance. Instead, consider rechunking after loading.
warnings.warn(
/glade/u/home/dcherian/miniconda3/envs/pump/lib/python3.10/site-packages/xarray/core/dataset.py:256: UserWarning: The specified Dask chunks separate the stored chunks along dimension "longitude" starting at index 2. This could degrade performance. Instead, consider rechunking after loading.
warnings.warn(
<xarray.Dataset>
Dimensions: (time: 212302, depth: 61, depthchi: 6)
Coordinates: (12/19)
deepest (time) float64 dask.array<chunksize=(212302,), meta=np.ndarray>
* depth (depth) float64 -300.0 -295.0 -290.0 ... -10.0 -5.0 0.0
eucmax (time) float64 dask.array<chunksize=(33130,), meta=np.ndarray>
latitude float32 0.0
longitude float32 -140.0
mld (time) float64 dask.array<chunksize=(212302,), meta=np.ndarray>
... ...
oni (time) float32 -0.9 -0.9 -0.9 -0.9 ... nan nan nan nan
en_mask (time) bool False False False ... False False False
ln_mask (time) bool True True True True ... False False False
warm_mask (time) bool True True True True ... True True True True
cool_mask (time) bool False False False ... False False False
enso_transition (time) <U12 'La-Nina warm' ... '____________'
Data variables: (12/38)
N2 (time, depth) float64 dask.array<chunksize=(33130, 61), meta=np.ndarray>
N2T (time, depth) float64 dask.array<chunksize=(33130, 61), meta=np.ndarray>
Ri (time, depth) float64 dask.array<chunksize=(33130, 61), meta=np.ndarray>
Rig_T (time, depth) float64 dask.array<chunksize=(33130, 61), meta=np.ndarray>
S (time, depth) float64 dask.array<chunksize=(33130, 61), meta=np.ndarray>
S2 (time, depth) float32 dask.array<chunksize=(33130, 61), meta=np.ndarray>
... ...
shred2 (time, depth) float64 dask.array<chunksize=(33130, 61), meta=np.ndarray>
Rig (time, depth) float64 dask.array<chunksize=(33130, 61), meta=np.ndarray>
sst (time) float64 dask.array<chunksize=(33130,), meta=np.ndarray>
Tflx_dia_diff (time, depthchi) float64 nan nan nan nan ... nan nan nan
Jb (time, depthchi, depth) float64 dask.array<chunksize=(33130, 6, 61), meta=np.ndarray>
Rif (time, depthchi, depth) float64 dask.array<chunksize=(33130, 6, 61), meta=np.ndarray>
Attributes:
CREATION_DATE: 23:26 24-FEB-2021
Data_Source: Global Tropical Moored Buoy Array Project O...
File_info: Contact: Dai.C.McClurg@noaa.gov
Request_for_acknowledgement: If you use these data in publications or pr...
_FillValue: 1.0000000409184788e+35
array: TAO/TRITON
missing_value: 1.0000000409184788e+35
platform_code: 0n165e
site_code: 0n165e
wmo_platform_code: 52321xarray.Dataset
- time: 212302
- depth: 61
- depthchi: 6
- deepest(time)float64dask.array<chunksize=(212302,), meta=np.ndarray>
- description :
- Deepest depth with a valid observation
- units :
- m
Array Chunk Bytes 1.62 MiB 1.62 MiB Shape (212302,) (212302,) Dask graph 1 chunks in 3 graph layers Data type float64 numpy.ndarray - depth(depth)float64-300.0 -295.0 -290.0 ... -5.0 0.0
- axis :
- Z
- positive :
- up
- units :
- m
array([-300., -295., -290., -285., -280., -275., -270., -265., -260., -255., -250., -245., -240., -235., -230., -225., -220., -215., -210., -205., -200., -195., -190., -185., -180., -175., -170., -165., -160., -155., -150., -145., -140., -135., -130., -125., -120., -115., -110., -105., -100., -95., -90., -85., -80., -75., -70., -65., -60., -55., -50., -45., -40., -35., -30., -25., -20., -15., -10., -5., 0.]) - eucmax(time)float64dask.array<chunksize=(33130,), meta=np.ndarray>
- units :
- m
- long_name :
- EUC maximum
- positive :
- up
Array Chunk Bytes 1.62 MiB 781.25 kiB Shape (212302,) (100000,) Dask graph 3 chunks in 17 graph layers Data type float64 numpy.ndarray - latitude()float320.0
array(0., dtype=float32)
- longitude()float32-140.0
array(-140., dtype=float32)
- mld(time)float64dask.array<chunksize=(212302,), meta=np.ndarray>
- long_name :
- $z_{MLD}$
- units :
- m
Array Chunk Bytes 1.62 MiB 1.62 MiB Shape (212302,) (212302,) Dask graph 1 chunks in 3 graph layers Data type float64 numpy.ndarray - mldT(time)float64dask.array<chunksize=(33130,), meta=np.ndarray>
- long_name :
- MLD$_θ$
- units :
- m
- description :
- Interpolate θi to 1m grid. Search for max depth where |dθ| > 0.15
Array Chunk Bytes 1.62 MiB 781.25 kiB Shape (212302,) (100000,) Dask graph 3 chunks in 20 graph layers Data type float64 numpy.ndarray - reference_pressure()int640
array(0)
- shallowest(time)float64dask.array<chunksize=(212302,), meta=np.ndarray>
Array Chunk Bytes 1.62 MiB 1.62 MiB Shape (212302,) (212302,) Dask graph 1 chunks in 3 graph layers Data type float64 numpy.ndarray - time(time)datetime64[ns]1996-01-01 ... 2020-03-20T21:00:00
array(['1996-01-01T00:00:00.000000000', '1996-01-01T01:00:00.000000000', '1996-01-01T02:00:00.000000000', ..., '2020-03-20T19:00:00.000000000', '2020-03-20T20:00:00.000000000', '2020-03-20T21:00:00.000000000'], dtype='datetime64[ns]') - zeuc(depth, time)float64dask.array<chunksize=(42, 132856), meta=np.ndarray>
Array Chunk Bytes 98.80 MiB 42.57 MiB Shape (61, 212302) (42, 132856) Dask graph 4 chunks in 3 graph layers Data type float64 numpy.ndarray - depthchi(depthchi)float64-89.0 -69.0 -59.0 -49.0 -39.0 -29.0
- axis :
- Z
- positive :
- up
array([-89., -69., -59., -49., -39., -29.])
- dcl_mask(depth, time)booldask.array<chunksize=(61, 33130), meta=np.ndarray>
- description :
- True when 5m below mldT and above eucmax.
Array Chunk Bytes 12.35 MiB 5.82 MiB Shape (61, 212302) (61, 100000) Dask graph 3 chunks in 45 graph layers Data type bool numpy.ndarray - oni(time)float32-0.9 -0.9 -0.9 -0.9 ... nan nan nan
array([-0.9, -0.9, -0.9, ..., nan, nan, nan], dtype=float32)
- en_mask(time)boolFalse False False ... False False
array([False, False, False, ..., False, False, False])
- ln_mask(time)boolTrue True True ... False False
array([ True, True, True, ..., False, False, False])
- warm_mask(time)boolTrue True True ... True True True
array([ True, True, True, ..., True, True, True])
- cool_mask(time)boolFalse False False ... False False
array([False, False, False, ..., False, False, False])
- enso_transition(time)<U12'La-Nina warm' ... '____________'
- description :
- Warner & Moum (2019) ENSO transition phase; El-Nino = ONI > 0.5 for at least 6 months; La-Nina = ONI < -0.5 for at least 6 months
array(['La-Nina warm', 'La-Nina warm', 'La-Nina warm', ..., '____________', '____________', '____________'], dtype='<U12')
- N2(time, depth)float64dask.array<chunksize=(33130, 61), meta=np.ndarray>
- long_name :
- $N^2$
Array Chunk Bytes 98.80 MiB 46.54 MiB Shape (212302, 61) (100000, 61) Dask graph 3 chunks in 3 graph layers Data type float64 numpy.ndarray - N2T(time, depth)float64dask.array<chunksize=(33130, 61), meta=np.ndarray>
- long_name :
- $N^2_T$
Array Chunk Bytes 98.80 MiB 46.54 MiB Shape (212302, 61) (100000, 61) Dask graph 3 chunks in 3 graph layers Data type float64 numpy.ndarray - Ri(time, depth)float64dask.array<chunksize=(33130, 61), meta=np.ndarray>
- long_name :
- $Ri_g$
Array Chunk Bytes 98.80 MiB 46.54 MiB Shape (212302, 61) (100000, 61) Dask graph 3 chunks in 3 graph layers Data type float64 numpy.ndarray - Rig_T(time, depth)float64dask.array<chunksize=(33130, 61), meta=np.ndarray>
- long_name :
- $Ri^g_T$
Array Chunk Bytes 98.80 MiB 46.54 MiB Shape (212302, 61) (100000, 61) Dask graph 3 chunks in 7 graph layers Data type float64 numpy.ndarray - S(time, depth)float64dask.array<chunksize=(33130, 61), meta=np.ndarray>
- FORTRAN_format :
- epic_code :
- 41
- generic_name :
- sal
- long_name :
- SALINITY (PSU)
- name :
- S
- standard_name :
- sea_water_salinity
- units :
- PSU
Array Chunk Bytes 98.80 MiB 46.54 MiB Shape (212302, 61) (100000, 61) Dask graph 3 chunks in 3 graph layers Data type float64 numpy.ndarray - S2(time, depth)float32dask.array<chunksize=(33130, 61), meta=np.ndarray>
- long_name :
- $S^2$
Array Chunk Bytes 49.40 MiB 23.27 MiB Shape (212302, 61) (100000, 61) Dask graph 3 chunks in 3 graph layers Data type float32 numpy.ndarray - T(time, depth)float64dask.array<chunksize=(33130, 61), meta=np.ndarray>
- FORTRAN_format :
- f10.2
- epic_code :
- 20
- generic_name :
- temp
- long_name :
- TEMPERATURE (C)
- name :
- T
- standard_name :
- sea_water_temperature
- units :
- C
Array Chunk Bytes 98.80 MiB 46.54 MiB Shape (212302, 61) (100000, 61) Dask graph 3 chunks in 3 graph layers Data type float64 numpy.ndarray - dens(time, depth)float64dask.array<chunksize=(33130, 61), meta=np.ndarray>
- long_name :
- $ρ$
- standard_name :
- sea_water_potential_density
- units :
- kg/m3
Array Chunk Bytes 98.80 MiB 46.54 MiB Shape (212302, 61) (100000, 61) Dask graph 3 chunks in 3 graph layers Data type float64 numpy.ndarray - densT(time, depth)float64dask.array<chunksize=(33130, 61), meta=np.ndarray>
- description :
- density using T, S
- long_name :
- $ρ_T$
- standard_name :
- sea_water_potential_density
- units :
- kg/m3
Array Chunk Bytes 98.80 MiB 46.54 MiB Shape (212302, 61) (100000, 61) Dask graph 3 chunks in 3 graph layers Data type float64 numpy.ndarray - lwnet(time)float32dask.array<chunksize=(212302,), meta=np.ndarray>
- FORTRAN_format :
- epic_code :
- 1136
- generic_name :
- qln
- long_name :
- NET LONGWAVE RADIATION
- name :
- LWN
- units :
- W m-2
Array Chunk Bytes 829.30 kiB 829.30 kiB Shape (212302,) (212302,) Dask graph 1 chunks in 3 graph layers Data type float32 numpy.ndarray - qlat(time)float32dask.array<chunksize=(212302,), meta=np.ndarray>
- FORTRAN_format :
- epic_code :
- 137
- generic_name :
- qlat
- long_name :
- LATENT HEAT FLUX
- name :
- QL
- units :
- W m-2
Array Chunk Bytes 829.30 kiB 829.30 kiB Shape (212302,) (212302,) Dask graph 1 chunks in 3 graph layers Data type float32 numpy.ndarray - qnet(time)float32dask.array<chunksize=(212302,), meta=np.ndarray>
- FORTRAN_format :
- epic_code :
- 210
- generic_name :
- qtot
- long_name :
- TOTAL HEAT FLUX
- name :
- QT
- units :
- W/M**2
- standard_name :
- surface_downward_heat_flux_in_sea_water
Array Chunk Bytes 829.30 kiB 829.30 kiB Shape (212302,) (212302,) Dask graph 1 chunks in 3 graph layers Data type float32 numpy.ndarray - qsen(time)float32dask.array<chunksize=(212302,), meta=np.ndarray>
- FORTRAN_format :
- epic_code :
- 138
- generic_name :
- qsen
- long_name :
- SENSIBLE HEAT FLUX
- name :
- QS
- units :
- W m-2
Array Chunk Bytes 829.30 kiB 829.30 kiB Shape (212302,) (212302,) Dask graph 1 chunks in 3 graph layers Data type float32 numpy.ndarray - swnet(time)float32dask.array<chunksize=(212302,), meta=np.ndarray>
- FORTRAN_format :
- epic_code :
- 1495
- generic_name :
- sw
- long_name :
- NET SHORTWAVE RADIATION
- name :
- SWN
- units :
- W/M**2
- standard_name :
- net_downward_shortwave_flux_at_sea_water_surface
Array Chunk Bytes 829.30 kiB 829.30 kiB Shape (212302,) (212302,) Dask graph 1 chunks in 3 graph layers Data type float32 numpy.ndarray - tau(time)float64dask.array<chunksize=(212302,), meta=np.ndarray>
- standard_name :
- surface_downward_x_stress
Array Chunk Bytes 1.62 MiB 1.62 MiB Shape (212302,) (212302,) Dask graph 1 chunks in 7 graph layers Data type float64 numpy.ndarray - taux(time)float64dask.array<chunksize=(212302,), meta=np.ndarray>
- standard_name :
- surface_downward_x_stress
Array Chunk Bytes 1.62 MiB 1.62 MiB Shape (212302,) (212302,) Dask graph 1 chunks in 3 graph layers Data type float64 numpy.ndarray - tauy(time)float64dask.array<chunksize=(212302,), meta=np.ndarray>
- standard_name :
- surface_downward_y_stress
Array Chunk Bytes 1.62 MiB 1.62 MiB Shape (212302,) (212302,) Dask graph 1 chunks in 3 graph layers Data type float64 numpy.ndarray - theta(time, depth)float64dask.array<chunksize=(33130, 61), meta=np.ndarray>
- description :
- potential temperature using T, S=35
- long_name :
- $θ$
- standard_name :
- sea_water_potential_temperature
- units :
- degC
Array Chunk Bytes 98.80 MiB 46.54 MiB Shape (212302, 61) (100000, 61) Dask graph 3 chunks in 3 graph layers Data type float64 numpy.ndarray - u(time, depth)float32dask.array<chunksize=(33130, 61), meta=np.ndarray>
- FORTRAN_format :
- epic_code :
- 1205
- generic_name :
- u
- long_name :
- u
- name :
- u
- standard_name :
- sea_water_x_velocity
- units :
- m/s
Array Chunk Bytes 49.40 MiB 23.27 MiB Shape (212302, 61) (100000, 61) Dask graph 3 chunks in 3 graph layers Data type float32 numpy.ndarray - v(time, depth)float32dask.array<chunksize=(33130, 61), meta=np.ndarray>
- FORTRAN_format :
- epic_code :
- 1206
- generic_name :
- v
- long_name :
- v
- name :
- v
- standard_name :
- sea_water_y_velocity
- units :
- m/s
Array Chunk Bytes 49.40 MiB 23.27 MiB Shape (212302, 61) (100000, 61) Dask graph 3 chunks in 3 graph layers Data type float32 numpy.ndarray - wind_dir(time)float32dask.array<chunksize=(212302,), meta=np.ndarray>
- FORTRAN_format :
- epic_code :
- 410
- generic_name :
- long_name :
- WIND DIRECTION
- name :
- WD
- standard_name :
- wind_from_direction
- units :
- degrees
Array Chunk Bytes 829.30 kiB 829.30 kiB Shape (212302,) (212302,) Dask graph 1 chunks in 3 graph layers Data type float32 numpy.ndarray - pressure(depth)float64301.9 296.8 291.8 ... 5.028 -0.0
- standard_name :
- sea_water_pressure
- units :
- dbar
array([301.87732362, 296.84242473, 291.80764803, 286.77299352, 281.73846121, 276.70405112, 271.66976325, 266.63559761, 261.60155422, 256.56763308, 251.5338342 , 246.5001576 , 241.46660329, 236.43317126, 231.39986155, 226.36667414, 221.33360906, 216.30066632, 211.26784592, 206.23514788, 201.2025722 , 196.17011889, 191.13778797, 186.10557945, 181.07349333, 176.04152963, 171.00968835, 165.97796951, 160.94637311, 155.91489917, 150.8835477 , 145.8523187 , 140.82121218, 135.79022817, 130.75936665, 125.72862766, 120.69801119, 115.66751726, 110.63714587, 105.60689704, 100.57677078, 95.54676709, 90.51688599, 85.48712749, 80.4574916 , 75.42797832, 70.39858766, 65.36931965, 60.34017428, 55.31115157, 50.28225153, 45.25347416, 40.22481948, 35.1962875 , 30.16787822, 25.13959167, 20.11142784, 15.08338675, 10.0554684 , 5.02767282, -0. ]) - SA(time, depth)float64dask.array<chunksize=(33130, 61), meta=np.ndarray>
- standard_name :
- sea_water_absolute_salinity
- units :
- g/kg
Array Chunk Bytes 98.80 MiB 46.54 MiB Shape (212302, 61) (100000, 61) Dask graph 3 chunks in 5 graph layers Data type float64 numpy.ndarray - CT(time, depth)float64dask.array<chunksize=(33130, 61), meta=np.ndarray>
- standard_name :
- sea_water_conservative_temperature
- units :
- degC
- reference_scale :
- ITS-90
Array Chunk Bytes 98.80 MiB 46.54 MiB Shape (212302, 61) (100000, 61) Dask graph 3 chunks in 9 graph layers Data type float64 numpy.ndarray - α(time, depth)float64dask.array<chunksize=(33130, 61), meta=np.ndarray>
- units :
- 1/K
- standard_name :
- sea_water_thermal_expansion_coefficient
Array Chunk Bytes 98.80 MiB 46.54 MiB Shape (212302, 61) (100000, 61) Dask graph 3 chunks in 10 graph layers Data type float64 numpy.ndarray - β(time, depth)float64dask.array<chunksize=(33130, 61), meta=np.ndarray>
- units :
- kg/g
- standard_name :
- sea_water_haline_contraction_coefficient
Array Chunk Bytes 98.80 MiB 46.54 MiB Shape (212302, 61) (100000, 61) Dask graph 3 chunks in 10 graph layers Data type float64 numpy.ndarray - Tz(time, depth)float64dask.array<chunksize=(33130, 61), meta=np.ndarray>
- long_name :
- $T_z$
- units :
- ℃/m
Array Chunk Bytes 98.80 MiB 46.54 MiB Shape (212302, 61) (100000, 61) Dask graph 3 chunks in 8 graph layers Data type float64 numpy.ndarray - Sz(time, depth)float64dask.array<chunksize=(33130, 61), meta=np.ndarray>
- long_name :
- $S_z$
- units :
- g/kg/m
Array Chunk Bytes 98.80 MiB 46.54 MiB Shape (212302, 61) (100000, 61) Dask graph 3 chunks in 8 graph layers Data type float64 numpy.ndarray - chi(time, depthchi)float64nan nan nan nan ... nan nan nan nan
array([[nan, nan, nan, nan, nan, nan], [nan, nan, nan, nan, nan, nan], [nan, nan, nan, nan, nan, nan], ..., [nan, nan, nan, nan, nan, nan], [nan, nan, nan, nan, nan, nan], [nan, nan, nan, nan, nan, nan]]) - KT(time, depthchi)float64nan nan nan nan ... nan nan nan nan
- standard_name :
- ocean_vertical_heat_diffusivity
array([[nan, nan, nan, nan, nan, nan], [nan, nan, nan, nan, nan, nan], [nan, nan, nan, nan, nan, nan], ..., [nan, nan, nan, nan, nan, nan], [nan, nan, nan, nan, nan, nan], [nan, nan, nan, nan, nan, nan]]) - eps(time, depthchi)float64nan nan nan nan ... nan nan nan nan
array([[nan, nan, nan, nan, nan, nan], [nan, nan, nan, nan, nan, nan], [nan, nan, nan, nan, nan, nan], ..., [nan, nan, nan, nan, nan, nan], [nan, nan, nan, nan, nan, nan], [nan, nan, nan, nan, nan, nan]]) - Jq(time, depthchi)float64nan nan nan nan ... nan nan nan nan
array([[nan, nan, nan, nan, nan, nan], [nan, nan, nan, nan, nan, nan], [nan, nan, nan, nan, nan, nan], ..., [nan, nan, nan, nan, nan, nan], [nan, nan, nan, nan, nan, nan], [nan, nan, nan, nan, nan, nan]]) - shred2(time, depth)float64dask.array<chunksize=(33130, 61), meta=np.ndarray>
- long_name :
- $Sh_{red}^2$
- units :
- $s^{-2}$
Array Chunk Bytes 98.80 MiB 46.54 MiB Shape (212302, 61) (100000, 61) Dask graph 3 chunks in 8 graph layers Data type float64 numpy.ndarray - Rig(time, depth)float64dask.array<chunksize=(33130, 61), meta=np.ndarray>
- long_name :
- $Ri^g$
Array Chunk Bytes 98.80 MiB 46.54 MiB Shape (212302, 61) (100000, 61) Dask graph 3 chunks in 7 graph layers Data type float64 numpy.ndarray - sst(time)float64dask.array<chunksize=(33130,), meta=np.ndarray>
- description :
- potential temperature using T, S=35
- long_name :
- $SST$
- standard_name :
- sea_surface_temperature
- units :
- degC
Array Chunk Bytes 1.62 MiB 781.25 kiB Shape (212302,) (100000,) Dask graph 3 chunks in 4 graph layers Data type float64 numpy.ndarray - Tflx_dia_diff(time, depthchi)float64nan nan nan nan ... nan nan nan nan
- standard_name :
- ocean_vertical_diffusive_heat_flux
array([[nan, nan, nan, nan, nan, nan], [nan, nan, nan, nan, nan, nan], [nan, nan, nan, nan, nan, nan], ..., [nan, nan, nan, nan, nan, nan], [nan, nan, nan, nan, nan, nan], [nan, nan, nan, nan, nan, nan]]) - Jb(time, depthchi, depth)float64dask.array<chunksize=(33130, 6, 61), meta=np.ndarray>
- standard_name :
- ocean_vertical_diffusive_buoyancy_flux
Array Chunk Bytes 592.82 MiB 279.24 MiB Shape (212302, 6, 61) (100000, 6, 61) Dask graph 3 chunks in 39 graph layers Data type float64 numpy.ndarray - Rif(time, depthchi, depth)float64dask.array<chunksize=(33130, 6, 61), meta=np.ndarray>
- standard_name :
- flux_richardson_number
Array Chunk Bytes 592.82 MiB 279.24 MiB Shape (212302, 6, 61) (100000, 6, 61) Dask graph 3 chunks in 42 graph layers Data type float64 numpy.ndarray
- depthPandasIndex
PandasIndex(Float64Index([-300.0, -295.0, -290.0, -285.0, -280.0, -275.0, -270.0, -265.0, -260.0, -255.0, -250.0, -245.0, -240.0, -235.0, -230.0, -225.0, -220.0, -215.0, -210.0, -205.0, -200.0, -195.0, -190.0, -185.0, -180.0, -175.0, -170.0, -165.0, -160.0, -155.0, -150.0, -145.0, -140.0, -135.0, -130.0, -125.0, -120.0, -115.0, -110.0, -105.0, -100.0, -95.0, -90.0, -85.0, -80.0, -75.0, -70.0, -65.0, -60.0, -55.0, -50.0, -45.0, -40.0, -35.0, -30.0, -25.0, -20.0, -15.0, -10.0, -5.0, 0.0], dtype='float64', name='depth')) - timePandasIndex
PandasIndex(DatetimeIndex(['1996-01-01 00:00:00', '1996-01-01 01:00:00', '1996-01-01 02:00:00', '1996-01-01 03:00:00', '1996-01-01 04:00:00', '1996-01-01 05:00:00', '1996-01-01 06:00:00', '1996-01-01 07:00:00', '1996-01-01 08:00:00', '1996-01-01 09:00:00', ... '2020-03-20 12:00:00', '2020-03-20 13:00:00', '2020-03-20 14:00:00', '2020-03-20 15:00:00', '2020-03-20 16:00:00', '2020-03-20 17:00:00', '2020-03-20 18:00:00', '2020-03-20 19:00:00', '2020-03-20 20:00:00', '2020-03-20 21:00:00'], dtype='datetime64[ns]', name='time', length=212302, freq=None)) - depthchiPandasIndex
PandasIndex(Float64Index([-89.0, -69.0, -59.0, -49.0, -39.0, -29.0], dtype='float64', name='depthchi'))
- CREATION_DATE :
- 23:26 24-FEB-2021
- Data_Source :
- Global Tropical Moored Buoy Array Project Office/NOAA/PMEL
- File_info :
- Contact: Dai.C.McClurg@noaa.gov
- Request_for_acknowledgement :
- If you use these data in publications or presentations, please acknowledge the GTMBA Project Office of NOAA/PMEL. Also, we would appreciate receiving a preprint and/or reprint of publications utilizing the data for inclusion in our bibliography. Relevant publications should be sent to: GTMBA Project Office, NOAA/Pacific Marine Environmental Laboratory, 7600 Sand Point Way NE, Seattle, WA 98115
- _FillValue :
- 1.0000000409184788e+35
- array :
- TAO/TRITON
- missing_value :
- 1.0000000409184788e+35
- platform_code :
- 0n165e
- site_code :
- 0n165e
- wmo_platform_code :
- 52321
tao_gridded.update(
mixpods.pdf_N2S2(tao_gridded.sel(depthchi=slice(-69, -29), time=slice("2017")))
)
<xarray.Dataset>
Dimensions: (time: 212302, depth: 61, depthchi: 6, N2T_bins: 29,
S2_bins: 29, enso_transition_phase: 7, stat: 2,
N2_bins: 29, Rig_T_bins: 9)
Coordinates: (12/26)
deepest (time) float64 dask.array<chunksize=(212302,), meta=np.ndarray>
* depth (depth) float64 -300.0 -295.0 -290.0 ... -5.0 0.0
eucmax (time) float64 dask.array<chunksize=(33130,), meta=np.ndarray>
latitude float32 0.0
longitude float32 -140.0
mld (time) float64 dask.array<chunksize=(212302,), meta=np.ndarray>
... ...
* S2_bins (S2_bins) object [-5.0, -4.9) ... [-2.200000000000...
* enso_transition_phase (enso_transition_phase) object 'none' ... 'all'
* stat (stat) object 'mean' 'count'
* N2_bins (N2_bins) object [-5.0, -4.9) ... [-2.200000000000...
bin_areas (N2T_bins, S2_bins) float64 0.01 0.01 ... 0.01 0.01
* Rig_T_bins (Rig_T_bins) object (0.025118864315095794, 0.03981...
Data variables: (12/41)
N2 (time, depth) float64 dask.array<chunksize=(33130, 61), meta=np.ndarray>
N2T (time, depth) float64 dask.array<chunksize=(33130, 61), meta=np.ndarray>
Ri (time, depth) float64 dask.array<chunksize=(33130, 61), meta=np.ndarray>
Rig_T (time, depth) float64 dask.array<chunksize=(33130, 61), meta=np.ndarray>
S (time, depth) float64 dask.array<chunksize=(33130, 61), meta=np.ndarray>
S2 (time, depth) float32 dask.array<chunksize=(33130, 61), meta=np.ndarray>
... ...
Tflx_dia_diff (time, depthchi) float64 nan nan nan ... nan nan nan
Jb (time, depthchi, depth) float64 dask.array<chunksize=(33130, 6, 61), meta=np.ndarray>
Rif (time, depthchi, depth) float64 dask.array<chunksize=(33130, 6, 61), meta=np.ndarray>
n2s2pdf (N2T_bins, S2_bins, enso_transition_phase) float64 dask.array<chunksize=(29, 29, 1), meta=np.ndarray>
eps_n2s2 (stat, N2_bins, S2_bins, enso_transition_phase) float64 dask.array<chunksize=(1, 29, 29, 7), meta=np.ndarray>
eps_ri (stat, Rig_T_bins, enso_transition_phase) float64 dask.array<chunksize=(1, 9, 1), meta=np.ndarray>
Attributes:
CREATION_DATE: 23:26 24-FEB-2021
Data_Source: Global Tropical Moored Buoy Array Project O...
File_info: Contact: Dai.C.McClurg@noaa.gov
Request_for_acknowledgement: If you use these data in publications or pr...
_FillValue: 1.0000000409184788e+35
array: TAO/TRITON
missing_value: 1.0000000409184788e+35
platform_code: 0n165e
site_code: 0n165e
wmo_platform_code: 52321xarray.Dataset
- time: 212302
- depth: 61
- depthchi: 6
- N2T_bins: 29
- S2_bins: 29
- enso_transition_phase: 7
- stat: 2
- N2_bins: 29
- Rig_T_bins: 9
- deepest(time)float64dask.array<chunksize=(212302,), meta=np.ndarray>
- description :
- Deepest depth with a valid observation
- units :
- m
Array Chunk Bytes 1.62 MiB 1.62 MiB Shape (212302,) (212302,) Dask graph 1 chunks in 3 graph layers Data type float64 numpy.ndarray - depth(depth)float64-300.0 -295.0 -290.0 ... -5.0 0.0
- axis :
- Z
- positive :
- up
- units :
- m
array([-300., -295., -290., -285., -280., -275., -270., -265., -260., -255., -250., -245., -240., -235., -230., -225., -220., -215., -210., -205., -200., -195., -190., -185., -180., -175., -170., -165., -160., -155., -150., -145., -140., -135., -130., -125., -120., -115., -110., -105., -100., -95., -90., -85., -80., -75., -70., -65., -60., -55., -50., -45., -40., -35., -30., -25., -20., -15., -10., -5., 0.]) - eucmax(time)float64dask.array<chunksize=(33130,), meta=np.ndarray>
- units :
- m
- long_name :
- EUC maximum
- positive :
- up
Array Chunk Bytes 1.62 MiB 781.25 kiB Shape (212302,) (100000,) Dask graph 3 chunks in 17 graph layers Data type float64 numpy.ndarray - latitude()float320.0
array(0., dtype=float32)
- longitude()float32-140.0
array(-140., dtype=float32)
- mld(time)float64dask.array<chunksize=(212302,), meta=np.ndarray>
- long_name :
- $z_{MLD}$
- units :
- m
Array Chunk Bytes 1.62 MiB 1.62 MiB Shape (212302,) (212302,) Dask graph 1 chunks in 3 graph layers Data type float64 numpy.ndarray - mldT(time)float64dask.array<chunksize=(33130,), meta=np.ndarray>
- long_name :
- MLD$_θ$
- units :
- m
- description :
- Interpolate θi to 1m grid. Search for max depth where |dθ| > 0.15
Array Chunk Bytes 1.62 MiB 781.25 kiB Shape (212302,) (100000,) Dask graph 3 chunks in 20 graph layers Data type float64 numpy.ndarray - reference_pressure()int640
array(0)
- shallowest(time)float64dask.array<chunksize=(212302,), meta=np.ndarray>
Array Chunk Bytes 1.62 MiB 1.62 MiB Shape (212302,) (212302,) Dask graph 1 chunks in 3 graph layers Data type float64 numpy.ndarray - time(time)datetime64[ns]1996-01-01 ... 2020-03-20T21:00:00
array(['1996-01-01T00:00:00.000000000', '1996-01-01T01:00:00.000000000', '1996-01-01T02:00:00.000000000', ..., '2020-03-20T19:00:00.000000000', '2020-03-20T20:00:00.000000000', '2020-03-20T21:00:00.000000000'], dtype='datetime64[ns]') - zeuc(depth, time)float64dask.array<chunksize=(42, 132856), meta=np.ndarray>
Array Chunk Bytes 98.80 MiB 42.57 MiB Shape (61, 212302) (42, 132856) Dask graph 4 chunks in 3 graph layers Data type float64 numpy.ndarray - depthchi(depthchi)float64-89.0 -69.0 -59.0 -49.0 -39.0 -29.0
- axis :
- Z
- positive :
- up
array([-89., -69., -59., -49., -39., -29.])
- dcl_mask(depth, time)booldask.array<chunksize=(61, 33130), meta=np.ndarray>
- description :
- True when 5m below mldT and above eucmax.
Array Chunk Bytes 12.35 MiB 5.82 MiB Shape (61, 212302) (61, 100000) Dask graph 3 chunks in 45 graph layers Data type bool numpy.ndarray - oni(time)float32-0.9 -0.9 -0.9 -0.9 ... nan nan nan
array([-0.9, -0.9, -0.9, ..., nan, nan, nan], dtype=float32)
- en_mask(time)boolFalse False False ... False False
array([False, False, False, ..., False, False, False])
- ln_mask(time)boolTrue True True ... False False
array([ True, True, True, ..., False, False, False])
- warm_mask(time)boolTrue True True ... True True True
array([ True, True, True, ..., True, True, True])
- cool_mask(time)boolFalse False False ... False False
array([False, False, False, ..., False, False, False])
- enso_transition(time)<U12'La-Nina warm' ... '____________'
- description :
- Warner & Moum (2019) ENSO transition phase; El-Nino = ONI > 0.5 for at least 6 months; La-Nina = ONI < -0.5 for at least 6 months
array(['La-Nina warm', 'La-Nina warm', 'La-Nina warm', ..., '____________', '____________', '____________'], dtype='<U12') - N2T_bins(N2T_bins)object[-5.0, -4.9) ... [-2.20000000000...
- long_name :
- log$_{10} 4N_T^2$
array([Interval(-5.0, -4.9, closed='left'), Interval(-4.9, -4.800000000000001, closed='left'), Interval(-4.800000000000001, -4.700000000000001, closed='left'), Interval(-4.700000000000001, -4.600000000000001, closed='left'), Interval(-4.600000000000001, -4.500000000000002, closed='left'), Interval(-4.500000000000002, -4.400000000000002, closed='left'), Interval(-4.400000000000002, -4.3000000000000025, closed='left'), Interval(-4.3000000000000025, -4.200000000000003, closed='left'), Interval(-4.200000000000003, -4.100000000000003, closed='left'), Interval(-4.100000000000003, -4.0000000000000036, closed='left'), Interval(-4.0000000000000036, -3.900000000000004, closed='left'), Interval(-3.900000000000004, -3.8000000000000043, closed='left'), Interval(-3.8000000000000043, -3.7000000000000046, closed='left'), Interval(-3.7000000000000046, -3.600000000000005, closed='left'), Interval(-3.600000000000005, -3.5000000000000053, closed='left'), Interval(-3.5000000000000053, -3.4000000000000057, closed='left'), Interval(-3.4000000000000057, -3.300000000000006, closed='left'), Interval(-3.300000000000006, -3.2000000000000064, closed='left'), Interval(-3.2000000000000064, -3.1000000000000068, closed='left'), Interval(-3.1000000000000068, -3.000000000000007, closed='left'), Interval(-3.000000000000007, -2.9000000000000075, closed='left'), Interval(-2.9000000000000075, -2.800000000000008, closed='left'), Interval(-2.800000000000008, -2.700000000000008, closed='left'), Interval(-2.700000000000008, -2.6000000000000085, closed='left'), Interval(-2.6000000000000085, -2.500000000000009, closed='left'), Interval(-2.500000000000009, -2.4000000000000092, closed='left'), Interval(-2.4000000000000092, -2.3000000000000096, closed='left'), Interval(-2.3000000000000096, -2.20000000000001, closed='left'), Interval(-2.20000000000001, -2.1000000000000103, closed='left')], dtype=object) - S2_bins(S2_bins)object[-5.0, -4.9) ... [-2.20000000000...
- long_name :
- $S^2$
array([Interval(-5.0, -4.9, closed='left'), Interval(-4.9, -4.800000000000001, closed='left'), Interval(-4.800000000000001, -4.700000000000001, closed='left'), Interval(-4.700000000000001, -4.600000000000001, closed='left'), Interval(-4.600000000000001, -4.500000000000002, closed='left'), Interval(-4.500000000000002, -4.400000000000002, closed='left'), Interval(-4.400000000000002, -4.3000000000000025, closed='left'), Interval(-4.3000000000000025, -4.200000000000003, closed='left'), Interval(-4.200000000000003, -4.100000000000003, closed='left'), Interval(-4.100000000000003, -4.0000000000000036, closed='left'), Interval(-4.0000000000000036, -3.900000000000004, closed='left'), Interval(-3.900000000000004, -3.8000000000000043, closed='left'), Interval(-3.8000000000000043, -3.7000000000000046, closed='left'), Interval(-3.7000000000000046, -3.600000000000005, closed='left'), Interval(-3.600000000000005, -3.5000000000000053, closed='left'), Interval(-3.5000000000000053, -3.4000000000000057, closed='left'), Interval(-3.4000000000000057, -3.300000000000006, closed='left'), Interval(-3.300000000000006, -3.2000000000000064, closed='left'), Interval(-3.2000000000000064, -3.1000000000000068, closed='left'), Interval(-3.1000000000000068, -3.000000000000007, closed='left'), Interval(-3.000000000000007, -2.9000000000000075, closed='left'), Interval(-2.9000000000000075, -2.800000000000008, closed='left'), Interval(-2.800000000000008, -2.700000000000008, closed='left'), Interval(-2.700000000000008, -2.6000000000000085, closed='left'), Interval(-2.6000000000000085, -2.500000000000009, closed='left'), Interval(-2.500000000000009, -2.4000000000000092, closed='left'), Interval(-2.4000000000000092, -2.3000000000000096, closed='left'), Interval(-2.3000000000000096, -2.20000000000001, closed='left'), Interval(-2.20000000000001, -2.1000000000000103, closed='left')], dtype=object) - enso_transition_phase(enso_transition_phase)object'none' 'El-Nino cool' ... 'all'
- description :
- Warner & Moum (2019) ENSO transition phase; El-Nino = ONI > 0.5 for at least 6 months; La-Nina = ONI < -0.5 for at least 6 months
array(['none', 'El-Nino cool', 'El-Nino warm', 'La-Nina cool', 'La-Nina warm', '____________', 'all'], dtype=object) - stat(stat)object'mean' 'count'
array(['mean', 'count'], dtype=object)
- N2_bins(N2_bins)object[-5.0, -4.9) ... [-2.20000000000...
- long_name :
- $N^2$
array([Interval(-5.0, -4.9, closed='left'), Interval(-4.9, -4.800000000000001, closed='left'), Interval(-4.800000000000001, -4.700000000000001, closed='left'), Interval(-4.700000000000001, -4.600000000000001, closed='left'), Interval(-4.600000000000001, -4.500000000000002, closed='left'), Interval(-4.500000000000002, -4.400000000000002, closed='left'), Interval(-4.400000000000002, -4.3000000000000025, closed='left'), Interval(-4.3000000000000025, -4.200000000000003, closed='left'), Interval(-4.200000000000003, -4.100000000000003, closed='left'), Interval(-4.100000000000003, -4.0000000000000036, closed='left'), Interval(-4.0000000000000036, -3.900000000000004, closed='left'), Interval(-3.900000000000004, -3.8000000000000043, closed='left'), Interval(-3.8000000000000043, -3.7000000000000046, closed='left'), Interval(-3.7000000000000046, -3.600000000000005, closed='left'), Interval(-3.600000000000005, -3.5000000000000053, closed='left'), Interval(-3.5000000000000053, -3.4000000000000057, closed='left'), Interval(-3.4000000000000057, -3.300000000000006, closed='left'), Interval(-3.300000000000006, -3.2000000000000064, closed='left'), Interval(-3.2000000000000064, -3.1000000000000068, closed='left'), Interval(-3.1000000000000068, -3.000000000000007, closed='left'), Interval(-3.000000000000007, -2.9000000000000075, closed='left'), Interval(-2.9000000000000075, -2.800000000000008, closed='left'), Interval(-2.800000000000008, -2.700000000000008, closed='left'), Interval(-2.700000000000008, -2.6000000000000085, closed='left'), Interval(-2.6000000000000085, -2.500000000000009, closed='left'), Interval(-2.500000000000009, -2.4000000000000092, closed='left'), Interval(-2.4000000000000092, -2.3000000000000096, closed='left'), Interval(-2.3000000000000096, -2.20000000000001, closed='left'), Interval(-2.20000000000001, -2.1000000000000103, closed='left')], dtype=object) - bin_areas(N2T_bins, S2_bins)float640.01 0.01 0.01 ... 0.01 0.01 0.01
- long_name :
- log$_{10} 4N_T^2$
array([[0.01, 0.01, 0.01, 0.01, 0.01, 0.01, 0.01, 0.01, 0.01, 0.01, 0.01, 0.01, 0.01, 0.01, 0.01, 0.01, 0.01, 0.01, 0.01, 0.01, 0.01, 0.01, 0.01, 0.01, 0.01, 0.01, 0.01, 0.01, 0.01], [0.01, 0.01, 0.01, 0.01, 0.01, 0.01, 0.01, 0.01, 0.01, 0.01, 0.01, 0.01, 0.01, 0.01, 0.01, 0.01, 0.01, 0.01, 0.01, 0.01, 0.01, 0.01, 0.01, 0.01, 0.01, 0.01, 0.01, 0.01, 0.01], [0.01, 0.01, 0.01, 0.01, 0.01, 0.01, 0.01, 0.01, 0.01, 0.01, 0.01, 0.01, 0.01, 0.01, 0.01, 0.01, 0.01, 0.01, 0.01, 0.01, 0.01, 0.01, 0.01, 0.01, 0.01, 0.01, 0.01, 0.01, 0.01], [0.01, 0.01, 0.01, 0.01, 0.01, 0.01, 0.01, 0.01, 0.01, 0.01, 0.01, 0.01, 0.01, 0.01, 0.01, 0.01, 0.01, 0.01, 0.01, 0.01, 0.01, 0.01, 0.01, 0.01, 0.01, 0.01, 0.01, 0.01, 0.01], [0.01, 0.01, 0.01, 0.01, 0.01, 0.01, 0.01, 0.01, 0.01, 0.01, 0.01, 0.01, 0.01, 0.01, 0.01, 0.01, 0.01, 0.01, 0.01, 0.01, 0.01, 0.01, 0.01, 0.01, 0.01, 0.01, 0.01, 0.01, 0.01], [0.01, 0.01, 0.01, 0.01, 0.01, 0.01, 0.01, 0.01, 0.01, 0.01, 0.01, 0.01, 0.01, 0.01, 0.01, 0.01, 0.01, 0.01, 0.01, 0.01, 0.01, 0.01, 0.01, 0.01, 0.01, 0.01, 0.01, 0.01, 0.01], [0.01, 0.01, 0.01, 0.01, 0.01, 0.01, 0.01, 0.01, 0.01, 0.01, 0.01, 0.01, 0.01, 0.01, 0.01, 0.01, 0.01, 0.01, 0.01, 0.01, 0.01, 0.01, ... 0.01, 0.01, 0.01, 0.01, 0.01, 0.01, 0.01, 0.01, 0.01, 0.01, 0.01, 0.01, 0.01, 0.01, 0.01, 0.01, 0.01, 0.01], [0.01, 0.01, 0.01, 0.01, 0.01, 0.01, 0.01, 0.01, 0.01, 0.01, 0.01, 0.01, 0.01, 0.01, 0.01, 0.01, 0.01, 0.01, 0.01, 0.01, 0.01, 0.01, 0.01, 0.01, 0.01, 0.01, 0.01, 0.01, 0.01], [0.01, 0.01, 0.01, 0.01, 0.01, 0.01, 0.01, 0.01, 0.01, 0.01, 0.01, 0.01, 0.01, 0.01, 0.01, 0.01, 0.01, 0.01, 0.01, 0.01, 0.01, 0.01, 0.01, 0.01, 0.01, 0.01, 0.01, 0.01, 0.01], [0.01, 0.01, 0.01, 0.01, 0.01, 0.01, 0.01, 0.01, 0.01, 0.01, 0.01, 0.01, 0.01, 0.01, 0.01, 0.01, 0.01, 0.01, 0.01, 0.01, 0.01, 0.01, 0.01, 0.01, 0.01, 0.01, 0.01, 0.01, 0.01], [0.01, 0.01, 0.01, 0.01, 0.01, 0.01, 0.01, 0.01, 0.01, 0.01, 0.01, 0.01, 0.01, 0.01, 0.01, 0.01, 0.01, 0.01, 0.01, 0.01, 0.01, 0.01, 0.01, 0.01, 0.01, 0.01, 0.01, 0.01, 0.01], [0.01, 0.01, 0.01, 0.01, 0.01, 0.01, 0.01, 0.01, 0.01, 0.01, 0.01, 0.01, 0.01, 0.01, 0.01, 0.01, 0.01, 0.01, 0.01, 0.01, 0.01, 0.01, 0.01, 0.01, 0.01, 0.01, 0.01, 0.01, 0.01], [0.01, 0.01, 0.01, 0.01, 0.01, 0.01, 0.01, 0.01, 0.01, 0.01, 0.01, 0.01, 0.01, 0.01, 0.01, 0.01, 0.01, 0.01, 0.01, 0.01, 0.01, 0.01, 0.01, 0.01, 0.01, 0.01, 0.01, 0.01, 0.01]]) - Rig_T_bins(Rig_T_bins)object(0.025118864315095794, 0.0398107...
- long_name :
- $Ri^g_T$
array([Interval(0.025118864315095794, 0.03981071705534971, closed='right'), Interval(0.03981071705534971, 0.0630957344480193, closed='right'), Interval(0.0630957344480193, 0.09999999999999995, closed='right'), Interval(0.09999999999999995, 0.15848931924611126, closed='right'), Interval(0.15848931924611126, 0.25118864315095785, closed='right'), Interval(0.25118864315095785, 0.3981071705534969, closed='right'), Interval(0.3981071705534969, 0.6309573444801927, closed='right'), Interval(0.6309573444801927, 0.999999999999999, closed='right'), Interval(0.999999999999999, 1.5848931924611116, closed='right')], dtype=object)
- N2(time, depth)float64dask.array<chunksize=(33130, 61), meta=np.ndarray>
- long_name :
- $N^2$
Array Chunk Bytes 98.80 MiB 46.54 MiB Shape (212302, 61) (100000, 61) Dask graph 3 chunks in 3 graph layers Data type float64 numpy.ndarray - N2T(time, depth)float64dask.array<chunksize=(33130, 61), meta=np.ndarray>
- long_name :
- $N^2_T$
Array Chunk Bytes 98.80 MiB 46.54 MiB Shape (212302, 61) (100000, 61) Dask graph 3 chunks in 3 graph layers Data type float64 numpy.ndarray - Ri(time, depth)float64dask.array<chunksize=(33130, 61), meta=np.ndarray>
- long_name :
- $Ri_g$
Array Chunk Bytes 98.80 MiB 46.54 MiB Shape (212302, 61) (100000, 61) Dask graph 3 chunks in 3 graph layers Data type float64 numpy.ndarray - Rig_T(time, depth)float64dask.array<chunksize=(33130, 61), meta=np.ndarray>
- long_name :
- $Ri^g_T$
Array Chunk Bytes 98.80 MiB 46.54 MiB Shape (212302, 61) (100000, 61) Dask graph 3 chunks in 7 graph layers Data type float64 numpy.ndarray - S(time, depth)float64dask.array<chunksize=(33130, 61), meta=np.ndarray>
- FORTRAN_format :
- epic_code :
- 41
- generic_name :
- sal
- long_name :
- SALINITY (PSU)
- name :
- S
- standard_name :
- sea_water_salinity
- units :
- PSU
Array Chunk Bytes 98.80 MiB 46.54 MiB Shape (212302, 61) (100000, 61) Dask graph 3 chunks in 3 graph layers Data type float64 numpy.ndarray - S2(time, depth)float32dask.array<chunksize=(33130, 61), meta=np.ndarray>
- long_name :
- $S^2$
Array Chunk Bytes 49.40 MiB 23.27 MiB Shape (212302, 61) (100000, 61) Dask graph 3 chunks in 3 graph layers Data type float32 numpy.ndarray - T(time, depth)float64dask.array<chunksize=(33130, 61), meta=np.ndarray>
- FORTRAN_format :
- f10.2
- epic_code :
- 20
- generic_name :
- temp
- long_name :
- TEMPERATURE (C)
- name :
- T
- standard_name :
- sea_water_temperature
- units :
- C
Array Chunk Bytes 98.80 MiB 46.54 MiB Shape (212302, 61) (100000, 61) Dask graph 3 chunks in 3 graph layers Data type float64 numpy.ndarray - dens(time, depth)float64dask.array<chunksize=(33130, 61), meta=np.ndarray>
- long_name :
- $ρ$
- standard_name :
- sea_water_potential_density
- units :
- kg/m3
Array Chunk Bytes 98.80 MiB 46.54 MiB Shape (212302, 61) (100000, 61) Dask graph 3 chunks in 3 graph layers Data type float64 numpy.ndarray - densT(time, depth)float64dask.array<chunksize=(33130, 61), meta=np.ndarray>
- description :
- density using T, S
- long_name :
- $ρ_T$
- standard_name :
- sea_water_potential_density
- units :
- kg/m3
Array Chunk Bytes 98.80 MiB 46.54 MiB Shape (212302, 61) (100000, 61) Dask graph 3 chunks in 3 graph layers Data type float64 numpy.ndarray - lwnet(time)float32dask.array<chunksize=(212302,), meta=np.ndarray>
- FORTRAN_format :
- epic_code :
- 1136
- generic_name :
- qln
- long_name :
- NET LONGWAVE RADIATION
- name :
- LWN
- units :
- W m-2
Array Chunk Bytes 829.30 kiB 829.30 kiB Shape (212302,) (212302,) Dask graph 1 chunks in 3 graph layers Data type float32 numpy.ndarray - qlat(time)float32dask.array<chunksize=(212302,), meta=np.ndarray>
- FORTRAN_format :
- epic_code :
- 137
- generic_name :
- qlat
- long_name :
- LATENT HEAT FLUX
- name :
- QL
- units :
- W m-2
Array Chunk Bytes 829.30 kiB 829.30 kiB Shape (212302,) (212302,) Dask graph 1 chunks in 3 graph layers Data type float32 numpy.ndarray - qnet(time)float32dask.array<chunksize=(212302,), meta=np.ndarray>
- FORTRAN_format :
- epic_code :
- 210
- generic_name :
- qtot
- long_name :
- TOTAL HEAT FLUX
- name :
- QT
- units :
- W/M**2
- standard_name :
- surface_downward_heat_flux_in_sea_water
Array Chunk Bytes 829.30 kiB 829.30 kiB Shape (212302,) (212302,) Dask graph 1 chunks in 3 graph layers Data type float32 numpy.ndarray - qsen(time)float32dask.array<chunksize=(212302,), meta=np.ndarray>
- FORTRAN_format :
- epic_code :
- 138
- generic_name :
- qsen
- long_name :
- SENSIBLE HEAT FLUX
- name :
- QS
- units :
- W m-2
Array Chunk Bytes 829.30 kiB 829.30 kiB Shape (212302,) (212302,) Dask graph 1 chunks in 3 graph layers Data type float32 numpy.ndarray - swnet(time)float32dask.array<chunksize=(212302,), meta=np.ndarray>
- FORTRAN_format :
- epic_code :
- 1495
- generic_name :
- sw
- long_name :
- NET SHORTWAVE RADIATION
- name :
- SWN
- units :
- W/M**2
- standard_name :
- net_downward_shortwave_flux_at_sea_water_surface
Array Chunk Bytes 829.30 kiB 829.30 kiB Shape (212302,) (212302,) Dask graph 1 chunks in 3 graph layers Data type float32 numpy.ndarray - tau(time)float64dask.array<chunksize=(212302,), meta=np.ndarray>
- FORTRAN_format :
- description :
- Large & Pond
- epic_code :
- 401
- generic_name :
- long_name :
- WIND SPEED (M/S)
- name :
- WS
- standard_name :
- wind_stress
- units :
- m s-1
Array Chunk Bytes 1.62 MiB 1.62 MiB Shape (212302,) (212302,) Dask graph 1 chunks in 3 graph layers Data type float64 numpy.ndarray - taux(time)float64dask.array<chunksize=(212302,), meta=np.ndarray>
Array Chunk Bytes 1.62 MiB 1.62 MiB Shape (212302,) (212302,) Dask graph 1 chunks in 3 graph layers Data type float64 numpy.ndarray - tauy(time)float64dask.array<chunksize=(212302,), meta=np.ndarray>
Array Chunk Bytes 1.62 MiB 1.62 MiB Shape (212302,) (212302,) Dask graph 1 chunks in 3 graph layers Data type float64 numpy.ndarray - theta(time, depth)float64dask.array<chunksize=(33130, 61), meta=np.ndarray>
- description :
- potential temperature using T, S=35
- long_name :
- $θ$
- standard_name :
- sea_water_potential_temperature
- units :
- degC
Array Chunk Bytes 98.80 MiB 46.54 MiB Shape (212302, 61) (100000, 61) Dask graph 3 chunks in 3 graph layers Data type float64 numpy.ndarray - u(time, depth)float32dask.array<chunksize=(33130, 61), meta=np.ndarray>
- FORTRAN_format :
- epic_code :
- 1205
- generic_name :
- u
- long_name :
- u
- name :
- u
- standard_name :
- sea_water_x_velocity
- units :
- m/s
Array Chunk Bytes 49.40 MiB 23.27 MiB Shape (212302, 61) (100000, 61) Dask graph 3 chunks in 3 graph layers Data type float32 numpy.ndarray - v(time, depth)float32dask.array<chunksize=(33130, 61), meta=np.ndarray>
- FORTRAN_format :
- epic_code :
- 1206
- generic_name :
- v
- long_name :
- v
- name :
- v
- standard_name :
- sea_water_y_velocity
- units :
- m/s
Array Chunk Bytes 49.40 MiB 23.27 MiB Shape (212302, 61) (100000, 61) Dask graph 3 chunks in 3 graph layers Data type float32 numpy.ndarray - wind_dir(time)float32dask.array<chunksize=(212302,), meta=np.ndarray>
- FORTRAN_format :
- epic_code :
- 410
- generic_name :
- long_name :
- WIND DIRECTION
- name :
- WD
- standard_name :
- wind_from_direction
- units :
- degrees
Array Chunk Bytes 829.30 kiB 829.30 kiB Shape (212302,) (212302,) Dask graph 1 chunks in 3 graph layers Data type float32 numpy.ndarray - pressure(depth)float64301.9 296.8 291.8 ... 5.028 -0.0
- standard_name :
- sea_water_pressure
- units :
- dbar
array([301.87732362, 296.84242473, 291.80764803, 286.77299352, 281.73846121, 276.70405112, 271.66976325, 266.63559761, 261.60155422, 256.56763308, 251.5338342 , 246.5001576 , 241.46660329, 236.43317126, 231.39986155, 226.36667414, 221.33360906, 216.30066632, 211.26784592, 206.23514788, 201.2025722 , 196.17011889, 191.13778797, 186.10557945, 181.07349333, 176.04152963, 171.00968835, 165.97796951, 160.94637311, 155.91489917, 150.8835477 , 145.8523187 , 140.82121218, 135.79022817, 130.75936665, 125.72862766, 120.69801119, 115.66751726, 110.63714587, 105.60689704, 100.57677078, 95.54676709, 90.51688599, 85.48712749, 80.4574916 , 75.42797832, 70.39858766, 65.36931965, 60.34017428, 55.31115157, 50.28225153, 45.25347416, 40.22481948, 35.1962875 , 30.16787822, 25.13959167, 20.11142784, 15.08338675, 10.0554684 , 5.02767282, -0. ]) - SA(time, depth)float64dask.array<chunksize=(33130, 61), meta=np.ndarray>
- standard_name :
- sea_water_absolute_salinity
- units :
- g/kg
Array Chunk Bytes 98.80 MiB 46.54 MiB Shape (212302, 61) (100000, 61) Dask graph 3 chunks in 5 graph layers Data type float64 numpy.ndarray - CT(time, depth)float64dask.array<chunksize=(33130, 61), meta=np.ndarray>
- standard_name :
- sea_water_conservative_temperature
- units :
- degC
- reference_scale :
- ITS-90
Array Chunk Bytes 98.80 MiB 46.54 MiB Shape (212302, 61) (100000, 61) Dask graph 3 chunks in 9 graph layers Data type float64 numpy.ndarray - α(time, depth)float64dask.array<chunksize=(33130, 61), meta=np.ndarray>
- units :
- 1/K
- standard_name :
- sea_water_thermal_expansion_coefficient
Array Chunk Bytes 98.80 MiB 46.54 MiB Shape (212302, 61) (100000, 61) Dask graph 3 chunks in 10 graph layers Data type float64 numpy.ndarray - β(time, depth)float64dask.array<chunksize=(33130, 61), meta=np.ndarray>
- units :
- kg/g
- standard_name :
- sea_water_haline_contraction_coefficient
Array Chunk Bytes 98.80 MiB 46.54 MiB Shape (212302, 61) (100000, 61) Dask graph 3 chunks in 10 graph layers Data type float64 numpy.ndarray - Tz(time, depth)float64dask.array<chunksize=(33130, 61), meta=np.ndarray>
- long_name :
- $T_z$
- units :
- ℃/m
Array Chunk Bytes 98.80 MiB 46.54 MiB Shape (212302, 61) (100000, 61) Dask graph 3 chunks in 8 graph layers Data type float64 numpy.ndarray - Sz(time, depth)float64dask.array<chunksize=(33130, 61), meta=np.ndarray>
- long_name :
- $S_z$
- units :
- g/kg/m
Array Chunk Bytes 98.80 MiB 46.54 MiB Shape (212302, 61) (100000, 61) Dask graph 3 chunks in 8 graph layers Data type float64 numpy.ndarray - chi(time, depthchi)float64nan nan nan nan ... nan nan nan nan
array([[nan, nan, nan, nan, nan, nan], [nan, nan, nan, nan, nan, nan], [nan, nan, nan, nan, nan, nan], ..., [nan, nan, nan, nan, nan, nan], [nan, nan, nan, nan, nan, nan], [nan, nan, nan, nan, nan, nan]]) - KT(time, depthchi)float64nan nan nan nan ... nan nan nan nan
- standard_name :
- ocean_vertical_heat_diffusivity
array([[nan, nan, nan, nan, nan, nan], [nan, nan, nan, nan, nan, nan], [nan, nan, nan, nan, nan, nan], ..., [nan, nan, nan, nan, nan, nan], [nan, nan, nan, nan, nan, nan], [nan, nan, nan, nan, nan, nan]]) - eps(time, depthchi)float64nan nan nan nan ... nan nan nan nan
array([[nan, nan, nan, nan, nan, nan], [nan, nan, nan, nan, nan, nan], [nan, nan, nan, nan, nan, nan], ..., [nan, nan, nan, nan, nan, nan], [nan, nan, nan, nan, nan, nan], [nan, nan, nan, nan, nan, nan]]) - Jq(time, depthchi)float64nan nan nan nan ... nan nan nan nan
array([[nan, nan, nan, nan, nan, nan], [nan, nan, nan, nan, nan, nan], [nan, nan, nan, nan, nan, nan], ..., [nan, nan, nan, nan, nan, nan], [nan, nan, nan, nan, nan, nan], [nan, nan, nan, nan, nan, nan]]) - shred2(time, depth)float64dask.array<chunksize=(33130, 61), meta=np.ndarray>
- long_name :
- $Sh_{red}^2$
- units :
- $s^{-2}$
Array Chunk Bytes 98.80 MiB 46.54 MiB Shape (212302, 61) (100000, 61) Dask graph 3 chunks in 8 graph layers Data type float64 numpy.ndarray - Rig(time, depth)float64dask.array<chunksize=(33130, 61), meta=np.ndarray>
- long_name :
- $Ri^g$
Array Chunk Bytes 98.80 MiB 46.54 MiB Shape (212302, 61) (100000, 61) Dask graph 3 chunks in 7 graph layers Data type float64 numpy.ndarray - sst(time)float64dask.array<chunksize=(33130,), meta=np.ndarray>
- description :
- potential temperature using T, S=35
- long_name :
- $SST$
- standard_name :
- sea_surface_temperature
- units :
- degC
Array Chunk Bytes 1.62 MiB 781.25 kiB Shape (212302,) (100000,) Dask graph 3 chunks in 4 graph layers Data type float64 numpy.ndarray - Tflx_dia_diff(time, depthchi)float64nan nan nan nan ... nan nan nan nan
- standard_name :
- ocean_vertical_diffusive_heat_flux
array([[nan, nan, nan, nan, nan, nan], [nan, nan, nan, nan, nan, nan], [nan, nan, nan, nan, nan, nan], ..., [nan, nan, nan, nan, nan, nan], [nan, nan, nan, nan, nan, nan], [nan, nan, nan, nan, nan, nan]]) - Jb(time, depthchi, depth)float64dask.array<chunksize=(33130, 6, 61), meta=np.ndarray>
- standard_name :
- ocean_vertical_diffusive_buoyancy_flux
Array Chunk Bytes 592.82 MiB 279.24 MiB Shape (212302, 6, 61) (100000, 6, 61) Dask graph 3 chunks in 39 graph layers Data type float64 numpy.ndarray - Rif(time, depthchi, depth)float64dask.array<chunksize=(33130, 6, 61), meta=np.ndarray>
- standard_name :
- flux_richardson_number
Array Chunk Bytes 592.82 MiB 279.24 MiB Shape (212302, 6, 61) (100000, 6, 61) Dask graph 3 chunks in 42 graph layers Data type float64 numpy.ndarray - n2s2pdf(N2T_bins, S2_bins, enso_transition_phase)float64dask.array<chunksize=(29, 29, 1), meta=np.ndarray>
- long_name :
- $P(S^2, 4N_T^2)$
Array Chunk Bytes 45.99 kiB 32.85 kiB Shape (29, 29, 7) (29, 29, 5) Dask graph 3 chunks in 83 graph layers Data type float64 numpy.ndarray - eps_n2s2(stat, N2_bins, S2_bins, enso_transition_phase)float64dask.array<chunksize=(1, 29, 29, 7), meta=np.ndarray>
Array Chunk Bytes 91.98 kiB 45.99 kiB Shape (2, 29, 29, 7) (1, 29, 29, 7) Dask graph 2 chunks in 94 graph layers Data type float64 numpy.ndarray - eps_ri(stat, Rig_T_bins, enso_transition_phase)float64dask.array<chunksize=(1, 9, 1), meta=np.ndarray>
Array Chunk Bytes 0.98 kiB 432 B Shape (2, 9, 7) (1, 9, 6) Dask graph 4 chunks in 66 graph layers Data type float64 numpy.ndarray
- depthPandasIndex
PandasIndex(Float64Index([-300.0, -295.0, -290.0, -285.0, -280.0, -275.0, -270.0, -265.0, -260.0, -255.0, -250.0, -245.0, -240.0, -235.0, -230.0, -225.0, -220.0, -215.0, -210.0, -205.0, -200.0, -195.0, -190.0, -185.0, -180.0, -175.0, -170.0, -165.0, -160.0, -155.0, -150.0, -145.0, -140.0, -135.0, -130.0, -125.0, -120.0, -115.0, -110.0, -105.0, -100.0, -95.0, -90.0, -85.0, -80.0, -75.0, -70.0, -65.0, -60.0, -55.0, -50.0, -45.0, -40.0, -35.0, -30.0, -25.0, -20.0, -15.0, -10.0, -5.0, 0.0], dtype='float64', name='depth')) - timePandasIndex
PandasIndex(DatetimeIndex(['1996-01-01 00:00:00', '1996-01-01 01:00:00', '1996-01-01 02:00:00', '1996-01-01 03:00:00', '1996-01-01 04:00:00', '1996-01-01 05:00:00', '1996-01-01 06:00:00', '1996-01-01 07:00:00', '1996-01-01 08:00:00', '1996-01-01 09:00:00', ... '2020-03-20 12:00:00', '2020-03-20 13:00:00', '2020-03-20 14:00:00', '2020-03-20 15:00:00', '2020-03-20 16:00:00', '2020-03-20 17:00:00', '2020-03-20 18:00:00', '2020-03-20 19:00:00', '2020-03-20 20:00:00', '2020-03-20 21:00:00'], dtype='datetime64[ns]', name='time', length=212302, freq=None)) - depthchiPandasIndex
PandasIndex(Float64Index([-89.0, -69.0, -59.0, -49.0, -39.0, -29.0], dtype='float64', name='depthchi'))
- N2T_binsPandasIndex
PandasIndex(Index([ [-5.0, -4.9), [-4.9, -4.800000000000001), [-4.800000000000001, -4.700000000000001), [-4.700000000000001, -4.600000000000001), [-4.600000000000001, -4.500000000000002), [-4.500000000000002, -4.400000000000002), [-4.400000000000002, -4.3000000000000025), [-4.3000000000000025, -4.200000000000003), [-4.200000000000003, -4.100000000000003), [-4.100000000000003, -4.0000000000000036), [-4.0000000000000036, -3.900000000000004), [-3.900000000000004, -3.8000000000000043), [-3.8000000000000043, -3.7000000000000046), [-3.7000000000000046, -3.600000000000005), [-3.600000000000005, -3.5000000000000053), [-3.5000000000000053, -3.4000000000000057), [-3.4000000000000057, -3.300000000000006), [-3.300000000000006, -3.2000000000000064), [-3.2000000000000064, -3.1000000000000068), [-3.1000000000000068, -3.000000000000007), [-3.000000000000007, -2.9000000000000075), [-2.9000000000000075, -2.800000000000008), [-2.800000000000008, -2.700000000000008), [-2.700000000000008, -2.6000000000000085), [-2.6000000000000085, -2.500000000000009), [-2.500000000000009, -2.4000000000000092), [-2.4000000000000092, -2.3000000000000096), [-2.3000000000000096, -2.20000000000001), [-2.20000000000001, -2.1000000000000103)], dtype='object', name='N2T_bins')) - S2_binsPandasIndex
PandasIndex(Index([ [-5.0, -4.9), [-4.9, -4.800000000000001), [-4.800000000000001, -4.700000000000001), [-4.700000000000001, -4.600000000000001), [-4.600000000000001, -4.500000000000002), [-4.500000000000002, -4.400000000000002), [-4.400000000000002, -4.3000000000000025), [-4.3000000000000025, -4.200000000000003), [-4.200000000000003, -4.100000000000003), [-4.100000000000003, -4.0000000000000036), [-4.0000000000000036, -3.900000000000004), [-3.900000000000004, -3.8000000000000043), [-3.8000000000000043, -3.7000000000000046), [-3.7000000000000046, -3.600000000000005), [-3.600000000000005, -3.5000000000000053), [-3.5000000000000053, -3.4000000000000057), [-3.4000000000000057, -3.300000000000006), [-3.300000000000006, -3.2000000000000064), [-3.2000000000000064, -3.1000000000000068), [-3.1000000000000068, -3.000000000000007), [-3.000000000000007, -2.9000000000000075), [-2.9000000000000075, -2.800000000000008), [-2.800000000000008, -2.700000000000008), [-2.700000000000008, -2.6000000000000085), [-2.6000000000000085, -2.500000000000009), [-2.500000000000009, -2.4000000000000092), [-2.4000000000000092, -2.3000000000000096), [-2.3000000000000096, -2.20000000000001), [-2.20000000000001, -2.1000000000000103)], dtype='object', name='S2_bins')) - enso_transition_phasePandasIndex
PandasIndex(Index(['none', 'El-Nino cool', 'El-Nino warm', 'La-Nina cool', 'La-Nina warm', '____________', 'all'], dtype='object', name='enso_transition_phase')) - statPandasIndex
PandasIndex(Index(['mean', 'count'], dtype='object', name='stat'))
- N2_binsPandasIndex
PandasIndex(Index([ [-5.0, -4.9), [-4.9, -4.800000000000001), [-4.800000000000001, -4.700000000000001), [-4.700000000000001, -4.600000000000001), [-4.600000000000001, -4.500000000000002), [-4.500000000000002, -4.400000000000002), [-4.400000000000002, -4.3000000000000025), [-4.3000000000000025, -4.200000000000003), [-4.200000000000003, -4.100000000000003), [-4.100000000000003, -4.0000000000000036), [-4.0000000000000036, -3.900000000000004), [-3.900000000000004, -3.8000000000000043), [-3.8000000000000043, -3.7000000000000046), [-3.7000000000000046, -3.600000000000005), [-3.600000000000005, -3.5000000000000053), [-3.5000000000000053, -3.4000000000000057), [-3.4000000000000057, -3.300000000000006), [-3.300000000000006, -3.2000000000000064), [-3.2000000000000064, -3.1000000000000068), [-3.1000000000000068, -3.000000000000007), [-3.000000000000007, -2.9000000000000075), [-2.9000000000000075, -2.800000000000008), [-2.800000000000008, -2.700000000000008), [-2.700000000000008, -2.6000000000000085), [-2.6000000000000085, -2.500000000000009), [-2.500000000000009, -2.4000000000000092), [-2.4000000000000092, -2.3000000000000096), [-2.3000000000000096, -2.20000000000001), [-2.20000000000001, -2.1000000000000103)], dtype='object', name='N2_bins')) - Rig_T_binsPandasIndex
PandasIndex(Index([(0.025118864315095794, 0.03981071705534971], (0.03981071705534971, 0.0630957344480193], (0.0630957344480193, 0.09999999999999995], (0.09999999999999995, 0.15848931924611126], (0.15848931924611126, 0.25118864315095785], (0.25118864315095785, 0.3981071705534969], (0.3981071705534969, 0.6309573444801927], (0.6309573444801927, 0.999999999999999], (0.999999999999999, 1.5848931924611116]], dtype='object', name='Rig_T_bins'))
- CREATION_DATE :
- 23:26 24-FEB-2021
- Data_Source :
- Global Tropical Moored Buoy Array Project Office/NOAA/PMEL
- File_info :
- Contact: Dai.C.McClurg@noaa.gov
- Request_for_acknowledgement :
- If you use these data in publications or presentations, please acknowledge the GTMBA Project Office of NOAA/PMEL. Also, we would appreciate receiving a preprint and/or reprint of publications utilizing the data for inclusion in our bibliography. Relevant publications should be sent to: GTMBA Project Office, NOAA/Pacific Marine Environmental Laboratory, 7600 Sand Point Way NE, Seattle, WA 98115
- _FillValue :
- 1.0000000409184788e+35
- array :
- TAO/TRITON
- missing_value :
- 1.0000000409184788e+35
- platform_code :
- 0n165e
- site_code :
- 0n165e
- wmo_platform_code :
- 52321
tao_gridded.update(mixpods.daily_composites())
<xarray.Dataset>
Dimensions: (time: 212302, depth: 61, depthchi: 6, N2T_bins: 29,
S2_bins: 29, enso_transition_phase: 7, stat: 2,
N2_bins: 29, Rig_T_bins: 9, hour: 24, tau_bins: 3)
Coordinates: (12/28)
deepest (time) float64 -200.0 -200.0 -200.0 ... nan nan nan
* depth (depth) float64 -300.0 -295.0 -290.0 ... -5.0 0.0
eucmax (time) float64 -25.0 -25.0 -25.0 ... -85.0 -80.0
latitude float32 0.0
longitude float32 -140.0
mld (time) float64 0.0 0.0 0.0 0.0 ... nan nan nan nan
... ...
* stat (stat) object 'mean' 'count'
* N2_bins (N2_bins) object [-5.0, -4.9) ... [-2.200000000000...
bin_areas (N2T_bins, S2_bins) float64 0.01 0.01 ... 0.01 0.01
* Rig_T_bins (Rig_T_bins) object (0.025118864315095794, 0.03981...
* hour (hour) int64 0 1 2 3 4 5 6 7 ... 17 18 19 20 21 22 23
* tau_bins (tau_bins) object (0.0, 0.04] ... (0.075, inf]
Data variables: (12/42)
N2 (time, depth) float64 dask.array<chunksize=(33130, 61), meta=np.ndarray>
N2T (time, depth) float64 dask.array<chunksize=(33130, 61), meta=np.ndarray>
Ri (time, depth) float64 dask.array<chunksize=(33130, 61), meta=np.ndarray>
Rig_T (time, depth) float64 dask.array<chunksize=(33130, 61), meta=np.ndarray>
S (time, depth) float64 dask.array<chunksize=(33130, 61), meta=np.ndarray>
S2 (time, depth) float32 dask.array<chunksize=(33130, 61), meta=np.ndarray>
... ...
Jb (time, depthchi, depth) float64 dask.array<chunksize=(33130, 6, 61), meta=np.ndarray>
Rif (time, depthchi, depth) float64 dask.array<chunksize=(33130, 6, 61), meta=np.ndarray>
n2s2pdf (N2T_bins, S2_bins, enso_transition_phase) float64 dask.array<chunksize=(29, 29, 1), meta=np.ndarray>
eps_n2s2 (stat, N2_bins, S2_bins, enso_transition_phase) float64 dask.array<chunksize=(1, 29, 29, 7), meta=np.ndarray>
eps_ri (stat, Rig_T_bins, enso_transition_phase) float64 dask.array<chunksize=(1, 9, 1), meta=np.ndarray>
eps_tau_median (depthchi, hour, tau_bins) float64 4.463e-09 ... 1...
Attributes:
CREATION_DATE: 23:26 24-FEB-2021
Data_Source: Global Tropical Moored Buoy Array Project O...
File_info: Contact: Dai.C.McClurg@noaa.gov
Request_for_acknowledgement: If you use these data in publications or pr...
_FillValue: 1.0000000409184788e+35
array: TAO/TRITON
missing_value: 1.0000000409184788e+35
platform_code: 0n165e
site_code: 0n165e
wmo_platform_code: 52321xarray.Dataset
- time: 212302
- depth: 61
- depthchi: 6
- N2T_bins: 29
- S2_bins: 29
- enso_transition_phase: 7
- stat: 2
- N2_bins: 29
- Rig_T_bins: 9
- hour: 24
- tau_bins: 3
- deepest(time)float64-200.0 -200.0 -200.0 ... nan nan
- description :
- Deepest depth with a valid observation
- units :
- m
array([-200., -200., -200., ..., nan, nan, nan])
- depth(depth)float64-300.0 -295.0 -290.0 ... -5.0 0.0
- axis :
- Z
- positive :
- up
- units :
- m
array([-300., -295., -290., -285., -280., -275., -270., -265., -260., -255., -250., -245., -240., -235., -230., -225., -220., -215., -210., -205., -200., -195., -190., -185., -180., -175., -170., -165., -160., -155., -150., -145., -140., -135., -130., -125., -120., -115., -110., -105., -100., -95., -90., -85., -80., -75., -70., -65., -60., -55., -50., -45., -40., -35., -30., -25., -20., -15., -10., -5., 0.]) - eucmax(time)float64-25.0 -25.0 -25.0 ... -85.0 -80.0
- units :
- m
- long_name :
- EUC maximum
- positive :
- up
array([-25., -25., -25., ..., -85., -85., -80.])
- latitude()float320.0
array(0., dtype=float32)
- longitude()float32-140.0
array(-140., dtype=float32)
- mld(time)float640.0 0.0 0.0 0.0 ... nan nan nan nan
- long_name :
- $z_{MLD}$
- units :
- m
array([ 0., 0., 0., ..., nan, nan, nan])
- mldT(time)float64-1.0 -1.0 -1.0 -1.0 ... nan nan nan
- long_name :
- MLD$_θ$
- units :
- m
- description :
- Interpolate θi to 1m grid. Search for max depth where |dθ| > 0.15
array([-1., -1., -1., ..., nan, nan, nan])
- reference_pressure()int640
array(0)
- shallowest(time)float640.0 0.0 0.0 0.0 ... nan nan nan nan
array([ 0., 0., 0., ..., nan, nan, nan])
- time(time)datetime64[ns]1996-01-01 ... 2020-03-20T21:00:00
array(['1996-01-01T00:00:00.000000000', '1996-01-01T01:00:00.000000000', '1996-01-01T02:00:00.000000000', ..., '2020-03-20T19:00:00.000000000', '2020-03-20T20:00:00.000000000', '2020-03-20T21:00:00.000000000'], dtype='datetime64[ns]') - zeuc(depth, time)float64dask.array<chunksize=(42, 132856), meta=np.ndarray>
Array Chunk Bytes 98.80 MiB 42.57 MiB Shape (61, 212302) (42, 132856) Dask graph 4 chunks in 3 graph layers Data type float64 numpy.ndarray - depthchi(depthchi)float64-89.0 -69.0 -59.0 -49.0 -39.0 -29.0
- axis :
- Z
- positive :
- up
array([-89., -69., -59., -49., -39., -29.])
- dcl_mask(depth, time)booldask.array<chunksize=(61, 33130), meta=np.ndarray>
- description :
- True when 5m below mldT and above eucmax.
Array Chunk Bytes 12.35 MiB 5.82 MiB Shape (61, 212302) (61, 100000) Dask graph 3 chunks in 45 graph layers Data type bool numpy.ndarray - oni(time)float32-0.9 -0.9 -0.9 -0.9 ... nan nan nan
array([-0.9, -0.9, -0.9, ..., nan, nan, nan], dtype=float32)
- en_mask(time)boolFalse False False ... False False
array([False, False, False, ..., False, False, False])
- ln_mask(time)boolTrue True True ... False False
array([ True, True, True, ..., False, False, False])
- warm_mask(time)boolTrue True True ... True True True
array([ True, True, True, ..., True, True, True])
- cool_mask(time)boolFalse False False ... False False
array([False, False, False, ..., False, False, False])
- enso_transition(time)<U12'La-Nina warm' ... '____________'
- description :
- Warner & Moum (2019) ENSO transition phase; El-Nino = ONI > 0.5 for at least 6 months; La-Nina = ONI < -0.5 for at least 6 months
array(['La-Nina warm', 'La-Nina warm', 'La-Nina warm', ..., '____________', '____________', '____________'], dtype='<U12') - N2T_bins(N2T_bins)object[-5.0, -4.9) ... [-2.20000000000...
- long_name :
- log$_{10} 4N_T^2$
array([Interval(-5.0, -4.9, closed='left'), Interval(-4.9, -4.800000000000001, closed='left'), Interval(-4.800000000000001, -4.700000000000001, closed='left'), Interval(-4.700000000000001, -4.600000000000001, closed='left'), Interval(-4.600000000000001, -4.500000000000002, closed='left'), Interval(-4.500000000000002, -4.400000000000002, closed='left'), Interval(-4.400000000000002, -4.3000000000000025, closed='left'), Interval(-4.3000000000000025, -4.200000000000003, closed='left'), Interval(-4.200000000000003, -4.100000000000003, closed='left'), Interval(-4.100000000000003, -4.0000000000000036, closed='left'), Interval(-4.0000000000000036, -3.900000000000004, closed='left'), Interval(-3.900000000000004, -3.8000000000000043, closed='left'), Interval(-3.8000000000000043, -3.7000000000000046, closed='left'), Interval(-3.7000000000000046, -3.600000000000005, closed='left'), Interval(-3.600000000000005, -3.5000000000000053, closed='left'), Interval(-3.5000000000000053, -3.4000000000000057, closed='left'), Interval(-3.4000000000000057, -3.300000000000006, closed='left'), Interval(-3.300000000000006, -3.2000000000000064, closed='left'), Interval(-3.2000000000000064, -3.1000000000000068, closed='left'), Interval(-3.1000000000000068, -3.000000000000007, closed='left'), Interval(-3.000000000000007, -2.9000000000000075, closed='left'), Interval(-2.9000000000000075, -2.800000000000008, closed='left'), Interval(-2.800000000000008, -2.700000000000008, closed='left'), Interval(-2.700000000000008, -2.6000000000000085, closed='left'), Interval(-2.6000000000000085, -2.500000000000009, closed='left'), Interval(-2.500000000000009, -2.4000000000000092, closed='left'), Interval(-2.4000000000000092, -2.3000000000000096, closed='left'), Interval(-2.3000000000000096, -2.20000000000001, closed='left'), Interval(-2.20000000000001, -2.1000000000000103, closed='left')], dtype=object) - S2_bins(S2_bins)object[-5.0, -4.9) ... [-2.20000000000...
- long_name :
- $S^2$
array([Interval(-5.0, -4.9, closed='left'), Interval(-4.9, -4.800000000000001, closed='left'), Interval(-4.800000000000001, -4.700000000000001, closed='left'), Interval(-4.700000000000001, -4.600000000000001, closed='left'), Interval(-4.600000000000001, -4.500000000000002, closed='left'), Interval(-4.500000000000002, -4.400000000000002, closed='left'), Interval(-4.400000000000002, -4.3000000000000025, closed='left'), Interval(-4.3000000000000025, -4.200000000000003, closed='left'), Interval(-4.200000000000003, -4.100000000000003, closed='left'), Interval(-4.100000000000003, -4.0000000000000036, closed='left'), Interval(-4.0000000000000036, -3.900000000000004, closed='left'), Interval(-3.900000000000004, -3.8000000000000043, closed='left'), Interval(-3.8000000000000043, -3.7000000000000046, closed='left'), Interval(-3.7000000000000046, -3.600000000000005, closed='left'), Interval(-3.600000000000005, -3.5000000000000053, closed='left'), Interval(-3.5000000000000053, -3.4000000000000057, closed='left'), Interval(-3.4000000000000057, -3.300000000000006, closed='left'), Interval(-3.300000000000006, -3.2000000000000064, closed='left'), Interval(-3.2000000000000064, -3.1000000000000068, closed='left'), Interval(-3.1000000000000068, -3.000000000000007, closed='left'), Interval(-3.000000000000007, -2.9000000000000075, closed='left'), Interval(-2.9000000000000075, -2.800000000000008, closed='left'), Interval(-2.800000000000008, -2.700000000000008, closed='left'), Interval(-2.700000000000008, -2.6000000000000085, closed='left'), Interval(-2.6000000000000085, -2.500000000000009, closed='left'), Interval(-2.500000000000009, -2.4000000000000092, closed='left'), Interval(-2.4000000000000092, -2.3000000000000096, closed='left'), Interval(-2.3000000000000096, -2.20000000000001, closed='left'), Interval(-2.20000000000001, -2.1000000000000103, closed='left')], dtype=object) - enso_transition_phase(enso_transition_phase)object'none' 'El-Nino cool' ... 'all'
- description :
- Warner & Moum (2019) ENSO transition phase; El-Nino = ONI > 0.5 for at least 6 months; La-Nina = ONI < -0.5 for at least 6 months
array(['none', 'El-Nino cool', 'El-Nino warm', 'La-Nina cool', 'La-Nina warm', '____________', 'all'], dtype=object) - stat(stat)object'mean' 'count'
array(['mean', 'count'], dtype=object)
- N2_bins(N2_bins)object[-5.0, -4.9) ... [-2.20000000000...
- long_name :
- $N^2$
array([Interval(-5.0, -4.9, closed='left'), Interval(-4.9, -4.800000000000001, closed='left'), Interval(-4.800000000000001, -4.700000000000001, closed='left'), Interval(-4.700000000000001, -4.600000000000001, closed='left'), Interval(-4.600000000000001, -4.500000000000002, closed='left'), Interval(-4.500000000000002, -4.400000000000002, closed='left'), Interval(-4.400000000000002, -4.3000000000000025, closed='left'), Interval(-4.3000000000000025, -4.200000000000003, closed='left'), Interval(-4.200000000000003, -4.100000000000003, closed='left'), Interval(-4.100000000000003, -4.0000000000000036, closed='left'), Interval(-4.0000000000000036, -3.900000000000004, closed='left'), Interval(-3.900000000000004, -3.8000000000000043, closed='left'), Interval(-3.8000000000000043, -3.7000000000000046, closed='left'), Interval(-3.7000000000000046, -3.600000000000005, closed='left'), Interval(-3.600000000000005, -3.5000000000000053, closed='left'), Interval(-3.5000000000000053, -3.4000000000000057, closed='left'), Interval(-3.4000000000000057, -3.300000000000006, closed='left'), Interval(-3.300000000000006, -3.2000000000000064, closed='left'), Interval(-3.2000000000000064, -3.1000000000000068, closed='left'), Interval(-3.1000000000000068, -3.000000000000007, closed='left'), Interval(-3.000000000000007, -2.9000000000000075, closed='left'), Interval(-2.9000000000000075, -2.800000000000008, closed='left'), Interval(-2.800000000000008, -2.700000000000008, closed='left'), Interval(-2.700000000000008, -2.6000000000000085, closed='left'), Interval(-2.6000000000000085, -2.500000000000009, closed='left'), Interval(-2.500000000000009, -2.4000000000000092, closed='left'), Interval(-2.4000000000000092, -2.3000000000000096, closed='left'), Interval(-2.3000000000000096, -2.20000000000001, closed='left'), Interval(-2.20000000000001, -2.1000000000000103, closed='left')], dtype=object) - bin_areas(N2T_bins, S2_bins)float640.01 0.01 0.01 ... 0.01 0.01 0.01
- long_name :
- log$_{10} 4N_T^2$
array([[0.01, 0.01, 0.01, 0.01, 0.01, 0.01, 0.01, 0.01, 0.01, 0.01, 0.01, 0.01, 0.01, 0.01, 0.01, 0.01, 0.01, 0.01, 0.01, 0.01, 0.01, 0.01, 0.01, 0.01, 0.01, 0.01, 0.01, 0.01, 0.01], [0.01, 0.01, 0.01, 0.01, 0.01, 0.01, 0.01, 0.01, 0.01, 0.01, 0.01, 0.01, 0.01, 0.01, 0.01, 0.01, 0.01, 0.01, 0.01, 0.01, 0.01, 0.01, 0.01, 0.01, 0.01, 0.01, 0.01, 0.01, 0.01], [0.01, 0.01, 0.01, 0.01, 0.01, 0.01, 0.01, 0.01, 0.01, 0.01, 0.01, 0.01, 0.01, 0.01, 0.01, 0.01, 0.01, 0.01, 0.01, 0.01, 0.01, 0.01, 0.01, 0.01, 0.01, 0.01, 0.01, 0.01, 0.01], [0.01, 0.01, 0.01, 0.01, 0.01, 0.01, 0.01, 0.01, 0.01, 0.01, 0.01, 0.01, 0.01, 0.01, 0.01, 0.01, 0.01, 0.01, 0.01, 0.01, 0.01, 0.01, 0.01, 0.01, 0.01, 0.01, 0.01, 0.01, 0.01], [0.01, 0.01, 0.01, 0.01, 0.01, 0.01, 0.01, 0.01, 0.01, 0.01, 0.01, 0.01, 0.01, 0.01, 0.01, 0.01, 0.01, 0.01, 0.01, 0.01, 0.01, 0.01, 0.01, 0.01, 0.01, 0.01, 0.01, 0.01, 0.01], [0.01, 0.01, 0.01, 0.01, 0.01, 0.01, 0.01, 0.01, 0.01, 0.01, 0.01, 0.01, 0.01, 0.01, 0.01, 0.01, 0.01, 0.01, 0.01, 0.01, 0.01, 0.01, 0.01, 0.01, 0.01, 0.01, 0.01, 0.01, 0.01], [0.01, 0.01, 0.01, 0.01, 0.01, 0.01, 0.01, 0.01, 0.01, 0.01, 0.01, 0.01, 0.01, 0.01, 0.01, 0.01, 0.01, 0.01, 0.01, 0.01, 0.01, 0.01, ... 0.01, 0.01, 0.01, 0.01, 0.01, 0.01, 0.01, 0.01, 0.01, 0.01, 0.01, 0.01, 0.01, 0.01, 0.01, 0.01, 0.01, 0.01], [0.01, 0.01, 0.01, 0.01, 0.01, 0.01, 0.01, 0.01, 0.01, 0.01, 0.01, 0.01, 0.01, 0.01, 0.01, 0.01, 0.01, 0.01, 0.01, 0.01, 0.01, 0.01, 0.01, 0.01, 0.01, 0.01, 0.01, 0.01, 0.01], [0.01, 0.01, 0.01, 0.01, 0.01, 0.01, 0.01, 0.01, 0.01, 0.01, 0.01, 0.01, 0.01, 0.01, 0.01, 0.01, 0.01, 0.01, 0.01, 0.01, 0.01, 0.01, 0.01, 0.01, 0.01, 0.01, 0.01, 0.01, 0.01], [0.01, 0.01, 0.01, 0.01, 0.01, 0.01, 0.01, 0.01, 0.01, 0.01, 0.01, 0.01, 0.01, 0.01, 0.01, 0.01, 0.01, 0.01, 0.01, 0.01, 0.01, 0.01, 0.01, 0.01, 0.01, 0.01, 0.01, 0.01, 0.01], [0.01, 0.01, 0.01, 0.01, 0.01, 0.01, 0.01, 0.01, 0.01, 0.01, 0.01, 0.01, 0.01, 0.01, 0.01, 0.01, 0.01, 0.01, 0.01, 0.01, 0.01, 0.01, 0.01, 0.01, 0.01, 0.01, 0.01, 0.01, 0.01], [0.01, 0.01, 0.01, 0.01, 0.01, 0.01, 0.01, 0.01, 0.01, 0.01, 0.01, 0.01, 0.01, 0.01, 0.01, 0.01, 0.01, 0.01, 0.01, 0.01, 0.01, 0.01, 0.01, 0.01, 0.01, 0.01, 0.01, 0.01, 0.01], [0.01, 0.01, 0.01, 0.01, 0.01, 0.01, 0.01, 0.01, 0.01, 0.01, 0.01, 0.01, 0.01, 0.01, 0.01, 0.01, 0.01, 0.01, 0.01, 0.01, 0.01, 0.01, 0.01, 0.01, 0.01, 0.01, 0.01, 0.01, 0.01]]) - Rig_T_bins(Rig_T_bins)object(0.025118864315095794, 0.0398107...
- long_name :
- $Ri^g_T$
array([Interval(0.025118864315095794, 0.03981071705534971, closed='right'), Interval(0.03981071705534971, 0.0630957344480193, closed='right'), Interval(0.0630957344480193, 0.09999999999999995, closed='right'), Interval(0.09999999999999995, 0.15848931924611126, closed='right'), Interval(0.15848931924611126, 0.25118864315095785, closed='right'), Interval(0.25118864315095785, 0.3981071705534969, closed='right'), Interval(0.3981071705534969, 0.6309573444801927, closed='right'), Interval(0.6309573444801927, 0.999999999999999, closed='right'), Interval(0.999999999999999, 1.5848931924611116, closed='right')], dtype=object) - hour(hour)int640 1 2 3 4 5 6 ... 18 19 20 21 22 23
array([ 0, 1, 2, 3, 4, 5, 6, 7, 8, 9, 10, 11, 12, 13, 14, 15, 16, 17, 18, 19, 20, 21, 22, 23]) - tau_bins(tau_bins)object(0.0, 0.04] ... (0.075, inf]
- FORTRAN_format :
- description :
- Large & Pond
- epic_code :
- 401
- generic_name :
- long_name :
- WIND SPEED (M/S)
- name :
- WS
- standard_name :
- wind_stress
- units :
- m s-1
array([Interval(0.0, 0.04, closed='right'), Interval(0.04, 0.075, closed='right'), Interval(0.075, inf, closed='right')], dtype=object)
- N2(time, depth)float64dask.array<chunksize=(33130, 61), meta=np.ndarray>
- long_name :
- $N^2$
Array Chunk Bytes 98.80 MiB 46.54 MiB Shape (212302, 61) (100000, 61) Dask graph 3 chunks in 3 graph layers Data type float64 numpy.ndarray - N2T(time, depth)float64dask.array<chunksize=(33130, 61), meta=np.ndarray>
- long_name :
- $N^2_T$
Array Chunk Bytes 98.80 MiB 46.54 MiB Shape (212302, 61) (100000, 61) Dask graph 3 chunks in 3 graph layers Data type float64 numpy.ndarray - Ri(time, depth)float64dask.array<chunksize=(33130, 61), meta=np.ndarray>
- long_name :
- $Ri_g$
Array Chunk Bytes 98.80 MiB 46.54 MiB Shape (212302, 61) (100000, 61) Dask graph 3 chunks in 3 graph layers Data type float64 numpy.ndarray - Rig_T(time, depth)float64dask.array<chunksize=(33130, 61), meta=np.ndarray>
- long_name :
- $Ri^g_T$
Array Chunk Bytes 98.80 MiB 46.54 MiB Shape (212302, 61) (100000, 61) Dask graph 3 chunks in 7 graph layers Data type float64 numpy.ndarray - S(time, depth)float64dask.array<chunksize=(33130, 61), meta=np.ndarray>
- FORTRAN_format :
- epic_code :
- 41
- generic_name :
- sal
- long_name :
- SALINITY (PSU)
- name :
- S
- standard_name :
- sea_water_salinity
- units :
- PSU
Array Chunk Bytes 98.80 MiB 46.54 MiB Shape (212302, 61) (100000, 61) Dask graph 3 chunks in 3 graph layers Data type float64 numpy.ndarray - S2(time, depth)float32dask.array<chunksize=(33130, 61), meta=np.ndarray>
- long_name :
- $S^2$
Array Chunk Bytes 49.40 MiB 23.27 MiB Shape (212302, 61) (100000, 61) Dask graph 3 chunks in 3 graph layers Data type float32 numpy.ndarray - T(time, depth)float64dask.array<chunksize=(33130, 61), meta=np.ndarray>
- FORTRAN_format :
- f10.2
- epic_code :
- 20
- generic_name :
- temp
- long_name :
- TEMPERATURE (C)
- name :
- T
- standard_name :
- sea_water_temperature
- units :
- C
Array Chunk Bytes 98.80 MiB 46.54 MiB Shape (212302, 61) (100000, 61) Dask graph 3 chunks in 3 graph layers Data type float64 numpy.ndarray - dens(time, depth)float64dask.array<chunksize=(33130, 61), meta=np.ndarray>
- long_name :
- $ρ$
- standard_name :
- sea_water_potential_density
- units :
- kg/m3
Array Chunk Bytes 98.80 MiB 46.54 MiB Shape (212302, 61) (100000, 61) Dask graph 3 chunks in 3 graph layers Data type float64 numpy.ndarray - densT(time, depth)float64dask.array<chunksize=(33130, 61), meta=np.ndarray>
- description :
- density using T, S
- long_name :
- $ρ_T$
- standard_name :
- sea_water_potential_density
- units :
- kg/m3
Array Chunk Bytes 98.80 MiB 46.54 MiB Shape (212302, 61) (100000, 61) Dask graph 3 chunks in 3 graph layers Data type float64 numpy.ndarray - lwnet(time)float32dask.array<chunksize=(212302,), meta=np.ndarray>
- FORTRAN_format :
- epic_code :
- 1136
- generic_name :
- qln
- long_name :
- NET LONGWAVE RADIATION
- name :
- LWN
- units :
- W m-2
Array Chunk Bytes 829.30 kiB 829.30 kiB Shape (212302,) (212302,) Dask graph 1 chunks in 3 graph layers Data type float32 numpy.ndarray - qlat(time)float32dask.array<chunksize=(212302,), meta=np.ndarray>
- FORTRAN_format :
- epic_code :
- 137
- generic_name :
- qlat
- long_name :
- LATENT HEAT FLUX
- name :
- QL
- units :
- W m-2
Array Chunk Bytes 829.30 kiB 829.30 kiB Shape (212302,) (212302,) Dask graph 1 chunks in 3 graph layers Data type float32 numpy.ndarray - qnet(time)float32dask.array<chunksize=(212302,), meta=np.ndarray>
- FORTRAN_format :
- epic_code :
- 210
- generic_name :
- qtot
- long_name :
- TOTAL HEAT FLUX
- name :
- QT
- units :
- W/M**2
- standard_name :
- surface_downward_heat_flux_in_sea_water
Array Chunk Bytes 829.30 kiB 829.30 kiB Shape (212302,) (212302,) Dask graph 1 chunks in 3 graph layers Data type float32 numpy.ndarray - qsen(time)float32dask.array<chunksize=(212302,), meta=np.ndarray>
- FORTRAN_format :
- epic_code :
- 138
- generic_name :
- qsen
- long_name :
- SENSIBLE HEAT FLUX
- name :
- QS
- units :
- W m-2
Array Chunk Bytes 829.30 kiB 829.30 kiB Shape (212302,) (212302,) Dask graph 1 chunks in 3 graph layers Data type float32 numpy.ndarray - swnet(time)float32dask.array<chunksize=(212302,), meta=np.ndarray>
- FORTRAN_format :
- epic_code :
- 1495
- generic_name :
- sw
- long_name :
- NET SHORTWAVE RADIATION
- name :
- SWN
- units :
- W/M**2
- standard_name :
- net_downward_shortwave_flux_at_sea_water_surface
Array Chunk Bytes 829.30 kiB 829.30 kiB Shape (212302,) (212302,) Dask graph 1 chunks in 3 graph layers Data type float32 numpy.ndarray - tau(time)float64nan nan nan nan ... nan nan nan nan
- FORTRAN_format :
- description :
- Large & Pond
- epic_code :
- 401
- generic_name :
- long_name :
- WIND SPEED (M/S)
- name :
- WS
- standard_name :
- wind_stress
- units :
- m s-1
array([nan, nan, nan, ..., nan, nan, nan])
- taux(time)float64nan nan nan nan ... nan nan nan nan
array([nan, nan, nan, ..., nan, nan, nan])
- tauy(time)float64dask.array<chunksize=(212302,), meta=np.ndarray>
Array Chunk Bytes 1.62 MiB 1.62 MiB Shape (212302,) (212302,) Dask graph 1 chunks in 3 graph layers Data type float64 numpy.ndarray - theta(time, depth)float64dask.array<chunksize=(33130, 61), meta=np.ndarray>
- description :
- potential temperature using T, S=35
- long_name :
- $θ$
- standard_name :
- sea_water_potential_temperature
- units :
- degC
Array Chunk Bytes 98.80 MiB 46.54 MiB Shape (212302, 61) (100000, 61) Dask graph 3 chunks in 3 graph layers Data type float64 numpy.ndarray - u(time, depth)float32dask.array<chunksize=(33130, 61), meta=np.ndarray>
- FORTRAN_format :
- epic_code :
- 1205
- generic_name :
- u
- long_name :
- u
- name :
- u
- standard_name :
- sea_water_x_velocity
- units :
- m/s
Array Chunk Bytes 49.40 MiB 23.27 MiB Shape (212302, 61) (100000, 61) Dask graph 3 chunks in 3 graph layers Data type float32 numpy.ndarray - v(time, depth)float32dask.array<chunksize=(33130, 61), meta=np.ndarray>
- FORTRAN_format :
- epic_code :
- 1206
- generic_name :
- v
- long_name :
- v
- name :
- v
- standard_name :
- sea_water_y_velocity
- units :
- m/s
Array Chunk Bytes 49.40 MiB 23.27 MiB Shape (212302, 61) (100000, 61) Dask graph 3 chunks in 3 graph layers Data type float32 numpy.ndarray - wind_dir(time)float32dask.array<chunksize=(212302,), meta=np.ndarray>
- FORTRAN_format :
- epic_code :
- 410
- generic_name :
- long_name :
- WIND DIRECTION
- name :
- WD
- standard_name :
- wind_from_direction
- units :
- degrees
Array Chunk Bytes 829.30 kiB 829.30 kiB Shape (212302,) (212302,) Dask graph 1 chunks in 3 graph layers Data type float32 numpy.ndarray - pressure(depth)float64301.9 296.8 291.8 ... 5.028 -0.0
- standard_name :
- sea_water_pressure
- units :
- dbar
array([301.87732362, 296.84242473, 291.80764803, 286.77299352, 281.73846121, 276.70405112, 271.66976325, 266.63559761, 261.60155422, 256.56763308, 251.5338342 , 246.5001576 , 241.46660329, 236.43317126, 231.39986155, 226.36667414, 221.33360906, 216.30066632, 211.26784592, 206.23514788, 201.2025722 , 196.17011889, 191.13778797, 186.10557945, 181.07349333, 176.04152963, 171.00968835, 165.97796951, 160.94637311, 155.91489917, 150.8835477 , 145.8523187 , 140.82121218, 135.79022817, 130.75936665, 125.72862766, 120.69801119, 115.66751726, 110.63714587, 105.60689704, 100.57677078, 95.54676709, 90.51688599, 85.48712749, 80.4574916 , 75.42797832, 70.39858766, 65.36931965, 60.34017428, 55.31115157, 50.28225153, 45.25347416, 40.22481948, 35.1962875 , 30.16787822, 25.13959167, 20.11142784, 15.08338675, 10.0554684 , 5.02767282, -0. ]) - SA(time, depth)float64dask.array<chunksize=(33130, 61), meta=np.ndarray>
- standard_name :
- sea_water_absolute_salinity
- units :
- g/kg
Array Chunk Bytes 98.80 MiB 46.54 MiB Shape (212302, 61) (100000, 61) Dask graph 3 chunks in 5 graph layers Data type float64 numpy.ndarray - CT(time, depth)float64dask.array<chunksize=(33130, 61), meta=np.ndarray>
- standard_name :
- sea_water_conservative_temperature
- units :
- degC
- reference_scale :
- ITS-90
Array Chunk Bytes 98.80 MiB 46.54 MiB Shape (212302, 61) (100000, 61) Dask graph 3 chunks in 9 graph layers Data type float64 numpy.ndarray - α(time, depth)float64dask.array<chunksize=(33130, 61), meta=np.ndarray>
- units :
- 1/K
- standard_name :
- sea_water_thermal_expansion_coefficient
Array Chunk Bytes 98.80 MiB 46.54 MiB Shape (212302, 61) (100000, 61) Dask graph 3 chunks in 10 graph layers Data type float64 numpy.ndarray - β(time, depth)float64dask.array<chunksize=(33130, 61), meta=np.ndarray>
- units :
- kg/g
- standard_name :
- sea_water_haline_contraction_coefficient
Array Chunk Bytes 98.80 MiB 46.54 MiB Shape (212302, 61) (100000, 61) Dask graph 3 chunks in 10 graph layers Data type float64 numpy.ndarray - Tz(time, depth)float64dask.array<chunksize=(33130, 61), meta=np.ndarray>
- long_name :
- $T_z$
- units :
- ℃/m
Array Chunk Bytes 98.80 MiB 46.54 MiB Shape (212302, 61) (100000, 61) Dask graph 3 chunks in 8 graph layers Data type float64 numpy.ndarray - Sz(time, depth)float64dask.array<chunksize=(33130, 61), meta=np.ndarray>
- long_name :
- $S_z$
- units :
- g/kg/m
Array Chunk Bytes 98.80 MiB 46.54 MiB Shape (212302, 61) (100000, 61) Dask graph 3 chunks in 8 graph layers Data type float64 numpy.ndarray - chi(time, depthchi)float64nan nan nan nan ... nan nan nan nan
array([[nan, nan, nan, nan, nan, nan], [nan, nan, nan, nan, nan, nan], [nan, nan, nan, nan, nan, nan], ..., [nan, nan, nan, nan, nan, nan], [nan, nan, nan, nan, nan, nan], [nan, nan, nan, nan, nan, nan]]) - KT(time, depthchi)float64nan nan nan nan ... nan nan nan nan
- standard_name :
- ocean_vertical_heat_diffusivity
array([[nan, nan, nan, nan, nan, nan], [nan, nan, nan, nan, nan, nan], [nan, nan, nan, nan, nan, nan], ..., [nan, nan, nan, nan, nan, nan], [nan, nan, nan, nan, nan, nan], [nan, nan, nan, nan, nan, nan]]) - eps(time, depthchi)float64nan nan nan nan ... nan nan nan nan
array([[nan, nan, nan, nan, nan, nan], [nan, nan, nan, nan, nan, nan], [nan, nan, nan, nan, nan, nan], ..., [nan, nan, nan, nan, nan, nan], [nan, nan, nan, nan, nan, nan], [nan, nan, nan, nan, nan, nan]]) - Jq(time, depthchi)float64nan nan nan nan ... nan nan nan nan
array([[nan, nan, nan, nan, nan, nan], [nan, nan, nan, nan, nan, nan], [nan, nan, nan, nan, nan, nan], ..., [nan, nan, nan, nan, nan, nan], [nan, nan, nan, nan, nan, nan], [nan, nan, nan, nan, nan, nan]]) - shred2(time, depth)float64dask.array<chunksize=(33130, 61), meta=np.ndarray>
- long_name :
- $Sh_{red}^2$
- units :
- $s^{-2}$
Array Chunk Bytes 98.80 MiB 46.54 MiB Shape (212302, 61) (100000, 61) Dask graph 3 chunks in 8 graph layers Data type float64 numpy.ndarray - Rig(time, depth)float64dask.array<chunksize=(33130, 61), meta=np.ndarray>
- long_name :
- $Ri^g$
Array Chunk Bytes 98.80 MiB 46.54 MiB Shape (212302, 61) (100000, 61) Dask graph 3 chunks in 7 graph layers Data type float64 numpy.ndarray - sst(time)float64dask.array<chunksize=(33130,), meta=np.ndarray>
- description :
- potential temperature using T, S=35
- long_name :
- $SST$
- standard_name :
- sea_surface_temperature
- units :
- degC
Array Chunk Bytes 1.62 MiB 781.25 kiB Shape (212302,) (100000,) Dask graph 3 chunks in 4 graph layers Data type float64 numpy.ndarray - Tflx_dia_diff(time, depthchi)float64nan nan nan nan ... nan nan nan nan
- standard_name :
- ocean_vertical_diffusive_heat_flux
array([[nan, nan, nan, nan, nan, nan], [nan, nan, nan, nan, nan, nan], [nan, nan, nan, nan, nan, nan], ..., [nan, nan, nan, nan, nan, nan], [nan, nan, nan, nan, nan, nan], [nan, nan, nan, nan, nan, nan]]) - Jb(time, depthchi, depth)float64dask.array<chunksize=(33130, 6, 61), meta=np.ndarray>
- standard_name :
- ocean_vertical_diffusive_buoyancy_flux
Array Chunk Bytes 592.82 MiB 279.24 MiB Shape (212302, 6, 61) (100000, 6, 61) Dask graph 3 chunks in 39 graph layers Data type float64 numpy.ndarray - Rif(time, depthchi, depth)float64dask.array<chunksize=(33130, 6, 61), meta=np.ndarray>
- standard_name :
- flux_richardson_number
Array Chunk Bytes 592.82 MiB 279.24 MiB Shape (212302, 6, 61) (100000, 6, 61) Dask graph 3 chunks in 42 graph layers Data type float64 numpy.ndarray - n2s2pdf(N2T_bins, S2_bins, enso_transition_phase)float64dask.array<chunksize=(29, 29, 1), meta=np.ndarray>
- long_name :
- $P(S^2, 4N_T^2)$
Array Chunk Bytes 45.99 kiB 32.85 kiB Shape (29, 29, 7) (29, 29, 5) Dask graph 3 chunks in 83 graph layers Data type float64 numpy.ndarray - eps_n2s2(stat, N2_bins, S2_bins, enso_transition_phase)float64dask.array<chunksize=(1, 29, 29, 7), meta=np.ndarray>
Array Chunk Bytes 91.98 kiB 45.99 kiB Shape (2, 29, 29, 7) (1, 29, 29, 7) Dask graph 2 chunks in 94 graph layers Data type float64 numpy.ndarray - eps_ri(stat, Rig_T_bins, enso_transition_phase)float64dask.array<chunksize=(1, 9, 1), meta=np.ndarray>
Array Chunk Bytes 0.98 kiB 432 B Shape (2, 9, 7) (1, 9, 6) Dask graph 4 chunks in 66 graph layers Data type float64 numpy.ndarray - eps_tau_median(depthchi, hour, tau_bins)float644.463e-09 6.783e-09 ... 1.365e-08
array([[[4.46285031e-09, 6.78292222e-09, 1.14820714e-08], [3.72099492e-09, 6.74528602e-09, 1.12711463e-08], [3.10332702e-09, 6.30471682e-09, 1.21314843e-08], [2.17227063e-09, 5.10944547e-09, 7.20786777e-09], [2.26573169e-09, 4.44107591e-09, 6.09390444e-09], [1.98468224e-09, 4.22841744e-09, 6.58168128e-09], [1.92284703e-09, 4.49396054e-09, 6.87013470e-09], [2.22593438e-09, 4.52496335e-09, 6.72007557e-09], [2.23888317e-09, 4.34668455e-09, 9.33788212e-09], [2.14302499e-09, 4.38991907e-09, 8.24705298e-09], [2.23951439e-09, 4.10082866e-09, 9.93495293e-09], [1.97270964e-09, 5.14258345e-09, 1.07793715e-08], [2.28944080e-09, 5.16969216e-09, 1.12626109e-08], [2.52625430e-09, 4.75697067e-09, 1.21101110e-08], [2.24407516e-09, 5.66913957e-09, 1.28568843e-08], [3.15989299e-09, 6.74787633e-09, 1.72505153e-08], [3.71843442e-09, 7.30967546e-09, 2.03690611e-08], [3.65308252e-09, 7.45861017e-09, 1.55102339e-08], [4.71108903e-09, 7.77218405e-09, 1.83938328e-08], [4.62933452e-09, 1.00938251e-08, 2.07670403e-08], ... [3.53530321e-09, 2.15572664e-08, 2.04533978e-07], [3.80384836e-09, 3.59292278e-08, 1.98518261e-07], [4.01897039e-09, 5.69983177e-08, 1.99068245e-07], [5.39421292e-09, 8.43112077e-08, 1.94109492e-07], [6.72059552e-09, 9.43060875e-08, 1.96076292e-07], [1.06650385e-08, 1.00177819e-07, 1.78855666e-07], [1.49882446e-08, 1.10068959e-07, 1.70813476e-07], [1.94310162e-08, 9.14618181e-08, 1.71275292e-07], [2.00991342e-08, 1.07766976e-07, 1.55098046e-07], [2.01081456e-08, 9.02521337e-08, 1.54518966e-07], [1.88983553e-08, 9.10770722e-08, 1.32117402e-07], [2.45114237e-08, 9.21744175e-08, 1.30494792e-07], [2.41644731e-08, 8.58788709e-08, 1.31501598e-07], [2.01590989e-08, 6.97214891e-08, 9.87646986e-08], [1.68784544e-08, 4.56248146e-08, 6.81596373e-08], [1.35658363e-08, 2.78076142e-08, 4.26437875e-08], [1.02723412e-08, 2.07603798e-08, 2.93707042e-08], [9.01192333e-09, 1.35055961e-08, 1.79205466e-08], [6.33692559e-09, 1.02061418e-08, 1.42874447e-08], [5.52068255e-09, 9.10182347e-09, 1.36494369e-08]]])
- depthPandasIndex
PandasIndex(Float64Index([-300.0, -295.0, -290.0, -285.0, -280.0, -275.0, -270.0, -265.0, -260.0, -255.0, -250.0, -245.0, -240.0, -235.0, -230.0, -225.0, -220.0, -215.0, -210.0, -205.0, -200.0, -195.0, -190.0, -185.0, -180.0, -175.0, -170.0, -165.0, -160.0, -155.0, -150.0, -145.0, -140.0, -135.0, -130.0, -125.0, -120.0, -115.0, -110.0, -105.0, -100.0, -95.0, -90.0, -85.0, -80.0, -75.0, -70.0, -65.0, -60.0, -55.0, -50.0, -45.0, -40.0, -35.0, -30.0, -25.0, -20.0, -15.0, -10.0, -5.0, 0.0], dtype='float64', name='depth')) - timePandasIndex
PandasIndex(DatetimeIndex(['1996-01-01 00:00:00', '1996-01-01 01:00:00', '1996-01-01 02:00:00', '1996-01-01 03:00:00', '1996-01-01 04:00:00', '1996-01-01 05:00:00', '1996-01-01 06:00:00', '1996-01-01 07:00:00', '1996-01-01 08:00:00', '1996-01-01 09:00:00', ... '2020-03-20 12:00:00', '2020-03-20 13:00:00', '2020-03-20 14:00:00', '2020-03-20 15:00:00', '2020-03-20 16:00:00', '2020-03-20 17:00:00', '2020-03-20 18:00:00', '2020-03-20 19:00:00', '2020-03-20 20:00:00', '2020-03-20 21:00:00'], dtype='datetime64[ns]', name='time', length=212302, freq=None)) - depthchiPandasIndex
PandasIndex(Float64Index([-89.0, -69.0, -59.0, -49.0, -39.0, -29.0], dtype='float64', name='depthchi'))
- N2T_binsPandasIndex
PandasIndex(Index([ [-5.0, -4.9), [-4.9, -4.800000000000001), [-4.800000000000001, -4.700000000000001), [-4.700000000000001, -4.600000000000001), [-4.600000000000001, -4.500000000000002), [-4.500000000000002, -4.400000000000002), [-4.400000000000002, -4.3000000000000025), [-4.3000000000000025, -4.200000000000003), [-4.200000000000003, -4.100000000000003), [-4.100000000000003, -4.0000000000000036), [-4.0000000000000036, -3.900000000000004), [-3.900000000000004, -3.8000000000000043), [-3.8000000000000043, -3.7000000000000046), [-3.7000000000000046, -3.600000000000005), [-3.600000000000005, -3.5000000000000053), [-3.5000000000000053, -3.4000000000000057), [-3.4000000000000057, -3.300000000000006), [-3.300000000000006, -3.2000000000000064), [-3.2000000000000064, -3.1000000000000068), [-3.1000000000000068, -3.000000000000007), [-3.000000000000007, -2.9000000000000075), [-2.9000000000000075, -2.800000000000008), [-2.800000000000008, -2.700000000000008), [-2.700000000000008, -2.6000000000000085), [-2.6000000000000085, -2.500000000000009), [-2.500000000000009, -2.4000000000000092), [-2.4000000000000092, -2.3000000000000096), [-2.3000000000000096, -2.20000000000001), [-2.20000000000001, -2.1000000000000103)], dtype='object', name='N2T_bins')) - S2_binsPandasIndex
PandasIndex(Index([ [-5.0, -4.9), [-4.9, -4.800000000000001), [-4.800000000000001, -4.700000000000001), [-4.700000000000001, -4.600000000000001), [-4.600000000000001, -4.500000000000002), [-4.500000000000002, -4.400000000000002), [-4.400000000000002, -4.3000000000000025), [-4.3000000000000025, -4.200000000000003), [-4.200000000000003, -4.100000000000003), [-4.100000000000003, -4.0000000000000036), [-4.0000000000000036, -3.900000000000004), [-3.900000000000004, -3.8000000000000043), [-3.8000000000000043, -3.7000000000000046), [-3.7000000000000046, -3.600000000000005), [-3.600000000000005, -3.5000000000000053), [-3.5000000000000053, -3.4000000000000057), [-3.4000000000000057, -3.300000000000006), [-3.300000000000006, -3.2000000000000064), [-3.2000000000000064, -3.1000000000000068), [-3.1000000000000068, -3.000000000000007), [-3.000000000000007, -2.9000000000000075), [-2.9000000000000075, -2.800000000000008), [-2.800000000000008, -2.700000000000008), [-2.700000000000008, -2.6000000000000085), [-2.6000000000000085, -2.500000000000009), [-2.500000000000009, -2.4000000000000092), [-2.4000000000000092, -2.3000000000000096), [-2.3000000000000096, -2.20000000000001), [-2.20000000000001, -2.1000000000000103)], dtype='object', name='S2_bins')) - enso_transition_phasePandasIndex
PandasIndex(Index(['none', 'El-Nino cool', 'El-Nino warm', 'La-Nina cool', 'La-Nina warm', '____________', 'all'], dtype='object', name='enso_transition_phase')) - statPandasIndex
PandasIndex(Index(['mean', 'count'], dtype='object', name='stat'))
- N2_binsPandasIndex
PandasIndex(Index([ [-5.0, -4.9), [-4.9, -4.800000000000001), [-4.800000000000001, -4.700000000000001), [-4.700000000000001, -4.600000000000001), [-4.600000000000001, -4.500000000000002), [-4.500000000000002, -4.400000000000002), [-4.400000000000002, -4.3000000000000025), [-4.3000000000000025, -4.200000000000003), [-4.200000000000003, -4.100000000000003), [-4.100000000000003, -4.0000000000000036), [-4.0000000000000036, -3.900000000000004), [-3.900000000000004, -3.8000000000000043), [-3.8000000000000043, -3.7000000000000046), [-3.7000000000000046, -3.600000000000005), [-3.600000000000005, -3.5000000000000053), [-3.5000000000000053, -3.4000000000000057), [-3.4000000000000057, -3.300000000000006), [-3.300000000000006, -3.2000000000000064), [-3.2000000000000064, -3.1000000000000068), [-3.1000000000000068, -3.000000000000007), [-3.000000000000007, -2.9000000000000075), [-2.9000000000000075, -2.800000000000008), [-2.800000000000008, -2.700000000000008), [-2.700000000000008, -2.6000000000000085), [-2.6000000000000085, -2.500000000000009), [-2.500000000000009, -2.4000000000000092), [-2.4000000000000092, -2.3000000000000096), [-2.3000000000000096, -2.20000000000001), [-2.20000000000001, -2.1000000000000103)], dtype='object', name='N2_bins')) - Rig_T_binsPandasIndex
PandasIndex(Index([(0.025118864315095794, 0.03981071705534971], (0.03981071705534971, 0.0630957344480193], (0.0630957344480193, 0.09999999999999995], (0.09999999999999995, 0.15848931924611126], (0.15848931924611126, 0.25118864315095785], (0.25118864315095785, 0.3981071705534969], (0.3981071705534969, 0.6309573444801927], (0.6309573444801927, 0.999999999999999], (0.999999999999999, 1.5848931924611116]], dtype='object', name='Rig_T_bins')) - hourPandasIndex
PandasIndex(Int64Index([ 0, 1, 2, 3, 4, 5, 6, 7, 8, 9, 10, 11, 12, 13, 14, 15, 16, 17, 18, 19, 20, 21, 22, 23], dtype='int64', name='hour')) - tau_binsPandasIndex
PandasIndex(Index([(0.0, 0.04], (0.04, 0.075], (0.075, inf]], dtype='object', name='tau_bins'))
- CREATION_DATE :
- 23:26 24-FEB-2021
- Data_Source :
- Global Tropical Moored Buoy Array Project Office/NOAA/PMEL
- File_info :
- Contact: Dai.C.McClurg@noaa.gov
- Request_for_acknowledgement :
- If you use these data in publications or presentations, please acknowledge the GTMBA Project Office of NOAA/PMEL. Also, we would appreciate receiving a preprint and/or reprint of publications utilizing the data for inclusion in our bibliography. Relevant publications should be sent to: GTMBA Project Office, NOAA/Pacific Marine Environmental Laboratory, 7600 Sand Point Way NE, Seattle, WA 98115
- _FillValue :
- 1.0000000409184788e+35
- array :
- TAO/TRITON
- missing_value :
- 1.0000000409184788e+35
- platform_code :
- 0n165e
- site_code :
- 0n165e
- wmo_platform_code :
- 52321
%autoreload
mixpods.plot_eps_ri_hist(tao_gridded.eps_ri)
%autoreload
newda = xr.DataArray(
np.log10(
tao_gridded.eps_ri.sel(
enso_transition_phase=["La-Nina cool", "El-Nino warm"], stat="mean"
)
)
)
f, ax = plt.subplots(1, 1, constrained_layout=True)
newda.plot.step(hue="enso_transition_phase", xscale="log", ylim=(-7, -6))
ticks = [0.04, 0.1, 0.25, 0.63, 1.6]
ax.set_xticks(ticks)
ax.set_xticklabels([0.04, 0.1, 0.25, 0.63, 1.6])
dcpy.plots.linex(0.25)
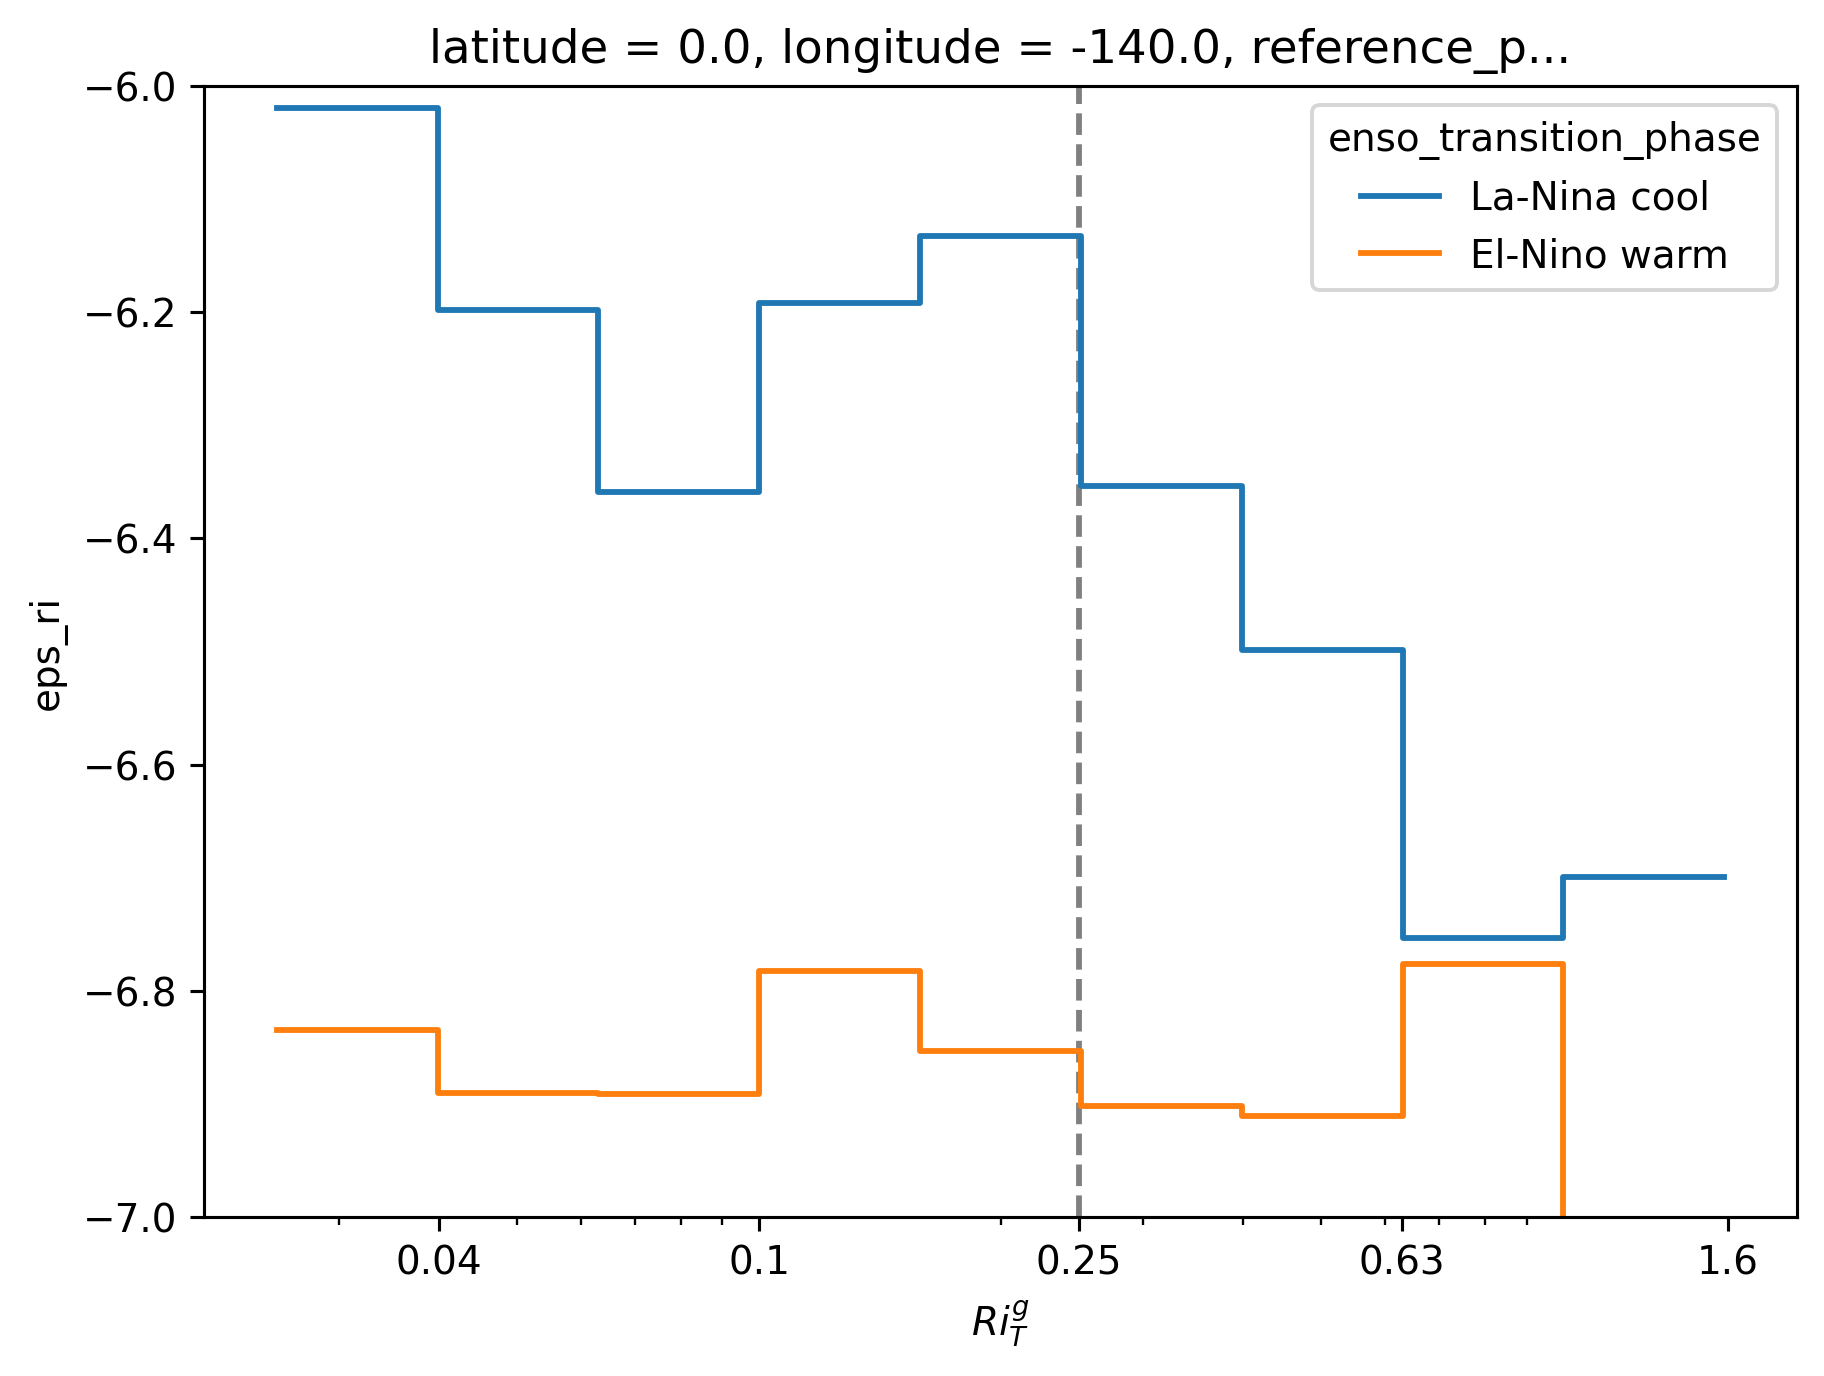
Develop “wind dependencies”: ε-τ-time-of-day diagnostic#
tao_gridded.eps.load().count()
<xarray.DataArray 'eps' ()>
array(176164)
Coordinates:
latitude float32 0.0
longitude float32 -140.0
reference_pressure int64 0xarray.DataArray
'eps'
- 176164
array(176164)
- latitude()float320.0
array(0., dtype=float32)
- longitude()float32-140.0
array(-140., dtype=float32)
- reference_pressure()int640
array(0)
tao_gridded.taux.load().count()
<xarray.DataArray 'taux' ()>
array(166854)
Coordinates:
latitude float32 0.0
longitude float32 -140.0
reference_pressure int64 0xarray.DataArray
'taux'
- 166854
array(166854)
- latitude()float320.0
array(0., dtype=float32)
- longitude()float32-140.0
array(-140., dtype=float32)
- reference_pressure()int640
array(0)
eps_tau_median.sortby("depthchi", ascending=False).plot(
row="depthchi", x="hour", hue="tau_bins", yscale="log"
)
<xarray.plot.facetgrid.FacetGrid at 0x2aed1fd40ca0>
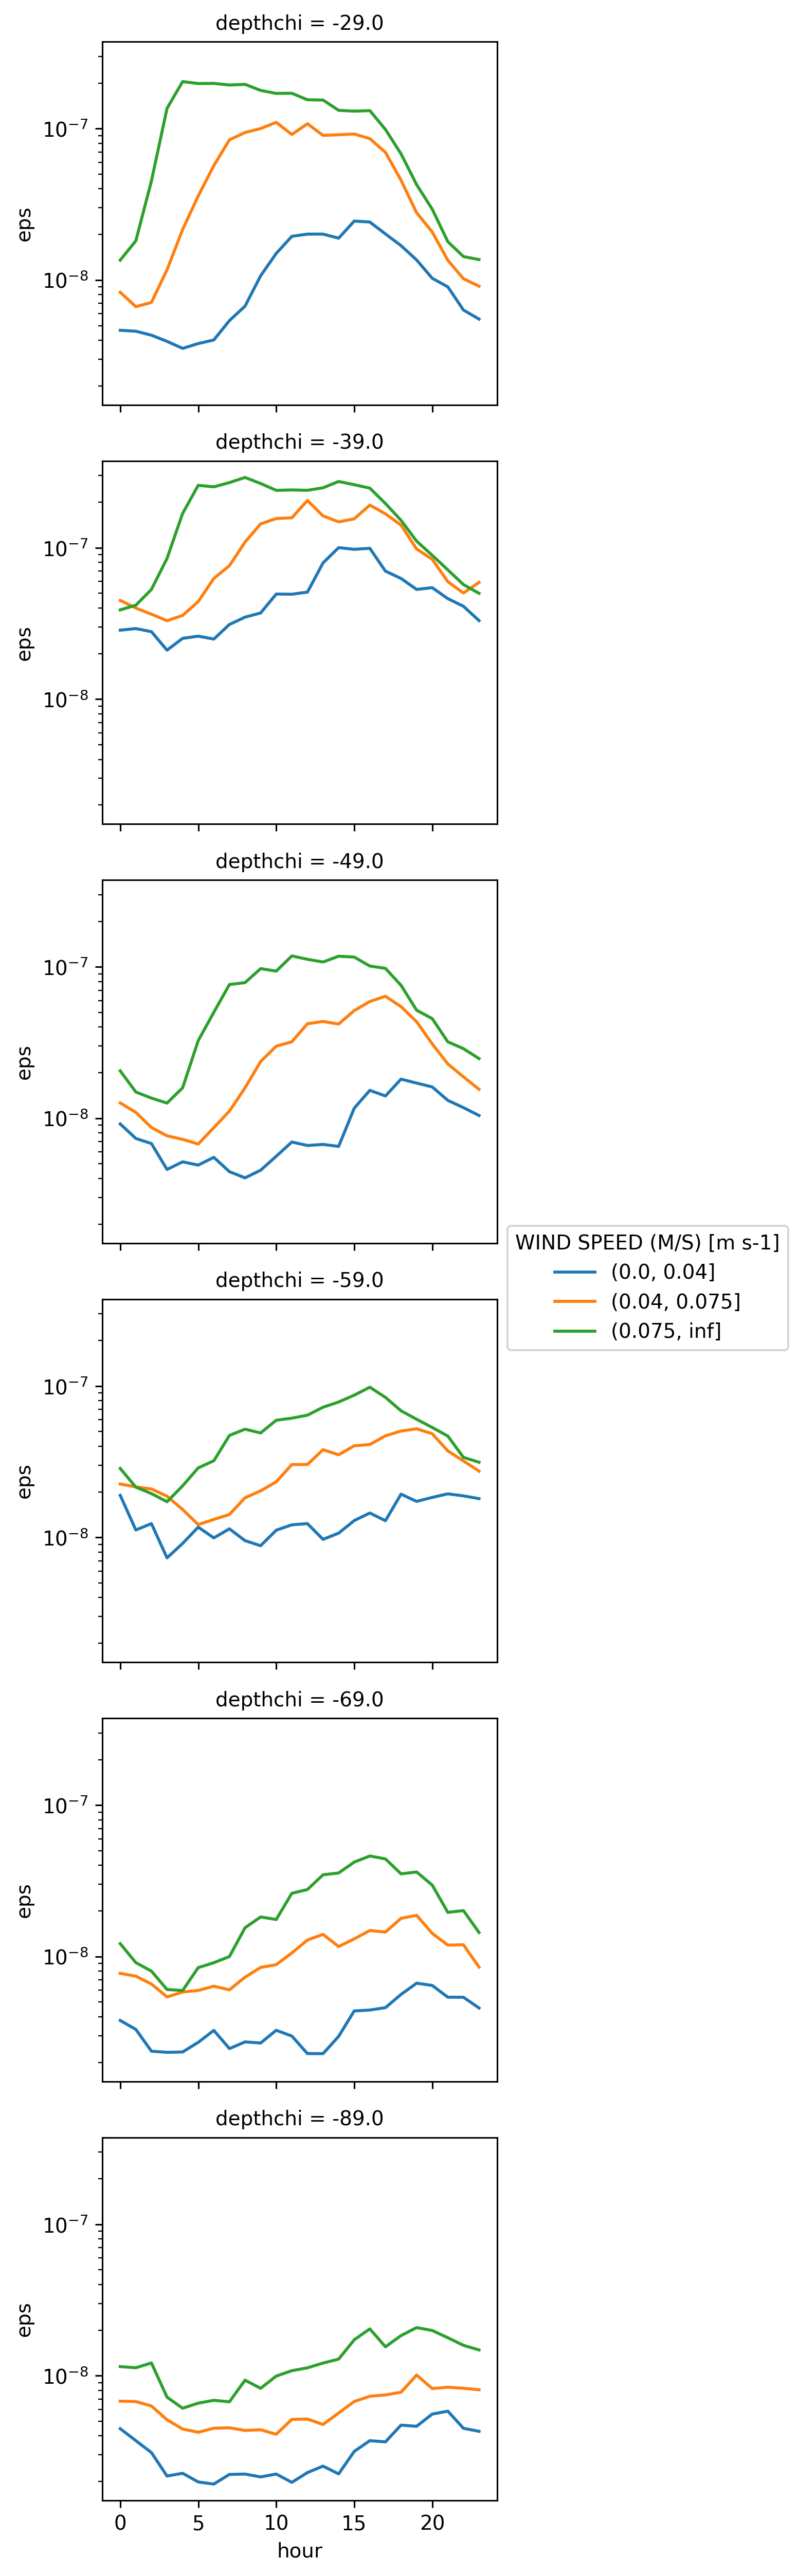
a = eps_tau_median.drop_vars("tau_bins").hvplot.line(
col="depthchi", x="hour", row="tau_bins", logy=True, label="TAO"
)
Test daily composite sensitivity#
Testing sensitivity to grouping by the hourly mean wind, or the daily mean wind (in the local time-zone 12AM-12PM)
tau = tao_gridded.tau.copy(deep=True).reset_coords(drop=True)
tau["time"] = tau["time"] - pd.Timedelta(hours=10)
newtau = tau.resample(time="D").mean().reindex(time=tau.time, method="ffill")
tau.sel(time="2008").hvplot.line() * newtau.sel(time="2008").hvplot.line()
from flox.xarray import xarray_reduce
hourly = xarray_reduce(
tao_gridded.eps.load(),
tao_gridded.time.dt.hour,
tao_gridded.tau.load(),
expected_groups=(None, pd.IntervalIndex.from_breaks([0, 0.04, 0.075, 1])),
func=mixpods.agg_median,
).rename("hourly")
daily = xarray_reduce(
tao_gridded.eps.load(),
tao_gridded.time.dt.hour,
newtau.assign_coords(time=tao_gridded.time).load(),
expected_groups=(None, pd.IntervalIndex.from_breaks([0, 0.04, 0.075, 1])),
func=mixpods.agg_median,
).rename("daily")
(
hourly.hvplot.line(
label="hourly",
col="depthchi",
x="hour",
row="tau_bins",
)
* daily.hvplot.line(
label="daily",
col="depthchi",
x="hour",
row="tau_bins",
)
).opts(hv.opts.GridSpace(show_legend=True, show_title=False), hv.opts.Curve(logy=True))
concatted = xr.concat([hourly, daily], dim="freq").assign_coords(
freq=["hourly", "daily"]
)
(
concatted.hvplot.line(
by="freq", col="depthchi", x="hour", row="tau_bins", logy=True, legend=False
)
).opts(
hv.opts.GridSpace(show_legend=True, show_title=False),
)
Moum et al (2013) Climatologies#
The published .nc file seems “over cleaned” with mask ε < 3e-6 or so
tropflux = xr.open_mfdataset(
sorted(glob.glob("/glade/work/dcherian/datasets/tropflux/**/*.nc")),
engine="netcdf4",
parallel=True,
)
tropflux_0140 = tropflux.interp(latitude=0, longitude=360 - 140).load()
tropflux_clim = tropflux_0140.groupby("time.month").mean()
Monthly climatology, Vertical mean#
Didn’t work with published nc file#
clim = xr.Dataset()
clim["netflux"] = (
tropflux_0140.netflux.sel(time=slice("2005", "2011")).groupby("time.month").mean()
)
clim["Ih"] = tao_gridded.Ih.sel(time=slice("2005", "2011")).groupby("time.month").mean()
clim["Jq"] = (
tao_gridded.Jq.sel(time=slice("2005", "2011"), depthchi=slice(-60, -20))
.groupby("time.month")
.mean(["depthchi", "time"])
)
(-1 * clim.Jq).plot(ylim=(0, 200))
(clim.netflux - clim.Ih).plot(ylim=(0, 200))
[<matplotlib.lines.Line2D>]
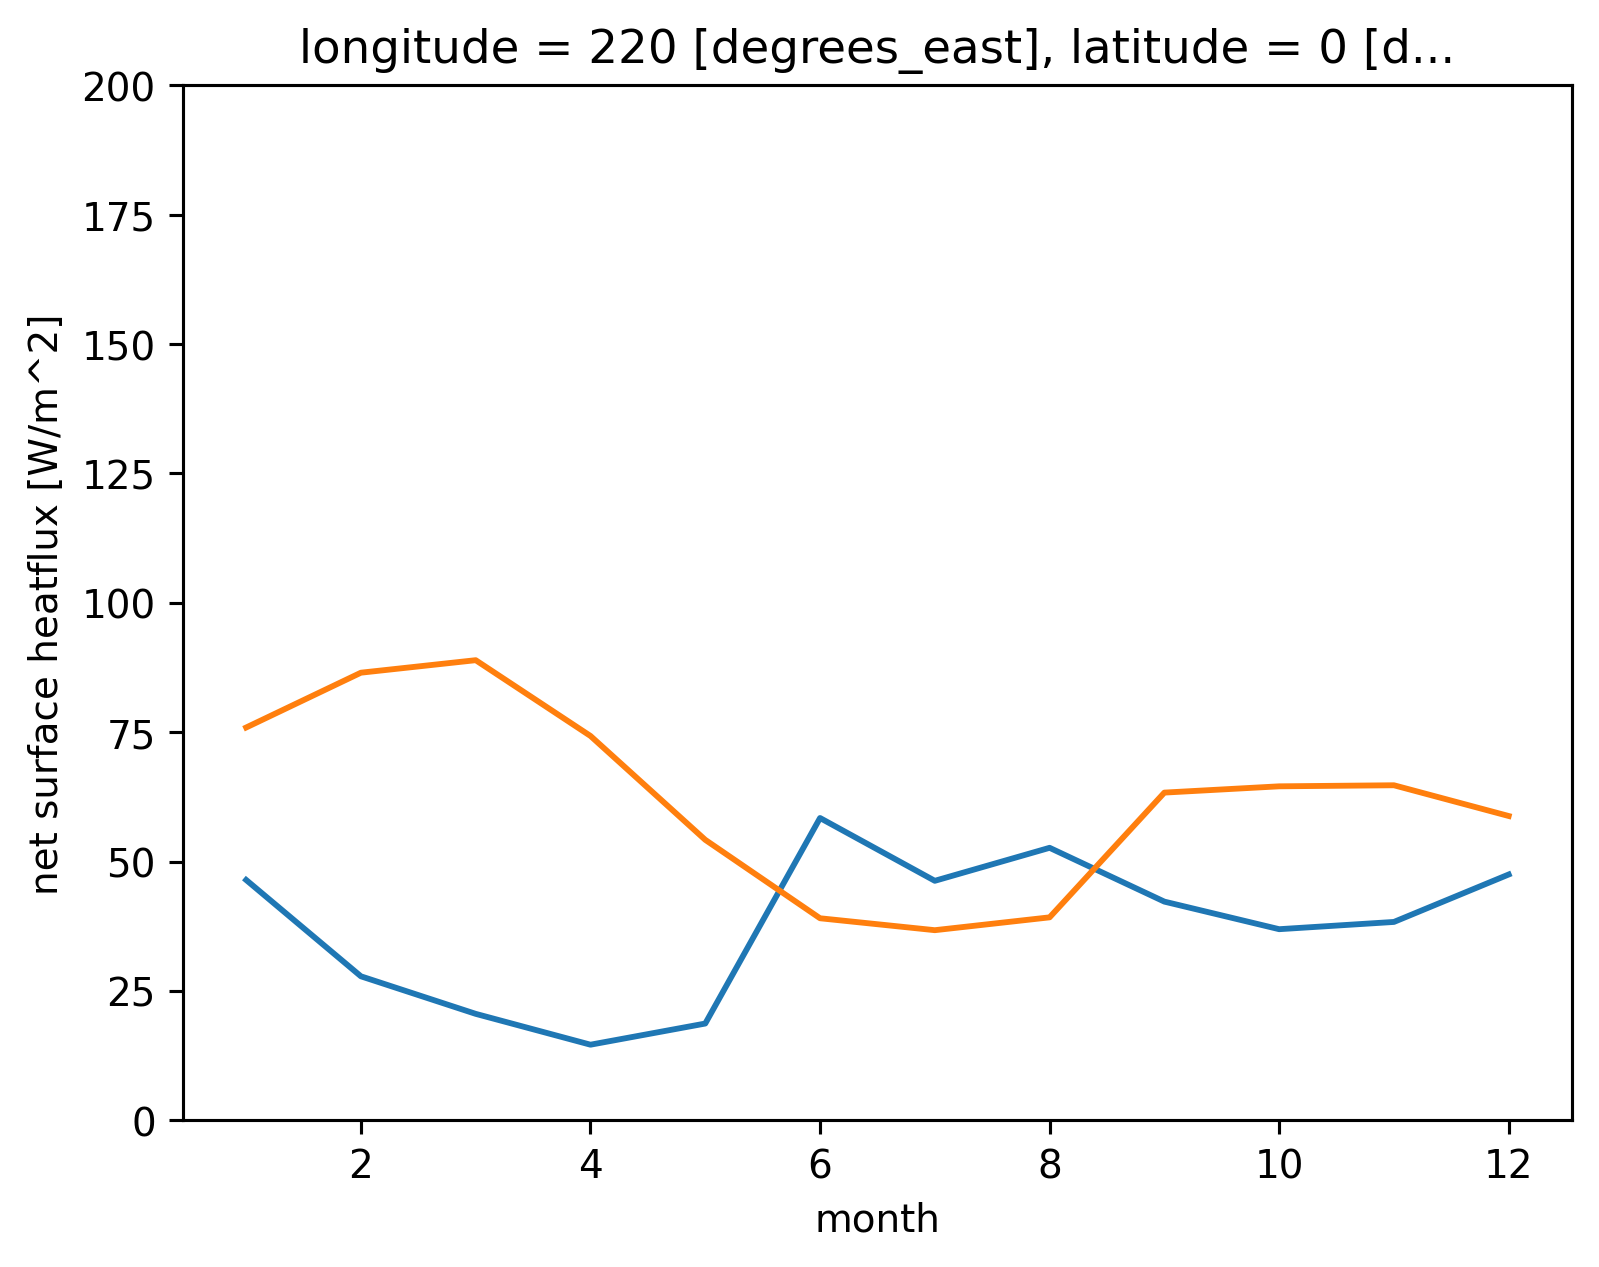
Try with .mat file#
cchdo = dcpy.oceans.read_cchdo_chipod_file(
"/glade/u/home/dcherian/datasets/microstructure/osu/chipod/tao/chipods_0_140W.nc"
)
cchdo
<xarray.Dataset>
Dimensions: (depth: 7, time: 107588)
Coordinates:
timeSeries (depth) float64 ...
* time (time) datetime64[ns] 2005-09-23T04:30:00 ... 2017-12-31T23:2...
lat (depth) float64 dask.array<chunksize=(7,), meta=np.ndarray>
lon (depth) float64 dask.array<chunksize=(7,), meta=np.ndarray>
* depth (depth) float64 29.0 39.0 49.0 59.0 69.0 89.0 119.0
Data variables:
T (depth, time) float64 dask.array<chunksize=(7, 10000), meta=np.ndarray>
dTdz (depth, time) float64 dask.array<chunksize=(7, 10000), meta=np.ndarray>
N2 (depth, time) float64 dask.array<chunksize=(7, 10000), meta=np.ndarray>
KT (depth, time) float64 dask.array<chunksize=(7, 10000), meta=np.ndarray>
chi (depth, time) float64 dask.array<chunksize=(7, 10000), meta=np.ndarray>
eps (depth, time) float64 dask.array<chunksize=(7, 10000), meta=np.ndarray>
Jq (depth, time) float64 dask.array<chunksize=(7, 10000), meta=np.ndarray>
Attributes: (12/68)
ncei_template_version: NCEI_NetCDF_TimeSeries_Orthogonal_Templa...
featureType: timeSeries
title: Turbulence quantities measured by chipod...
summary: Turbulence data in upper w m / all good ...
keywords: sea_water_temperature, square_of_brunt_v...
Conventions: CF-1.6, ACDD-1.3
... ...
reference8: Moum, J.N., Ocean speed and turbulence m...
reference9: Warner, S.J., J. Becherer, K. Pujiana, E...
reference10: Moum, J.N., K. Pujiana, R-C. Lien and W....
reference11: Becherer, J. and J.N. Moum, An efficient...
reference12: Moulin, A.J., J.N. Moum and E.L. Shroyer...
reference13: Thakur, R., E.L. Shroyer, R. Govindaraja...xarray.Dataset
- depth: 7
- time: 107588
- timeSeries(depth)float64...
- long_name :
- depths of Time series of T, dTdz, Nsqr, chi, epsilon, and Jq along a mooring line at 0-140W
- cf_role :
- timeseries_id
[7 values with dtype=float64]
- time(time)datetime64[ns]2005-09-23T04:30:00 ... 2017-12-...
- long_name :
- Time, UTC
- standard_name :
- time
- axis :
- T
array(['2005-09-23T04:30:00.000000000', '2005-09-23T05:29:59.999996672', '2005-09-23T06:30:00.000003328', ..., '2017-12-31T21:30:00.000003328', '2017-12-31T22:30:00.000000000', '2017-12-31T23:29:59.999996672'], dtype='datetime64[ns]') - lat(depth)float64dask.array<chunksize=(7,), meta=np.ndarray>
- long_name :
- latitude
- standard_name :
- latitude
- units :
- degrees_north
- axis :
- Y
- valid_min :
- 0.0
- valid_max :
- 0.0
Array Chunk Bytes 56 B 56 B Shape (7,) (7,) Dask graph 1 chunks in 2 graph layers Data type float64 numpy.ndarray - lon(depth)float64dask.array<chunksize=(7,), meta=np.ndarray>
- long_name :
- longitude
- standard_name :
- longitude
- units :
- degrees_east
- axis :
- X
- valid_min :
- -140.0
- valid_max :
- -140.0
Array Chunk Bytes 56 B 56 B Shape (7,) (7,) Dask graph 1 chunks in 2 graph layers Data type float64 numpy.ndarray - depth(depth)float6429.0 39.0 49.0 59.0 69.0 89.0 119.0
- long_name :
- depths of sensors along the mooring line
- standard_name :
- depth
- units :
- m
- axis :
- Z
- positive :
- down
- valid_min :
- 29.0
- valid_max :
- 119.0
array([ 29., 39., 49., 59., 69., 89., 119.])
- T(depth, time)float64dask.array<chunksize=(7, 10000), meta=np.ndarray>
- long_name :
- sea water temperature
- standard_name :
- sea_water_temperature
- units :
- C
- FillValue :
- -9999
- valid_min :
- 283.15
- valid_max :
- 308.15
- coverage_content_type :
- physicalMeasurement
- grid_mapping :
- crs
- source :
- measured by fast thermistor FP07
- references :
- Moum, J.N. and J.D. Nash, Mixing measurements on an equatorial ocean mooring, J. Atmos. and Oceanic Tech., 26, 317-336, 2009. pdf: http://mixing.coas.oregonstate.edu/papers/mixing_measurements.pdf
- cell_methods :
- depth: point, time: mean
- platform :
- mooring
- instrument :
- chipod
Array Chunk Bytes 5.75 MiB 546.88 kiB Shape (7, 107588) (7, 10000) Dask graph 11 chunks in 4 graph layers Data type float64 numpy.ndarray - dTdz(depth, time)float64dask.array<chunksize=(7, 10000), meta=np.ndarray>
- long_name :
- vertical temperature gradient
- units :
- K m-1
- FillValue :
- -9999
- valid_min :
- 4.9999999999999996e-06
- valid_max :
- 0.001
- coverage_content_type :
- physicalMeasurement
- grid_mapping :
- crs
- references :
- Moum, J.N. and J.D. Nash, Mixing measurements on an equatorial ocean mooring, J. Atmos. and Oceanic Tech., 26, 317-336, 2009. pdf: http://mixing.coas.oregonstate.edu/papers/mixing_measurements.pdf
- cell_methods :
- depth: point, time: mean
- platform :
- mooring
- instrument :
- chipod
Array Chunk Bytes 5.75 MiB 546.88 kiB Shape (7, 107588) (7, 10000) Dask graph 11 chunks in 3 graph layers Data type float64 numpy.ndarray - N2(depth, time)float64dask.array<chunksize=(7, 10000), meta=np.ndarray>
- long_name :
- squared buoyancy frequency
- standard_name :
- square_of_brunt_vaisala_frequency_in_sea_water
- units :
- s-2
- FillValue :
- -9999
- valid_min :
- 1e-10
- valid_max :
- 0.001
- coverage_content_type :
- physicalMeasurement
- grid_mapping :
- crs
- references :
- Moum, J.N. and J.D. Nash, Mixing measurements on an equatorial ocean mooring, J. Atmos. and Oceanic Tech., 26, 317-336, 2009. pdf: http://mixing.coas.oregonstate.edu/papers/mixing_measurements.pdf
- cell_methods :
- depth: point, time: mean
- platform :
- mooring
- instrument :
- chipod
Array Chunk Bytes 5.75 MiB 546.88 kiB Shape (7, 107588) (7, 10000) Dask graph 11 chunks in 3 graph layers Data type float64 numpy.ndarray - KT(depth, time)float64dask.array<chunksize=(7, 10000), meta=np.ndarray>
- long_name :
- turbulent diffusivity of temperature
- standard_name :
- ocean_vertical_heat_diffusivity
- units :
- m2 s-1
- FillValue :
- -9999
- valid_min :
- 1e-10
- valid_max :
- 0.1
- coverage_content_type :
- physicalMeasurement
- grid_mapping :
- crs
- source :
- inferred from fast thermistor spectral scaling
- references :
- Moum, J.N. and J.D. Nash, Mixing measurements on an equatorial ocean mooring, J. Atmos. and Oceanic Tech., 26, 317-336, 2009. pdf: http://mixing.coas.oregonstate.edu/papers/mixing_measurements.pdf
- cell_methods :
- depth: point, time: mean
- platform :
- mooring
- instrument :
- chipod
Array Chunk Bytes 5.75 MiB 546.88 kiB Shape (7, 107588) (7, 10000) Dask graph 11 chunks in 3 graph layers Data type float64 numpy.ndarray - chi(depth, time)float64dask.array<chunksize=(7, 10000), meta=np.ndarray>
- long_name :
- dissipation of temperature variance
- units :
- K2 s-1
- FillValue :
- -9999
- valid_min :
- 1.0000000000000001e-11
- valid_max :
- 0.0001
- coverage_content_type :
- physicalMeasurement
- grid_mapping :
- crs
- source :
- inferred from fast thermistor spectral scaling
- references :
- Moum J.N. and J.D. Nash, Mixing measurements on an equatorial ocean mooring, J. Atmos. and Oceanic Tech., 26, 317-336, 2009. pdf: http://mixing.coas.oregonstate.edu/papers/mixing_measurements.pdf
- cell_methods :
- depth: point, time: mean
- platform :
- mooring
- instrument :
- chipod
Array Chunk Bytes 5.75 MiB 546.88 kiB Shape (7, 107588) (7, 10000) Dask graph 11 chunks in 3 graph layers Data type float64 numpy.ndarray - eps(depth, time)float64dask.array<chunksize=(7, 10000), meta=np.ndarray>
- long_name :
- turbulence dissipation rate
- standard_name :
- specific_turbulent_kinetic_energy_dissipation_in_sea_water
- ncei_name :
- turbulent kinetic energy (TKE) dissipation rate
- units :
- W kg-1
- FillValue :
- -9999
- valid_min :
- 1e-12
- valid_max :
- 9.999999999999999e-06
- coverage_content_type :
- physicalMeasurement
- grid_mapping :
- crs
- source :
- inferred from fast thermistor spectral scaling
- references :
- Moum J.N. and J.D. Nash, Mixing measurements on an equatorial ocean mooring, J. Atmos. and Oceanic Tech., 26, 317-336, 2009. pdf: http://mixing.coas.oregonstate.edu/papers/mixing_measurements.pdf
- cell_methods :
- depth: point, time: mean
- platform :
- mooring
- instrument :
- chipod
Array Chunk Bytes 5.75 MiB 546.88 kiB Shape (7, 107588) (7, 10000) Dask graph 11 chunks in 3 graph layers Data type float64 numpy.ndarray - Jq(depth, time)float64dask.array<chunksize=(7, 10000), meta=np.ndarray>
- long_name :
- turbulent heat flux
- units :
- W m-2
- FillValue :
- -9999
- valid_min :
- -800.0
- valid_max :
- 0.0
- coverage_content_type :
- physicalMeasurement
- grid_mapping :
- crs
- source :
- inferred from fast thermistor spectral scaling
- references :
- Moum J.N. and J.D. Nash, Mixing measurements on an equatorial ocean mooring, J. Atmos. and Oceanic Tech., 26, 317-336, 2009. pdf: http://mixing.coas.oregonstate.edu/papers/mixing_measurements.pdf
- cell_methods :
- depth: point, time: mean
- platform :
- mooring
- instrument :
- chipod
Array Chunk Bytes 5.75 MiB 546.88 kiB Shape (7, 107588) (7, 10000) Dask graph 11 chunks in 3 graph layers Data type float64 numpy.ndarray
- timePandasIndex
PandasIndex(DatetimeIndex([ '2005-09-23 04:30:00', '2005-09-23 05:29:59.999996672', '2005-09-23 06:30:00.000003328', '2005-09-23 07:30:00', '2005-09-23 08:29:59.999996672', '2005-09-23 09:30:00.000003328', '2005-09-23 10:30:00', '2005-09-23 11:29:59.999996672', '2005-09-23 12:30:00.000003328', '2005-09-23 13:30:00', ... '2017-12-31 14:29:59.999996672', '2017-12-31 15:30:00.000003328', '2017-12-31 16:30:00', '2017-12-31 17:29:59.999996672', '2017-12-31 18:30:00.000003328', '2017-12-31 19:30:00', '2017-12-31 20:29:59.999996672', '2017-12-31 21:30:00.000003328', '2017-12-31 22:30:00', '2017-12-31 23:29:59.999996672'], dtype='datetime64[ns]', name='time', length=107588, freq=None)) - depthPandasIndex
PandasIndex(Float64Index([29.0, 39.0, 49.0, 59.0, 69.0, 89.0, 119.0], dtype='float64', name='depth'))
- ncei_template_version :
- NCEI_NetCDF_TimeSeries_Orthogonal_Template_v2.0
- featureType :
- timeSeries
- title :
- Turbulence quantities measured by chipods on a TAO mooring line at 0-140W from 23-Sep-2005 to 31-Dec-2017
- summary :
- Turbulence data in upper w m / all good data between 2005 and 2016 - to be updated as analysis progresses. Data gaps are due to many reasons including lost moorings.
- keywords :
- sea_water_temperature, square_of_brunt_vaisala_frequency_in_sea_water, ocean_vertical_heat_diffusivity, specific_turbulent_kinetic_energy_dissipation_in_sea_water
- Conventions :
- CF-1.6, ACDD-1.3
- naming_authority :
- edu.oregonstate.coas.mixing
- history :
- 2019-07-08 10:19:13 -ncatted
- source :
- fast thermistors FP07
- processing_level :
- 3: Variables mapped on uniform space-time grid from higher resolution
- comment :
- See reference1 through reference13
- acknowledgment :
- Funding from the National Science Foundation ... with in-kind support from NOAA in the form of shipping, handling, deployment, recovery
- license :
- no restrictions
- standard_name_vocabulary :
- NetCDF Climate and Forecast (CF) Metadata Convention Standard Name Table v49
- date_created :
- 2019-07-08T10:19:15415Z
- creator_name :
- Jim Moum / Sally Warner / Aurelie Moulin / Oregon State University Ocean Mixing Group
- creator_url :
- http://mixing.coas.oregonstate.edu
- institution :
- Ocean Mixing Group, College of Earth, Ocean, and Atmospheric Sciences, Oregon State University, USA
- project :
- TAO, PIRATA
- publisher_name :
- Jim Moum / Sally Warner / Aurelie Moulin / Oregon State University Ocean Mixing Group
- publisher_url :
- http://mixing.coas.oregonstate.edu
- geospatial_bounds :
- POINT (0 -140)
- geospatial_bounds_crs :
- EPSG:4326
- geospatial_bounds_vertical_crs :
- EPSG:5831
- geospatial_lat_min :
- 0.0
- geospatial_lat_max :
- 0.0
- geospatial_lon_min :
- -140.0
- geospatial_lon_max :
- -140.0
- geospatial_vertical_min :
- 29.0
- geospatial_vertical_max :
- 119.0
- geospatial_vertical_positive :
- down
- time_coverage_start :
- 2005-09-23T04:30:00000Z
- time_coverage_end :
- 2017-12-31T23:30:00000Z
- time_coverage_duration :
- P12Y3M7DT19H0M00S
- time_coverage_resolution :
- PT1H
- sea_name :
- Equatorial Pacific Ocean
- creator_type :
- group
- creator_institution :
- College of Earth, Ocean, and Atmospheric Science, Oregon State University
- publisher_type :
- group
- publisher_institution :
- College of Earth, Ocean, and Atmospheric Science, Oregon State University
- contributor_name :
- Jim Moum, Sally Warner, Sasha Perlin, Aurelie Moulin
- contributor_role :
- Processed and/or archived data
- geospatial_lat_units :
- degrees_north
- geospatial_lon_units :
- degrees_west
- geospatial_vertical_units :
- m
- date_modified :
- 2019-07-08T10:19:27096Z
- date_issued :
- 2019-07-08T10:19:27416Z
- date_metadata_modified :
- 2019-07-08T10:19:27663Z
- product_version :
- v2.0
- keywords_vocabulary :
- CF Standard Names
- platform :
- TAO mooring
- platform_vocabulary :
- NCEI Ocean Archive System Database
- instrument :
- chipod
- instrument_vocabulary :
- instrument designed by the Ocean Mixing Group at Oregon State University to measure turbulence quantities (http://mixing.coas.oregonstate.edu)
- cdm_data_type :
- Station
- reference1 :
- Moum, J.N. and J.D. Nash, Mixing measurements on an equatorial ocean mooring, J. Atmos. and Oceanic Tech., 26, 317-336, 2009. pdf: http://mixing.coas.oregonstate.edu/papers/mixing_measurements.pdf
- reference2 :
- Zhang, Y. and J.N. Moum, Inertial-convective subrange estimates of thermal variance dissipation rate from moored temperature measurements, J. Atmos. and Oceanic Tech., 27, 1950-1959, 2010. pdf: http://mixing.coas.oregonstate.edu/papers/zhang&moum2010.pdf
- reference3 :
- Moum, J.N., J.D. Nash and W.D. Smyth, Narrowband high-frequency oscillations at the equator. Part I: Interpretation as shear instabilities, J. Phys. Oceanogr, 41, 397-411, 2011. pdf: http://mixing.coas.oregonstate.edu/papers/2010JPO4450.pdf
- reference4 :
- Smyth, W.D., J.N. Moum and J.D. Nash, Narrowband high-frequency oscillations at the equator. Part II: Properties of shear instabilities, J. Phys. Oceanogr, 41, 412-428, 2011. pdf: http://mixing.coas.oregonstate.edu/papers/2010JPO4451.pdf
- reference5 :
- Perlin, A. and J.N. Moum, Comparison of Thermal Variance Dissipation Rates from Moored and Profiling Instruments at the Equator, J. Atmos. Oceanic Tech., 29, 1347-1362, 2012. pdf: http://mixing.coas.oregonstate.edu/papers/chipod_cham_chi_2012.pdf
- reference6 :
- Moum, J.N., A. Perlin, J.D. Nash and M.J. McPhaden, Seasonal sea surface cooling in the equatorial Pacific cold tongue controlled by ocean mixing. Nature, 500, 64-67. doi:10.1038/nature12363, 2013. pdf: https://www.nature.com/articles/nature12363
- reference7 :
- Smyth, W.D. and J.N. Moum, Marginal instability and deep cycle mixing in the eastern equatorial Pacific Ocean. Geophys Res. Lett., 40, 6181-6185, DOI: 10.1002/2013GL058403, 2013. pdf: http://mixing.coas.oregonstate.edu/papers/SmythMoum13_GRL_MI.pdf
- reference8 :
- Moum, J.N., Ocean speed and turbulence measurements using pitot-static tubes on moorings, J. Atmos. Oceanic Technol., 32, 1400-1413, doi:10.1175/JTECH-D-14-00158.1, 2015. pdf: https://journals.ametsoc.org/doi/full/10.1175/JTECH-D-14-00158.1
- reference9 :
- Warner, S.J., J. Becherer, K. Pujiana, E.L. Shroyer, M. Ravichandran, V.P. Thangaprakash and J.N. Moum, Monsoon mixing cycles in the Bay of Bengal: A year-long subsurface mixing record. Oceanography, 29(2):158?169, http://dx.doi.org/10.5670/oceanog.2016.4, 2016. pdf: http://www.tos.org/oceanography/article/monsoon-mixing-cycles-in-the-bay-of-bengal-a-year-long-subsurface-mixing-re
- reference10 :
- Moum, J.N., K. Pujiana, R-C. Lien and W.D. Smyth, Ocean feedback to pulses of the Madden-Julian Oscillation in the equatorial Indian Ocean. Nature Commun. 7, 13203 doi: 10.1038/ncomms13203, 2016. pdf: https://www.nature.com/articles/ncomms13203
- reference11 :
- Becherer, J. and J.N. Moum, An efficient scheme for onboard reduction of moored chipod data. J. Atmos. Oceanic Technol., 34, 2533-2546, doi:10.1175/JTECH-D-17-0118.1, 2017. pdf: https://journals.ametsoc.org/doi/full/10.1175/JTECH-D-17-0118.1
- reference12 :
- Moulin, A.J., J.N. Moum and E.L. Shroyer, Evolution of turbulence in the diurnal warm layer. J. Phys. Oceanogr., 48, 383-396, 2018. pdf: https://journals.ametsoc.org/doi/full/10.1175/JPO-D-17-0170.1
- reference13 :
- Thakur, R., E.L. Shroyer, R. Govindarajan, J.T. Farrar, R.A. Weller and J.N. Moum, Seasonality and buoyancy suppression of turbulence in the Bay of Bengal, Geophys. Res. Lett., https://doi.org/10.1029/2018GL081577, 2019. pdf: https://agupubs.onlinelibrary.wiley.com/doi/full/10.1029/2018GL081577
mat = mixpods.read_chipod_mat_file(
os.path.expanduser("~/work/pump/datasets/microstructure/chipods_0_140W_hourly.mat")
)
mat.Jq.where(np.abs(mat.Jq) < 10000).groupby("time.year").mean().sel(
year=slice(2005, 2011)
).hvplot.line(
by="year", y="depth", flip_yaxis=True
) # .opts(legend_cols=1)
Compare#
h1 = (
cchdo.Jq.reset_coords(drop=True)
.resample(time="M")
.mean()
.hvplot.quadmesh(
cmap="greys",
flip_yaxis=True,
frame_width=1200,
frame_height=200,
clim=(40, -100),
)
)
h2 = (
mat.Jq.resample(time="M")
.mean()
.hvplot.quadmesh(
cmap="greys",
flip_yaxis=True,
frame_width=1200,
frame_height=200,
clim=(40, -100),
)
)
(h2.opts(title=".mat") + h1.opts(title="CCHDO")).cols(1)
h = (
(
np.abs(cchdo.Jq.resample(time="D").mean())
.reset_coords(drop=True)
.hvplot.line(by="depth", x="time")
.opts(frame_width=1200)
+ np.abs(mat.Jq.resample(time="D").mean())
.reset_coords(drop=True)
.hvplot.line(by="depth", x="time")
.opts(frame_width=1200)
)
.opts(shared_axes=True)
.cols(1)
)
h
def plot_monthly_clim(ds, **kwargs):
return np.abs(
ds.Jq.sel(time=slice("2005", "2011-02"))
.sel(depth=slice(20, 60))
.mean("depth")
.groupby("time.month")
.mean()
).hvplot.line(**kwargs)
(
plot_monthly_clim(mat, label=".mat")
* plot_monthly_clim(mat.where(np.abs(mat.Jq) < 20000), label=".mat, Jq < 20000")
* plot_monthly_clim(mat.where(np.abs(mat.Jq) < 10000), label=".mat, Jq < 10000")
* plot_monthly_clim(mat.where(np.abs(mat.Jq) < 3000), label=".mat, Jq < 3000")
* plot_monthly_clim(mat.where(mat.eps < 5e-4), label=".mat, ε < 5e-4")
* plot_monthly_clim(mat.where(mat.eps < 1e-5), label=".mat, ε < 1e-5")
* plot_monthly_clim(mat.where(mat.eps < 3e-6), label=".mat, ε < 3e-6")
* plot_monthly_clim(cchdo, label="CCHDO", color="k")
* (clim.netflux - clim.Ih)
.rename("a")
.hvplot.line(label="Jq0 - Ih", color="k", line_width=4)
).opts(show_grid=True, legend_position="right", frame_width=600, ylim=(0, 160))
Seasonal climatology, Vertical profile#
def plot_seasonal_clim(ds, **kwargs):
return (
np.abs(
ds.Jq.sel(time=slice("2005", "2011-02"))
.sel(depth=slice(20, 70))
# .mean("depth")
.groupby("time.season")
.mean()
.sel(season=["DJF", "MAM", "JJA", "SON"])
).hvplot.line(flip_yaxis=True, y="depth", col="season", **kwargs)
# .opts()
)
h = (
plot_seasonal_clim(mat, label=".mat")
* plot_seasonal_clim(mat.where(mat.eps < 1e-4), label=".mat, ε < 1e-4")
* plot_seasonal_clim(mat.where(mat.eps < 1e-5), label=".mat, ε < 1e-5")
* plot_seasonal_clim(mat.where(mat.eps < 3e-6), label=".mat, ε < 3e-6")
* plot_seasonal_clim(cchdo, label="CCHDO", color="k")
)
h.opts(plot_size=(270, 350), shared_xaxis=True, shared_yaxis=True, show_legend=True)
from cycler import cycler
with plt.rc_context({"axes.prop_cycle": cycler(color=["k", "r", "b", "g"])}):
(
(-1 * cchdo.Jq.where(cchdo.Jq > -1e3).squeeze())
.sel(time=slice("2005", "2012-02-01"))
.groupby("time.season")
.mean()
.sel(season=["DJF", "MAM", "JJA", "SON"])
.cf.plot(y="depth", hue="season")
)
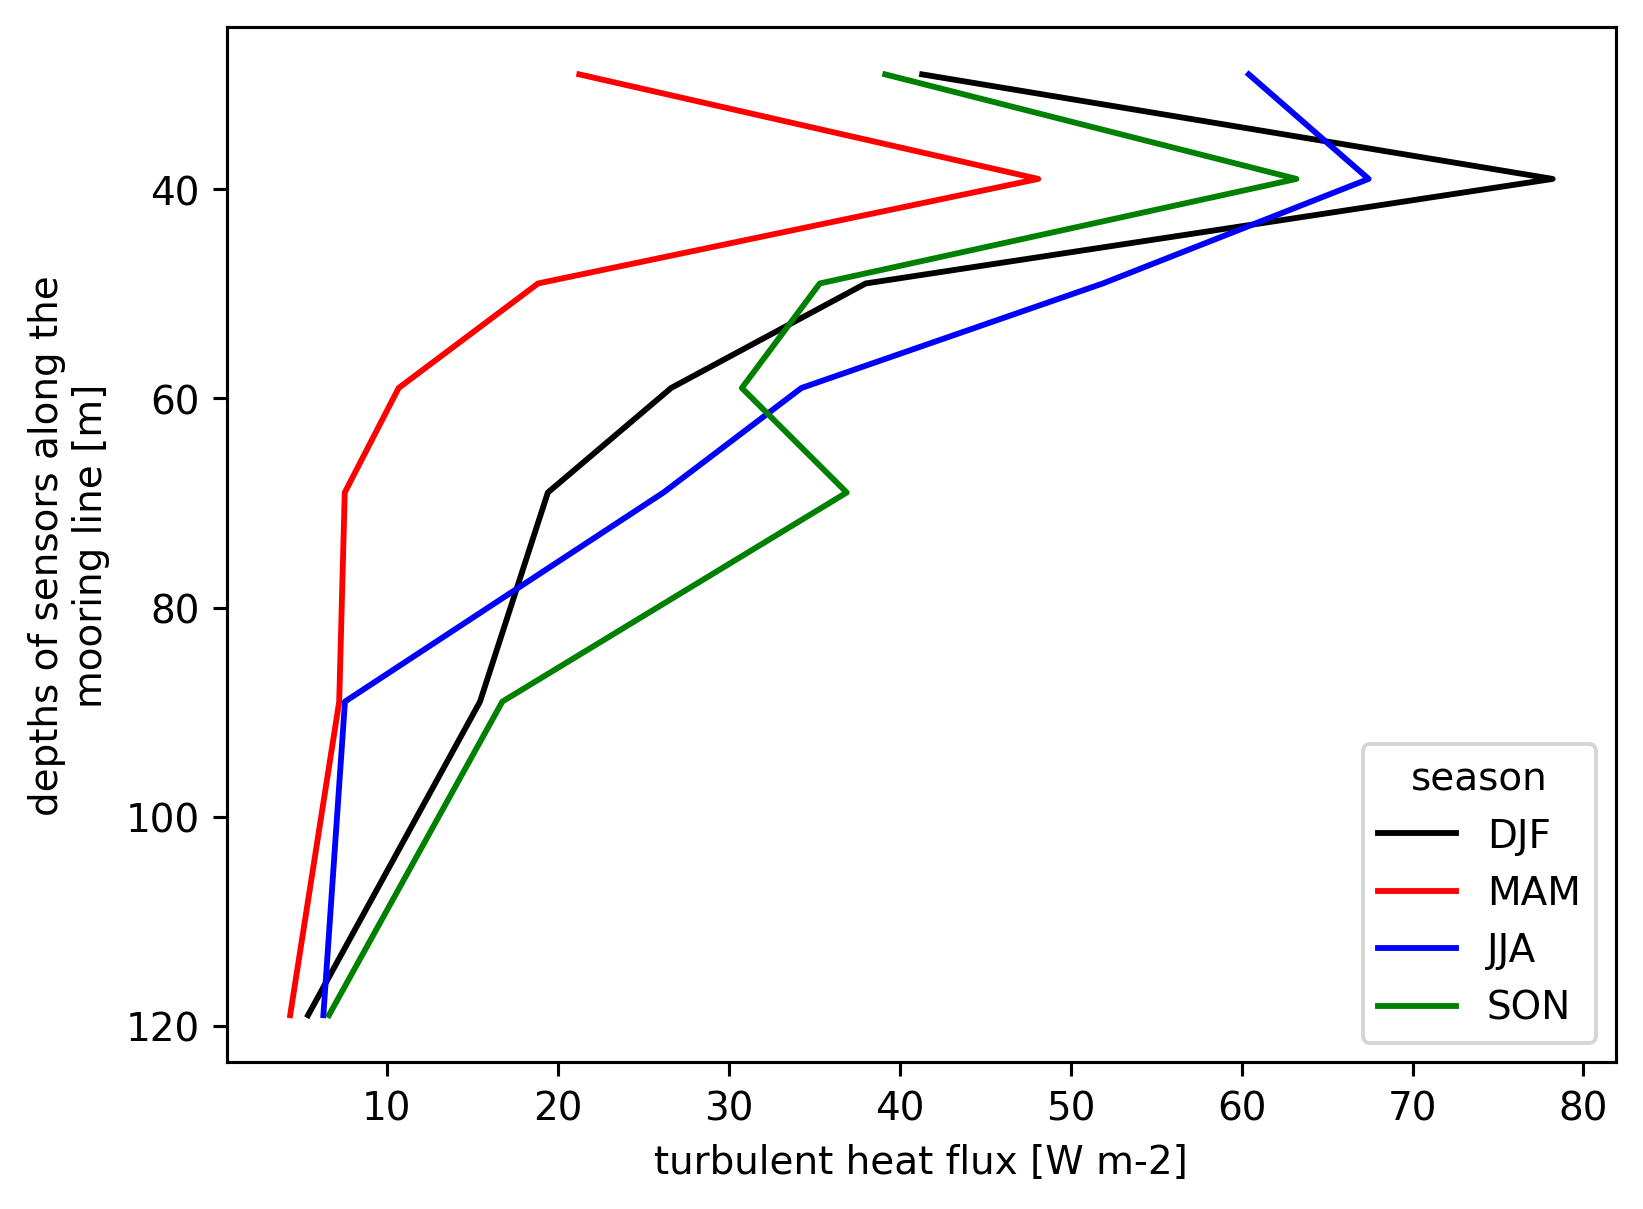
Labeling ENSO phase transitions#
pump.obs.process_oni().sel(time=slice("2005-Oct", "2016-Feb")).reset_coords(
drop=True
).plot.line(aspect=3, size=5, color="k")
pump.obs.make_enso_transition_mask().sel(
time=slice("2005-Oct", "2016-Feb")
).reset_coords(drop=True).plot.line(ax=plt.gca().twinx(), marker="x")
plt.grid(True, which="both", axis="both")
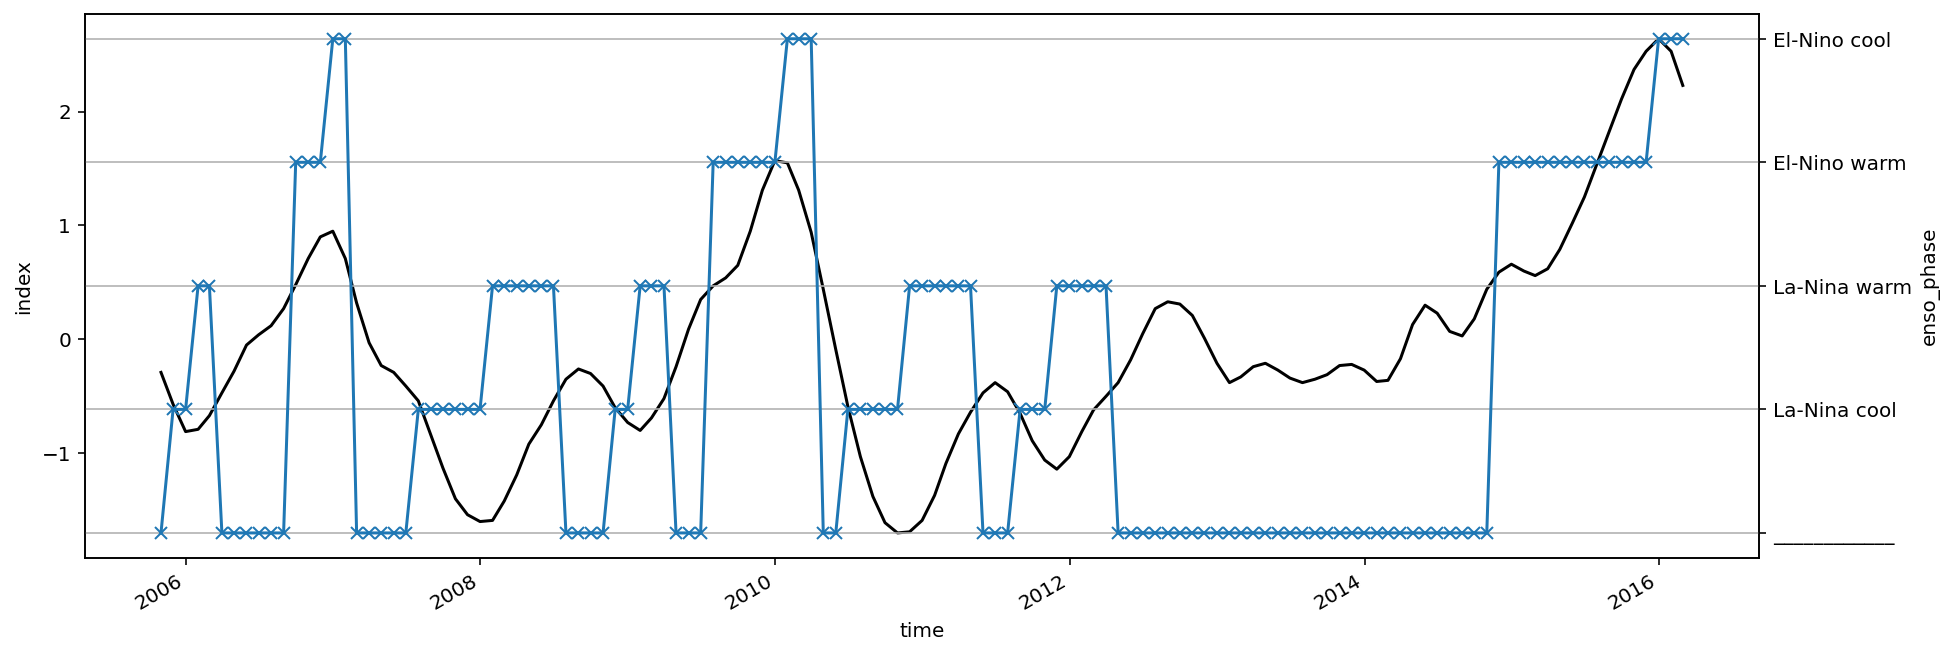
N2 vs N2T#
Lot more data with N2T
tao_gridded.N2.cf.plot()
<matplotlib.collections.QuadMesh>
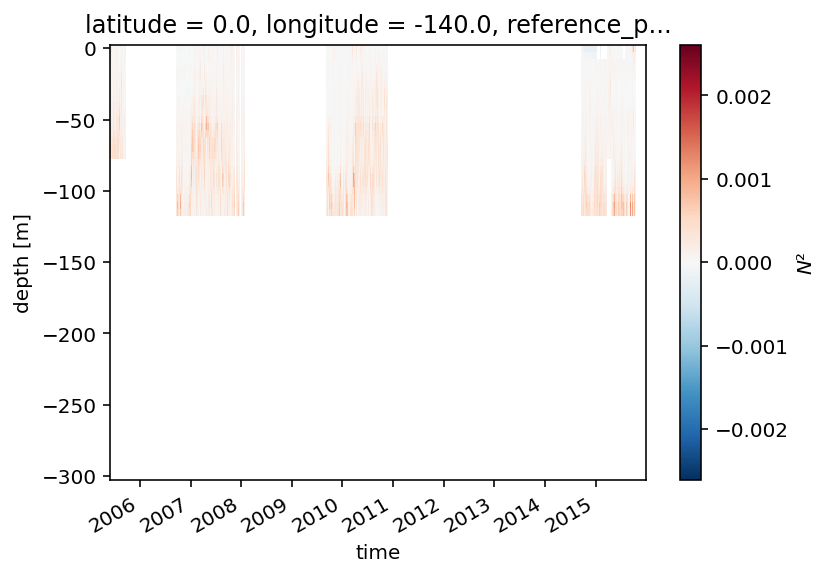
tao_gridded.N2T.cf.plot()
<matplotlib.collections.QuadMesh>
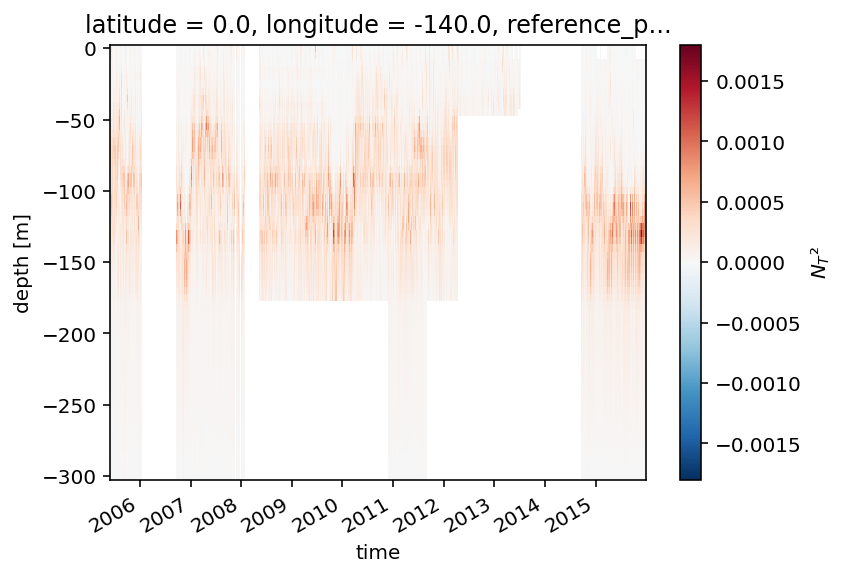
PDFs change#
fg = tao_gridded.n2s2pdf.sel(
enso_transition_phase=[
"La-Nina cool",
"La-Nina warm",
"El-Nino warm",
"El-Nino cool",
]
).plot(vmax=1, col="enso_transition_phase")
fg.set_titles("{value}")
fg.map(dcpy.plots.line45)
fg.axes[0, 0].set_xlim((-4.5, -2.5))
fg.axes[0, 0].set_ylim((-4.5, -2.5))
(-4.5, -2.5)
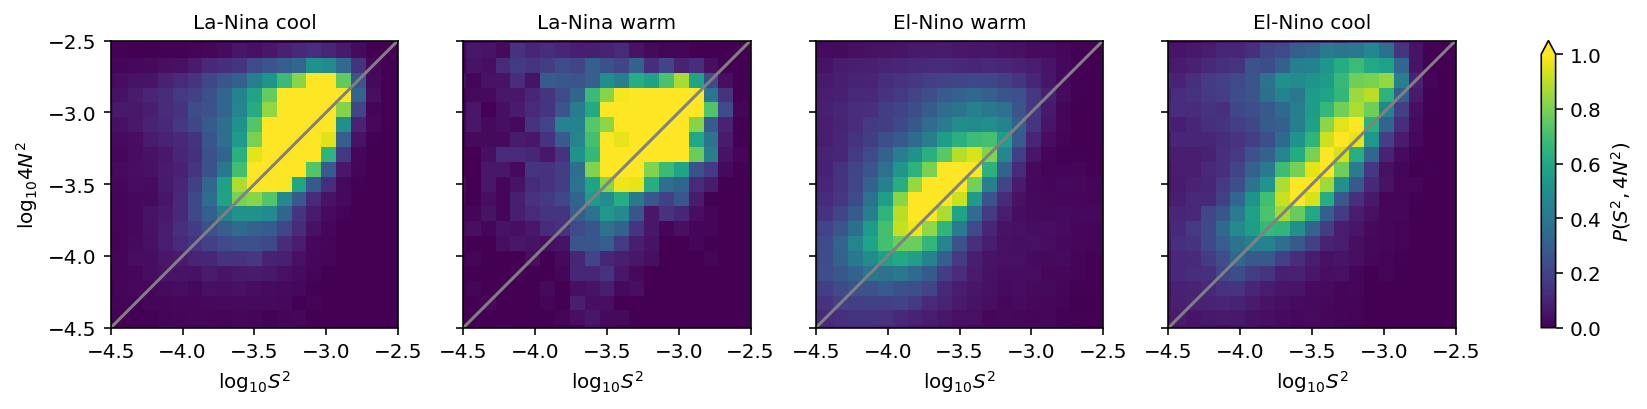
(
tao_gridded.n2s2pdf.sel(
enso_transition_phase=[
"La-Nina cool",
"La-Nina warm",
"El-Nino warm",
"El-Nino cool",
]
)
.sum("N2_bins")
.plot(hue="enso_transition_phase")
)
plt.figure()
(
tao_gridded.n2s2pdf.sel(
enso_transition_phase=[
"La-Nina cool",
"La-Nina warm",
"El-Nino warm",
"El-Nino cool",
]
)
.sum("S2_bins")
.plot(hue="enso_transition_phase")
)
[<matplotlib.lines.Line2D>,
<matplotlib.lines.Line2D>,
<matplotlib.lines.Line2D>,
<matplotlib.lines.Line2D>]
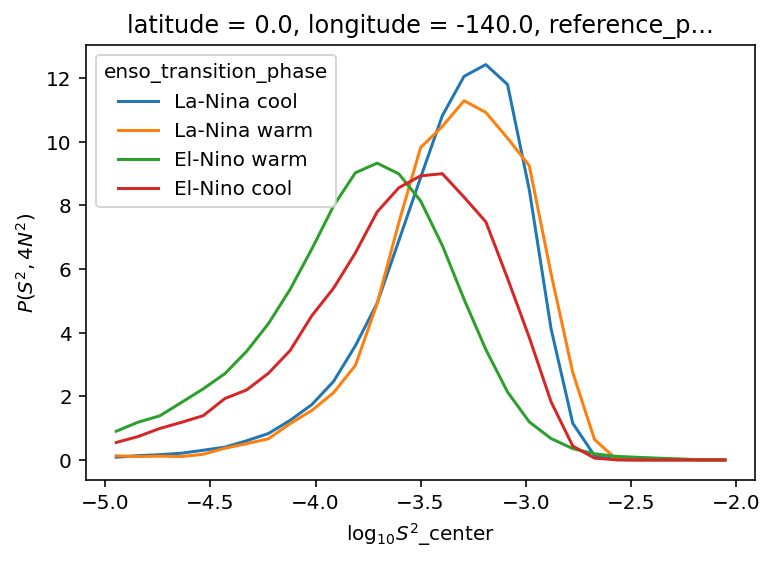
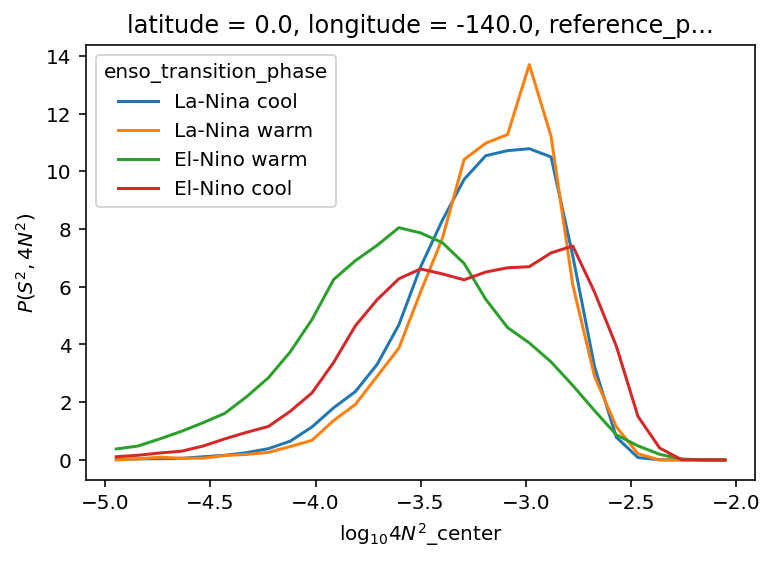
fg = tao_gridded.n2s2Tpdf.sel(
enso_transition_phase=[
"La-Nina cool",
"La-Nina warm",
"El-Nino warm",
"El-Nino cool",
]
).plot(vmax=1, col="enso_transition_phase")
fg.set_titles("{value}")
fg.map(dcpy.plots.line45)
fg.axes[0, 0].set_xlim((-4.5, -2.5))
fg.axes[0, 0].set_ylim((-4.5, -2.5))
(-4.5, -2.5)
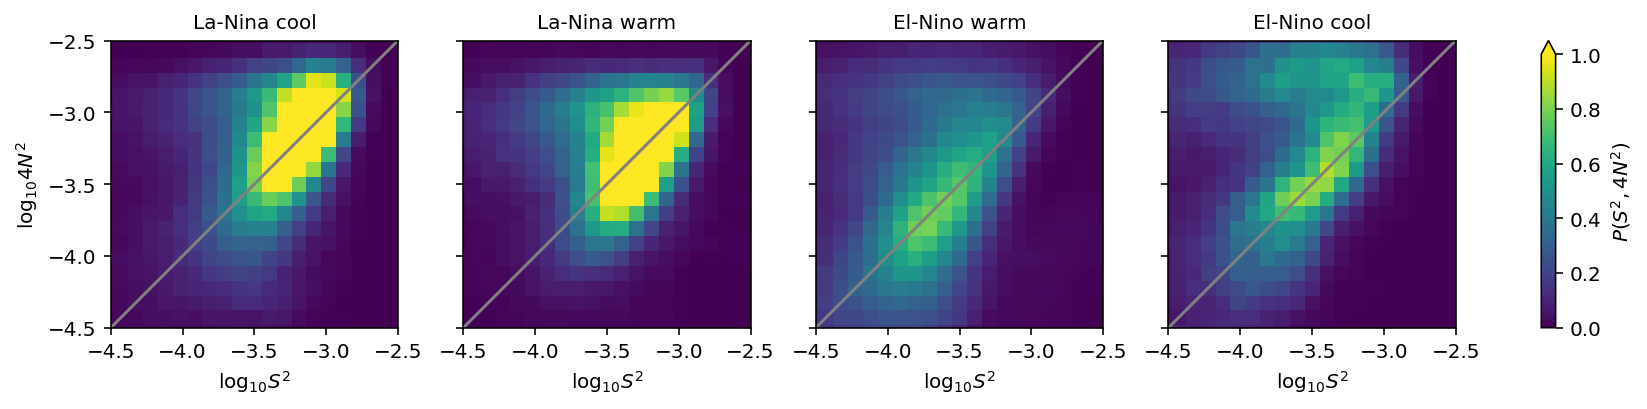
(
tao_gridded.n2s2Tpdf.sel(
enso_transition_phase=[
"La-Nina cool",
"La-Nina warm",
"El-Nino warm",
"El-Nino cool",
]
)
.sum("N2_bins")
.plot(hue="enso_transition_phase")
)
plt.figure()
(
tao_gridded.n2s2Tpdf.sel(
enso_transition_phase=[
"La-Nina cool",
"La-Nina warm",
"El-Nino warm",
"El-Nino cool",
]
)
.sum("S2_bins")
.plot(hue="enso_transition_phase")
)
[<matplotlib.lines.Line2D>,
<matplotlib.lines.Line2D>,
<matplotlib.lines.Line2D>,
<matplotlib.lines.Line2D>]