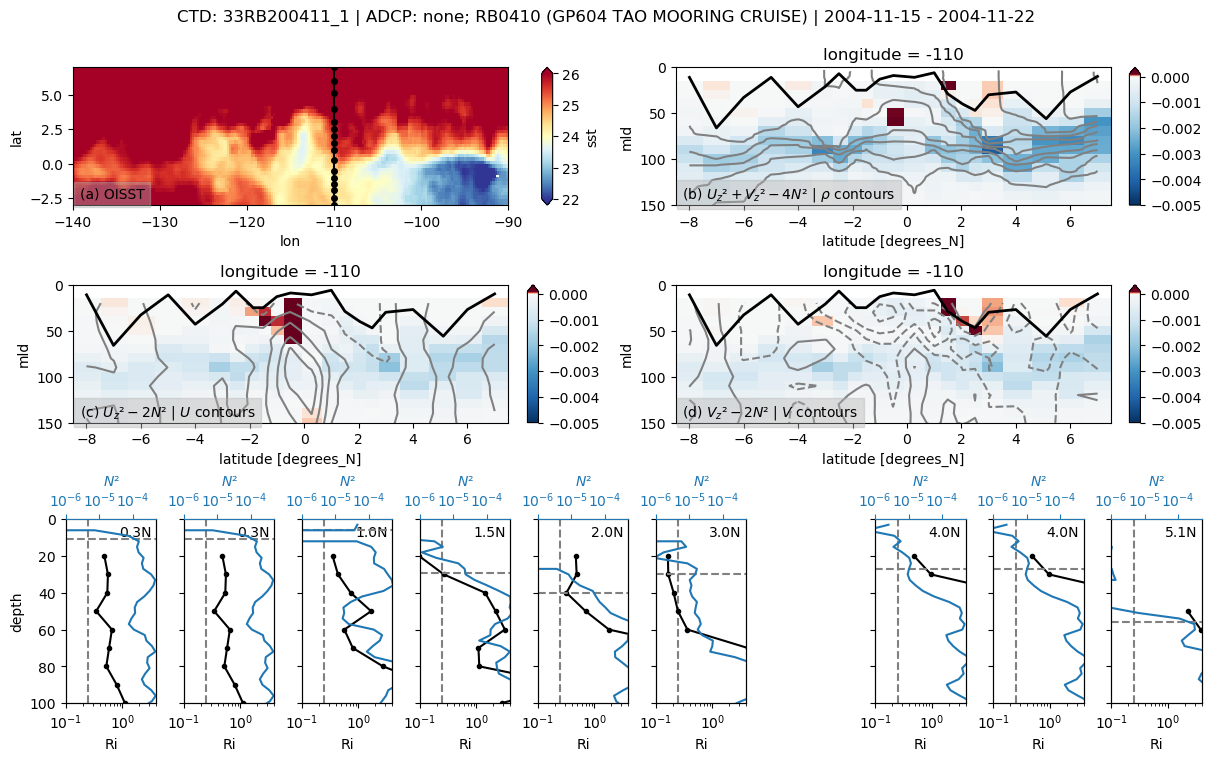
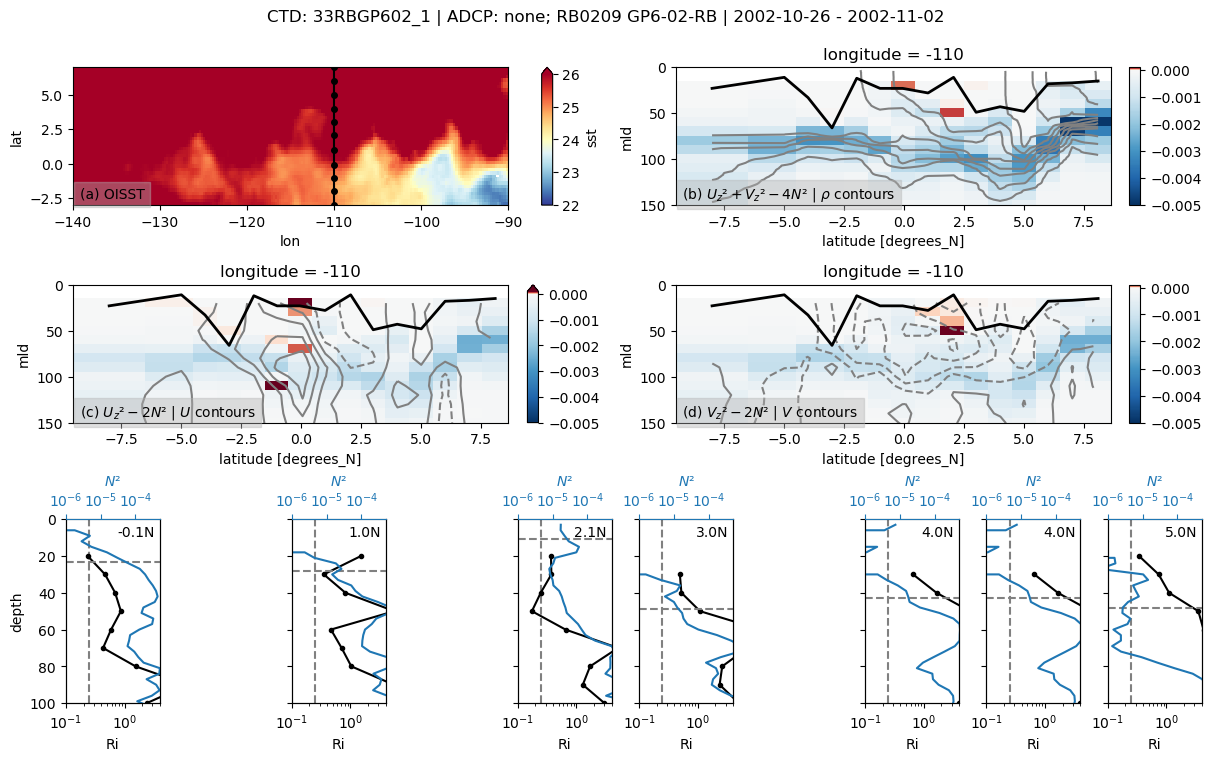
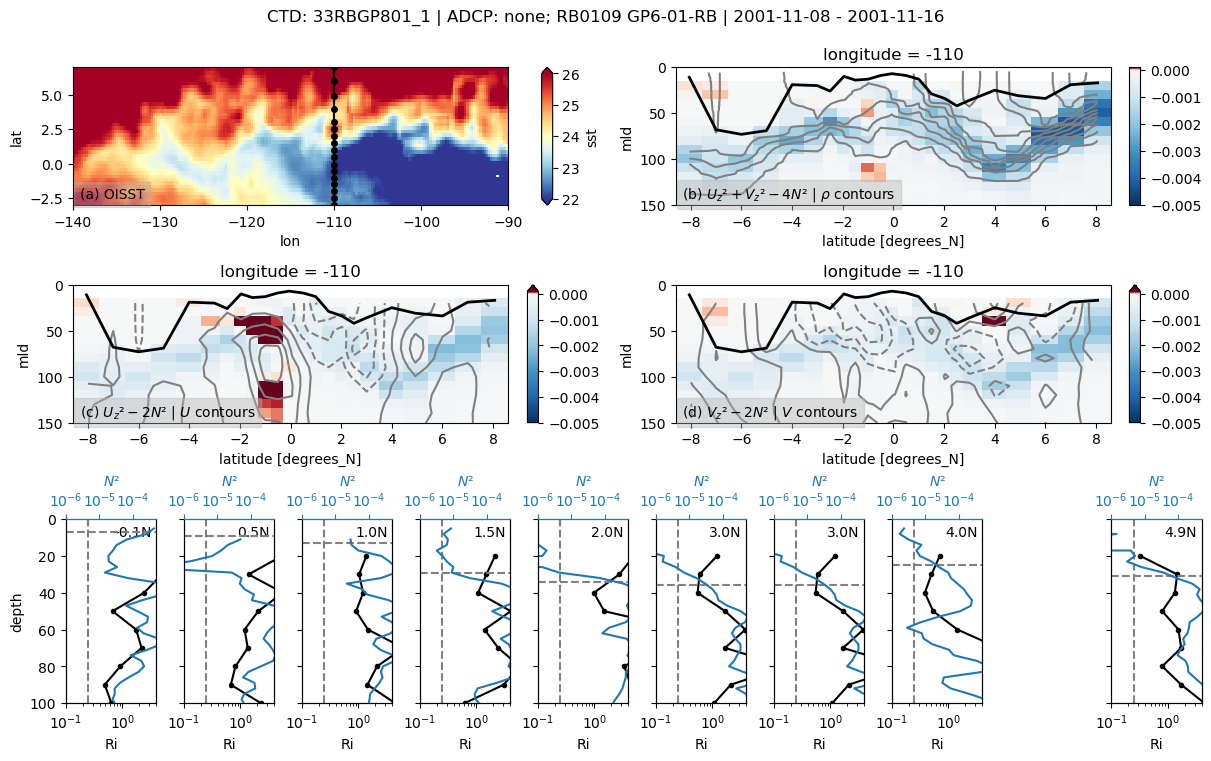
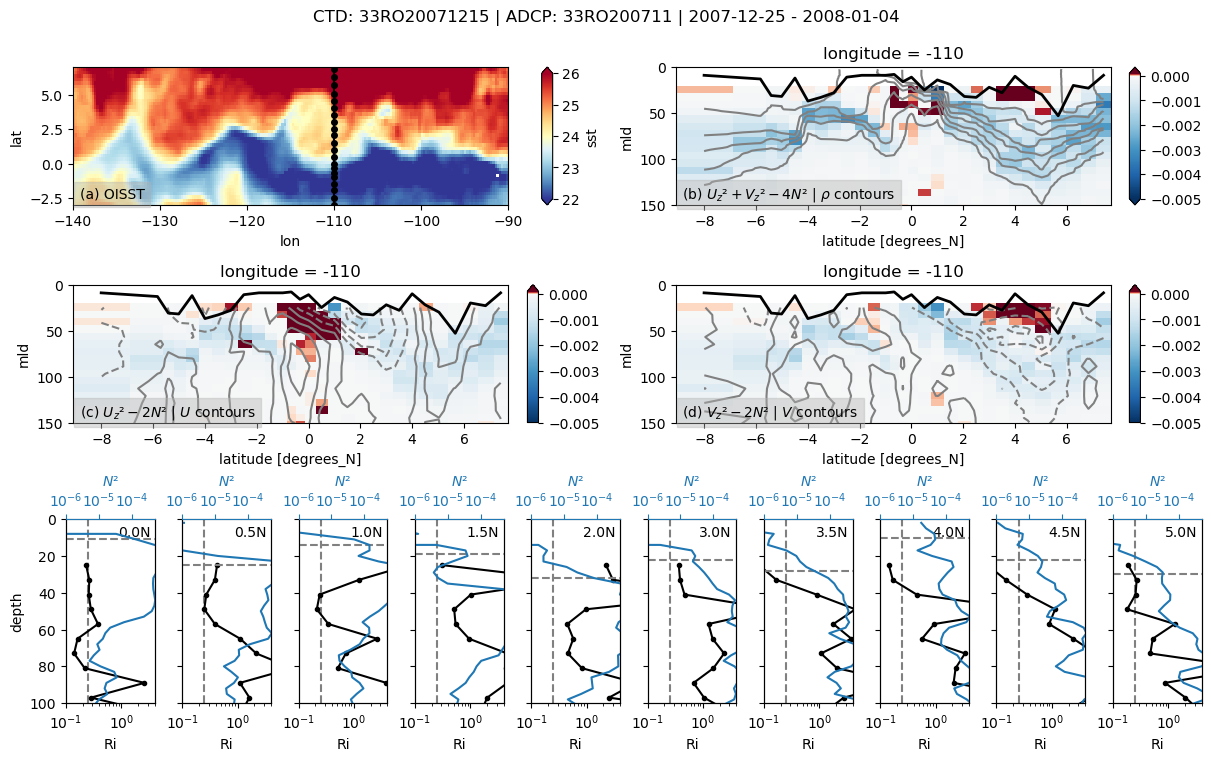
TIW Cruise Sections#
TODO#
CTD at 1m resolution
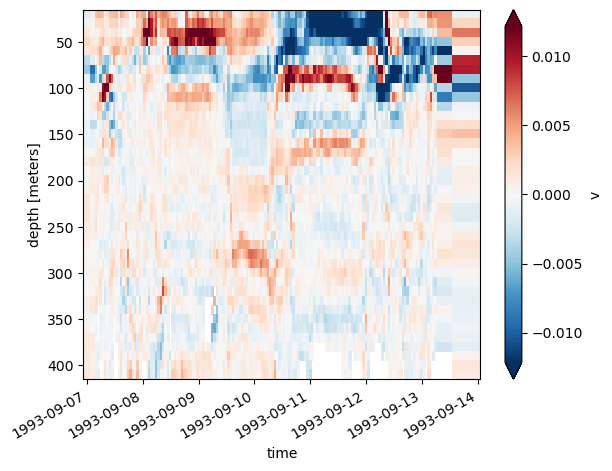
ADCP in 8m/10m bins
Need to figure the times when the CTD was taken
Detect MLD from 1m density profile and mask that out
plot profiles next to SST
make sure I’m using the right ADCP profile or average while the ship was stationary
Use PCHIP derivative?
download MUR snapshots
get high res data
do reduced shear? works nicely with proper norm
Improvements:
-110W assumption in cruise reading file
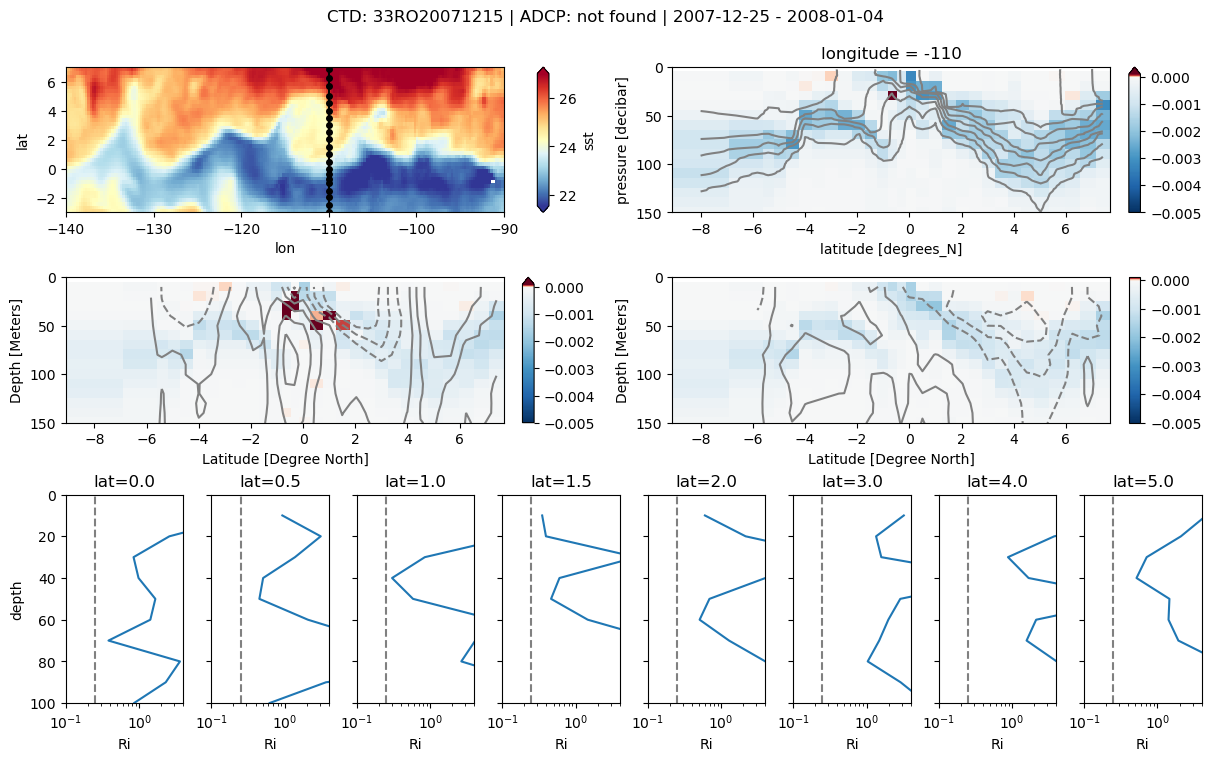
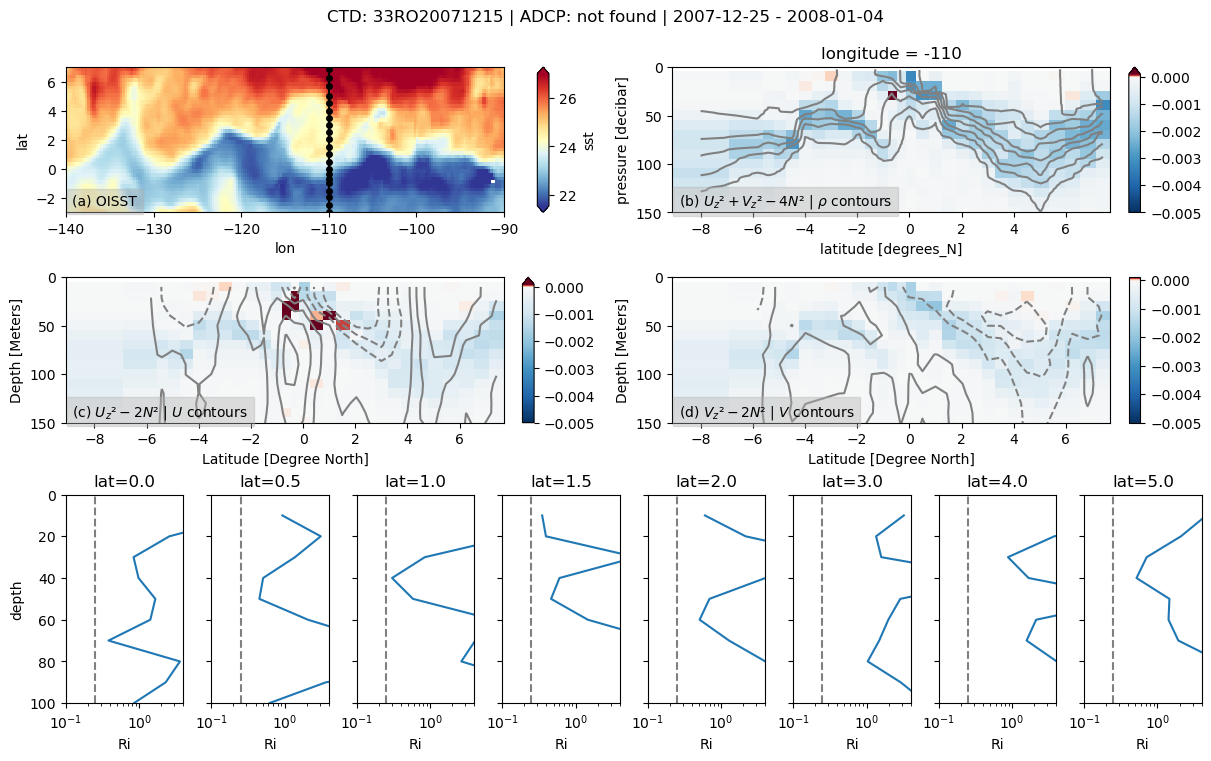
Look at CCHDO CTD sections and plot over OISST to see if some of these sections can be used to estimate Ri during a TIW in 2N-5N range
import pump
import dcpy
import glob
import matplotlib as mpl
import matplotlib.pyplot as plt
import numpy as np
import os
import pandas as pd
import tqdm
import xarray as xr
import distributed

client = distributed.Client()
client.cluster
Read all data#
%ls ../datasets/ctd
0_pr16_n_nc_ctd/       21_pr16_q_nc_ctd/         33_pr16_cc_nc_ctd/
10_pr16_ee_nc_ctd/     22_pr16_2003a_nc_ctd/     34_pr16_2005a_nc_ctd/
11_pr16_s_nc_ctd/      23_pr16_w_nc_ctd/         35_pr16_y_nc_ctd/
12_pr16_a_nc_ctd/      24_pr16_20060330_nc_ctd/  3_pr16_ff_nc_ctd/
13_pr16_2004b_nc_ctd/  25_pr16_l_nc_ctd/         4_pr16_aa_nc_ctd/
14_pr16_b_nc_ctd/      26_pr16_o_nc_ctd/         5_pr16_m_nc_ctd/
15_pr16_k_nc_ctd/      27_pr16_u_nc_ctd/         6_pr16_2004a_nc_ctd/
16_pr16_dd_nc_ctd/     28_pr16_h_nc_ctd/         7_pr16_2003b_nc_ctd/
17_pr16_p_nc_ctd/      29_pr16_c_nc_ctd/         8_pr16_g_nc_ctd/
18_pr16_e_nc_ctd/      2_pr16_v_nc_ctd/          9_pr16_z_nc_ctd/
19_pr16_r_nc_ctd/      30_pr15_2005b_nc_ctd/     p18_33RO20071215_ctd/
1_pr16_0a_nc_ctd/      31_pr16_t_nc_ctd/         p18_33RO20161119_ctd/
20_pr16_bb_nc_ctd/     32_pr16_f_nc_ctd/         zips/
import glob

dirname = "../datasets/ctd/*ctd"
cruises = pump.sections.read_cruise_folders(dirname)

oisst = xr.open_mfdataset(
    "../glade/obs/oisst/*.nc", combine="nested", concat_dim="time", parallel=True
)
oisst = (
    oisst.assign(lon=oisst.lon - 360).sel(lat=slice(-8, 8), lon=slice(-155, -90)).sst
)

adcp_files = sorted(glob.glob("../datasets/adcp/*.nc"))
adcp_files
100%|██████████| 38/38 [01:24<00:00, 2.24s/it]
CTD#
MLD computation#
cruises[0].density.load()
<xarray.DataArray 'density' (latitude: 13, pressure: 2008)>
array([[          nan, 1021.61466996, 1021.61580471, ..., 1027.67752305,
        1027.67758485, 1027.67800753],
       [          nan, 1021.48973679, 1021.49817825, ...,           nan,
                  nan,           nan],
       [          nan, 1021.77406458, 1021.774826  , ...,           nan,
                  nan,           nan],
       ...,
       [          nan,           nan, 1022.28975995, ...,           nan,
                  nan,           nan],
       [1022.22953715, 1022.22816024, 1022.22996723, ...,           nan,
                  nan,           nan],
       [          nan, 1022.39740448, 1022.39668462, ...,           nan,
                  nan,           nan]])
Coordinates:
    longitude  int64 -110
  * pressure   (pressure) float64 3.0 4.0 5.0 ... 2.008e+03 2.009e+03 2.01e+03
    time       (latitude) datetime64[ns] 1991-04-03T12:48:00 ... 1991-04-08T03:48:00
  * latitude   (latitude) float64 4.966 5.041 4.007 ... -2.997 -3.994 -4.953
rho = cruises[0].density
drho = rho - rho.bfill("pressure").isel(pressure=0)
mld = xr.where(drho > 0.015, drho.pressure, np.nan).min("pressure")
drho.sortby("latitude").plot(x="latitude", ylim=(100, 0))
mld.plot(x="latitude")
[<matplotlib.lines.Line2D at 0x2adf759cf950>]
%matplotlib inline
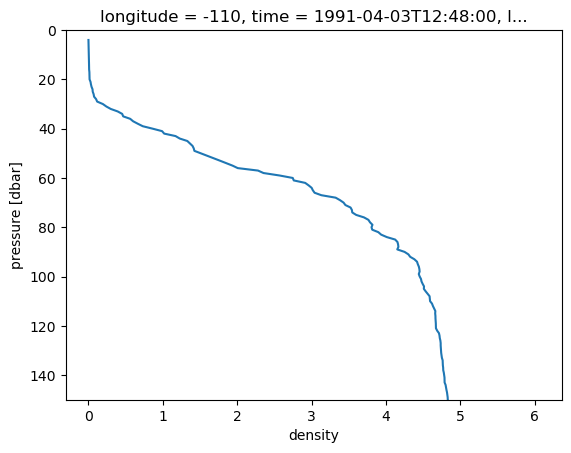
drho.isel(latitude=0).plot(ylim=(150, 0), y="pressure", yincrease=False)
[<matplotlib.lines.Line2D at 0x2adf746febd0>]
ADCP#
ctd = pump.sections.find_cruise(cruises, "31DSEP393")
# ctd["latitude"] = np.round(ctd.latitude, 1)
ctd
Found 31DSEP393 at index 24.
- latitude: 22
- pressure: 1008
- longitude()int64-110
array(-110)
- pressure(pressure)float643.0 4.0 5.0 ... 1.009e+03 1.01e+03
- long_name :
- pressure
- units :
- dbar
- positive :
- down
- data_min :
- 5.0
- data_max :
- 1004.0
- C_format :
- %8.1f
- WHPO_Variable_Name :
- CTDPRS
- OBS_QC_VARIABLE :
- pressure_QC
array([ 3., 4., 5., ..., 1008., 1009., 1010.])
- time(latitude)datetime64[ns]1993-09-07T01:31:00 ... 1993-09-14T10:09:00
- long_name :
- time
- C_format :
- %10d
array(['1993-09-07T01:31:00.000000000', '1993-09-07T07:18:00.000000000', '1993-09-07T12:51:00.000000000', '1993-09-07T18:11:00.000000000', '1993-09-08T00:55:00.000000000', '1993-09-08T06:15:00.000000000', '1993-09-09T02:40:00.000000000', '1993-09-09T08:29:00.000000000', '1993-09-10T03:27:00.000000000', '1993-09-10T06:49:00.000000000', '1993-09-10T10:06:00.000000000', '1993-09-10T13:28:00.000000000', '1993-09-11T06:35:00.000000000', '1993-09-12T01:14:00.000000000', '1993-09-12T05:41:00.000000000', '1993-09-12T10:41:00.000000000', '1993-09-12T20:58:00.000000000', '1993-09-13T01:55:00.000000000', '1993-09-13T07:05:00.000000000', '1993-09-14T00:13:00.000000000', '1993-09-14T05:08:00.000000000', '1993-09-14T10:09:00.000000000'], dtype='datetime64[ns]') - latitude(latitude)float64-8.007 -7.0 -6.0 ... 8.998 10.01
- long_name :
- latitude
- units :
- degrees_N
- data_min :
- -8.0067
- data_max :
- -8.0067
- C_format :
- %9.4f
array([-8.0067, -7.    , -6.    , -5.    , -4.0083, -2.99  , -2.0117, -0.9917,
       -0.    ,  0.4983,  0.9967,  1.5033,  1.9983,  3.0083,  4.0033,  5.005 ,
        6.0017,  7.0033,  8.0033,  8.0317,  8.9983, 10.005 ])
- pressure_QC(latitude, pressure)float64dask.array<chunksize=(1, 1008), meta=np.ndarray>
- long_name :
- pressure_QC_flag
- units :
- woce_flags
- C_format :
- %1d
Array Chunk Bytes 177.41 kB 8.06 kB Shape (22, 1008) (1, 1008) Count 228 Tasks 22 Chunks Type float64 numpy.ndarray - temperature(latitude, pressure)float64dask.array<chunksize=(1, 1008), meta=np.ndarray>
- long_name :
- temperature
- units :
- its-90
- data_min :
- 4.4159
- data_max :
- 25.1227
- C_format :
- %8.4f
- WHPO_Variable_Name :
- CTDTMP
- OBS_QC_VARIABLE :
- temperature_QC
Array Chunk Bytes 177.41 kB 8.06 kB Shape (22, 1008) (1, 1008) Count 206 Tasks 22 Chunks Type float64 numpy.ndarray - temperature_QC(latitude, pressure)float64dask.array<chunksize=(1, 1008), meta=np.ndarray>
- long_name :
- temperature_QC_flag
- units :
- woce_flags
- C_format :
- %1d
Array Chunk Bytes 177.41 kB 8.06 kB Shape (22, 1008) (1, 1008) Count 228 Tasks 22 Chunks Type float64 numpy.ndarray - salinity(latitude, pressure)float64dask.array<chunksize=(1, 1008), meta=np.ndarray>
- long_name :
- ctd salinity
- units :
- pss-78
- data_min :
- 34.5211
- data_max :
- 35.6562
- C_format :
- %8.4f
- WHPO_Variable_Name :
- CTDSAL
- OBS_QC_VARIABLE :
- salinity_QC
Array Chunk Bytes 177.41 kB 8.06 kB Shape (22, 1008) (1, 1008) Count 206 Tasks 22 Chunks Type float64 numpy.ndarray - salinity_QC(latitude, pressure)float64dask.array<chunksize=(1, 1008), meta=np.ndarray>
- long_name :
- ctd salinity_QC_flag
- units :
- woce_flags
- C_format :
- %1d
Array Chunk Bytes 177.41 kB 8.06 kB Shape (22, 1008) (1, 1008) Count 228 Tasks 22 Chunks Type float64 numpy.ndarray - oxygen(latitude, pressure)float64dask.array<chunksize=(1, 1008), meta=np.ndarray>
- long_name :
- ctd oxygen
- units :
- umol/kg
- data_min :
- -999.0
- data_max :
- 0.0
- C_format :
- %8.1f
- WHPO_Variable_Name :
- CTDOXY
- OBS_QC_VARIABLE :
- oxygen_QC
Array Chunk Bytes 177.41 kB 8.06 kB Shape (22, 1008) (1, 1008) Count 206 Tasks 22 Chunks Type float64 numpy.ndarray - oxygen_QC(latitude, pressure)float64dask.array<chunksize=(1, 1008), meta=np.ndarray>
- long_name :
- ctd oxygen_QC_flag
- units :
- woce_flags
- C_format :
- %1d
Array Chunk Bytes 177.41 kB 8.06 kB Shape (22, 1008) (1, 1008) Count 228 Tasks 22 Chunks Type float64 numpy.ndarray - woce_date(latitude)int64dask.array<chunksize=(1,), meta=np.ndarray>
- long_name :
- WOCE date
- units :
- yyyymmdd UTC
- data_min :
- 19930908.0
- data_max :
- 19930908.0
- C_format :
- %8d
Array Chunk Bytes 176 B 8 B Shape (22,) (1,) Count 110 Tasks 22 Chunks Type int64 numpy.ndarray - woce_time(latitude)int64dask.array<chunksize=(1,), meta=np.ndarray>
- long_name :
- WOCE time
- units :
- hhmm UTC
- data_min :
- 231.0
- data_max :
- 231.0
- C_format :
- %4d
Array Chunk Bytes 176 B 8 B Shape (22,) (1,) Count 110 Tasks 22 Chunks Type int64 numpy.ndarray - station(latitude)|S40b'20' b'21' b'22' ... b'40' b'41'
- long_name :
- STATION
- units :
- unspecified
- C_format :
- %s
array([b'20', b'21', b'22', b'23', b'24', b'25', b'26', b'27', b'28', b'29', b'30', b'31', b'32', b'33', b'34', b'35', b'36', b'37', b'38', b'39', b'40', b'41'], dtype='|S40') - cast(latitude)|S40b'1' b'1' b'1' ... b'1' b'1' b'1'
- long_name :
- CAST
- units :
- unspecified
- C_format :
- %s
array([b'1', b'1', b'1', b'1', b'1', b'1', b'1', b'1', b'1', b'1', b'1', b'1', b'1', b'1', b'1', b'1', b'1', b'1', b'1', b'1', b'1', b'1'], dtype='|S40') - density(latitude, pressure)float64dask.array<chunksize=(1, 1008), meta=np.ndarray>
Array Chunk Bytes 177.41 kB 8.06 kB Shape (22, 1008) (1, 1008) Count 5622 Tasks 22 Chunks Type float64 numpy.ndarray - mld(latitude)float64dask.array<chunksize=(1,), meta=np.ndarray>
Array Chunk Bytes 176 B 8 B Shape (22,) (1,) Count 5821 Tasks 22 Chunks Type float64 numpy.ndarray
- EXPOCODE :
- 31DSEP393_1
- Conventions :
- COARDS/WOCE
- WOCE_VERSION :
- 3.0
- WOCE_ID :
- PR16
- DATA_TYPE :
- WOCE CTD
- STATION_NUMBER :
- 20
- CAST_NUMBER :
- 1
- BOTTOM_DEPTH_METERS :
- 0
- Creation_Time :
- Diggs Code Version 1.2: Mon Aug 26 19:47:34 2002 GMT
- ORIGINAL_HEADER :
- :CTD,20020826WHPOSIOHLB:#Software Version: CTD_Exchange_Encode_v1.0g (Diggs):#SUMFILE_NAME: pr16_hsu.txt:#SUMFILE_MOD_DATE: Mon Aug 26 12:45:46 2002:#CTDFILE_NAME: EP393W20.WCT:#CTDFILE_MOD_DATE: Mon Aug 26 12:43:21 2002:#DEPTH_TYPE : UNC:#EVENT_CODE : BO:
- WOCE_CTD_FLAG_DESCRIPTION :
- ::1=Not calibrated:2=Acceptable measurement:3=Questionable measurement:4=Bad measurement:5=Not reported:6=Interpolated over >2 dbar interval:7=Despiked:8=Not assigned for CTD data:9=Not sampled::
processing#
adcp = pump.sections.read_adcp(
    "../datasets/adcp/31DSEP393_1_00210_short.nc", -110, debug=True
)
ctd = pump.sections.find_cruise(cruises, "31DSEP393")
# ctd["density"] = dcpy.eos.pden(ctd.salinity, ctd.temperature, ctd.pressure)
ctd, adcp = pump.sections.trim_ctd_adcp(ctd, adcp)
binned = pump.sections.grid_ctd_adcp(ctd, adcp)
# ctd["latitude"] = np.round(ctd.latitude, 1)
Found 31DSEP393 at index 24.
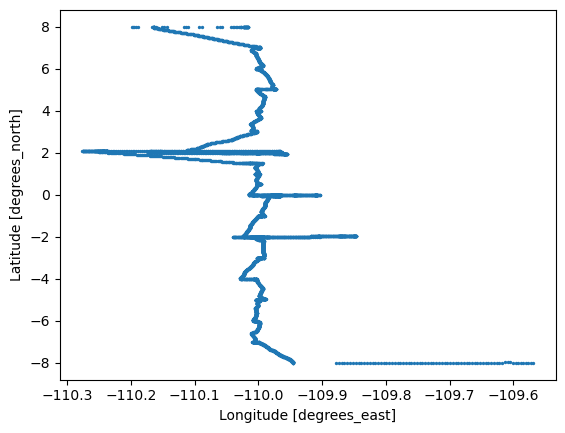
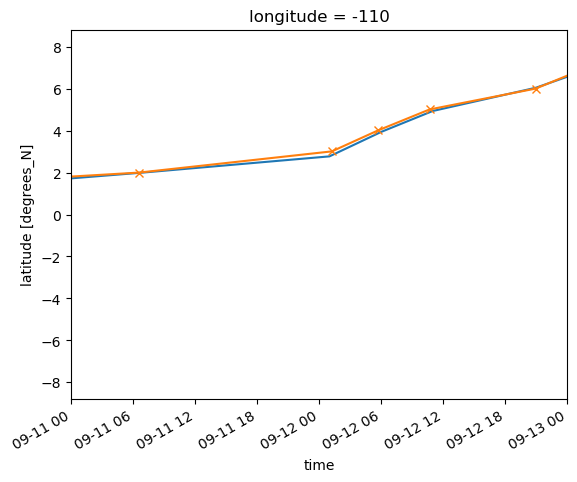
adcp.latitude.plot(x="time")
ctd.latitude.plot(x="time", marker="x", xlim=("1993-09-11", "1993-09-13"))
[<matplotlib.lines.Line2D at 0x2b723305b3d0>]
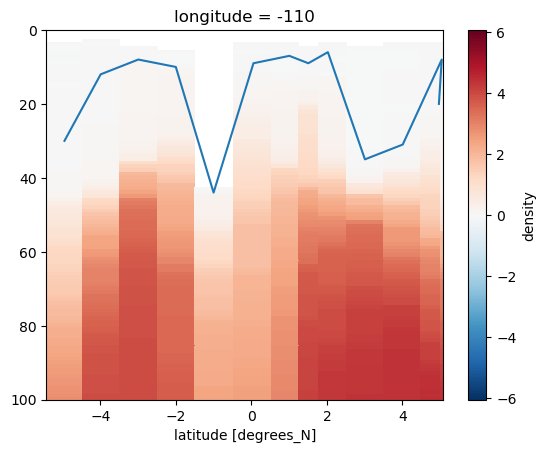
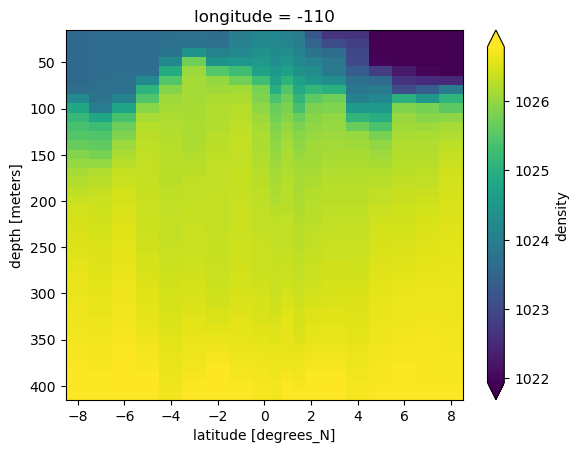
binned.density.plot(y="depth", yincrease=False, robust=True)
<matplotlib.collections.QuadMesh at 0x2b72330611d0>
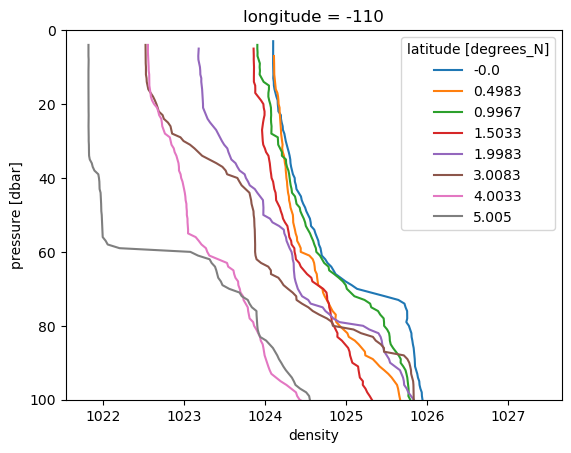
ctd.density.sel(latitude=slice(0, 6)).plot(hue="latitude", y="pressure", ylim=(100, 0))
[<matplotlib.lines.Line2D at 0x2b7235ca3dd0>,
 <matplotlib.lines.Line2D at 0x2b7235ca3790>,
 <matplotlib.lines.Line2D at 0x2b7235ca3f50>,
 <matplotlib.lines.Line2D at 0x2b7235ca3190>,
 <matplotlib.lines.Line2D at 0x2b7235ca3650>,
 <matplotlib.lines.Line2D at 0x2b7235ca3210>,
 <matplotlib.lines.Line2D at 0x2b7235ca3c90>,
 <matplotlib.lines.Line2D at 0x2b72356c26d0>]
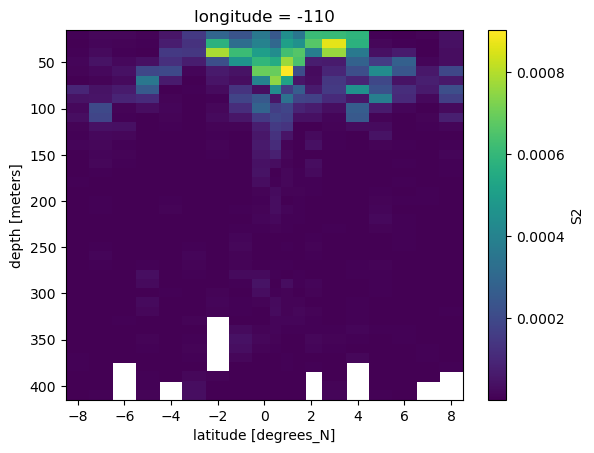
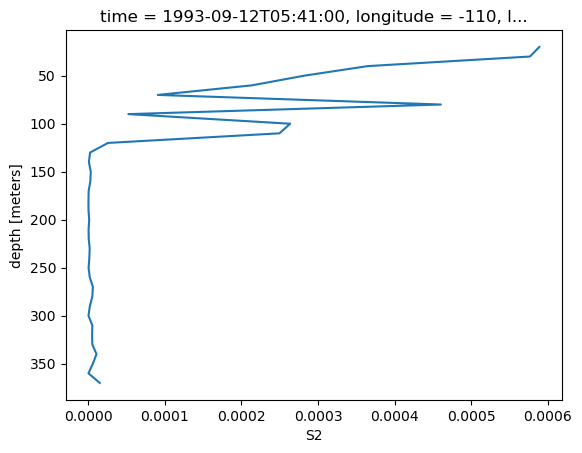
binned.S2.plot(x="latitude", yincrease=False)
<matplotlib.collections.QuadMesh at 0x2b7235740c10>
binned.S2.sel(latitude=4, method="nearest").plot(y="depth", yincrease=False)
[<matplotlib.lines.Line2D at 0x2b7235cd8450>]
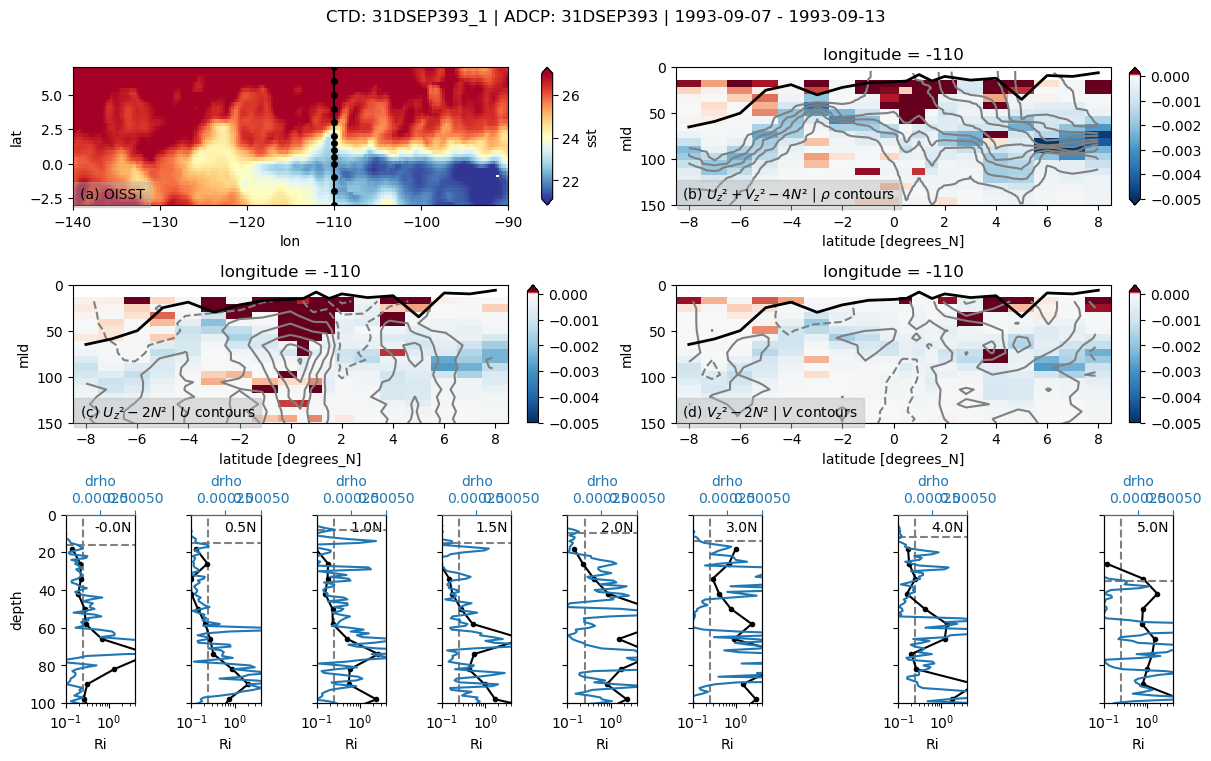
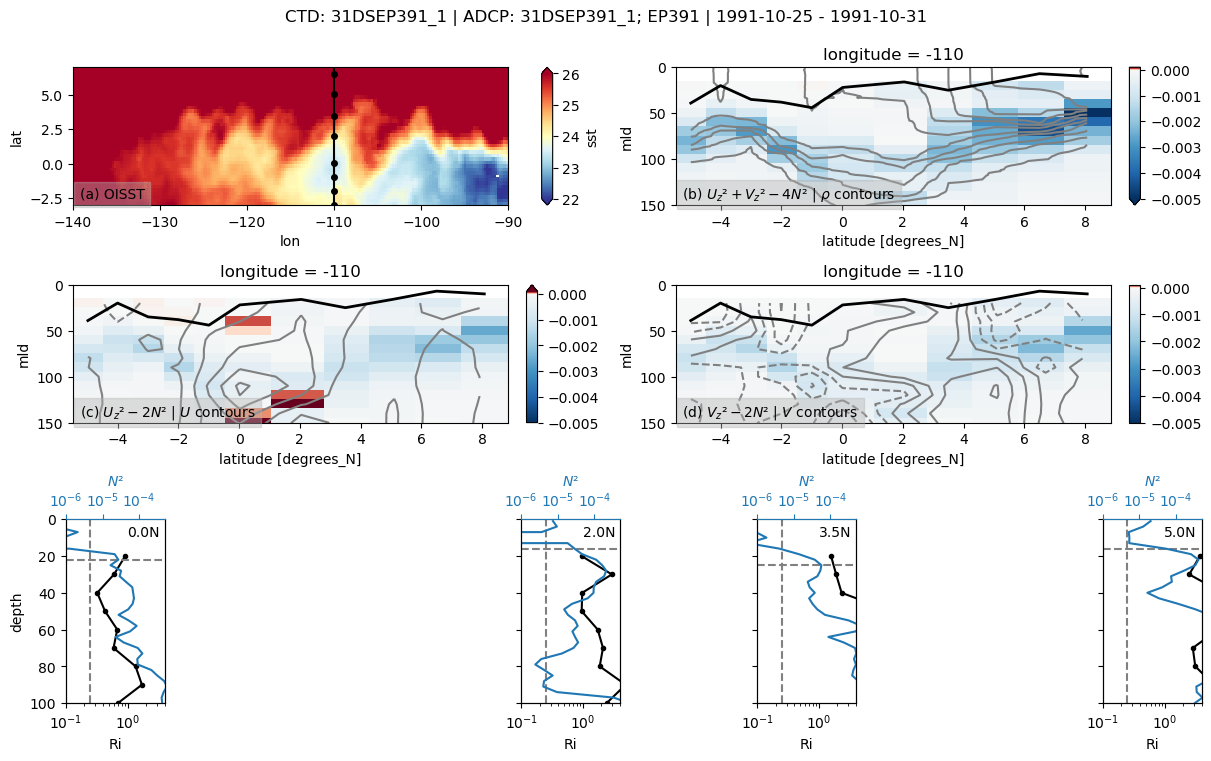
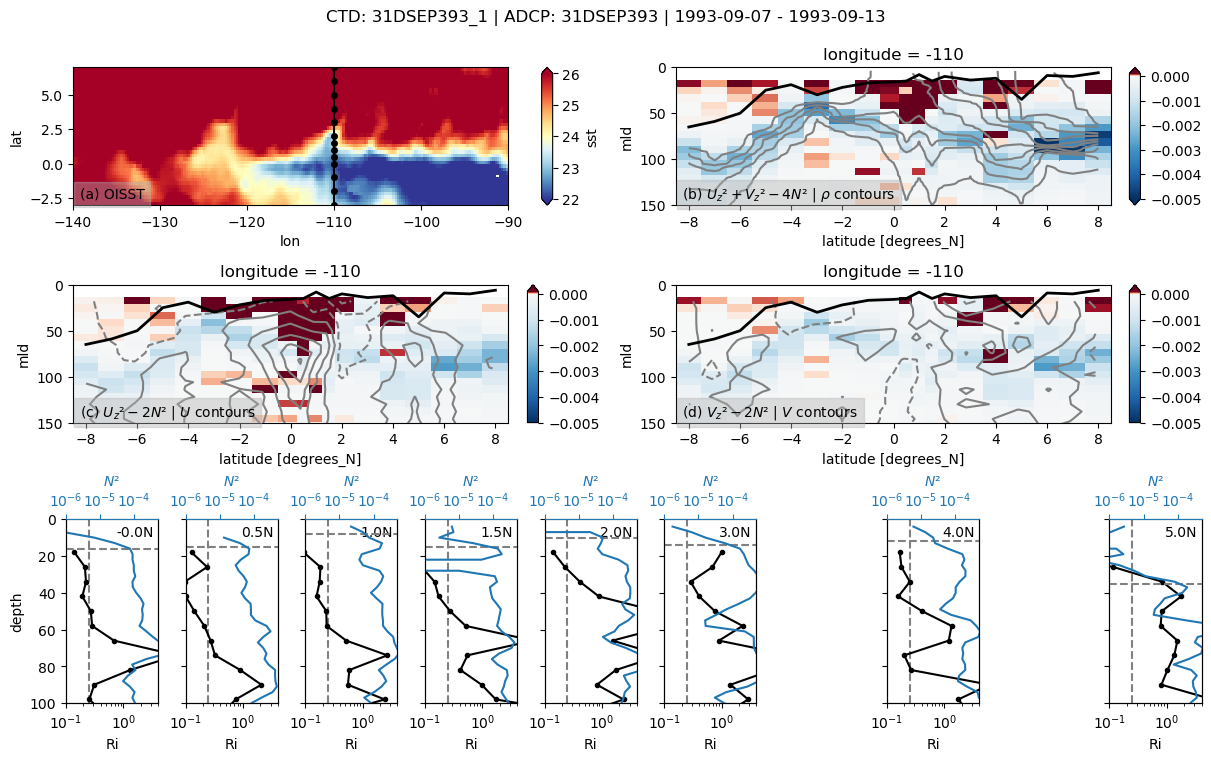
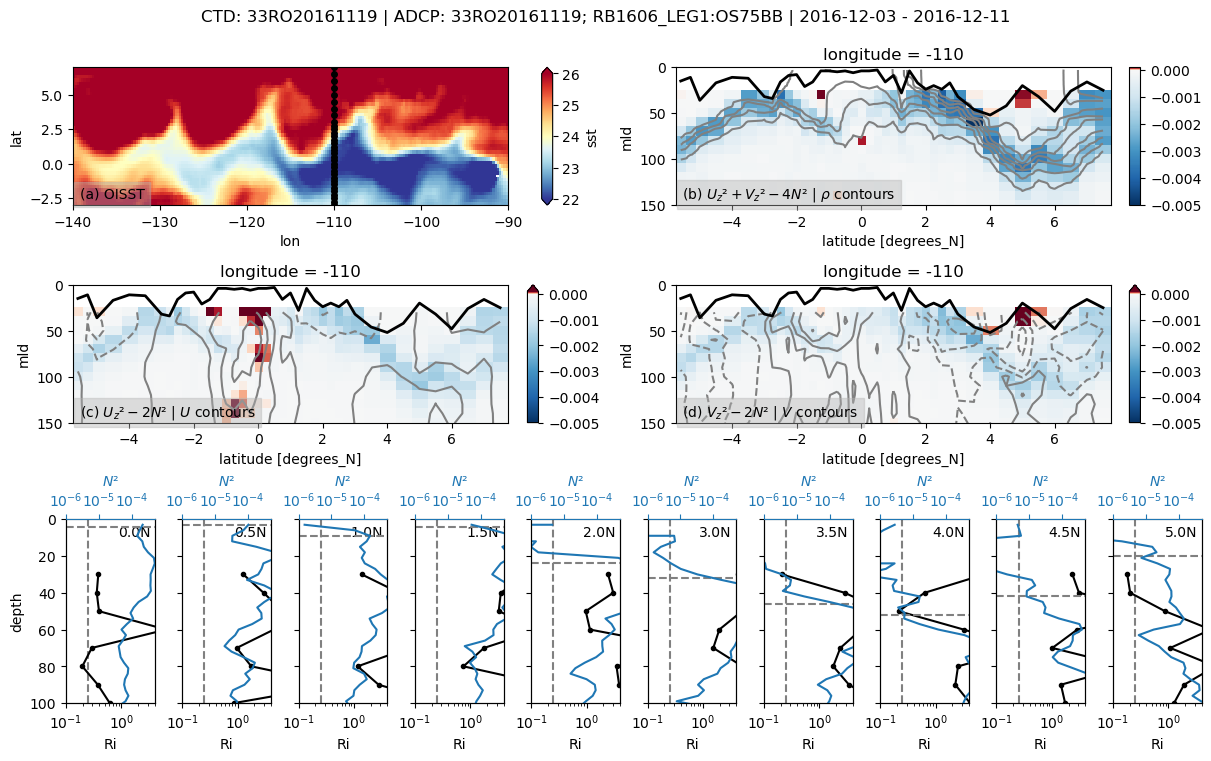
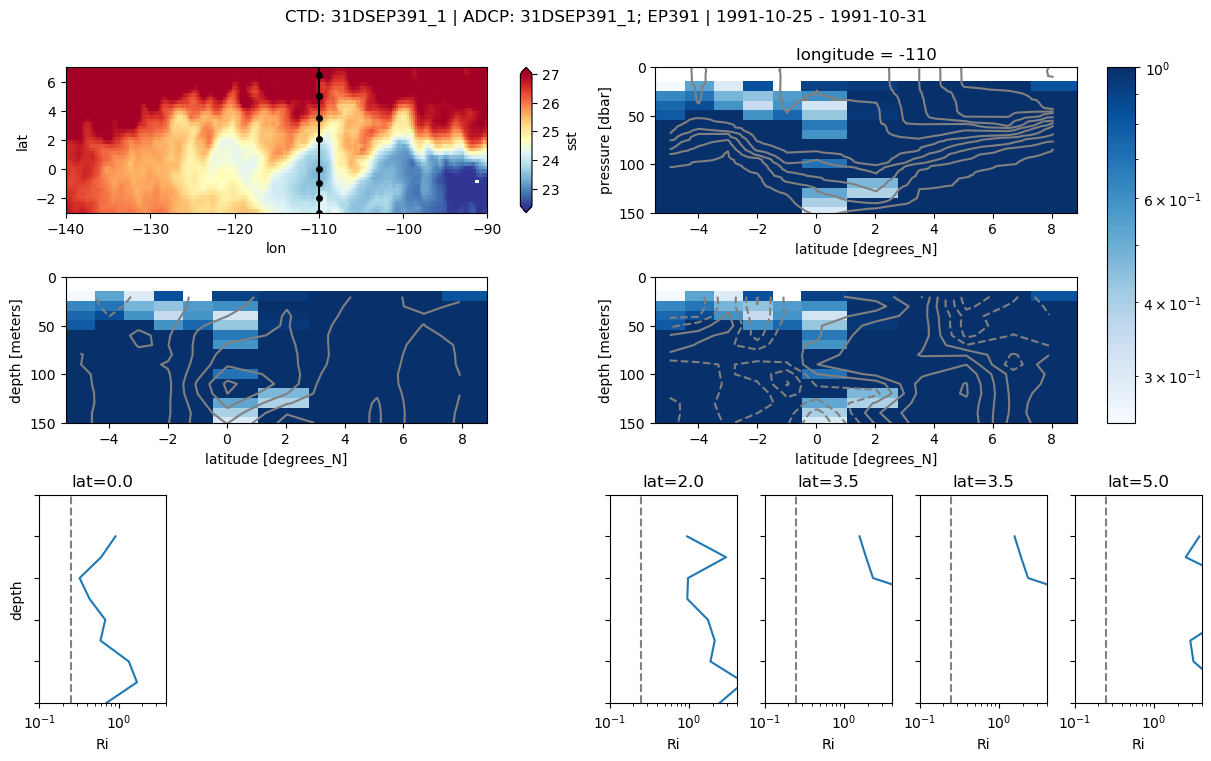
summary plot for section#
%matplotlib inline

pump.sections.plot_section(ctd, adcp, binned, oisst)
skipping 3.5
skipping 4.5
(<Figure size 1200x750 with 24 Axes>,
 {'sst': <matplotlib.axes._subplots.AxesSubplot at 0x2b344cf82ad0>,
  'Ri': <matplotlib.axes._subplots.AxesSubplot at 0x2b344cf86dd0>,
  'u': <matplotlib.axes._subplots.AxesSubplot at 0x2b344cfb8990>,
  'v': <matplotlib.axes._subplots.AxesSubplot at 0x2b344cf6c3d0>,
  'lats': [<matplotlib.axes._subplots.AxesSubplot at 0x2b344cf53a50>,
   <matplotlib.axes._subplots.AxesSubplot at 0x2b344cfdc990>,
   <matplotlib.axes._subplots.AxesSubplot at 0x2b344d015a10>,
   <matplotlib.axes._subplots.AxesSubplot at 0x2b344d04ea50>,
   <matplotlib.axes._subplots.AxesSubplot at 0x2b344d0856d0>,
   <matplotlib.axes._subplots.AxesSubplot at 0x2b344d0bed90>,
   <matplotlib.axes._subplots.AxesSubplot at 0x2b344d0f7bd0>,
   <matplotlib.axes._subplots.AxesSubplot at 0x2b344d133cd0>,
   <matplotlib.axes._subplots.AxesSubplot at 0x2b344d16d7d0>,
   <matplotlib.axes._subplots.AxesSubplot at 0x2b344d1a6a90>]})
distributed.comm.tcp - WARNING - Closing dangling stream in <TCP  local=tcp://127.0.0.1:49730 remote=tcp://127.0.0.1:42035>
distributed.comm.tcp - WARNING - Closing dangling stream in <TCP  local=tcp://127.0.0.1:49732 remote=tcp://127.0.0.1:42035>
distributed.comm.tcp - WARNING - Closing dangling stream in <TCP  local=tcp://127.0.0.1:49736 remote=tcp://127.0.0.1:42035>
distributed.comm.tcp - WARNING - Closing dangling stream in <TCP  local=tcp://127.0.0.1:49744 remote=tcp://127.0.0.1:42035>
distributed.comm.tcp - WARNING - Closing dangling stream in <TCP  local=tcp://127.0.0.1:49748 remote=tcp://127.0.0.1:42035>
distributed.comm.tcp - WARNING - Closing dangling stream in <TCP  local=tcp://127.0.0.1:49750 remote=tcp://127.0.0.1:42035>
distributed.comm.tcp - WARNING - Closing dangling stream in <TCP  local=tcp://127.0.0.1:49756 remote=tcp://127.0.0.1:42035>
distributed.comm.tcp - WARNING - Closing dangling stream in <TCP  local=tcp://127.0.0.1:49758 remote=tcp://127.0.0.1:42035>
pump.sections.plot_section(ctd, adcp, binned, oisst)
/glade/u/home/dcherian/miniconda3/envs/dcpy_updated/lib/python3.7/site-packages/matplotlib/colors.py:1110: RuntimeWarning: invalid value encountered in less_equal
  mask |= resdat <= 0
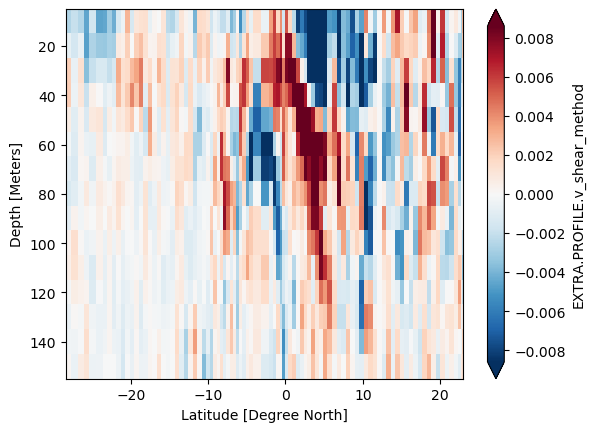
LADCP test#
Test out using SADCP instead of LADCP. Probably not a good diea since LADCP seems to be too smooth
ladcp["EXTRA.PROFILE.v_shear_method"].differentiate("depth").sel(depth=slice(150)).plot(
    x="lat", y="depth", robust=True, yincrease=False
)
<matplotlib.collections.QuadMesh at 0x2acb6a860ed0>
ladcp = (
    xr.open_mfdataset("../datasets/ladcp/33RO20071215_clivar_p18/*.nc")
    .rename({"z": "depth", "tim": "time", "lat": "latitude", "lon": "longitude"})
    .set_coords(["latitude", "longitude"])
)

dates = [
    "-".join(dd) for dd in ladcp.date.values[:, :3].astype("int").astype("U").tolist()
]
times = [
    ":".join(tt) for tt in ladcp.date.values[:, 3:].astype("int").astype("U2").tolist()
]
newtime = pd.DatetimeIndex(
    [pd.to_datetime(dd + " " + tt) for dd, tt in zip(dates, times)]
)
ladcp = (
    ladcp.rename({"time": "weird_time"})
    .assign_coords(time=("cast", newtime))
    .swap_dims({"cast": "time"})
)

ladcp.u.differentiate("depth").sel(depth=slice(150)).plot(
    robust=True, x="latitude", y="depth", yincrease=False
)
/glade/u/home/dcherian/miniconda3/envs/dcpy_updated/lib/python3.7/site-packages/ipykernel_launcher.py:2: FutureWarning: In xarray version 0.15 the default behaviour of `open_mfdataset`
will change. To retain the existing behavior, pass
combine='nested'. To use future default behavior, pass
combine='by_coords'. See
http://xarray.pydata.org/en/stable/combining.html#combining-multi


/glade/u/home/dcherian/python/xarray/xarray/backends/api.py:941: FutureWarning: The datasets supplied have global dimension coordinates. You may want
to use the new `combine_by_coords` function (or the
`combine='by_coords'` option to `open_mfdataset`) to order the datasets
before concatenation. Alternatively, to continue concatenating based
on the order the datasets are supplied in future, please use the new
`combine_nested` function (or the `combine='nested'` option to
open_mfdataset).
  from_openmfds=True,
/glade/u/home/dcherian/python/xarray/xarray/plot/plot.py:1012: UserWarning: Attempted to set non-positive right xlim on a log-scaled axis.
Invalid limit will be ignored.
  ax.set_xlim(x[0], x[-1])
<matplotlib.collections.QuadMesh at 0x2acb7639b850>
f = pump.sections.plot_section(ctd, ladcp, ladcp_binned, oisst)
/glade/u/home/dcherian/miniconda3/envs/dcpy_updated/lib/python3.7/site-packages/dask/array/numpy_compat.py:40: RuntimeWarning: invalid value encountered in true_divide
  x = np.divide(x1, x2, out)
ctd, ladcp = pump.sections.trim_ctd_adcp(ctd, ladcp)
ladcp_binned = pump.sections.grid_ctd_adcp(ctd, ladcp[["u", "v"]])
/glade/u/home/dcherian/python/xarray/xarray/core/nanops.py:142: RuntimeWarning: Mean of empty slice
  return np.nanmean(a, axis=axis, dtype=dtype)
%matplotlib inline
binned_l = pump.sections.grid_ctd_adcp(ctd, ladcp)
f, ax = pump.sections.plot_section(ctd, ladcp, binned_l, oisst)
/glade/u/home/dcherian/python/xarray/xarray/core/nanops.py:142: RuntimeWarning: Mean of empty slice
  return np.nanmean(a, axis=axis, dtype=dtype)
/glade/u/home/dcherian/miniconda3/envs/dcpy_updated/lib/python3.7/site-packages/dask/array/numpy_compat.py:40: RuntimeWarning: invalid value encountered in true_divide
  x = np.divide(x1, x2, out)
ladcp.sel(latitude=slice(-1)).sel(latitude=4, method="nearest").v.plot(
    y="depth", yincrease=False
)
adcp.sel(latitude=4, method="nearest").v.plot(y="depth", yincrease=False, ylim=(140, 0))
plt.legend(["ladcp", "sadcp"])
<matplotlib.legend.Legend at 0x2acb7c30bc50>
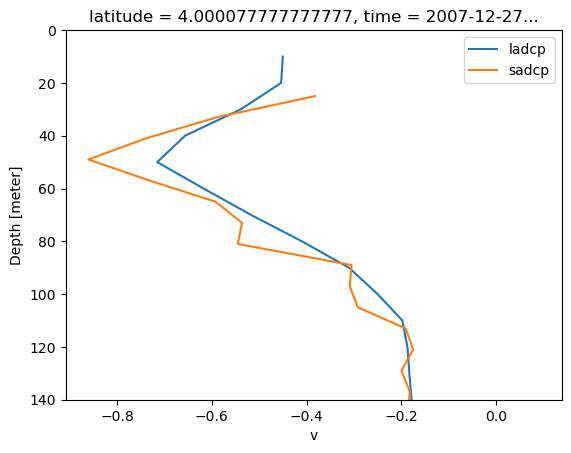
R.C. and Ryan think that LADCP is pretty smoothed because of CTD cage motion. R.C. would definitely pick SADCP shear over LADCP to capture finer scale
Save section images#
adcp_files
['../datasets/adcp/31DSEP391_1_00299v3.nc',
 '../datasets/adcp/31DSEP393_1_00210_short.nc',
 '../datasets/adcp/31DSEP692_2_00295v3.nc',
 '../datasets/adcp/33RB200311_1_RB0309_01032v3.nc',
 '../datasets/adcp/33RB200411_1_00899v3.nc',
 '../datasets/adcp/33RBGP602_1_00995v3.nc',
 '../datasets/adcp/33RBGP801_1_01007v3.nc',
 '../datasets/adcp/33RO20071215_rb0711_01079_short.nc',
 '../datasets/adcp/33RO20161119_RB1606_02292v3.nc']
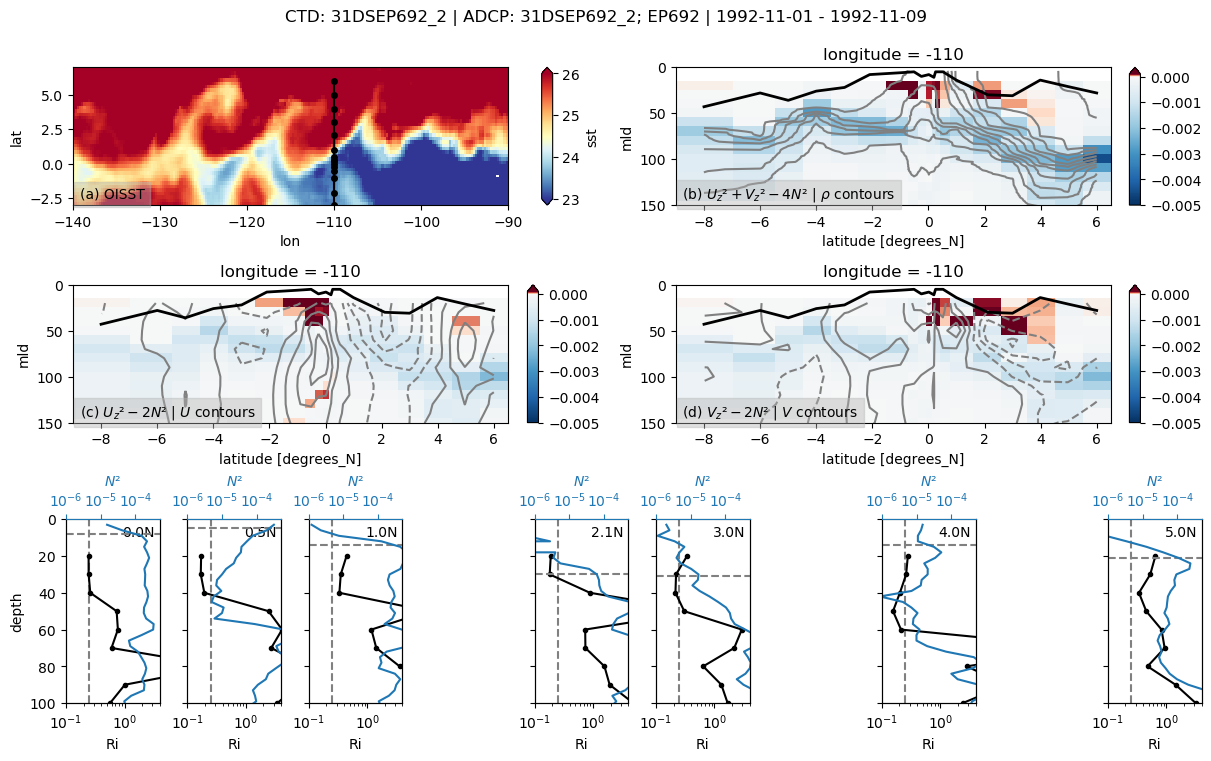
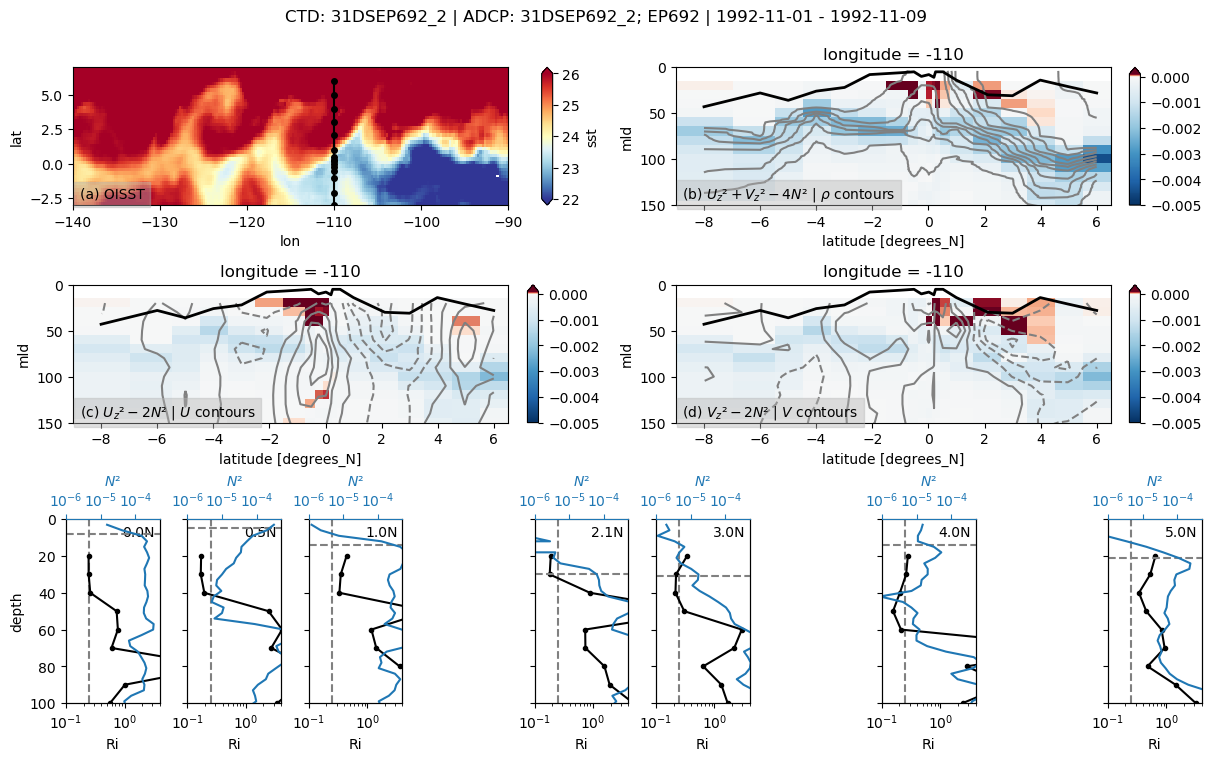
Test image
for file in [adcp_files[2]]:
    expocode, ctd, adcp, binned = pump.sections.process_adcp_file(file)
    if expocode is not None:
        f, _ = pump.sections.plot_section(ctd, adcp, binned, oisst)
31DSEP692
Found 31DSEP692 at index 10.
/glade/u/home/dcherian/python/xarray/xarray/core/nanops.py:142: RuntimeWarning: Mean of empty slice
  return np.nanmean(a, axis=axis, dtype=dtype)
/glade/u/home/dcherian/python/xarray/xarray/core/nanops.py:142: RuntimeWarning: Mean of empty slice
  return np.nanmean(a, axis=axis, dtype=dtype)
skipping 1.5
skipping 3.5
skipping 4.5
Loop through and save images
%matplotlib inline


adcp_files = sorted(glob.glob("../datasets/adcp/*.nc"))
for file in adcp_files:  # [adcp_files[1]]:
    expocode, ctd, adcp, binned = pump.sections.process_adcp_file(file)
    if expocode is not None:
        f, _ = pump.sections.plot_section(ctd, adcp, binned, oisst)
        f.savefig(
            f"../images/cruise-sections/{expocode}.png", bbox_inches="tight", dpi=200
        )
31DSEP391
Found 31DSEP391 at index 35.
/glade/u/home/dcherian/python/xarray/xarray/core/nanops.py:142: RuntimeWarning: Mean of empty slice
  return np.nanmean(a, axis=axis, dtype=dtype)
skipping 0.5
skipping 1
skipping 1.5
skipping 3
skipping 4
skipping 4.5
31DSEP393
Found 31DSEP393 at index 24.
/glade/u/home/dcherian/python/xarray/xarray/core/nanops.py:142: RuntimeWarning: Mean of empty slice
  return np.nanmean(a, axis=axis, dtype=dtype)
skipping 3.5
skipping 4.5
31DSEP692
Found 31DSEP692 at index 10.
/glade/u/home/dcherian/python/xarray/xarray/core/nanops.py:142: RuntimeWarning: Mean of empty slice
  return np.nanmean(a, axis=axis, dtype=dtype)
/glade/u/home/dcherian/python/xarray/xarray/core/nanops.py:142: RuntimeWarning: Mean of empty slice
  return np.nanmean(a, axis=axis, dtype=dtype)
skipping 1.5
skipping 3.5
skipping 4.5
33RB200311
Found 33RB200311 at index 27.
/glade/u/home/dcherian/python/xarray/xarray/core/nanops.py:142: RuntimeWarning: Mean of empty slice
  return np.nanmean(a, axis=axis, dtype=dtype)
skipping 3.5
33RB200411
Found 33RB200411 at index 1.
/glade/u/home/dcherian/python/xarray/xarray/core/nanops.py:142: RuntimeWarning: Mean of empty slice
  return np.nanmean(a, axis=axis, dtype=dtype)
skipping 3.5
33RBGP602
Found 33RBGP602 at index 21.
/glade/u/home/dcherian/python/xarray/xarray/core/nanops.py:142: RuntimeWarning: Mean of empty slice
  return np.nanmean(a, axis=axis, dtype=dtype)
skipping 0.5
skipping 1.5
skipping 3.5
33RBGP801
Found 33RBGP801 at index 32.
/glade/u/home/dcherian/python/xarray/xarray/core/nanops.py:142: RuntimeWarning: Mean of empty slice
  return np.nanmean(a, axis=axis, dtype=dtype)
/glade/u/home/dcherian/python/xarray/xarray/core/nanops.py:142: RuntimeWarning: Mean of empty slice
  return np.nanmean(a, axis=axis, dtype=dtype)
skipping 4.5
33RO20071215
Found 33RO20071215 at index 29.
/glade/u/home/dcherian/python/xarray/xarray/core/nanops.py:142: RuntimeWarning: Mean of empty slice
  return np.nanmean(a, axis=axis, dtype=dtype)
/glade/u/home/dcherian/python/xarray/xarray/core/nanops.py:142: RuntimeWarning: Mean of empty slice
  return np.nanmean(a, axis=axis, dtype=dtype)
33RO20161119
Found 33RO20161119 at index 15.
/glade/u/home/dcherian/python/xarray/xarray/core/nanops.py:142: RuntimeWarning: Mean of empty slice
  return np.nanmean(a, axis=axis, dtype=dtype)
distributed.comm.tcp - WARNING - Closing dangling stream in <TCP local=tcp://127.0.0.1:50026 remote=tcp://127.0.0.1:46013>
distributed.comm.tcp - WARNING - Closing dangling stream in <TCP local=tcp://127.0.0.1:50200 remote=tcp://127.0.0.1:46013>
distributed.comm.tcp - WARNING - Closing dangling stream in <TCP local=tcp://127.0.0.1:50422 remote=tcp://127.0.0.1:46013>
TIW DCL Paper figure#
from IPython import display

chosen_adcps = np.array(adcp_files)[[2, 1, 7]]

for file in chosen_adcps:
    ds = xr.open_dataset(file)
    if "cruise_sonar_summary" in ds.attrs:
        print(ds.attrs["cruise_sonar_summary"])
    else:
        display.display(ds.attrs)
    print("\n=======================================\n")
{'WOCE_Version': '3.0',
 'CONVENTIONS': 'COARDS/WOCE',
 'DATA_TYPE': 'TRACK',
 'DATA_SUB_TYPE': 'SADCP',
 'INST_TYPE': 'SADCP',
 'DATA_ORIGIN': '               NOAA/PMEL; EARTH AND SPACE RESEARCH',
 'EXPOCODE': '31DSEP692_2 ',
 'WOCE_ID': 'PR16 ',
 'CRUISE_NAME': 'EP692',
 'DAC_ID': '00295',
 'FILE_SOURCE': '00295.sub',
 'file_date': '12 Apr 2002',
 'TIME_INTERVAL_BETWEEN_DATA': 'hour',
 'TIME_AVERAGING_SCHEME': 'mean centered on hour',
 'DEPTH_INTERVAL_BETWEEN_DATA': '10 meters',
 'DEPTH_AVERAGING_SCHEME': 'mean centered on given depth',
 'SHIP_POSITION': 'average over hour',
 'doc_000': 'The following time, space, and depth ranges for this cruise',
 'doc_001': 'are based on the complete high-resolution data set and does',
 'doc_002': 'not agree exactly with the ranges of this averaged subset.',
 'doc_003': ' #DATA_DATES: 1992/10/15 00:01:00 --- to --- 1992/11/19 23:26:00',
 'doc_004': ' #LON_RANGE: 117.23 W --- to ---  80.87 W',
 'doc_005': ' #LAT_RANGE:  10.00 S --- to ---  32.72 N',
 'doc_006': ' #DEPTH_RANGE:     18 --- to --- 522 m',
 'doc_007': ' #SAC_CRUISE_ID: 00295 ',
 'doc_008': ' #PLATFORM_NAME: R/V Discoverer',
 'doc_009': ' #PRINCIPAL_INVESTIGATOR_NAME:  M.McPhaden and Eric Johnson',
 'doc_010': ' #PI_INSTITUTION:               NOAA/PMEL; Earth and Space Research',
 'doc_011': ' #PI_COUNTRY:                   USA',
 'doc_012': ' #PROJECT: WOCE (Repeat Survey)',
 'doc_013': '           Tropical Atmosphere Ocean (TOGA/TAO) mooring cruises',
 'doc_014': ' #CRUISE_NAME: ship_tag=ep692 woce_tag=PR16 EXPOCODE=31DSEP692_2',
 'doc_015': ' #PORTS: Manzanillo, Mexico to San Diego California to Guayaquil, Ecuador',
 'doc_016': ' #GEOGRAPHIC_REGION: tropical eastern Pacific',
 'doc_017': ' #PROCESSED_BY: P.Plimpton (NOAA/PMEL) and Eric Johnson (Earth and ',
 'doc_018': '                Space Research)',
 'doc_019': ' #NAVIGATION: GPS                          ',
 'doc_020': ' #QUALITY_NAV: good',
 'doc_021': ' #GENERAL_INFORMATION: ',
 'doc_022': 'CRUISE NOTES',
 'doc_023': '  CHIEF SCIENTIST ON SHIP     : unconfirmed',
 'doc_024': '    INSTITUTE                 : NOAA/PMEL',
 'doc_025': '    COUNTRY                   : USA',
 'doc_026': '  SIGNIFICANT DATA GAPS       : ADCP gap on days 291-300',
 'doc_027': '  SPECIAL SHIP TRACK PATTERNS :',
 'doc_028': '  COMMENTS                    :',
 'doc_029': '',
 'doc_030': 'ADCP INSTRUMENTATION',
 'doc_031': '  MANUFACTURER                : RDI',
 'doc_032': '  HARDWARE MODEL              : VM-150',
 'doc_033': '  SERIAL NUMBERS              :  ',
 'doc_034': '  FIRMWARE VERSION            :  ',
 'doc_035': '  TRANSMIT FREQUENCY          : 153 KHz',
 'doc_036': '  TRANSDUCER CONFIGURATION    : JANUS CONCAVE',
 'doc_037': '  ACOUSTIC BEAM WIDTH         :  ',
 'doc_038': '  TRANSDUCER BEAM ANGLE       : 30 deg',
 'doc_039': '  COMMENTS                    :  ',
 'doc_040': ' ',
 'doc_041': 'ADCP INSTALLATION',
 'doc_042': '  METHOD/DESCRIPTION OF THE',
 'doc_043': '    ATTACHMENT TO THE HULL    : The ADCP transducer is in a steel housing that is',
 'doc_044': '         welded to the hull.  The transducer itself fits in the housing with the',
 'doc_045': '         transducer array parallel to bottom of the steel housing.  We can remove',
 'doc_046': '         the transducer by bolting a steel plate on the bottom of the housing',
 'doc_047': '         (to keep water out of the ship when the transducer is removed) and then',
 'doc_048': '         from the inside of the ship, unbolt the upper plate and pull the transduce',
 'doc_049': '',
 'doc_050': '         up inside the ship.',
 'doc_051': '  LOCATION/DEPTH ON HULL      : The ADCP transducer is located at approx. Frame 50.',
 'doc_052': "         The depth below the water line is approx. 18 to 19' depending on ship load",
 'doc_053': '',
 'doc_054': '  REPEATABLE ATTACHMENT       : YES',
 'doc_055': '  DATE OF MOST RECENT ATTACH. :',
 'doc_056': '  ACOUSTIC WINDOW             : There is no acoustic window over the face to the',
 'doc_057': '                                transducer array.  It is free flooding.',
 'doc_058': '  COMMENTS                    : ',
 'doc_059': '',
 'doc_060': 'ADCP INSTRUMENT CONFIGURATION     ',
 'doc_061': '  DEPTH RANGE                 : 18 to 522 m',
 'doc_062': '  BIN LENGTH                  : 8 m',
 'doc_063': '  NUMBER OF BINS              : 64',
 'doc_064': '  TRANSMIT PULSE LENGTH       : 8 m',
 'doc_065': '  BLANKING INTERVAL           : 4 m',
 'doc_066': '  ENSEMBLE AVERAGING INTERVAL : 60 s',
 'doc_067': '  SOUND SPEED CALCULATION     : FUNCTION OF TEMP AT TRANSDUCER',
 'doc_068': '  BOTTOM TRACKING             : at times',
 'doc_069': '  DIRECT COMMANDS             :',
 'doc_070': '  COMMENTS                    : ',
 'doc_071': '',
 'doc_072': 'ADCP DATA ACQUISITION SYSTEM',
 'doc_073': '  SOFTWARE DEVELOPERS         :  ',
 'doc_074': '  SOFTWARE VERSIONS           : RDI DAS 2.48 ',
 'doc_075': '  DATA LOGGER, MAKE/MODEL     :  ',
 'doc_076': '  ADCP/LOGGER COMMUNICATION   : GPIB',
 'doc_077': '  USER BUFFER VERSION         : unconfirmed',
 'doc_078': '  CLOCK                       :  ',
 'doc_079': '  COMMENTS                    : ',
 'doc_080': '',
 'doc_081': 'SHIP HEADING                      ',
 'doc_082': '  INSTRUMENT MAKE/MODEL       : gyro-compass ',
 'doc_083': '  SYNCHRO OR STEPPER          : synchro  ',
 'doc_084': '  SYNCHRO RATIO               :  1:1',
 'doc_085': '  COMPENSATION APPLIED        :  ',
 'doc_086': '  GPS ATTITUDE SYSTEM         : no',
 'doc_087': '    LOCATION OF ANTENNAS      : ',
 'doc_088': '    RIGID ATTACHMENT          :',
 'doc_089': '    LOGGING RATE              : ',
 'doc_090': '',
 'doc_091': 'ANCILLARY MEASUREMENTS            ',
 'doc_092': '  SURFACE TEMP AND SALINITY   : yes',
 'doc_093': '  PITCH/ROLL MEASUREMENTS     :',
 'doc_094': '  HYDRO CAST MEASUREMENTS     :',
 'doc_095': '  BIOMASS DETERMINATION       :',
 'doc_096': '    DATE OF LAST CALIBRATION  :',
 'doc_097': '    CALIBRATION COEFFICIENTS  :',
 'doc_098': '    BEAM-AVERAGED AGC AVAILABLE?: YES',
 'doc_099': '    CALIBRATION NET TOWS?     :   < NO > < YES >',
 'doc_100': '  COMMENTS                    :',
 'doc_101': '',
 'doc_102': 'ADCP DATA PROCESSING/EDITING',
 'doc_103': '  PERSONNEL IN CHARGE         : T.Plimpton and Eric Johnson',
 'doc_104': '  DATE OF PROCESSING          : unconfirmed',
 'doc_105': '  ADDED TO NODC DB            : May 1999',
 'doc_106': '  NOTABLE SCATTERING LAYERS   :',
 'doc_107': '  SOUND SPEED CORRECTIONS     : YES',
 'doc_108': '  COMMENTS                    : ',
 'doc_109': 'Preparation of the PMEL data consists of three stages: the timing adjustment,',
 'doc_110': 'the navigation of the data, and the calibration of the ADCP.  Time',
 'doc_111': 'corrected with time marks from GPS system.  The measured relative velocities',
 'doc_112': 'are corrected for the true speed of sound at the transducer using thermistor',
 'doc_113': 'data and assuming salinity of 35 psu.  In situations where the thermistor',
 'doc_114': 'was not working the speed of sound correction can not be carried out, but',
 'doc_115': 'its cruise-averaged value and the broadest scales of its spatial variability',
 'doc_116': 'are necessarily incorporated in the time-dependent instrument calibrations.',
 'doc_117': 'Navigation data were edited to remove bad fixes.  ',
 'doc_118': '',
 'doc_119': 'The ADCP data has not been edited for noise caused by turbulence in the',
 'doc_120': 'upper layers or interference from the CTD.  USERS MUST BE AWARE OF SUCH',
 'doc_121': 'POTENTIAL LIMITATIONS AND TEST FOR THOSE THAT MIGHT AFFECT THEIR PARTICULAR',
 'doc_122': 'APPLICATION.',
 'doc_123': '',
 'doc_124': 'The data are archived in original depth bins rather than re-gridded, so',
 'doc_125': 'depths are not corrected for the small (~2%) difference between nominal',
 'doc_126': 'and local speed of sound.',
 'doc_127': '',
 'doc_128': 'NAVIGATION',
 'doc_129': '  GPS                         : YES',
 'doc_130': '    MAKE/MODEL                : Magnavox MX4200',
 'doc_131': '    SELECTIVE AVAILABILITY    : YES',
 'doc_132': '    P-CODE                    : NO',
 'doc_133': '    DIFFERENTIAL              : NO',
 'doc_134': '    SAMPLE INTERVAL           : 1 sec',
 'doc_135': '    LOCATION OF ANTENNA',
 'doc_136': '      RELATIVE TO TRANSDUCER  :',
 'doc_137': '    TIME OBTAINED RELATIVE TO',
 'doc_138': '      START/END OF ENSEMBLE   : start and end',
 'doc_139': '    AVERAGING/EDITING APPLIED : none',
 'doc_140': '    LOGGED WITH ADCP DATA     : YES via UE3 user exit program',
 'doc_141': '    LOGGED INDEPENDENTLY      : undoubtedly by shipboard computer',
 'doc_142': '    COMMENTS                  :',
 'doc_143': '  OTHER                       : ',
 'doc_144': '',
 'doc_145': 'CALIBRATION ',
 'doc_146': '    GYROCOMPASS CORRECTION      : Yes',
 'doc_147': '    BOTTOM TRACK METHOD         : Yes',
 'doc_148': '    WATER TRACK METHOD          : YES',
 'doc_149': '    FINAL SELECTION             : AMPLITUDE=1.0045     PHASE= 2.039 deg ',
 'doc_150': '    AGREEMENT WITH PREVIOUS ',
 'doc_151': '      CRUISES                   : ',
 'doc_152': '    COMMENTS                    : ',
 'doc_153': 'The data are searched by computer for hour-long intervals containing large ',
 'doc_154': "variations in ship's velocity.  These intervals are used to estimate the ",
 'doc_155': 'heading bias and gain error of the instrument as in Joyce, 1989.  The',
 'doc_156': 'calibrations are editied for obvious outliers, filtered heavily in time to',
 'doc_157': 'remove time scales shorter than 1.6 days, and fed back into a final,',
 'doc_158': 'clean navigation of the data.',
 'doc_159': '',
 'doc_160': 'NAVIGATION CALCULATION',
 'doc_161': '    NAVIGATION USED             : gps',
 'doc_162': '    REFERENCE LAYER DEPTH RANGE : 139 - 195 m',
 'doc_163': '    FILTERING METHOD FOR',
 'doc_164': '      SMOOTHING REFERENCE LAYER',
 'doc_165': '      VELOCITY (FORM/WIDTH)     : Time filtered long enough to eliminate ',
 'doc_166': '          periods shorter than 2 hours (time scales shorter than 20 minutes).',
 'doc_167': '    FINALIZED SHIP VEL/POSITIONS',
 'doc_168': '    STORED IN DATABASE          : YES',
 'doc_169': '    COMMENTS                    : ',
 'doc_170': '',
 'doc_171': ' GENERAL_ASSESSMENT             : ',
 'doc_172': '    VECTOR PLOTS                : ok',
 'doc_173': '    COMMENTS                    : ok',
 'doc_174': '',
 'doc_175': ' REFERENCES (DATA REPORTS,ETC.) : ',
 'doc_176': 'Johnson, Eric and P.Plimpton, 1999.  TOGA/TAO Shipboard ADCP Data Report, 1991-1995',
 'doc_177': '',
 'doc_178': '  unpublished report available from',
 'doc_179': '',
 'doc_180': 'Eric Johnson                 Patricia E. Plimpton',
 'doc_181': 'Earth and Space Research     NOAA/PMEL',
 'doc_182': '1910 Fairview Ave. E.        7600 Sand Point Way NE, Bldg. 3',
 'doc_183': 'Seattle, WA 98102            Seattle, WA 98115',
 'doc_184': ''}
=======================================

 #DATA_DATES: 1993/08/24 01:45:00 --- to --- 1993/09/18 16:08:00
 #LON_RANGE: 117.23 W --- to ---  94.88 W
 #LAT_RANGE:   8.05 S --- to ---  32.72 N
 #DEPTH_RANGE:     18 --- to --- 522 m
 #SAC_CRUISE_ID: 00210
 #PLATFORM_NAME: R/V Discoverer
 #PRINCIPAL_INVESTIGATOR_NAME:  M.McPhaden and Eric Johnson
 #PI_INSTITUTION:               NOAA/PMEL; Earth and Space Research
 #PI_COUNTRY:                   USA
 #PROJECT: WOCE (Repeat Survey)
           Tropical Atmosphere Ocean (TOGA/TAO) mooring cruises
 #CRUISE_NAME: ship_tag=ep393 woce_tag=PR16 EXPOCODE=31DSEP393
 #PORTS: San Diego to San Diego
 #GEOGRAPHIC_REGION: E Pacific, tropical E Pacific
 #PROCESSED_BY: P.Plimpton (NOAA/PMEL) and Eric Johnson (Earth and
                Space Research)
 #NAVIGATION: GPS
 #QUALITY_NAV: good
 #GENERAL_INFORMATION:
CRUISE NOTES
  CHIEF SCIENTIST ON SHIP     : unconfirmed
    INSTITUTE                 : NOAA/PMEL
    COUNTRY                   : USA
  SIGNIFICANT DATA GAPS       :
  SPECIAL SHIP TRACK PATTERNS :
  COMMENTS                    :

ADCP INSTRUMENTATION
  MANUFACTURER                : RDI
  HARDWARE MODEL              : VM-150
  SERIAL NUMBERS              :
  FIRMWARE VERSION            :
  TRANSMIT FREQUENCY          : 153 KHz
  TRANSDUCER CONFIGURATION    : JANUS CONCAVE
  ACOUSTIC BEAM WIDTH         :
  TRANSDUCER BEAM ANGLE       : 30 deg
  COMMENTS                    :

ADCP INSTALLATION
  METHOD/DESCRIPTION OF THE
    ATTACHMENT TO THE HULL    : The ADCP transducer is in a steel housing that is
         welded to the hull.  The transducer itself fits in the housing with the
         transducer array parallel to bottom of the steel housing.  We can remove
         the transducer by bolting a steel plate on the bottom of the housing
         (to keep water out of the ship when the transducer is removed) and then
         from the inside of the ship, unbolt the upper plate and pull the transducer
         up inside the ship.
  LOCATION/DEPTH ON HULL      : The ADCP transducer is located at approx. Frame 50.
         The depth below the water line is approx. 18 to 19' depending on ship load.
  REPEATABLE ATTACHMENT       : YES
  DATE OF MOST RECENT ATTACH. :
  ACOUSTIC WINDOW             : There is no acoustic window over the face to the
                                transducer array.  It is free flooding.
  COMMENTS                    :

ADCP INSTRUMENT CONFIGURATION
  DEPTH RANGE                 : 18 to 522 m
  BIN LENGTH                  : 8 m
  NUMBER OF BINS              : 64
  TRANSMIT PULSE LENGTH       : 8 m
  BLANKING INTERVAL           : 4 m
  ENSEMBLE AVERAGING INTERVAL : 60 s
  SOUND SPEED CALCULATION     : FUNCTION OF TEMP AT TRANSDUCER
  BOTTOM TRACKING             : at times
  DIRECT COMMANDS             :
  COMMENTS                    :

ADCP DATA ACQUISITION SYSTEM
  SOFTWARE DEVELOPERS         :
  SOFTWARE VERSIONS           : RDI DAS 2.48
  DATA LOGGER, MAKE/MODEL     :
  ADCP/LOGGER COMMUNICATION   : GPIB
  USER BUFFER VERSION         : unconfirmed
  CLOCK                       :
  COMMENTS                    :

SHIP HEADING
  INSTRUMENT MAKE/MODEL       : gyro-compass
  SYNCHRO OR STEPPER          : synchro
  SYNCHRO RATIO               :  1:1
  COMPENSATION APPLIED        :
  GPS ATTITUDE SYSTEM         : no
    LOCATION OF ANTENNAS      :
    RIGID ATTACHMENT          :
    LOGGING RATE              :

ANCILLARY MEASUREMENTS
  SURFACE TEMP AND SALINITY   : yes
  PITCH/ROLL MEASUREMENTS     :
  HYDRO CAST MEASUREMENTS     :
  BIOMASS DETERMINATION       :
    DATE OF LAST CALIBRATION  :
    CALIBRATION COEFFICIENTS  :
    BEAM-AVERAGED AGC AVAILABLE?: YES
    CALIBRATION NET TOWS?     :   < NO > < YES >
  COMMENTS                    :

ADCP DATA PROCESSING/EDITING
  PERSONNEL IN CHARGE         : T.Plimpton and Eric Johnson
  DATE OF PROCESSING          : unconfirmed
  ADDED TO NODC DB            : May 1999
  NOTABLE SCATTERING LAYERS   :
  SOUND SPEED CORRECTIONS     : Yes
  COMMENTS                    :
Preparation of the PMEL data consists of three stages: the timing adjustment,
the navigation of the data, and the calibration of the ADCP.  Time
corrected with time marks from GPS system.  The measured relative velocities
are corrected for the true speed of sound at the transducer using thermistor
data and assuming salinity of 35 psu.  In situations where the thermistor
was not working the speed of sound correction can not be carried out, but
its cruise-averaged value and the broadest scales of its spatial variability
are necessarily incorporated in the time-dependent instrument calibrations.
Navigation data were edited to remove bad fixes.

The ADCP data has not been edited for noise caused by turbulence in the
upper layers or interference from the CTD.  USERS MUST BE AWARE OF SUCH
POTENTIAL LIMITATIONS AND TEST FOR THOSE THAT MIGHT AFFECT THEIR PARTICULAR
APPLICATION.

The data are archived in original depth bins rather than re-gridded, so
depths are not corrected for the small (~2%) difference between nominal
and local speed of sound.

NAVIGATION
  GPS                         : YES
    MAKE/MODEL                : Magnavox MX4200
    SELECTIVE AVAILABILITY    : YES
    P-CODE                    : NO
    DIFFERENTIAL              : NO
    SAMPLE INTERVAL           : 1 sec
    LOCATION OF ANTENNA
      RELATIVE TO TRANSDUCER  :
    TIME OBTAINED RELATIVE TO
      START/END OF ENSEMBLE   : start and end
    AVERAGING/EDITING APPLIED : none
    LOGGED WITH ADCP DATA     : YES via UE3 user exit program
    LOGGED INDEPENDENTLY      : undoubtedly by shipboard computer
    COMMENTS                  :
  OTHER                       :

CALIBRATION
    GYROCOMPASS CORRECTION      : Yes
    BOTTOM TRACK METHOD         : Yes
    WATER TRACK METHOD          : YES
    FINAL SELECTION             : AMPLITUDE=1.0071     PHASE= 2.821 deg
    AGREEMENT WITH PREVIOUS
      CRUISES                   :
    COMMENTS                    :
The data are searched by computer for hour-long intervals containing large
variations in ship's velocity.  These intervals are used to estimate the
heading bias and gain error of the instrument as in Joyce, 1989.  The
calibrations are editied for obvious outliers, filtered heavily in time to
remove time scales shorter than 1.6 days, and fed back into a final,
clean navigation of the data.

NAVIGATION CALCULATION
    NAVIGATION USED             : gps
    REFERENCE LAYER DEPTH RANGE : 139 - 195 m
    FILTERING METHOD FOR
      SMOOTHING REFERENCE LAYER
      VELOCITY (FORM/WIDTH)     : Time filtered long enough to eliminate
          periods shorter than 2 hours (time scales shorter than 20 minutes).
    FINALIZED SHIP VEL/POSITIONS
    STORED IN DATABASE          : YES
    COMMENTS                    :

 GENERAL_ASSESSMENT             :
    VECTOR PLOTS                : ok
    COMMENTS                    : ok

 REFERENCES (DATA REPORTS,ETC.) :
Johnson, Eric and P.Plimpton, 1999.  TOGA/TAO Shipboard ADCP Data Report, 1991-1995.
  unpublished report available from

Eric Johnson                 Patricia E. Plimpton
Earth and Space Research     NOAA/PMEL
1910 Fairview Ave. E.        7600 Sand Point Way NE, Bldg. 3
Seattle, WA 98102            Seattle, WA 98115


=======================================

 #DATA_DATES: 2007/12/15 02:22:00 --- to --- 2008/01/18 19:06:00
 #LON_RANGE: 117.35 W --- to --- 103.00 W
 #LAT_RANGE:  28.08 S --- to ---  32.72 N
 #DEPTH_RANGE:     20 --- to --- 653 m
 #SAC_CRUISE_ID: 01079
 #PLATFORM_NAME: R/V Ron Brown
 #PRINCIPAL_INVESTIGATOR_NAME: Eric Firing, Jules Hummon
 #PI_INSTITUTION: University of Hawaii
 #PI_COUNTRY: USA
 #PROJECT: CLIVAR Global Carbon Program;repeat of WOCE One-time Line
 #CRUISE_NAME: ship_tag=rb0711:os75bb woce_tag=P18N_2007:os75bb EXPOCODE=33RO200711
 #PORTS: San Diego CA to Easter Island (Chile)
 #GEOGRAPHIC_REGION: eastern tropical Pacific
 #PROCESSED_BY: Jules Hummon, University of Hawaii
 #NAVIGATION: Conventional gyro compass, mahrs
 #QUALITY_NAV:  <good>
 #GENERAL_INFORMATION:
CRUISE NOTES
  CHIEF SCIENTIST ON SHIP       : John Bullister
    INSTITUTE                   : NOAA/PMEL
    COUNTRY                     : USA
  SIGNIFICANT DATA GAPS         :
  SPECIAL SHIP TRACK PATTERNS   : none
  COMMENTS                      :

ADCP INSTRUMENTATION
    MANUFACTURER                : RDI
    HARDWARE MODEL              : Ocean Surveyor 75
    SERIAL NUMBERS              :
    FIRMWARE VERSION            :
    TRANSMIT FREQUENCY          : 75 kHz
    ACOUSTIC BEAM WIDTH         :
    TRANSDUCER BEAM ANGLE       :
    COMMENTS                    : ping type broadband from interleaved

ADCP INSTALLATION
  METHOD/DESCRIPTION OF THE
    ATTACHMENT TO THE HULL    : Position roughly midship on hull.
                                Bolted onto stand inside seachest.
  LOCATION/DEPTH ON HULL      : transducer depth nominally at 5m (19')
  REPEATABLE ATTACHMENT       : yes
  DATE OF MOST RECENT ATTACH. : 2005
  ACOUSTIC WINDOW             :  no
  COMMENTS                    :

ADCP INSTRUMENT CONFIGURATION
  DEPTH RANGE                 : 25 to 657 m
  BIN LENGTH                  : 8 m
  NUMBER OF BINS              : 80
  TRANSMIT PULSE LENGTH       : 8 m
  BLANKING INTERVAL           : 12 m
  ENSEMBLE AVERAGING INTERVAL : 300 s
  SOUND SPEED CALCULATION     : Function of transducer temperature
  BOTTOM TRACKING             :
  DIRECT COMMANDS             :
  COMMENTS                    :

ADCP DATA ACQUISITION SYSTEM
  SOFTWARE DEVELOPERS         : UHDAS
  SOFTWARE VERSIONS           :
  DATA LOGGER, MAKE/MODEL     :
  ADCP/LOGGER COMMUNICATION   :
  USER BUFFER VERSION         : none
  CLOCK                       :
  COMMENTS                    : single-ping data files QC'ed then averaged
                                by UHDAS
SHIP HEADING
  INSTRUMENT MAKE/MODEL       : Sperry Mark 37 gyro and
                                a Sperry Mark 39 Mod 0 laser ring gyro
  SYNCHRO OR STEPPER          : synchro
  SYNCHRO RATIO               :
  COMPENSATION APPLIED        :
  GPS ATTITUDE SYSTEM         : Seatex Seapath 200
    LOCATION OF ANTENNAS      :
    RIGID ATTACHMENT          :
    LOGGING RATE              :
  COMMENTS                    : The Mark 37 gyro relies on manual latitude
and speed corrections, the Mark 39 gyro relies on automatic speed log corrections.
Also, TSS Mahrs used for heading correction.

ANCILLARY MEASUREMENTS
   SURFACE TEMP AND SALINITY    : yes
   PITCH/ROLL MEASUREMENTS      : yes or no
   HYDRO CAST MEASUREMENTS      : yes
   BIOMASS DETERMINATION        : no
   COMMENTS                     :

NAVIGATION
  GPS                         : Three primary - a Trimble Centurian P-code GPS,
                                a Magnavox MX-200 GPS,
                                and a Northstar 941x differential GPS
    MAKE/MODEL                :
    SELECTIVE AVAILABILITY    :
    P-CODE                    : yes
    DIFFERENTIAL              :
    SAMPLE INTERVAL           :
    LOCATION OF ANTENNA
      RELATIVE TO TRANSDUCER  :
                                    4 ft. 4 in. to starboard
                                    86 ft. 7 in. aft
                                    59 ft. 9 in. vertical
                                    this is the p-code gps antenna
    TIME OBTAINED RELATIVE TO
      START/END OF ENSEMBLE   : start and end of ensemble
    AVERAGING/EDITING APPLIED : ensemble position is average of end of present
                                ensemble and start of following ensemble
    LOGGED WITH ADCP DATA     : yes
    LOGGED INDEPENDENTLY      : yes
    COMMENTS                  :
  OTHER                       :
ADCP DATA PROCESSING/EDITING
    PERSONNEL IN CHARGE         : Jules Hummon
    DATE OF PROCESSING          :
    ADDED TO NODC DB            : May 2008
    SOUND SPEED CORRECTIONS     :
    NOTABLE SCATTERING LAYERS   :
    COMMENTS :        poor scattering in suptropics,
                      strong scattering layers especially equatorward

CALIBRATION
    GYROCOMPASS CORRECTION      : YES referencing to Mahrs
    WATER TRACK METHOD          : Yes
    BOTTOM TRACK METHOD         : No
    FINAL SELECTION             : AMPLITUDE=   1.000   PHASE= 0.17 deg
    AGREEMENT WITH PREVIOUS
      CRUISES                   : OK
    COMMENTS                    : original heading alignment: 22.0

NAVIGATION CALCULATION
    NAVIGATION USED             : GPS
    REFERENCE LAYER DEPTH RANGE : bins 2 to 20
    FILTERING METHOD FOR
      SMOOTHING REFERENCE LAYER
      VELOCITY (FORM/WIDTH)     : Blackman window function of width T ( .5 hr):
         w(t) = 0.42 - 0.5 * cos(2 * pi *t / T) + 0.08 * cos(4 * pi * t / T).
    FINALIZED SHIP VEL/POSITIONS
    STORED IN DATABASE          : YES
    COMMENTS                    :

REFERENCES (DATA REPORTS,ETC)   :


=======================================
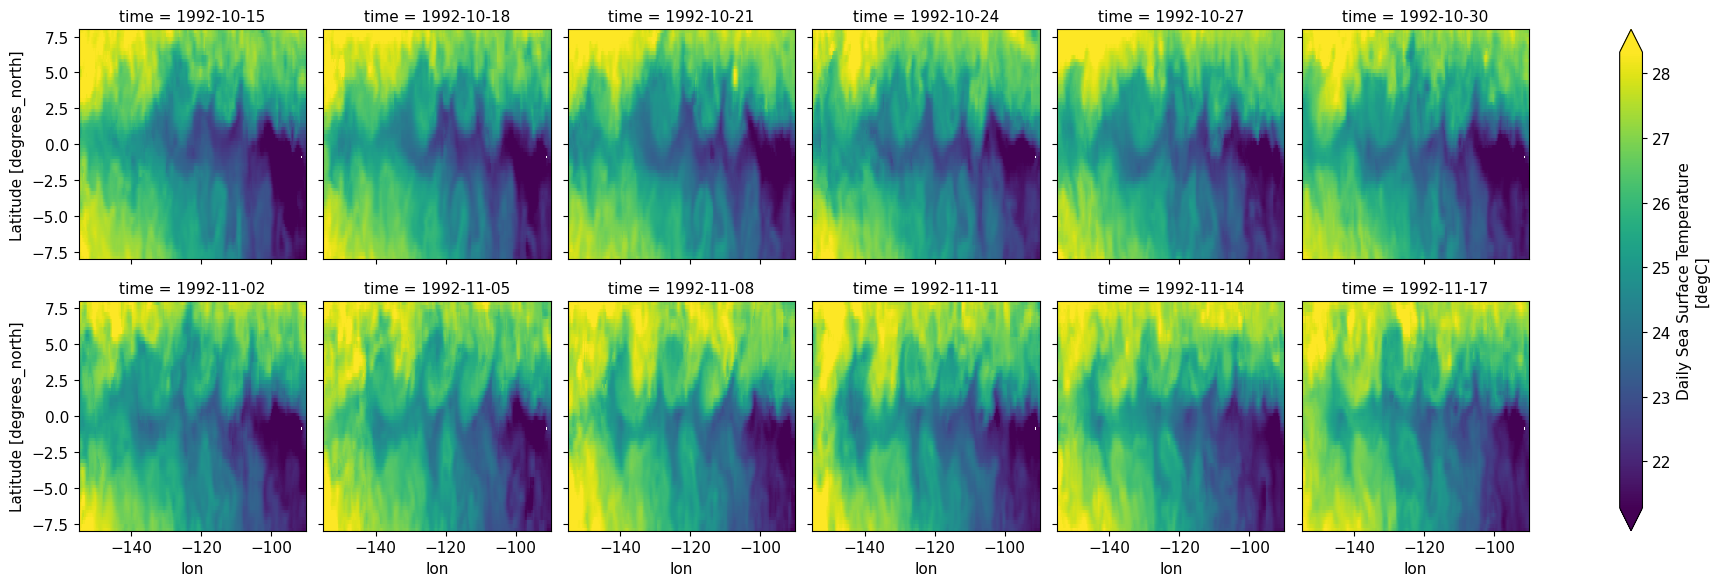
oisst.sel(time=slice("1992-10-15", "1992-11-19")).isel(time=slice(None, None, 3)).plot(
    col="time", col_wrap=6, robust=True
)
<xarray.plot.facetgrid.FacetGrid at 0x2ac99ea8c630>
?pump.sections.process_adcp_file
Signature: pump.sections.process_adcp_file(adcp_file: str)
Docstring: processes an adcp adcp_file; finds matching CTD section.
File:      ~/pump/pump/sections.py
Type:      function
%matplotlib inline
import dask
import os
plt.rcParams["font.size"] = 11
f, ax = plt.subplots(
3,
3,
gridspec_kw=dict(width_ratios=[2, 1, 1]),
# sharex="col",
sharey="col",
constrained_layout=True,
)
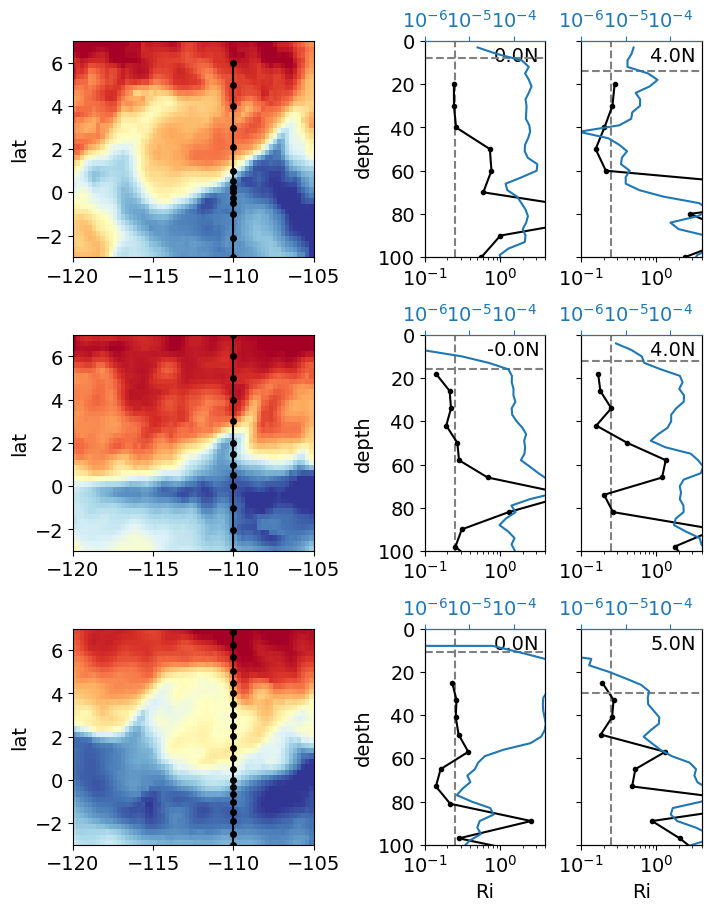
expected_lat = [0, 1, 3, 4]
axrho = []
for index, (file, lats) in enumerate(
zip(
chosen_adcps,
[
[0, 4],
[0, 4],
[0, 5],
],
)
):
print(file)
expocode, ctd, adcp, binned = dask.compute(
*pump.sections.process_adcp_file(file, cruises)
)
axx = dict()
axx["sst"] = ax[index, 0]
axx["lats"] = ax[index, 1:]
axrho.append(pump.sections.plot_row(ctd, adcp, binned, oisst, axx, lats))
[axx.set_xlabel("") for axx in ax[:-1, :].flat]
[aa.set_yticks([-2, 0, 2, 4, 6]) for aa in ax[:, 0]]
[dcpy.plots.lat_lon_ticks(aa) for aa in ax[:, 0]]
dcpy.plots.label_subplots(
ax.flat, labels=["EP692", "", "", "EP393", "", "", "RB0711", "", ""]
)
ax[0, 0].set_title("SST")
f.set_size_inches((7, 9))
f.savefig("images/cruise-Ri-summary.png")
../datasets/adcp/31DSEP692_2_00295v3.nc
31DSEP692
Found 31DSEP692 at index 10.
/glade/u/home/dcherian/miniconda3/envs/dcpy/lib/python3.8/site-packages/xarray/core/nanops.py:142: RuntimeWarning: Mean of empty slice
  return np.nanmean(a, axis=axis, dtype=dtype)
['1992-11-02T00:40:00.000000000']
/glade/u/home/dcherian/miniconda3/envs/dcpy/lib/python3.8/site-packages/xarray/core/nanops.py:142: RuntimeWarning: Mean of empty slice
  return np.nanmean(a, axis=axis, dtype=dtype)
/glade/u/home/dcherian/miniconda3/envs/dcpy/lib/python3.8/site-packages/xarray/core/nanops.py:142: RuntimeWarning: Mean of empty slice
  return np.nanmean(a, axis=axis, dtype=dtype)
../datasets/adcp/31DSEP393_1_00210_short.nc
31DSEP393
Found 31DSEP393 at index 24.
['1993-09-12T05:41:00.000000000']
/glade/u/home/dcherian/miniconda3/envs/dcpy/lib/python3.8/site-packages/xarray/core/nanops.py:142: RuntimeWarning: Mean of empty slice
  return np.nanmean(a, axis=axis, dtype=dtype)
/glade/u/home/dcherian/miniconda3/envs/dcpy/lib/python3.8/site-packages/xarray/core/nanops.py:142: RuntimeWarning: Mean of empty slice
  return np.nanmean(a, axis=axis, dtype=dtype)
../datasets/adcp/33RO20071215_rb0711_01079_short.nc
33RO20071215
Found 33RO20071215 at index 29.
/glade/u/home/dcherian/miniconda3/envs/dcpy/lib/python3.8/site-packages/xarray/core/nanops.py:142: RuntimeWarning: Mean of empty slice
  return np.nanmean(a, axis=axis, dtype=dtype)
['2007-12-26T11:13:00.000000000']
/glade/u/home/dcherian/miniconda3/envs/dcpy/lib/python3.8/site-packages/xarray/core/nanops.py:142: RuntimeWarning: Mean of empty slice
  return np.nanmean(a, axis=axis, dtype=dtype)
/glade/u/home/dcherian/miniconda3/envs/dcpy/lib/python3.8/site-packages/xarray/core/nanops.py:142: RuntimeWarning: Mean of empty slice
  return np.nanmean(a, axis=axis, dtype=dtype)
/glade/u/home/dcherian/python/dcpy/dcpy/plots.py:968: UserWarning: FixedFormatter should only be used together with FixedLocator
  ax.set_xlabel("")
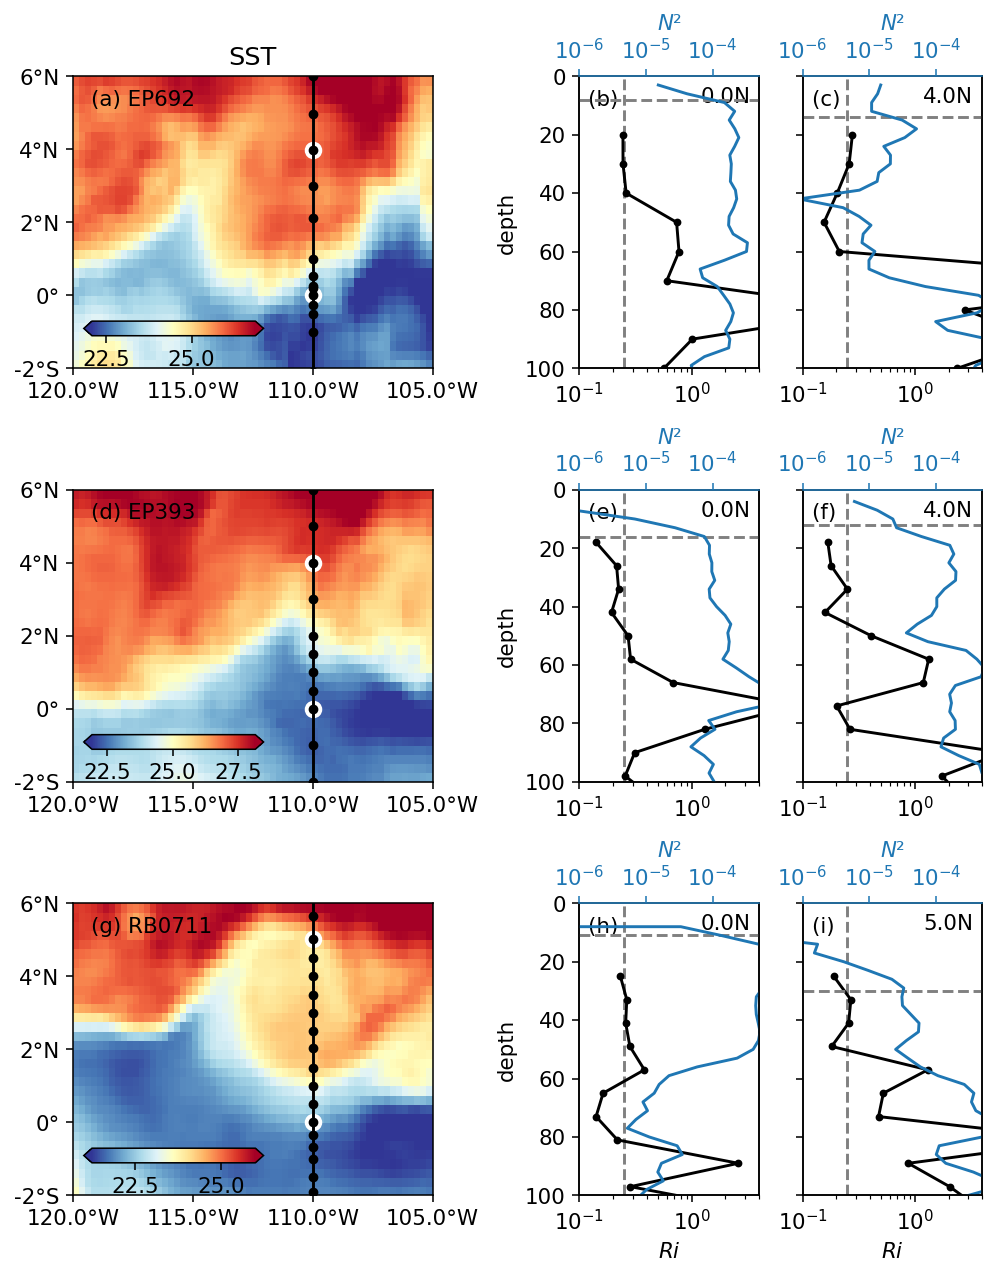
OSM20 figure#
expocode, ctd, adcp, binned = process_file(adcp_files[1])
31DSEP393
Found 31DSEP393 at index 24.
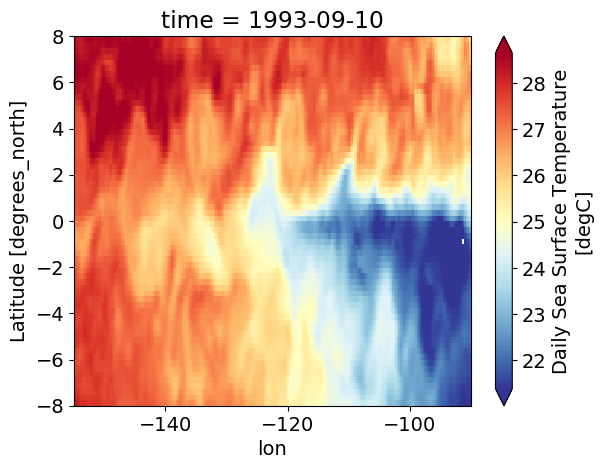
oisst.sel(time="1993-").plot(robust=True, cmap=mpl.cm.RdYlBu_r)
<matplotlib.collections.QuadMesh at 0x2b7c3af51890>
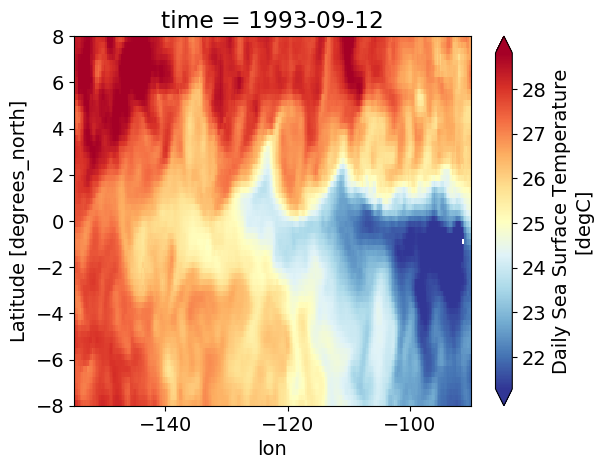
oisst.sel(
    time=ctd.time.sel(latitude=0, method="nearest").time.values, method="nearest"
).plot(cmap=mpl.cm.RdYlBu_r, robust=True)
<matplotlib.collections.QuadMesh at 0x2b7c340f7350>
%matplotlib inline

plt.rcParams["font.size"] = 14

f, ax = plt.subplots(
    3,
    3,
    gridspec_kw=dict(width_ratios=[2, 1, 1]),
    # sharex="col",
    sharey="col",
    constrained_layout=True,
)

expected_lat = [0, 1, 3, 4]

for index, (file, lats) in enumerate(
    zip(
        np.array(adcp_files)[[2, 1, 7]],
        [
            [0, 4],
            [0, 4],
            [0, 5],
        ],
    )
):
    print(file)
    expocode, ctd, adcp, binned = process_file(file)
    axx = dict()
    axx["sst"] = ax[index, 0]
    axx["lats"] = ax[index, 1:]

    pump.sections.plot_row(ctd, adcp, binned, oisst, axx, lats)

[axx.set_xlabel("") for axx in ax[:-1, :].flat]
f.set_size_inches((7, 9))
# f.savefig("cruise-Ri-summary.png")
../datasets/adcp/31DSEP692_2_00295v3.nc
31DSEP692
Found 31DSEP692 at index 10.
/glade/u/home/dcherian/python/xarray/xarray/core/nanops.py:142: RuntimeWarning: Mean of empty slice
  return np.nanmean(a, axis=axis, dtype=dtype)
/glade/u/home/dcherian/python/xarray/xarray/core/nanops.py:142: RuntimeWarning: Mean of empty slice
  return np.nanmean(a, axis=axis, dtype=dtype)
../datasets/adcp/31DSEP393_1_00210_short.nc
31DSEP393
Found 31DSEP393 at index 24.
/glade/u/home/dcherian/python/xarray/xarray/core/nanops.py:142: RuntimeWarning: Mean of empty slice
  return np.nanmean(a, axis=axis, dtype=dtype)
../datasets/adcp/33RO20071215_rb0711_01079_short.nc
33RO20071215
Found 33RO20071215 at index 29.
/glade/u/home/dcherian/python/xarray/xarray/core/nanops.py:142: RuntimeWarning: Mean of empty slice
  return np.nanmean(a, axis=axis, dtype=dtype)
/glade/u/home/dcherian/python/xarray/xarray/core/nanops.py:142: RuntimeWarning: Mean of empty slice
  return np.nanmean(a, axis=axis, dtype=dtype)
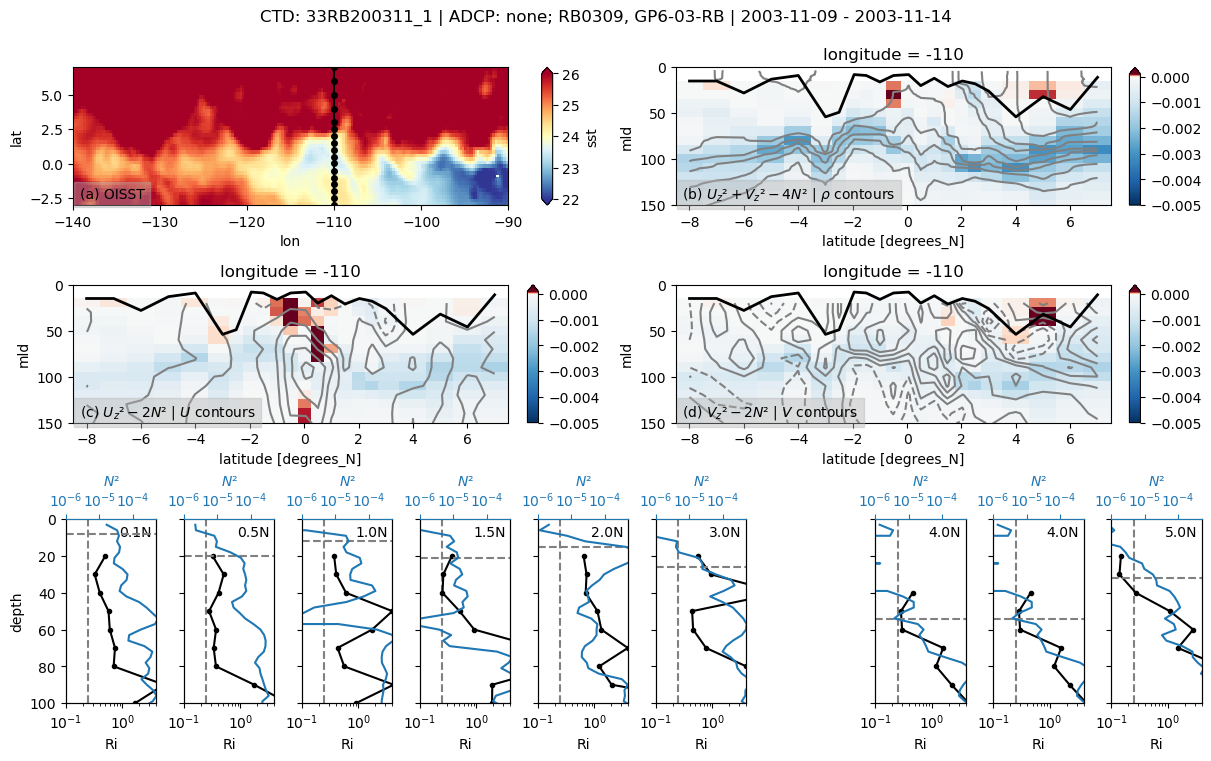
debug particular sections#
CLIVAR P18 2007#
file = "../datasets/adcp/33RO20071215_rb0711_01079_short.nc"
expocode = os.path.split(file)[-1].split("_")[0].strip()
ctd = pump.sections.find_cruise(cruises, expocode)
adcp = pump.sections.read_adcp(file, -110)
ctd = ctd.sortby("time")
ctd, adcp = pump.sections.trim_ctd_adcp(ctd, adcp)
Found 33RO20071215 at index 29.
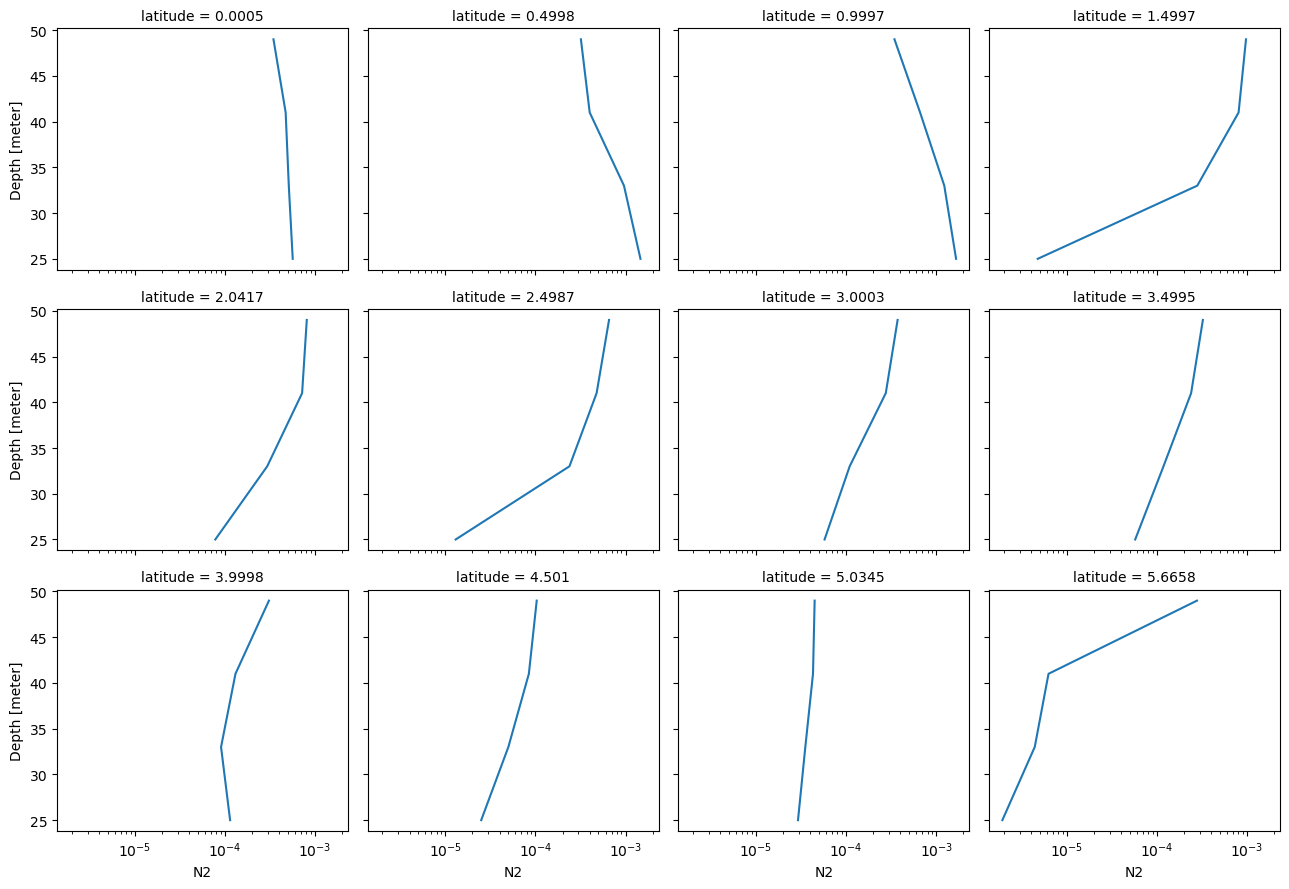
binned.N2.sortby("latitude").sel(latitude=slice(0, 6), depth=slice(0, 50)).plot.line(
    col="latitude", col_wrap=4, y="depth", xscale="log"
)
<xarray.plot.facetgrid.FacetGrid at 0x2adf746cbad0>
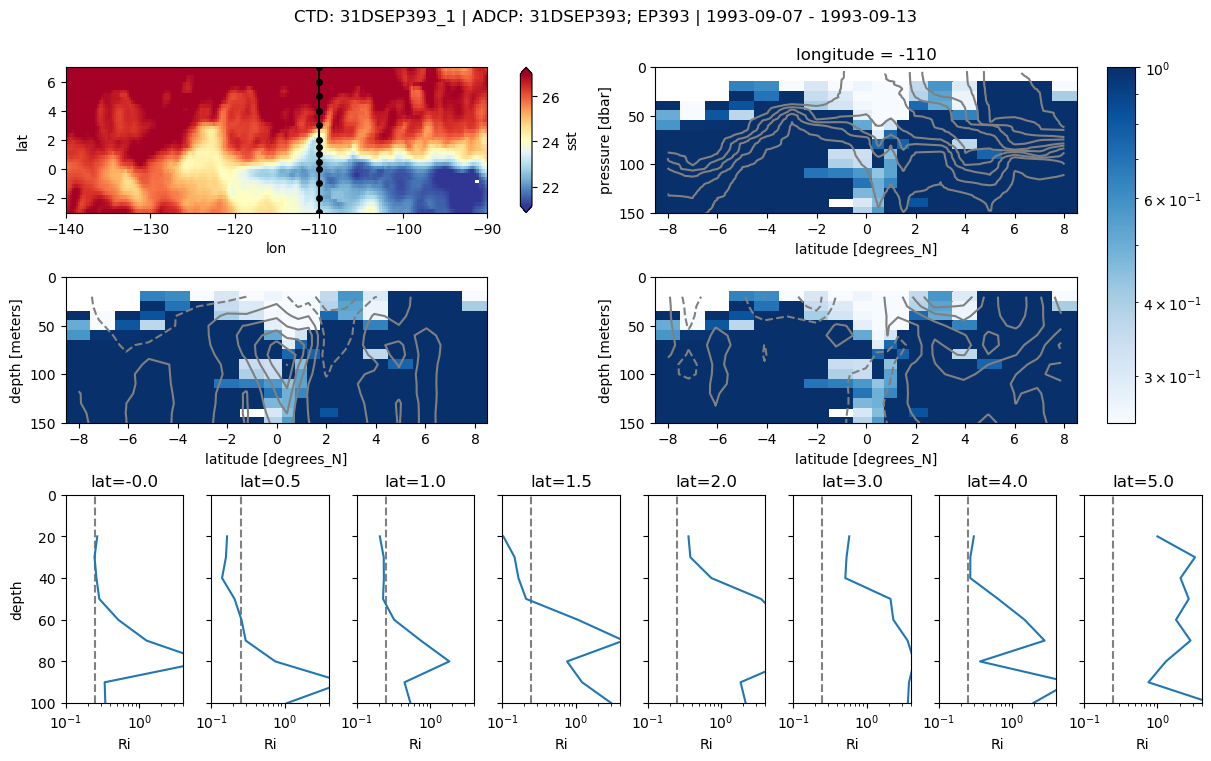
%matplotlib inline
binned = pump.sections.grid_ctd_adcp(ctd, adcp)
f, ax = pump.sections.plot_section(ctd, adcp, binned, oisst)
/glade/u/home/dcherian/python/xarray/xarray/core/nanops.py:142: RuntimeWarning: Mean of empty slice
  return np.nanmean(a, axis=axis, dtype=dtype)
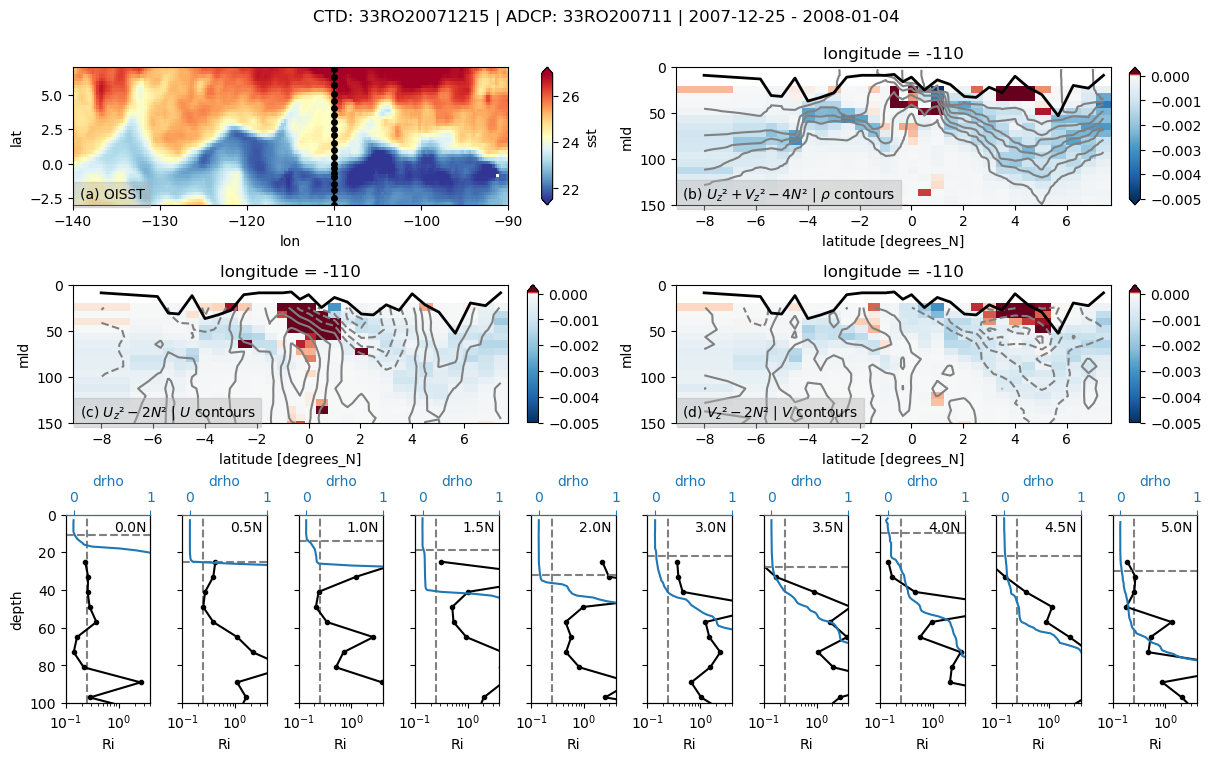
f.savefig(f"../images/cruise-sections/33RO20071215.png", bbox_inches="tight", dpi=200)
Discoverer EP391#
# _, ctd, adcp, binned = process_file(adcp_files[0])
f = plot_section(ctd, adcp, binned);
/glade/u/home/dcherian/miniconda3/envs/dcpy_updated/lib/python3.7/site-packages/matplotlib/colors.py:1110: RuntimeWarning: invalid value encountered in less_equal
  mask |= resdat <= 0
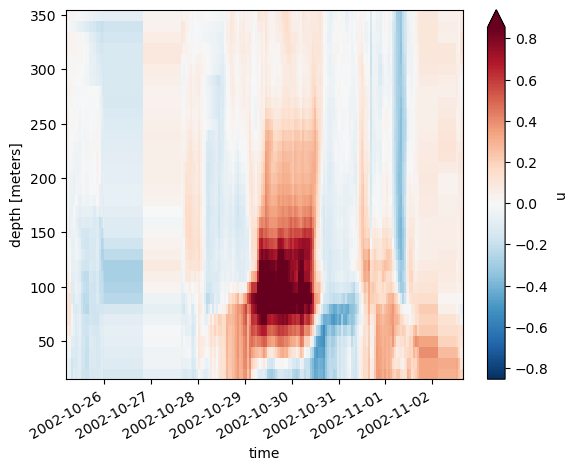
adcp.u.plot(x="time", robust=True)
<matplotlib.collections.QuadMesh at 0x2b7232572d10>
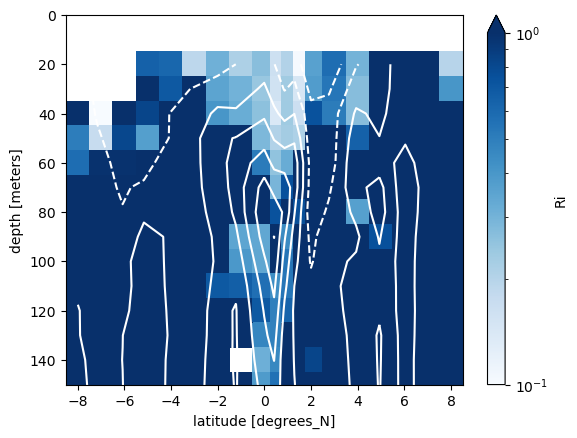
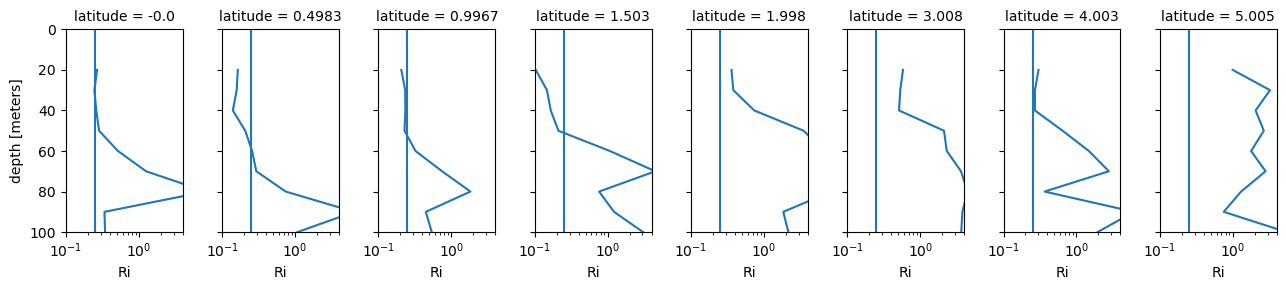
test plots#
binned.Ri.plot(
    y="depth", yincrease=False, norm=mpl.colors.LogNorm(0.1, 1), cmap=mpl.cm.Blues
)
adcp.u.plot.contour(y="depth", colors="w", levels=10, ylim=(150, 0))
<matplotlib.contour.QuadContourSet at 0x2aadd5ae2850>
fg = binned.Ri.sel(latitude=slice(0, 6)).plot(
    col="latitude",
    y="depth",
    xscale="log",
    yincrease=False,
    xlim=(0.1, 4),
    ylim=(100, 0),
    aspect=1 / 2,
)
[ax.axvline(0.25) for ax in fg.axes.flat]
[<matplotlib.lines.Line2D at 0x2b723679a490>,
 <matplotlib.lines.Line2D at 0x2b7236f16a10>,
 <matplotlib.lines.Line2D at 0x2b7236f1e750>,
 <matplotlib.lines.Line2D at 0x2b7236f1efd0>,
 <matplotlib.lines.Line2D at 0x2b7236f2b490>,
 <matplotlib.lines.Line2D at 0x2b7236f1e6d0>,
 <matplotlib.lines.Line2D at 0x2b7236f16210>,
 <matplotlib.lines.Line2D at 0x2b7236f06290>]
adcp.v.differentiate("depth").plot(x="time", y="depth", yincrease=False, robust=True)
<matplotlib.collections.QuadMesh at 0x2b8b1ad84be0>