miχpods: MOM6 dev#
This is a development notebook and has many work-in-progress things.
daily cycle diagnostics
more wind dependencies figures + timing of descent marks
check background mixing formulation
bootstrap error on mean, median?
fix EUC max at 110
figure out time base
shear spectra
plot mean, medians on histograms.
Notes:#
Diagnostic notes/improvements#
match vertical resolution and extent
restrict TAO S2 to ADCP depth range
restrict to top 200m.
Filtering out MLD makes a big difference!
SInce we’re working with derivatives does the vertical grid matter (as long as it is coarser than observations)?
1 difvho ocean_vertical_heat_diffusivity
2 difvso ocean_vertical_salt_diffusivity
Future model simulations#
Need lateral / neutral terms for total χ, ε
Add Atlantic TAO moorings + LOTUS, PAPA, others used in LMD94
Fix restart issue
Uncertainties#
Why can’t I reproduce the ε figure?
Why can’t I save the new station data
Need to consider Ri smoothing in models: From Gustavo:
You mentioned some kind of inconsistency between your diagnostics and what MOM6 was doing for the interior shear mixing scheme. I am working to implement the option to apply vertical smoothing in Ri multiple times, instead of only once which is what we are doing right now. I noticed that the diagnostic
ri_grad_shearis saved before the smoothing is applied. There is another diagnostic (ri_grad_shear_smooth) that saves the smoothed Ri. Perhaps you were looking at ri_grad_shear instead of ri_grad_shear_smooth and this can explain the inconsistency.
Diagnostics Effort notes#
go through
prepare; pass in dataset and optionalxgcm.Griddifferent pre-processing steps for different datasets
order, sign of z coordinate is painful; here normalizing
composing with matplotlib subfigures
References#
Warner & Moum (2019)
Setup#
Show code cell source
%load_ext autoreload
%load_ext rich
%load_ext watermark
import warnings
import cf_xarray as cfxr
import dask
import dask_jobqueue
import dcpy
import distributed
import flox.xarray
import holoviews as hv
import matplotlib as mpl
import matplotlib.pyplot as plt
import numpy as np
import pandas as pd
import tqdm
import xgcm
import xrft
from datatree import DataTree
from mom6_tools.sections import preprocess_mom6_sections
from pump.catalog import catalog_dict
import xarray as xr
from holoviews.plotting.bokeh.util import select_legends
%aimport pump
from pump import mixpods
hv.notebook_extension("bokeh")
cfxr.set_options(warn_on_missing_variables=False)
xr.set_options(keep_attrs=True, display_expand_data=False)
plt.style.use("bmh")
plt.rcParams["figure.dpi"] = 140
mixing_layer_depth_criteria = {
"boundary_layer_depth": {"name": "KPPhbl|KPP_OBLdepth|ePBL_h_ML"},
}
%watermark -iv
Show code cell output
The autoreload extension is already loaded. To reload it, use:
%reload_ext autoreload
/glade/u/home/dcherian/miniconda3/envs/pump/lib/python3.10/site-packages/dask_jobqueue/core.py:20: FutureWarning: tmpfile is deprecated and will be removed in a future release. Please use dask.utils.tmpfile instead.
from distributed.utils import tmpfile
cf_xarray : 0.8.0
xrft : 0.0.0
flox : 0.6.10
xarray : 2023.3.0
pump : 1.0+266.g796539e.dirty
matplotlib : 3.7.1
numpy : 1.23.5
pandas : 1.5.3
holoviews : 1.15.4
tqdm : 4.65.0
xgcm : 0.6.1
dcpy : 0.1.dev387+gd06c937
dask : 2023.3.2
dask_jobqueue: 0.7.3
distributed : 2023.3.2
Show code cell source
if "client" in locals():
client.close()
del client
if "cluster" in locals():
cluster.close()
cluster = dask_jobqueue.PBSCluster(
cores=4, # The number of cores you want
memory="23GB", # Amount of memory
processes=1, # How many processes
queue="casper", # The type of queue to utilize (/glade/u/apps/dav/opt/usr/bin/execcasper)
local_directory="/local_scratch/pbs.$PBS_JOBID/dask/spill",
log_directory="/glade/scratch/dcherian/dask/",
resource_spec="select=1:ncpus=4:mem=23GB", # Specify resources
project="ncgd0011", # Input your project ID here
walltime="02:00:00", # Amount of wall time
interface="ib0", # Interface to use
)
cluster.adapt(minimum_jobs=1, maximum_jobs=4)
client = distributed.Client(cluster)
client
Show code cell output
Client
Client-a7da0dfc-f066-11ed-90a6-3cecef1ac636
| Connection method: Cluster object | Cluster type: dask_jobqueue.PBSCluster |
| Dashboard: https://jupyterhub.hpc.ucar.edu/stable/user/dcherian/proxy/8787/status |
Cluster Info
PBSCluster
e7841256
| Dashboard: https://jupyterhub.hpc.ucar.edu/stable/user/dcherian/proxy/8787/status | Workers: 0 |
| Total threads: 0 | Total memory: 0 B |
Scheduler Info
Scheduler
Scheduler-7bf67b0b-ab8c-471a-83f4-c4c6cd87c8dc
| Comm: tcp://10.12.206.21:43727 | Workers: 0 |
| Dashboard: https://jupyterhub.hpc.ucar.edu/stable/user/dcherian/proxy/8787/status | Total threads: 0 |
| Started: Just now | Total memory: 0 B |
Workers
Read data#
LES#
%autoreload
les = mixpods.load_les_moorings()
--> The keys in the returned dictionary of datasets are constructed as follows:
'latitude.longitude.month.kind.length'
microstructure#
micro = mixpods.load_microstructure()
micro
/glade/u/home/dcherian/miniconda3/envs/pump/lib/python3.10/site-packages/xarray/core/computation.py:771: RuntimeWarning: invalid value encountered in log10
result_data = func(*input_data)
/glade/u/home/dcherian/miniconda3/envs/pump/lib/python3.10/site-packages/xarray/core/computation.py:771: RuntimeWarning: invalid value encountered in log10
result_data = func(*input_data)
/glade/u/home/dcherian/miniconda3/envs/pump/lib/python3.10/site-packages/xarray/core/computation.py:771: RuntimeWarning: divide by zero encountered in log10
result_data = func(*input_data)
/glade/u/home/dcherian/miniconda3/envs/pump/lib/python3.10/site-packages/xarray/core/computation.py:771: RuntimeWarning: invalid value encountered in log10
result_data = func(*input_data)
/glade/u/home/dcherian/miniconda3/envs/pump/lib/python3.10/site-packages/xarray/core/computation.py:771: RuntimeWarning: invalid value encountered in log10
result_data = func(*input_data)
/glade/u/home/dcherian/miniconda3/envs/pump/lib/python3.10/site-packages/xarray/core/computation.py:771: RuntimeWarning: invalid value encountered in log10
result_data = func(*input_data)
/glade/u/home/dcherian/miniconda3/envs/pump/lib/python3.10/site-packages/xarray/core/computation.py:771: RuntimeWarning: invalid value encountered in log10
result_data = func(*input_data)
<xarray.DatasetView>
Dimensions: ()
Data variables:
*empty*TAO#
tao_Ri = xr.load_dataarray(
"tao-hourly-Ri-seasonal-percentiles.nc"
).cf.guess_coord_axis()
%autoreload
with dask.config.set(scheduler="threads"):
tao_gridded = mixpods.load_tao()
tao_gridded
╭─────────────────────────────── Traceback (most recent call last) ────────────────────────────────╮ │ /glade/u/home/dcherian/miniconda3/envs/pump/lib/python3.10/site-packages/xarray/backends/zarr.py │ │ :405 in open_group │ │ │ │ 402 │ │ │ │ 403 │ │ if consolidated is None: │ │ 404 │ │ │ try: │ │ ❱ 405 │ │ │ │ zarr_group = zarr.open_consolidated(store, **open_kwargs) │ │ 406 │ │ │ except KeyError: │ │ 407 │ │ │ │ try: │ │ 408 │ │ │ │ │ zarr_group = zarr.open_group(store, **open_kwargs) │ │ │ │ /glade/u/home/dcherian/miniconda3/envs/pump/lib/python3.10/site-packages/zarr/convenience.py:129 │ │ 9 in open_consolidated │ │ │ │ 1296 │ │ │ metadata_key = 'meta/root/consolidated/' + metadata_key │ │ 1297 │ │ │ 1298 │ # setup metadata store │ │ ❱ 1299 │ meta_store = ConsolidatedStoreClass(store, metadata_key=metadata_key) │ │ 1300 │ │ │ 1301 │ # pass through │ │ 1302 │ chunk_store = kwargs.pop('chunk_store', None) or store │ │ │ │ /glade/u/home/dcherian/miniconda3/envs/pump/lib/python3.10/site-packages/zarr/storage.py:2886 in │ │ __init__ │ │ │ │ 2883 │ │ self.store = Store._ensure_store(store) │ │ 2884 │ │ │ │ 2885 │ │ # retrieve consolidated metadata │ │ ❱ 2886 │ │ meta = json_loads(self.store[metadata_key]) │ │ 2887 │ │ │ │ 2888 │ │ # check format of consolidated metadata │ │ 2889 │ │ consolidated_format = meta.get('zarr_consolidated_format', None) │ │ │ │ /glade/u/home/dcherian/miniconda3/envs/pump/lib/python3.10/site-packages/zarr/storage.py:1087 in │ │ __getitem__ │ │ │ │ 1084 │ │ if os.path.isfile(filepath): │ │ 1085 │ │ │ return self._fromfile(filepath) │ │ 1086 │ │ else: │ │ ❱ 1087 │ │ │ raise KeyError(key) │ │ 1088 │ │ │ 1089 │ def __setitem__(self, key, value): │ │ 1090 │ │ key = self._normalize_key(key) │ ╰──────────────────────────────────────────────────────────────────────────────────────────────────╯ KeyError: '.zmetadata' During handling of the above exception, another exception occurred: ╭─────────────────────────────── Traceback (most recent call last) ────────────────────────────────╮ │ /glade/u/home/dcherian/miniconda3/envs/pump/lib/python3.10/site-packages/xarray/backends/zarr.py │ │ :408 in open_group │ │ │ │ 405 │ │ │ │ zarr_group = zarr.open_consolidated(store, **open_kwargs) │ │ 406 │ │ │ except KeyError: │ │ 407 │ │ │ │ try: │ │ ❱ 408 │ │ │ │ │ zarr_group = zarr.open_group(store, **open_kwargs) │ │ 409 │ │ │ │ │ warnings.warn( │ │ 410 │ │ │ │ │ │ "Failed to open Zarr store with consolidated metadata, " │ │ 411 │ │ │ │ │ │ "but successfully read with non-consolidated metadata. " │ │ │ │ /glade/u/home/dcherian/miniconda3/envs/pump/lib/python3.10/site-packages/zarr/hierarchy.py:1443 │ │ in open_group │ │ │ │ 1440 │ │ if not contains_group(store, path=path): │ │ 1441 │ │ │ if contains_array(store, path=path): │ │ 1442 │ │ │ │ raise ContainsArrayError(path) │ │ ❱ 1443 │ │ │ raise GroupNotFoundError(path) │ │ 1444 │ │ │ 1445 │ elif mode == 'w': │ │ 1446 │ │ init_group(store, overwrite=True, path=path, chunk_store=chunk_store) │ ╰──────────────────────────────────────────────────────────────────────────────────────────────────╯ GroupNotFoundError: group not found at path '' During handling of the above exception, another exception occurred: ╭─────────────────────────────── Traceback (most recent call last) ────────────────────────────────╮ │ /glade/scratch/dcherian/tmp/ipykernel_11229/2826082590.py:4 in <module> │ │ │ │ [Errno 2] No such file or directory: '/glade/scratch/dcherian/tmp/ipykernel_11229/2826082590.py' │ │ │ │ /glade/u/home/dcherian/pump/pump/mixpods.py:1317 in load_tao │ │ │ │ 1314 def load_tao(): │ │ 1315 │ from .obs import process_oni │ │ 1316 │ │ │ ❱ 1317 │ tao_gridded = xr.open_dataset( │ │ 1318 │ │ os.path.expanduser(f"{ROOT}/zarrs/tao-gridded-ancillary.zarr"), │ │ 1319 │ │ chunks="auto", │ │ 1320 │ │ engine="zarr", │ │ │ │ /glade/u/home/dcherian/miniconda3/envs/pump/lib/python3.10/site-packages/xarray/backends/api.py: │ │ 526 in open_dataset │ │ │ │ 523 │ ) │ │ 524 │ │ │ 525 │ overwrite_encoded_chunks = kwargs.pop("overwrite_encoded_chunks", None) │ │ ❱ 526 │ backend_ds = backend.open_dataset( │ │ 527 │ │ filename_or_obj, │ │ 528 │ │ drop_variables=drop_variables, │ │ 529 │ │ **decoders, │ │ │ │ /glade/u/home/dcherian/miniconda3/envs/pump/lib/python3.10/site-packages/xarray/backends/zarr.py │ │ :891 in open_dataset │ │ │ │ 888 │ │ zarr_version=None, │ │ 889 │ ): │ │ 890 │ │ filename_or_obj = _normalize_path(filename_or_obj) │ │ ❱ 891 │ │ store = ZarrStore.open_group( │ │ 892 │ │ │ filename_or_obj, │ │ 893 │ │ │ group=group, │ │ 894 │ │ │ mode=mode, │ │ │ │ /glade/u/home/dcherian/miniconda3/envs/pump/lib/python3.10/site-packages/xarray/backends/zarr.py │ │ :425 in open_group │ │ │ │ 422 │ │ │ │ │ │ stacklevel=stacklevel, │ │ 423 │ │ │ │ │ ) │ │ 424 │ │ │ │ except zarr.errors.GroupNotFoundError: │ │ ❱ 425 │ │ │ │ │ raise FileNotFoundError(f"No such file or directory: '{store}'") │ │ 426 │ │ elif consolidated: │ │ 427 │ │ │ # TODO: an option to pass the metadata_key keyword │ │ 428 │ │ │ zarr_group = zarr.open_consolidated(store, **open_kwargs) │ ╰──────────────────────────────────────────────────────────────────────────────────────────────────╯ FileNotFoundError: No such file or directory: '/glade/campaign/cgd/oce/projects/pump/zarrs/tao-gridded-ancillary.zarr'
np.log10(tao_gridded.eps).sel(time=slice("2005", "2015")).resample(
time="M"
).mean().hvplot.quadmesh(clim=(-7.5, -6))
sub.v.hvplot()
sub = tao_gridded.sel(time="2010-01")
t = sub.theta.hvplot.quadmesh(cmap="turbo_r")
dt = (
sub.theta - sub.theta.reset_coords(drop=True).cf.sel(Z=[0, -5]).cf.max("Z")
).hvplot.quadmesh(clim=(-0.15, 0.15), cmap="RdBu_r")
newmld = mixpods.get_mld_tao_theta(sub.theta.reset_coords(drop=True))
(
dt
* sub.reset_coords().mldT.hvplot.line(color="w", line_width=2)
* newmld.reset_coords(drop=True).hvplot.line(color="orange", line_width=1)
).opts(frame_width=1200)
(
tao_gridded.reset_coords().mldT.resample(time="5D").mean().hvplot.line()
* mixpods.get_mld_tao_theta(tao_gridded.reset_coords().theta)
.resample(time="5D")
.mean()
.hvplot.line()
)
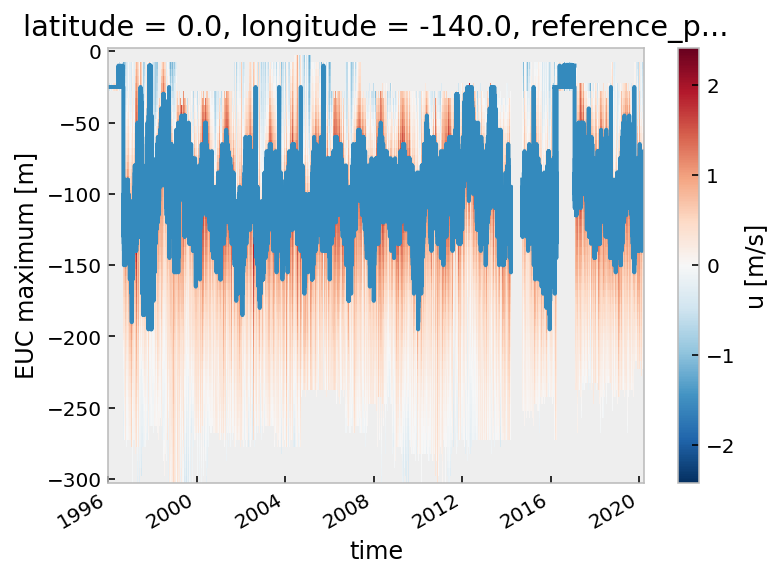
tao_gridded.u.cf.plot()
tao_gridded.eucmax.plot()
[<matplotlib.lines.Line2D>]
MITgcm stations#
stations = pump.model.read_stations_20(stationdirname)
gcmeq = stations.sel(
longitude=[-155.025, -140.025, -125.025, -110.025], method="nearest"
)
# enso = pump.obs.make_enso_mask()
# mitgcm["enso"] = enso.reindex(time=mitgcm.time.data, method="nearest")
# gcmeq["eucmax"] = pump.calc.get_euc_max(gcmeq.u)
# pump.calc.calc_reduced_shear(gcmeq)
# oni = pump.obs.process_oni()
# gcmeq["enso_transition"] = mixpods.make_enso_transition_mask(oni).reindex(time=gcmeq.time.data, method="nearest")
mitgcm = gcmeq.sel(longitude=-140.025, method="nearest")
metrics = mixpods.normalize_z(pump.model.read_metrics(stationdirname), sort=True)
mitgcm = mixpods.normalize_z(mitgcm, sort=True)
mitgcm_grid = xgcm.Grid(
metrics.sel(latitude=mitgcm.latitude, longitude=mitgcm.longitude, method="nearest"),
coords=({"Z": {"center": "depth", "outer": "RF"}, "Y": {"center": "latitude"}}),
metrics={"Z": ("drF", "drC")},
periodic=False,
boundary="fill",
fill_value=np.nan,
)
mitgcm.theta.attrs["standard_name"] = "sea_water_potential_temperature"
mitgcm.salt.attrs["standard_name"] = "sea_water_salinity"
mitgcm["KPPviscAz"].attrs["standard_name"] = "ocean_vertical_viscosity"
mitgcm["KPPdiffKzT"].attrs["standard_name"] = "ocean_vertical_heat_diffusivity"
/glade/u/home/dcherian/miniconda3/envs/pump/lib/python3.10/site-packages/xarray/core/indexing.py:1374: PerformanceWarning: Slicing is producing a large chunk. To accept the large
chunk and silence this warning, set the option
>>> with dask.config.set(**{'array.slicing.split_large_chunks': False}):
... array[indexer]
To avoid creating the large chunks, set the option
>>> with dask.config.set(**{'array.slicing.split_large_chunks': True}):
... array[indexer]
return self.array[key]
mitgcm = (
mixpods.prepare(mitgcm, grid=mitgcm_grid, oni=pump.obs.process_oni())
.sel(latitude=0, method="nearest")
.cf.sel(Z=slice(-250, 0))
)
mitgcm_grid
<xgcm.Grid>
Z Axis (not periodic, boundary='fill'):
* center depth --> outer
* outer RF --> center
Y Axis (not periodic, boundary='fill'):
* center latitude
mitgcm.u.cf.plot()
mitgcm.mldT.reset_coords(drop=True).cf.plot()
mitgcm.eucmax.reset_coords(drop=True).cf.plot()
[<matplotlib.lines.Line2D>]
mixpods.plot_n2s2pdf(mitgcm.n2s2pdf.sel(enso_transition_phase="none"))
<matplotlib.contour.QuadContourSet>
MOM6#
Generate kechunk JSONs#
catalog_sub = {k: v for k, v in catalog_dict.items() if k}
catalog_sub
{ 'baseline.001': ('baseline', 'gmom.e23.GJRAv3.TL319_t061_zstar_N65.baseline.001.mixpods'), 'epbl': ('ePBL', 'gmom.e23.GJRAv3.TL319_t061_zstar_N65.baseline.epbl.001.mixpods'), 'kpp.lmd.002': ( 'KPP Ri0=0.5', 'gmom.e23.GJRAv3.TL319_t061_zstar_N65.baseline.kpp.lmd.002.mixpods' ), 'kpp.lmd.003': ( 'KPP Ri0=0.5, Ric=0.2,', 'gmom.e23.GJRAv3.TL319_t061_zstar_N65.baseline.kpp.lmd.003.mixpods' ), 'kpp.lmd.004': ( 'KPP ν0=2.5, Ric=0.2, Ri0=0.5', 'gmom.e23.GJRAv3.TL319_t061_zstar_N65.baseline.kpp.lmd.004.mixpods' ), 'baseline.N150': ('baseline N=150', 'gmom.e23.GJRAv3.TL319_t061_zstar_N150.baseline.mixpods'), 'kpp.lmd.004.N150': ( 'KPP ν0=2.5, Ric=0.2, Ri0=0.5, N=150', 'gmom.e23.GJRAv3.TL319_t061_zstar_N150.kpp.lmd.004.mixpods' ), 'baseline.hb': ('baseline', 'gmom.e23.GJRAv3.TL319_t061_zstar_N65.baseline.hb'), 'new_baseline.hb': ('KD=0, KV=0', 'gmom.e23.GJRAv3.TL319_t061_zstar_N65.new_baseline.hb'), 'new_baseline.kpp.lmd.004': ( 'KPP ν0=2.5, Ric=0.2, Ri0=0.5', 'gmom.e23.GJRAv3.TL319_t061_zstar_N65.new_baseline.kpp.lmd.004.mixpods' ), 'new_baseline.kpp.lmd.005': ( 'KPP ν0=2.5, Ri0=0.5', 'gmom.e23.GJRAv3.TL319_t061_zstar_N65.new_baseline.kpp.lmd.005.mixpods' ) }
%autoreload
from mom6_tools.kerchunk import generate_references_for_stream
for _, casename in tqdm.tqdm(catalog_sub.values()):
caseroot = f"{mixpods.ROOT}/cesm/{casename}"
if "N150" in casename:
continue
print(caseroot)
for stream in ["h", "hm", "hm.wci", "sfc"]:
generate_references_for_stream(
caseroot=caseroot,
stream=stream,
missing_stream="warn",
existing_output="overwrite",
)
../pump-catalog catalog with 4 dataset(s) from 4 asset(s):
| unique | |
|---|---|
| casename | 1 |
| stream | 4 |
| path | 4 |
| baseline | 1 |
| levels | 1 |
| frequency | 1 |
| variables | 75 |
| shortname | 1 |
| description | 1 |
| derived_variables | 0 |
0%| | 0/1 [00:00<?, ?it/s]
/glade/campaign/cgd/oce/projects/pump//cesm/gmom.e23.GJRAv3.TL319_t061_zstar_N65.baseline.001.mixpods
/glade/u/home/dcherian/python/mom6-tools/mom6_tools/kerchunk.py:104: RuntimeWarning: No files found for caseroot: /glade/campaign/cgd/oce/projects/pump//cesm/gmom.e23.GJRAv3.TL319_t061_zstar_N65.baseline.001.mixpods, stream: hm.wci
warnings.warn(f"No files found for caseroot: {caseroot}, stream: {stream}", RuntimeWarning)
100%|██████████| 1/1 [01:34<00:00, 94.96s/it]
calculate ONI#
(
oniobs.hvplot.line(x="time", label="obs")
* onimom6.hvplot.line(x="time", label="MOM6")
).opts(ylabel="ONI [°C]")
oniobs.enso_transition_mask.plot()
onimom6.enso_transition_mask.plot(color="r")
[<matplotlib.lines.Line2D>]
MOM6 sections#
Combine sections#
catalog
{ 'baseline': ('baseline', 'gmom.e23.GJRAv3.TL319_t061_zstar_N65.baseline.001.mixpods'), 'epbl': ('ePBL', 'gmom.e23.GJRAv3.TL319_t061_zstar_N65.baseline.epbl.001.mixpods'), 'kpp.lmd.002': ( 'KPP Ri0=0.5', 'gmom.e23.GJRAv3.TL319_t061_zstar_N65.baseline.kpp.lmd.002.mixpods' ), 'kpp.lmd.003': ( 'KPP Ri0=0.5, Ric=0.2,', 'gmom.e23.GJRAv3.TL319_t061_zstar_N65.baseline.kpp.lmd.003.mixpods' ), 'kpp.lmd.004': ( 'KPP ν0=2.5, Ric=0.2, Ri0=0.5', 'gmom.e23.GJRAv3.TL319_t061_zstar_N65.baseline.kpp.lmd.004.mixpods' ), 'baseline.N150': ('baseline N=150', 'gmom.e23.GJRAv3.TL319_t061_zstar_N150.baseline.mixpods'), 'kpp.lmd.004.N150': ( 'KPP ν0=2.5, Ric=0.2, Ri0=0.5, N=150', 'gmom.e23.GJRAv3.TL319_t061_zstar_N150.kpp.lmd.004.mixpods' ), 'new_baseline.hb': ('KD=0, KV=0', 'gmom.e23.GJRAv3.TL319_t061_zstar_N65.new_baseline.hb'), 'new_baseline.kpp.lmd.004': ( 'KPP ν0=2.5, Ric=0.2, Ri0=0.5', 'gmom.e23.GJRAv3.TL319_t061_zstar_N65.new_baseline.kpp.lmd.004.mixpods' ), 'new_baseline.kpp.lmd.005': ( 'KPP ν0=2.5, Ri0=0.5', 'gmom.e23.GJRAv3.TL319_t061_zstar_N65.new_baseline.kpp.lmd.005.mixpods' ) }
casename = "gmom.e23.GJRAv3.TL319_t061_zstar_N65.new_baseline.kpp.lmd.005.mixpods"
ds = mixpods.read_mom6_sections(casename)
100%|██████████| 39/39 [02:32<00:00, 3.90s/it]
ds.drop_vars(
["average_DT", "average_T2", "average_T1", "time_bnds"], errors="ignore"
).chunk({"time": 24 * 365}).to_zarr(
f"/glade/scratch/dcherian/archive/{casename}/ocn/moorings/tao.zarr",
consolidated=True,
mode="w",
)
<xarray.backends.zarr.ZarrStore object at 0x2aafa7cb0c10>
reload = mixpods.load_mom6_sections(casename)
reload.uo.count().compute()
%autoreload
casename = "gmom.e23.GJRAv3.TL319_t061_zstar_N65.new_baseline.kpp.lmd.005.mixpods"
casename = mixpods.mom6_sections_to_zarr(casename)
100%|██████████| 33/33 [00:55<00:00, 1.69s/it]
%autoreload
casename = "gmom.e23.GJRAv3.TL319_t061_zstar_N65.new_baseline.kpp.lmd.004.mixpods"
mixpods.mom6_sections_to_zarr(casename)
100%|██████████| 33/33 [00:59<00:00, 1.81s/it]
casename = "gmom.e23.GJRAv3.TL319_t061_zstar_N150.baseline.mixpods"
mixpods.mom6_sections_to_zarr(casename)
100%|██████████| 39/39 [00:29<00:00, 1.30it/s]
casename = "gmom.e23.GJRAv3.TL319_t061_zstar_N65.baseline.001.mixpods"
mixpods.mom6_sections_to_zarr(casename)
casename = "gmom.e23.GJRAv3.TL319_t061_zstar_N65.baseline.epbl.001.mixpods"
mixpods.mom6_sections_to_zarr(casename)
100%|██████████| 31/31 [01:50<00:00, 3.57s/it]
/glade/u/home/dcherian/pump/pump/mixpods.py:887: RuntimeWarning: Converting a CFTimeIndex with dates from a non-standard calendar, 'noleap', to a pandas.DatetimeIndex, which uses dates from the standard calendar. This may lead to subtle errors in operations that depend on the length of time between dates.
mom6tao["time"] = mom6tao.indexes["time"].to_datetimeindex()
casename = "gmom.e23.GJRAv3.TL319_t061_zstar_N65.baseline.kpp.lmd.002.mixpods"
mixpods.mom6_sections_to_zarr(casename)
casename = "gmom.e23.GJRAv3.TL319_t061_zstar_N65.baseline.kpp.lmd.003.mixpods"
mixpods.mom6_sections_to_zarr(casename)
100%|██████████| 38/38 [02:07<00:00, 3.36s/it]
/glade/u/home/dcherian/pump/pump/mixpods.py:900: RuntimeWarning: Converting a CFTimeIndex with dates from a non-standard calendar, 'noleap', to a pandas.DatetimeIndex, which uses dates from the standard calendar. This may lead to subtle errors in operations that depend on the length of time between dates.
mom6tao["time"] = mom6tao.indexes["time"].to_datetimeindex()
casename = "gmom.e23.GJRAv3.TL319_t061_zstar_N65.baseline.kpp.lmd.004.mixpods"
mixpods.mom6_sections_to_zarr(casename)
Read sections#
dask.config.set(scheduler=client)
m = mixpods.read_mom6_sections(
"gmom.e23.GJRAv3.TL319_t061_zstar_N65.baseline.001.mixpods"
)
/glade/u/home/dcherian/miniconda3/envs/pump/lib/python3.10/site-packages/dask_jobqueue/core.py:255: FutureWarning: job_extra has been renamed to job_extra_directives. You are still using it (even if only set to []; please also check config files). If you did not set job_extra_directives yet, job_extra will be respected for now, but it will be removed in a future release. If you already set job_extra_directives, job_extra is ignored and you can remove it.
warnings.warn(warn, FutureWarning)
/glade/u/home/dcherian/miniconda3/envs/pump/lib/python3.10/site-packages/dask_jobqueue/core.py:274: FutureWarning: env_extra has been renamed to job_script_prologue. You are still using it (even if only set to []; please also check config files). If you did not set job_script_prologue yet, env_extra will be respected for now, but it will be removed in a future release. If you already set job_script_prologue, env_extra is ignored and you can remove it.
warnings.warn(warn, FutureWarning)
/glade/u/home/dcherian/miniconda3/envs/pump/lib/python3.10/site-packages/dask_jobqueue/pbs.py:82: FutureWarning: project has been renamed to account as this kwarg was used wit -A option. You are still using it (please also check config files). If you did not set account yet, project will be respected for now, but it will be removed in a future release. If you already set account, project is ignored and you can remove it.
warnings.warn(warn, FutureWarning)
100%|██████████| 21/21 [02:14<00:00, 6.42s/it]
/glade/u/home/dcherian/miniconda3/envs/pump/lib/python3.10/site-packages/xarray/coding/times.py:360: FutureWarning: Index.ravel returning ndarray is deprecated; in a future version this will return a view on self.
sample = dates.ravel()[0]
/glade/u/home/dcherian/pump/pump/mixpods.py:847: RuntimeWarning: Converting a CFTimeIndex with dates from a non-standard calendar, 'noleap', to a pandas.DatetimeIndex, which uses dates from the standard calendar. This may lead to subtle errors in operations that depend on the length of time between dates.
mom6tao["time"] = mom6tao.indexes["time"].to_datetimeindex()
/glade/u/home/dcherian/pump/pump/mixpods.py:859: UserWarning: Kv_v not present. Assuming equal to Kv_u
warnings.warn("Kv_v not present. Assuming equal to Kv_u")
m.drop_vars(["average_DT", "average_T1", "average_T2", "time_bnds"]).chunk(
{"time": 365 * 24}
).to_zarr(
"/glade/scratch/dcherian/archive/gmom.e23.GJRAv3.TL319_t061_zstar_N65.baseline.001.mixpods/ocn/moorings/tao.zarr",
mode="w",
)
m.sel(yh=0, method="nearest")[["ePBL_h_ML", "mlotst"]].to_array().hvplot.line(
by="variable", x="time"
)
m.sel(yh=0, method="nearest")[["Kd_heat", "Kd_ePBL"]].to_array().hvplot.line(
by="variable", groupby="time", logy=True, ylim=(1e-6, 1e-1), xlim=(0, 500)
)
mom6140 = mixpods.load_mom6_sections(casename).load()
/glade/u/home/dcherian/miniconda3/envs/pump/lib/python3.10/site-packages/xgcm/grid.py:1471: UserWarning: Metric at ('time', 'zi', 'yh', 'xh') being interpolated from metrics at dimensions ('time', 'zl', 'yh', 'xh'). Boundary value set to 'extend'.
warnings.warn(
/glade/u/home/dcherian/miniconda3/envs/pump/lib/python3.10/site-packages/xgcm/grid.py:1471: UserWarning: Metric at ('time', 'zi', 'yh', 'xh') being interpolated from metrics at dimensions ('time', 'zl', 'yh', 'xh'). Boundary value set to 'extend'.
warnings.warn(
/glade/u/home/dcherian/miniconda3/envs/pump/lib/python3.10/site-packages/xgcm/grid.py:1471: UserWarning: Metric at ('time', 'zi', 'yq', 'xh') being interpolated from metrics at dimensions ('time', 'zl', 'yh', 'xh'). Boundary value set to 'extend'.
warnings.warn(
/glade/u/home/dcherian/miniconda3/envs/pump/lib/python3.10/site-packages/cf_xarray/accessor.py:1638: UserWarning: Variables {'areacello'} not found in object but are referred to in the CF attributes.
warnings.warn(
/glade/u/home/dcherian/miniconda3/envs/pump/lib/python3.10/site-packages/xgcm/grid.py:1471: UserWarning: Metric at ('time', 'zi', 'yh', 'xh') being interpolated from metrics at dimensions ('time', 'zl', 'yh', 'xh'). Boundary value set to 'extend'.
warnings.warn(
/glade/u/home/dcherian/miniconda3/envs/pump/lib/python3.10/site-packages/xgcm/grid.py:1471: UserWarning: Metric at ('time', 'zi', 'yq', 'xh') being interpolated from metrics at dimensions ('time', 'zl', 'yh', 'xh'). Boundary value set to 'extend'.
warnings.warn(
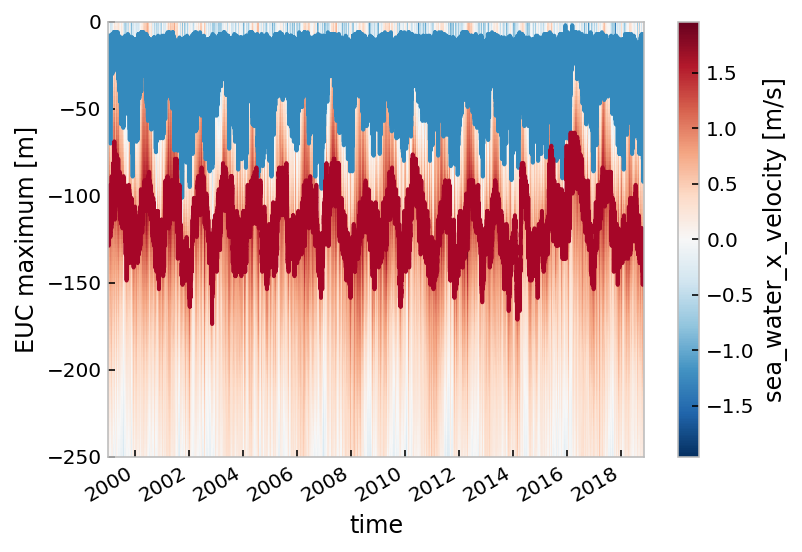
mom6140.uo.cf.plot(robust=True)
mom6140.eucmax.cf.plot()
mom6140.mldT.cf.plot(lw=0.5, color="k")
mixpods.plot_n2s2pdf(mom6140.n2s2pdf.sel(enso_transition_phase="none"))
<matplotlib.contour.QuadContourSet>
Pick simulations#
Build dict#
import warnings
datasets = {
# "TAO": tao_gridded,
# "MITgcm": mitgcm,
}
catalog_sub = {
k: catalog_dict[k]
for k in catalog_dict.keys()
if (k == "kpp.lmd.004") # or ("baseline" in k and "150" not in k)
}
display(catalog_sub)
{ 'kpp.lmd.004': ( 'KPP ν0=2.5, Ric=0.2, Ri0=0.5', 'gmom.e23.GJRAv3.TL319_t061_zstar_N65.baseline.kpp.lmd.004.mixpods' ) }
%autoreload
with warnings.catch_warnings():
warnings.simplefilter("ignore", category=UserWarning)
warnings.simplefilter("ignore", category=FutureWarning)
for short_name, (long_name, folder) in tqdm.tqdm(catalog_sub.items()):
datasets.update(
{
short_name: mixpods.load_mom6_sections(folder).assign_attrs(
{"title": long_name}
)
}
)
0%| | 0/1 [00:00<?, ?it/s]
datasets["TAO"] = DataTree(tao_gridded)
datasets["les"] = les["0.0.-140.oct.average.month"].to_dataset()
# Offset LES to work with slicing below
datasets["les"]["time"] = datasets["les"]["time"] + pd.Timedelta(days=25 * 365)
Build tree#
tree = DataTree.from_dict(datasets)
tree = tree.sel(time=slice("2000", "2017"))
ref = tree["TAO"].ds.reset_coords(drop=True).cf.sel(Z=slice(-120, None))
counts = np.minimum(ref["S2"].cf.count("Z"), ref["N2T"].cf.count("Z")).load()
def calc_histograms(ds):
ds = ds.copy()
ds["tao_mask"] = counts.reindex(time=ds.time, method="nearest") > 5
ds["tao_mask"].attrs = {
"description": "True when there are more than 5 5-m T, u, v in TAO dataset"
}
# ds = ds.where(ds.tao_mask)
return ds.update(mixpods.pdf_N2S2(ds))
tree = tree.map_over_subtree(calc_histograms)
if "les" in tree:
tree["les"] = tree["les"].isel(z=slice(-2))
tree["les"]["KT"].attrs["standard_name"] = "ocean_vertical_heat_diffusivity"
if "micro" in locals():
tree.update(micro)
tree
<xarray.DatasetView>
Dimensions: ()
Data variables:
*empty*%autoreload
dailies = tree.map_over_subtree(mixpods.daily_composites)
dailies
/glade/u/home/dcherian/miniconda3/envs/pump/lib/python3.10/site-packages/numpy/lib/nanfunctions.py:1217: RuntimeWarning: All-NaN slice encountered
r, k = function_base._ureduce(a, func=_nanmedian, axis=axis, out=out,
<xarray.DatasetView>
Dimensions: ()
Data variables:
*empty*tree = mixpods.persist_tree(tree)
mixpods.validate_tree(tree)
Comparing shear prod to eps#
(ds.shear_prod.mean("time").hvplot.line() * ds.eps.mean("time").hvplot.line()).opts(
hv.opts.Curve(invert_axes=True, ylim=(1e-10, None), logx=True)
)
Daily composites#
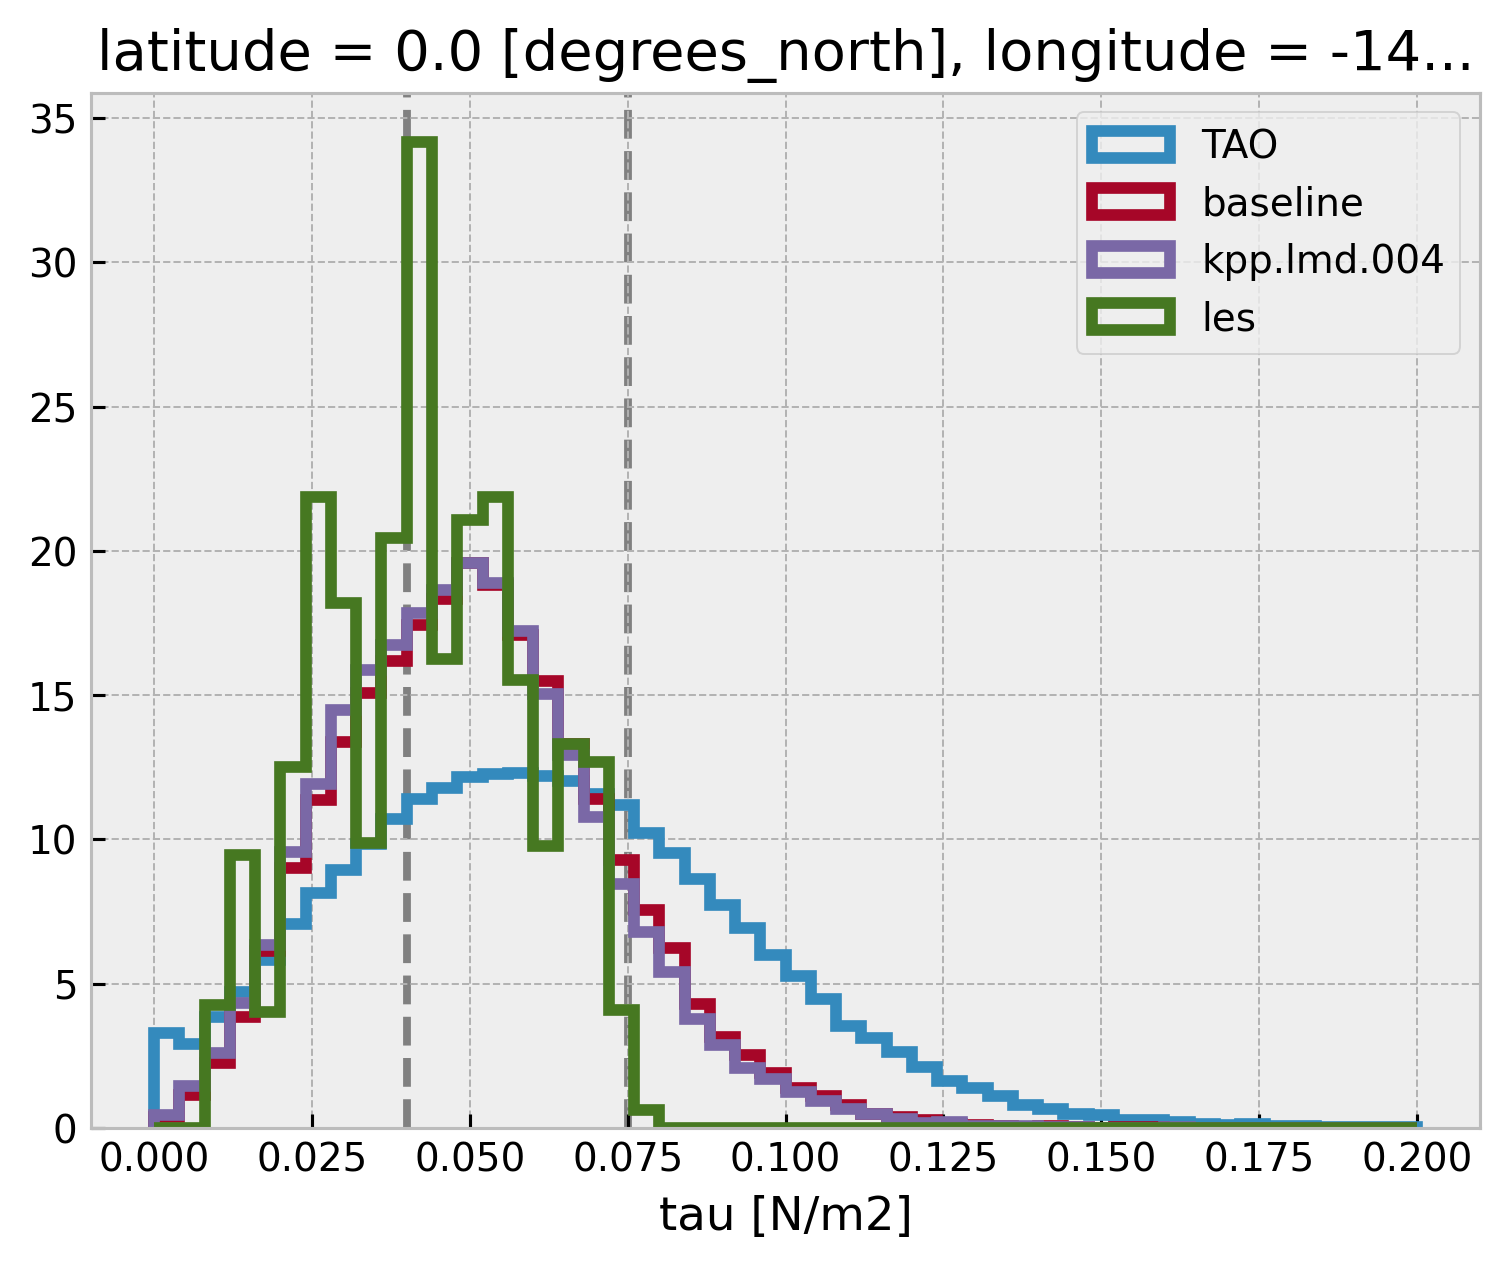
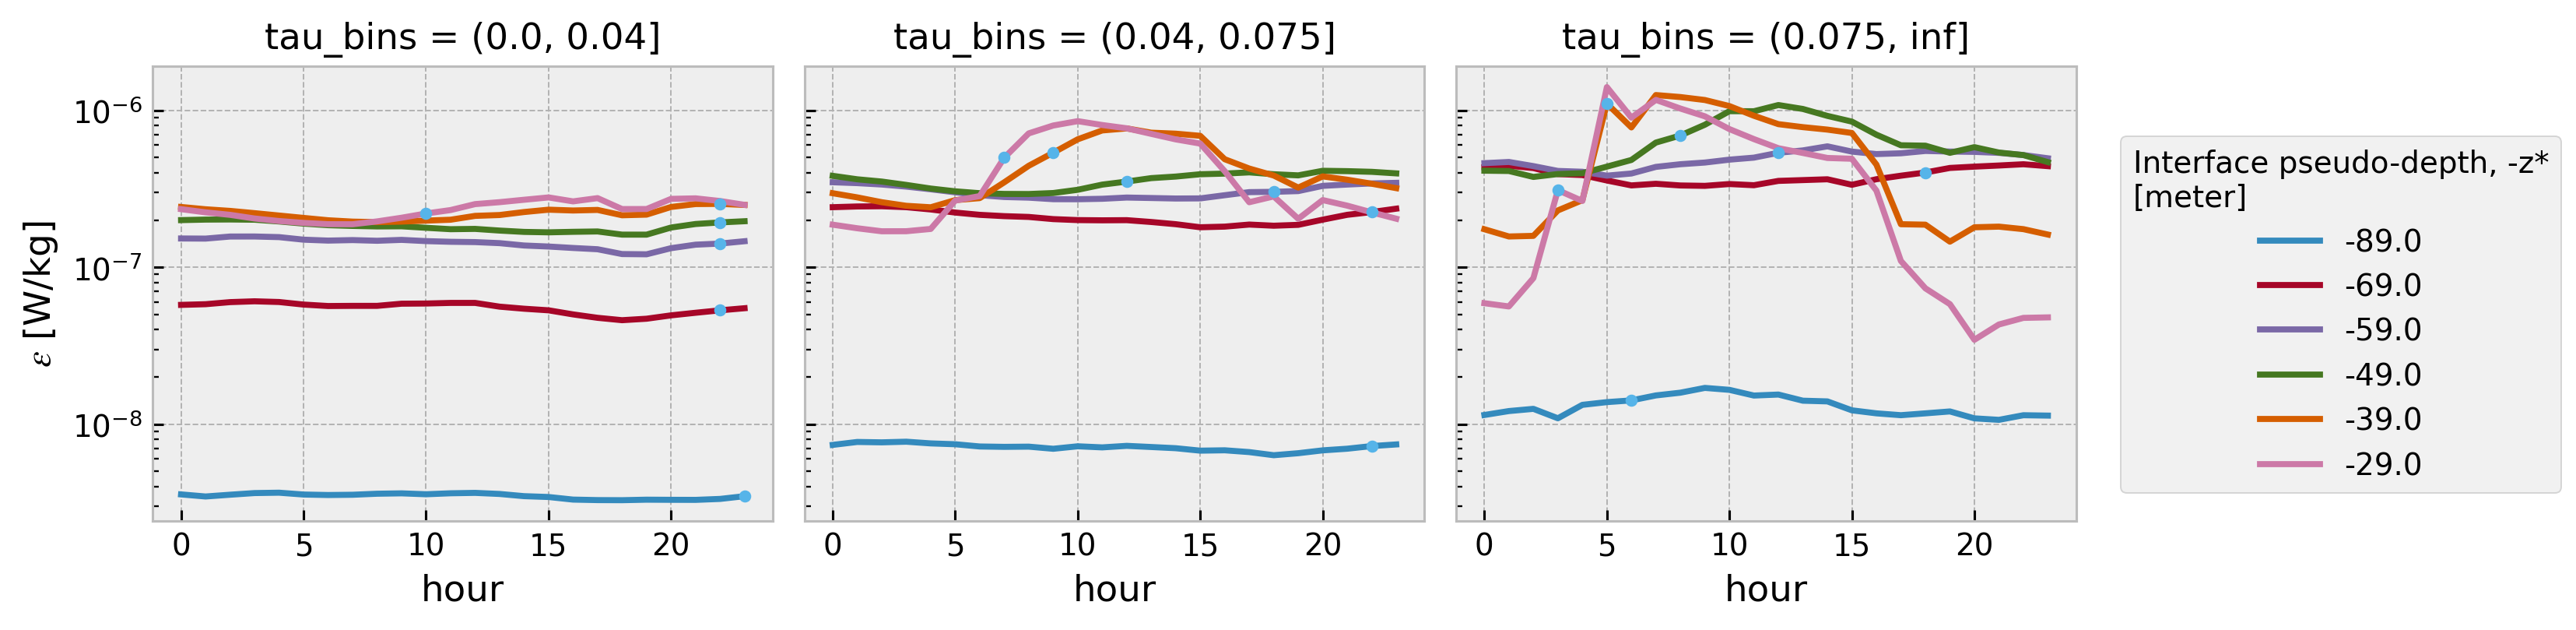
ε, τ#
How well does the model get τ
τ bins are [0, 0.04, 0.075, inf]
def groupby_mean(node):
return node["tau"].groupby_bins(node.tau, bins=np.linspace(0, 0.2, 51)).count()
tau_hist = (
tree.dc.subset_nodes(["tau"])
.map_over_subtree(groupby_mean)
.reset_coords(drop=True)
.dc.concatenate_nodes()
)
tau_hist["tau_bins"] = pd.IntervalIndex(tau_hist.tau_bins.data).mid
tau_hist.hvplot.step(by="node")
bins = np.linspace(0, 0.2, 51)
for name, node in tree.children.items():
node["tau"].plot.hist(bins=bins, label=name, histtype="step", lw=3, density=True)
plt.legend()
dcpy.plots.linex([0.04, 0.075])
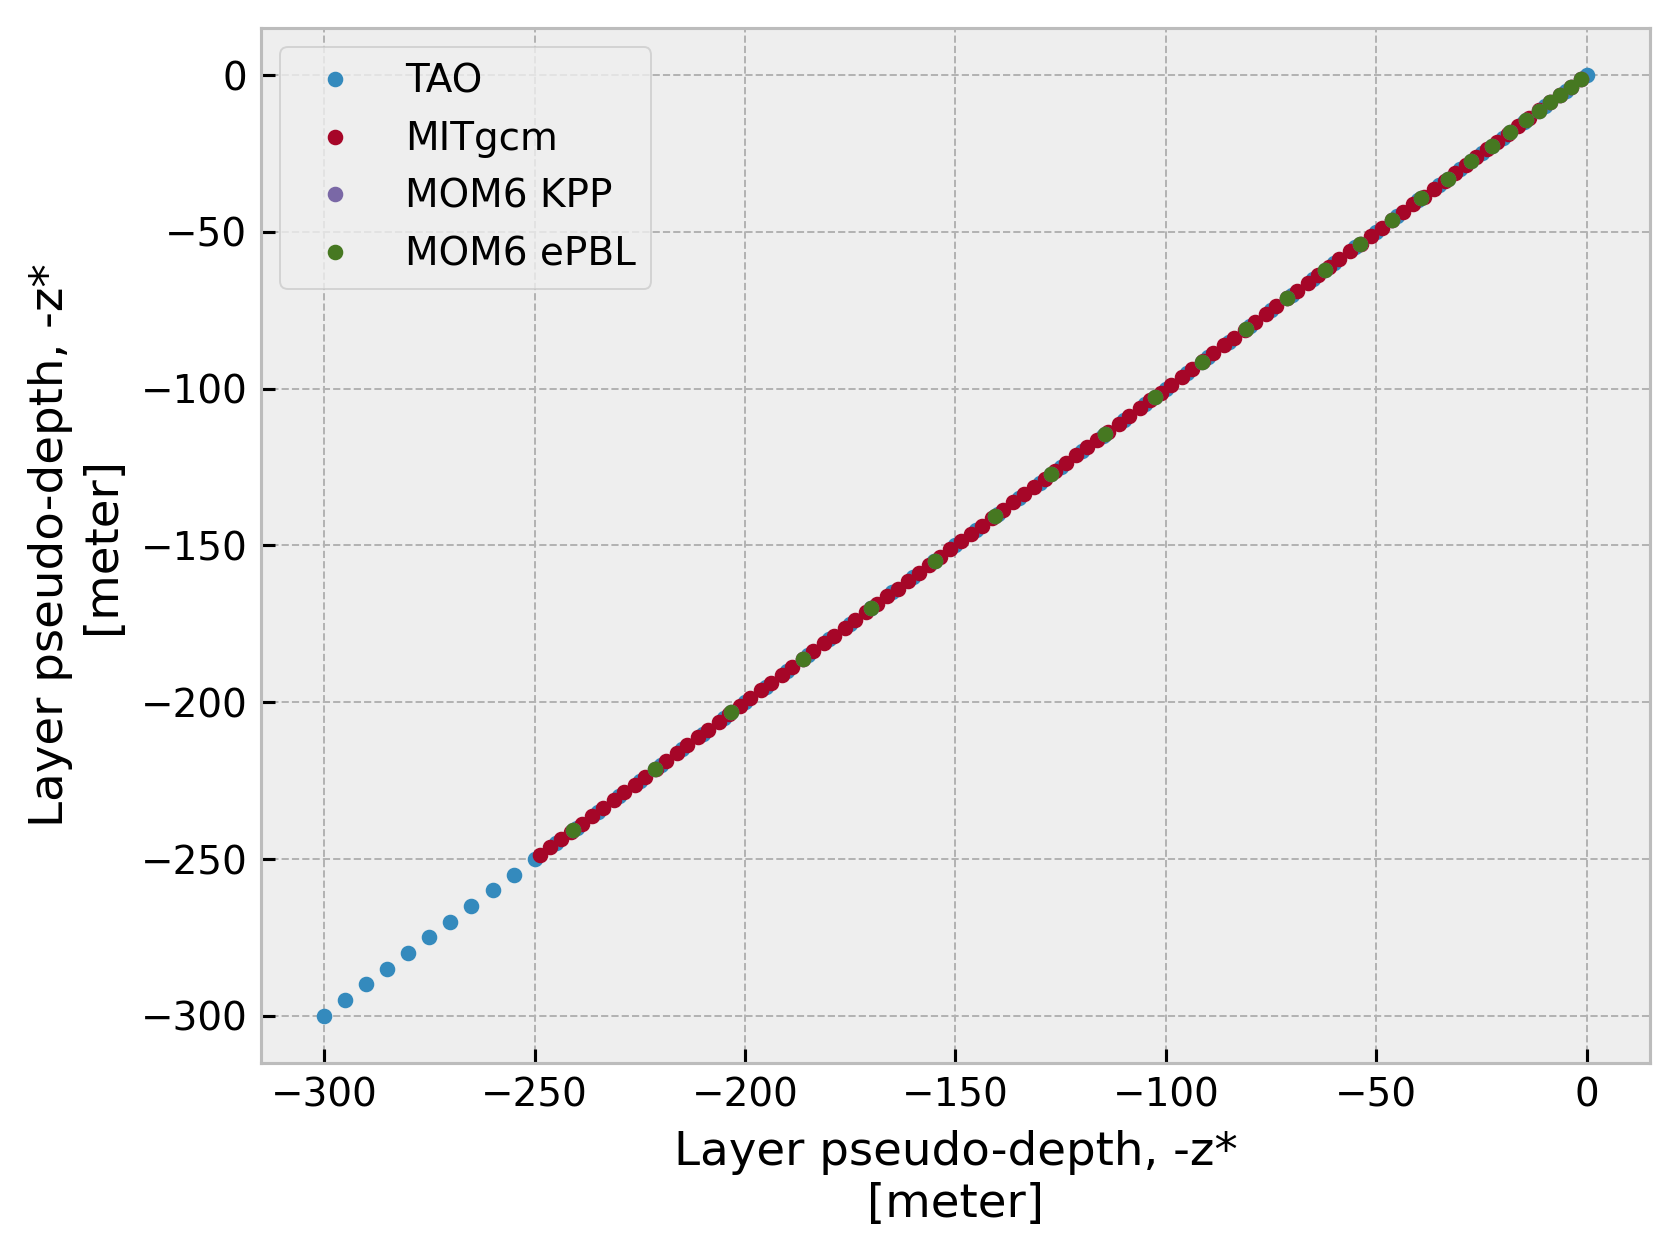
Verify depth is normalized#
for name, ds in datasets.items():
(ds.cf["sea_water_x_velocity"].cf["Z"].plot(marker=".", ls="none", label=name))
plt.legend()
<matplotlib.legend.Legend>
Compare EUC maximum and MLD#
Monthly climatology#
import tqdm
for node in tqdm.tqdm(tree.children):
tree[node]["mldT"] = tree[node]["mldT"].load()
100%|██████████| 3/3 [00:28<00:00, 9.35s/it]
def to_dataset(tree):
concat = xr.concat([v.ds for v in tree.children.values()], dim="node")
concat["node"] = list(tree.children.keys())
return concat
clim = to_dataset(
tree.map_over_subtree(
lambda x: x.reset_coords()[["mldT", "eucmax"]].groupby("time.month").mean()
)
).load()
clim
<xarray.Dataset>
Dimensions: (node: 3, month: 12)
Coordinates:
* month (month) int64 1 2 3 4 5 6 7 8 9 10 11 12
* node (node) <U16 'TAO' 'kpp.lmd.004' 'kpp.lmd.004.N150'
Data variables:
mldT (node, month) float64 -24.54 -16.38 -12.75 ... -21.87 -25.93 -31.85
eucmax (node, month) float64 -107.1 -100.9 -93.21 ... -103.6 -104.7 -103.6hv.Layout(
[
hv.Overlay(
[
tree[node]
.ds["mldT"]
.reset_coords(drop=True)
.groupby("time.month")[month]
.hvplot.hist(label=node, legend=True)
.opts(frame_width=150)
for node in tree.children
]
).opts(title=str(month))
for month in np.arange(1, 13)
]
).cols(4)
(clim.mldT.hvplot(by="node") + clim.eucmax.hvplot(by="node")).cols(1)
mixpods.plot_timeseries(tree, "mldT", obs="TAO")
/glade/u/home/dcherian/miniconda3/envs/pump/lib/python3.10/site-packages/bokeh/core/property/bases.py:259: DeprecationWarning: elementwise comparison failed; this will raise an error in the future.
return new == old
/glade/u/home/dcherian/miniconda3/envs/pump/lib/python3.10/site-packages/bokeh/core/property/bases.py:259: DeprecationWarning: elementwise comparison failed; this will raise an error in the future.
return new == old
datasets["TAO"].eucmax.attrs["long_name"] = "EUC maximum"
mixpods.plot_timeseries(tree.sel(time="2008"), "eucmax", obs="TAO")
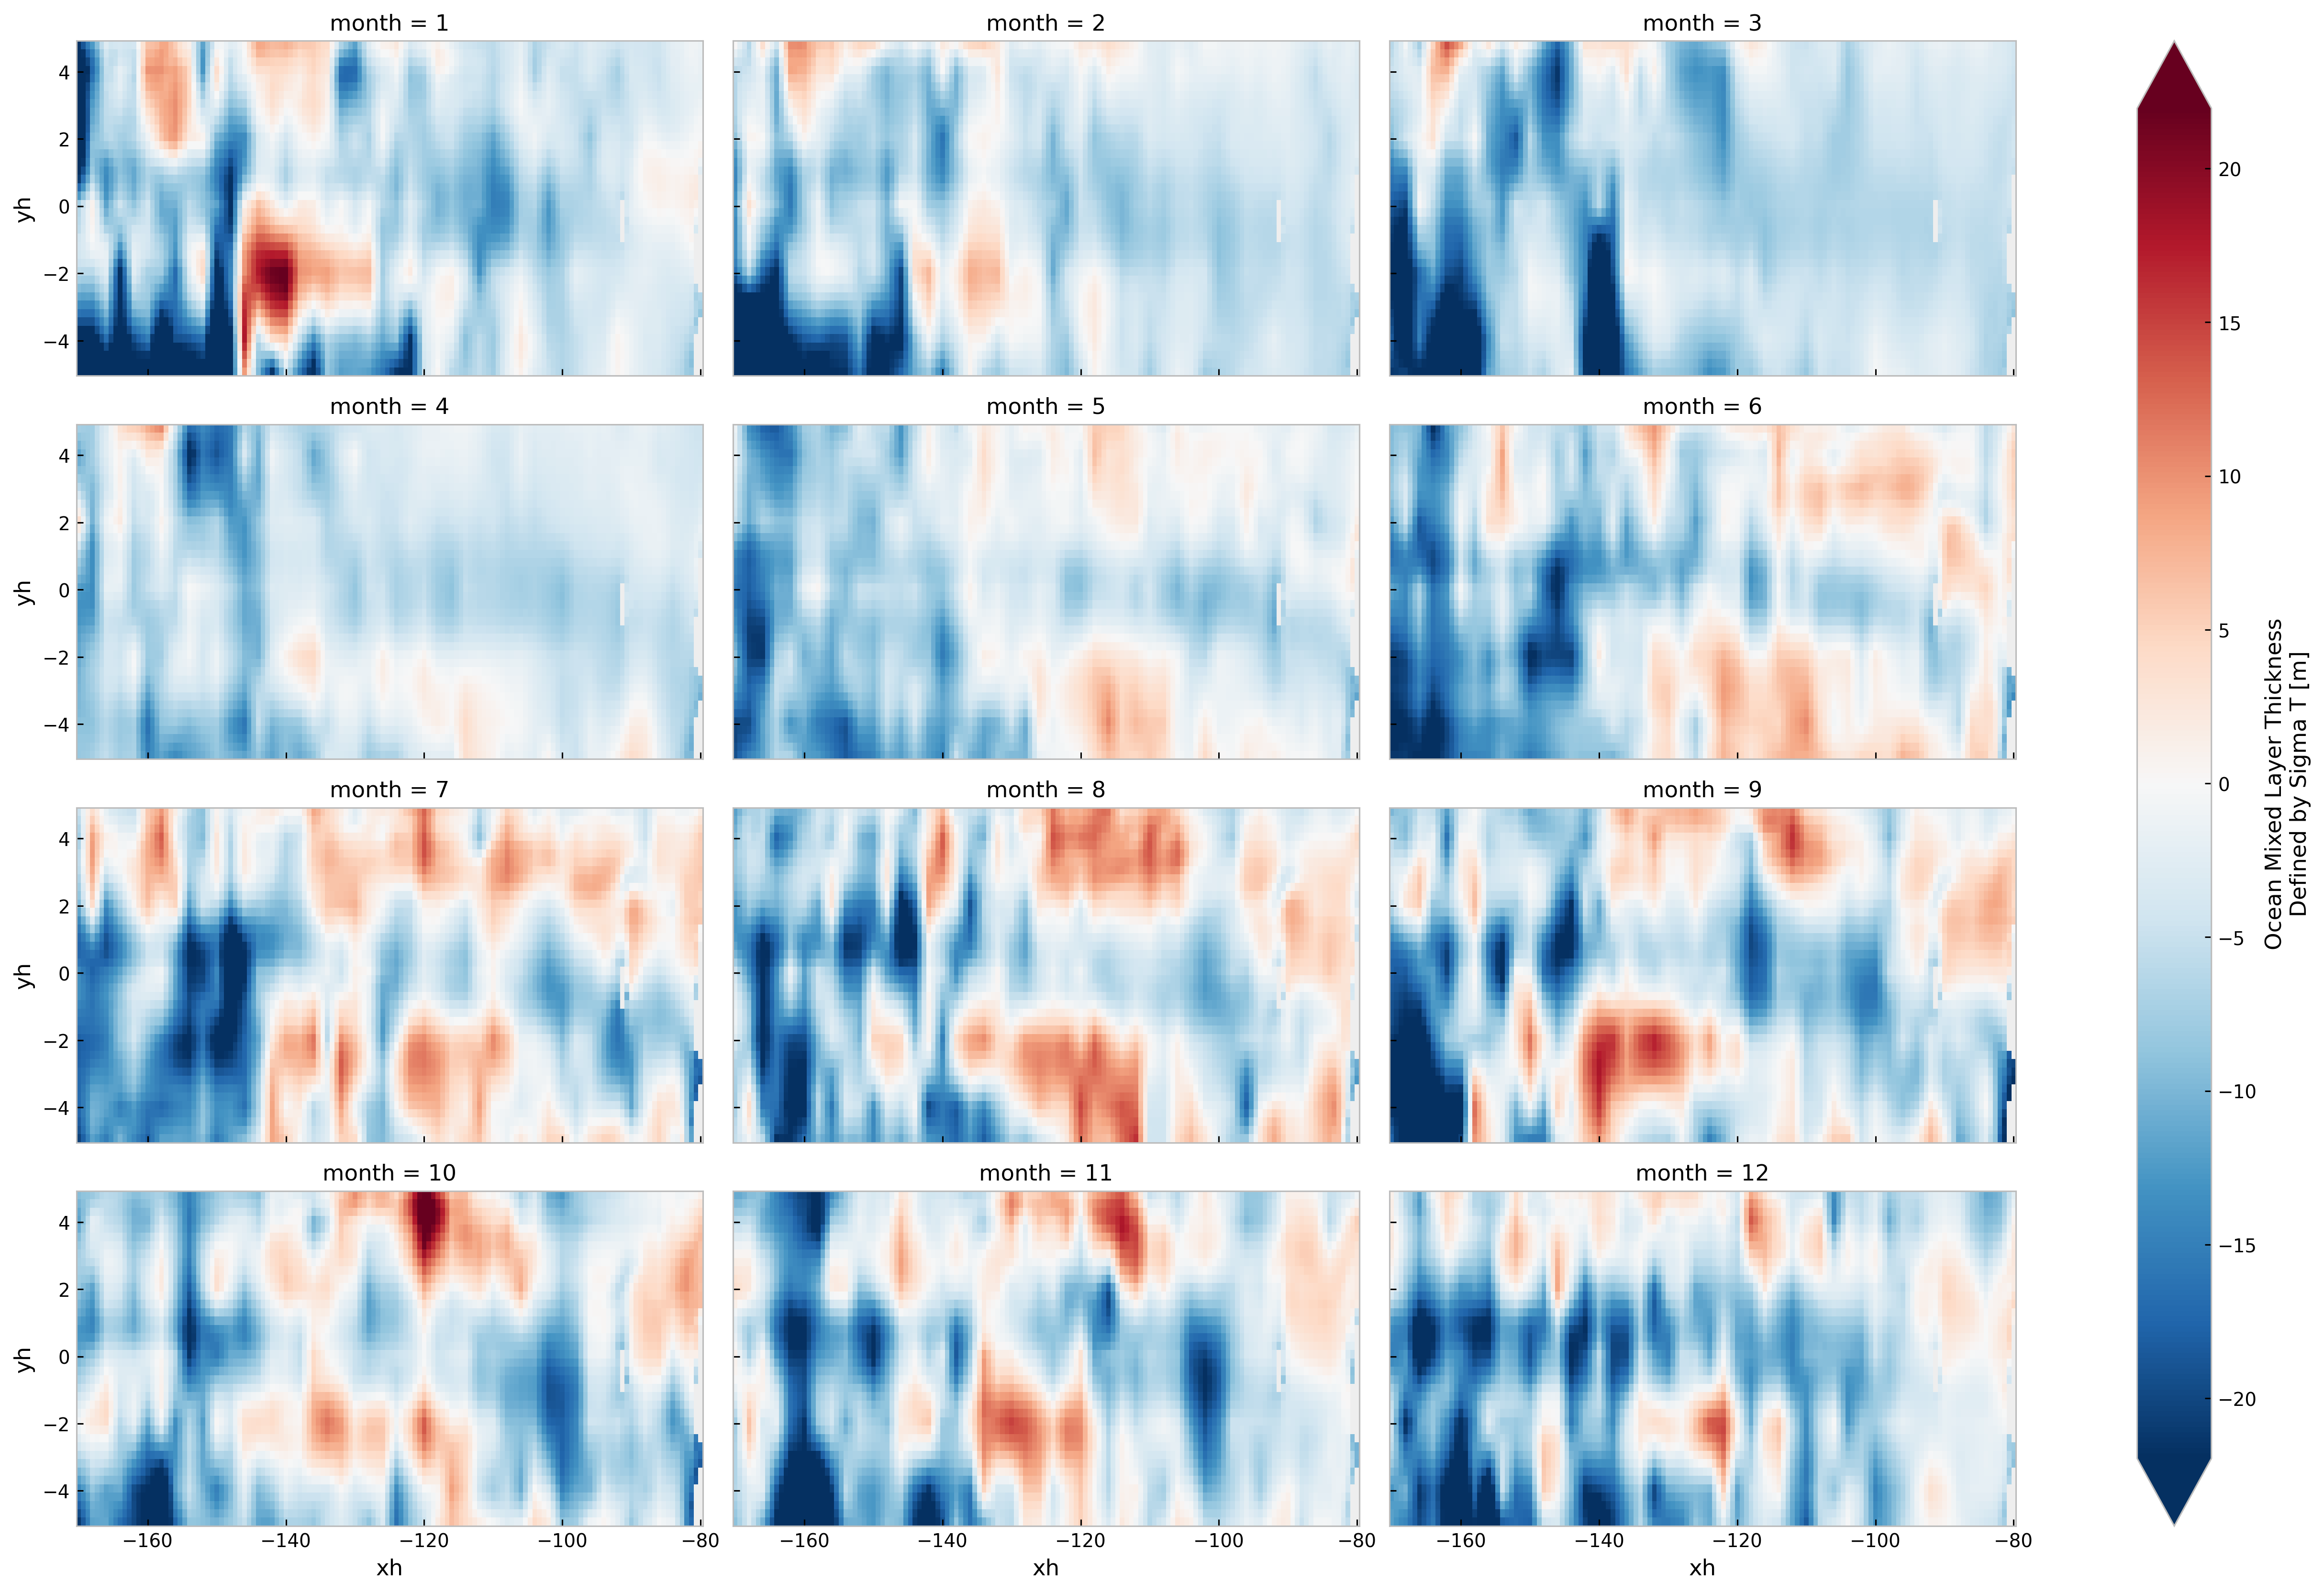
MLD Maps#
def read_sfc(casename):
path = f"/glade/scratch/dcherian/archive/{casename}/ocn/hist/*sfc*00[4-7]*.nc"
sfc = xr.open_mfdataset(
path, data_vars="minimal", coords="minimal", compat="override", parallel=True
)
return sfc
sfc = DataTree()
casenames = {
"MOM6 KPP": "gmom.e23.GJRAv3.TL319_t061_zstar_N65.baseline.001.mixpods",
"MOM6 ePBL": "gmom.e23.GJRAv3.TL319_t061_zstar_N65.baseline.epbl.001.mixpods",
}
for name, casename in casenames.items():
sfc[name] = DataTree(read_sfc(casename))
sfc
<xarray.DatasetView>
Dimensions: ()
Data variables:
*empty*mldclim = sfc.map_over_subtree(
lambda node: node.mlotst.groupby("time.month").mean()
).compute()
filepath = (
"/glade/work/gmarques/cesm/datasets/MLD/deBoyer/deBoyer_MLD_remapped_to_tx06v1.nc"
)
mldclim["obs"] = DataTree(xr.open_dataset(filepath))
mldclim
/glade/u/home/dcherian/miniconda3/envs/pump/lib/python3.10/site-packages/xarray/coding/times.py:699: SerializationWarning: Unable to decode time axis into full numpy.datetime64 objects, continuing using cftime.datetime objects instead, reason: dates out of range
dtype = _decode_cf_datetime_dtype(data, units, calendar, self.use_cftime)
/glade/u/home/dcherian/miniconda3/envs/pump/lib/python3.10/site-packages/xarray/core/indexing.py:524: SerializationWarning: Unable to decode time axis into full numpy.datetime64 objects, continuing using cftime.datetime objects instead, reason: dates out of range
return np.asarray(array[self.key], dtype=None)
<xarray.DatasetView>
Dimensions: ()
Data variables:
*empty*mldclim.
mldclim["MOM6 KPP"] = DataTree(
read_sfc("gmom.e23.GJRAv3.TL319_t061_zstar_N65.baseline.001.mixpods")
.mlotst.groupby("time.month")
.mean()
)
mldclim["MOM6 ePBL"] = DataTree(
read_sfc("gmom.e23.GJRAv3.TL319_t061_zstar_N65.baseline.epbl.001.mixpods")
.mlotst.groupby("time.month")
.mean()
)
(
(mlotst - mldclim.mld.groupby("time.month").first())
.sel(yh=slice(-5, 5), xh=slice(-170, -80))
.plot(col="month", robust=True, col_wrap=3, aspect=2)
)
<xarray.plot.facetgrid.FacetGrid>
Mixing layer depth?#
todrop = ["TAO"]
notao = DataTree.from_dict(
{k: v.ds for k, v in tree.children.items() if k not in todrop}
)
with cfxr.set_options(custom_criteria=mixing_layer_criteria):
plot = mixpods.plot_timeseries(notao, "boundary_layer_depth", obs=None)
plot
/glade/u/home/dcherian/miniconda3/envs/pump/lib/python3.10/site-packages/cf_xarray/accessor.py:1663: UserWarning: Variables {'areacello'} not found in object but are referred to in the CF attributes.
warnings.warn(
/glade/u/home/dcherian/miniconda3/envs/pump/lib/python3.10/site-packages/cf_xarray/accessor.py:1663: UserWarning: Variables {'areacello'} not found in object but are referred to in the CF attributes.
warnings.warn(
Mean profiles: mean, std#
Model mean S2 is lower by a factor of 2
S2 = mixpods.plot_profile_fill(tree, "S2", "S^2")
N2 = mixpods.plot_profile_fill(tree, "N2T", "N_T^2")
u = mixpods.plot_profile_fill(tree, "sea_water_x_velocity", "u")
T = mixpods.plot_profile_fill(tree, "sea_water_potential_temperature", "T")
Ri = mixpods.plot_median_Ri(tree)
Show code cell source
S = mixpods.plot_profile_fill(tree, "sea_water_salinity", "S")
v = mixpods.plot_profile_fill(tree, "sea_water_y_velocity", "v")
# dTdz = plot_profile_fill(tree, "dTdz", "∂T/∂z")
# dSdz = plot_profile_fill(tree, "dSdz", "∂S/∂z")
((S2 + N2).opts("Curve", xrotation=30) + Ri.opts(xaxis="top", xrotation=30)).opts(
sizing_mode="stretch_width"
)
((S2 + N2).opts("Curve", xrotation=30) + Ri.opts(xaxis="top", xrotation=30)).opts(
sizing_mode="stretch_width"
)
(T + u.opts(ylim=(-0.5, 1.5))).opts(sizing_mode="stretch_width")
(T + S + u.opts(ylim=(-0.5, 1.5)) + v.opts(ylim=(-0.5, 0.5))).opts(
sizing_mode="stretch_width"
)
S2 = plot_profile_fill(tree, "S2", "S^2")
u = plot_profile_fill(tree, "sea_water_x_velocity", "u")
popts = (
hv.opts.Curve(fontscale=1.5, line_width=3, color=hv.Cycle("Dark2")),
hv.opts.Area(fill_color=hv.Cycle("Dark2")),
)
h = (S2.opts(show_legend=False) + u).opts(
hv.opts.Curve("Curve", xaxis="bottom", xlim=(-200, 0)),
hv.opts.Overlay(frame_width=400, frame_height=600),
*popts,
)
h
Remap to EUC coordinate#
gcmeq.coords["zeuc"] = gcmeq.depth - gcmeq.eucmax
remapped = flox.xarray.xarray_reduce(
gcmeq.drop_vars(["SSH", "KPPhbl", "mld", "eucmax"], errors="ignore"),
"zeuc",
dim="depth",
func="mean",
expected_groups=(np.arange(-250, 250.1, 5),),
isbin=(True,),
)
remapped["zeuc_bins"].attrs["units"] = "m"
remapped
<xarray.Dataset>
Dimensions: (time: 174000, longitude: 4, zeuc_bins: 100)
Coordinates:
latitude float64 0.025
* longitude (longitude) float64 -155.0 -140.0 -125.0 -110.0
* time (time) datetime64[ns] 1998-12-31T18:00:00 ... 2018-11-06...
cool_mask (time) bool True True True True ... False False False False
warm_mask (time) bool False False False False ... True True True True
* zeuc_bins (zeuc_bins) object (-250.0, -245.0] ... (245.0, 250.0]
Data variables: (12/25)
DFrI_TH (time, longitude, zeuc_bins) float32 dask.array<chunksize=(6000, 1, 100), meta=np.ndarray>
KPPdiffKzT (time, longitude, zeuc_bins) float32 dask.array<chunksize=(6000, 1, 100), meta=np.ndarray>
KPPg_TH (time, longitude, zeuc_bins) float32 dask.array<chunksize=(6000, 1, 100), meta=np.ndarray>
KPPviscAz (time, longitude, zeuc_bins) float32 dask.array<chunksize=(6000, 1, 100), meta=np.ndarray>
VISrI_Um (time, longitude, zeuc_bins) float32 dask.array<chunksize=(6000, 1, 100), meta=np.ndarray>
VISrI_Vm (time, longitude, zeuc_bins) float32 dask.array<chunksize=(6000, 1, 100), meta=np.ndarray>
... ...
S2 (time, longitude, zeuc_bins) float32 dask.array<chunksize=(6000, 1, 100), meta=np.ndarray>
shear (time, longitude, zeuc_bins) float32 dask.array<chunksize=(6000, 1, 100), meta=np.ndarray>
N2 (time, longitude, zeuc_bins) float32 dask.array<chunksize=(6000, 1, 100), meta=np.ndarray>
shred2 (time, longitude, zeuc_bins) float32 dask.array<chunksize=(6000, 1, 100), meta=np.ndarray>
Ri (time, longitude, zeuc_bins) float32 dask.array<chunksize=(6000, 1, 100), meta=np.ndarray>
enso_transition (zeuc_bins, time) <U12 'La-Nina cool' ... 'El-Nino warm'
Attributes:
easting: longitude
northing: latitude
title: Station profile, index (i,j)=(1201,240)remapped = remapped.persist()
cluster.scale(6)
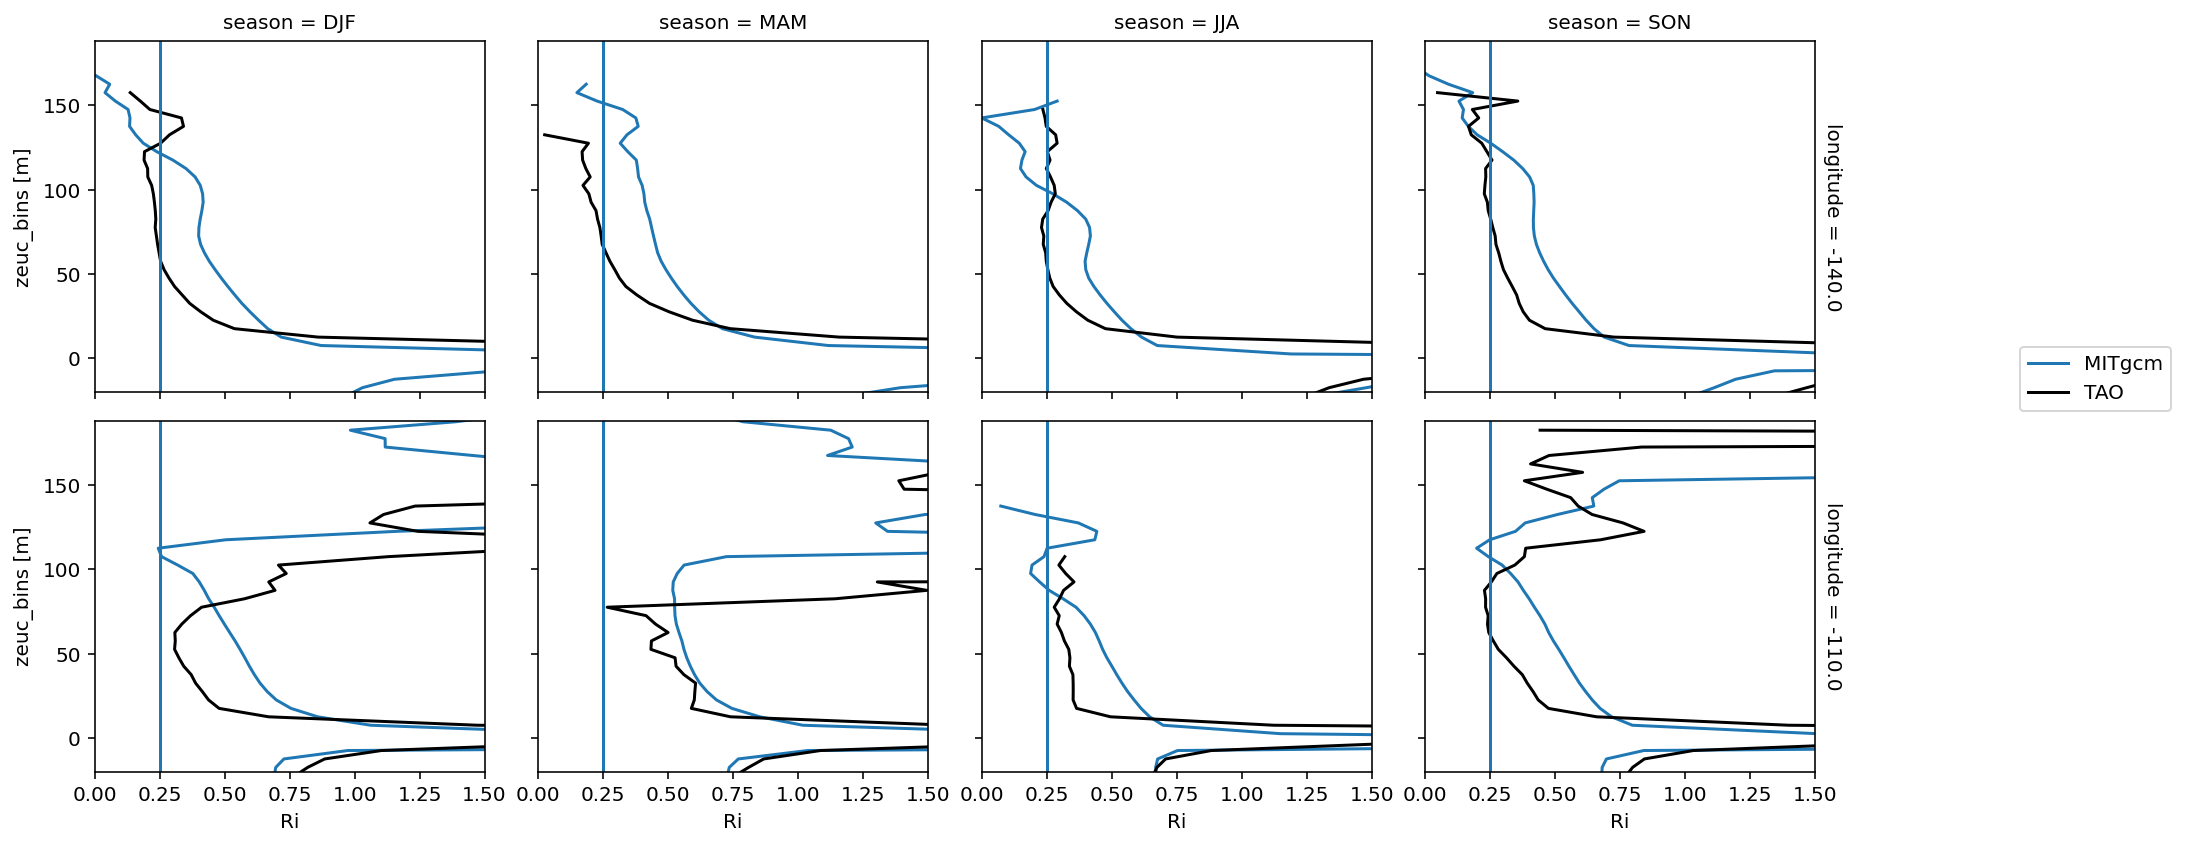
Seasonal median Ri: (0, 140)#
remapped["longitude"] = [-155.0, -140, -125, -110]
fg = (
remapped.Ri.groupby("time.season")
.median()
.sel(season=["DJF", "MAM", "JJA", "SON"], longitude=[-140, -110])
.cf.plot(
col="season", row="longitude", xlim=(0, 1.5), ylim=(-20, None), label="MITgcm"
)
)
fg.data = tao_Ri.cf.sel(quantile=0.5, longitude=[-140, -110])
fg.map_dataarray_line(
xr.plot.line, x=None, y="zeuc", hue="season", color="k", label="TAO"
)
fg.map(lambda: plt.axvline(0.25))
fg.axes[-1, -1].legend(bbox_to_anchor=(1.5, 1))
<matplotlib.legend.Legend>
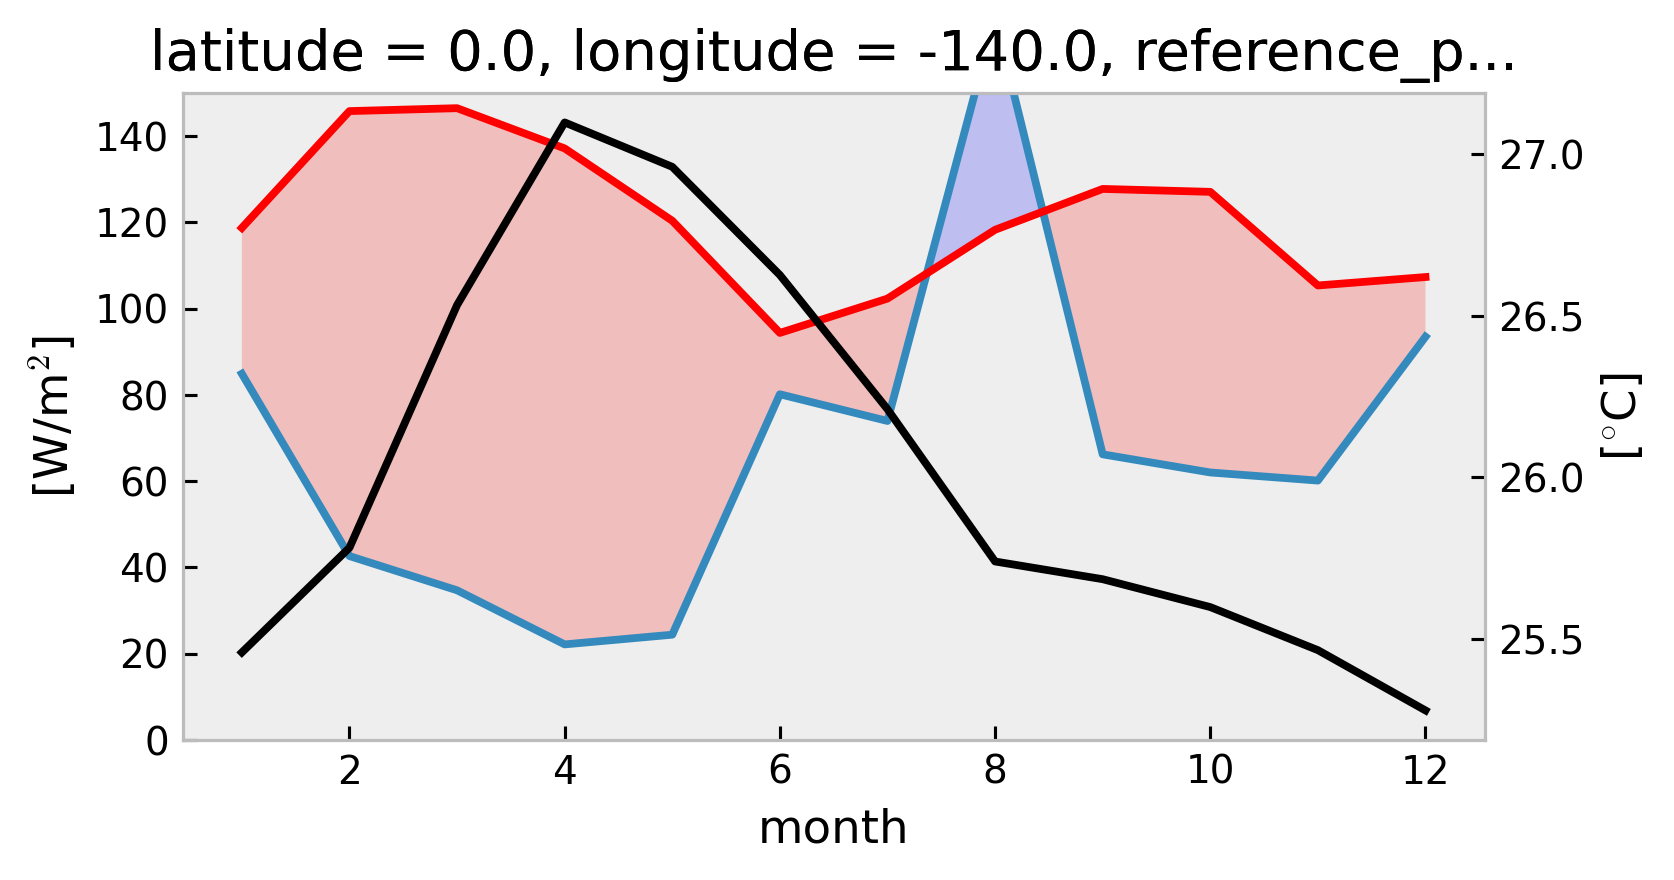
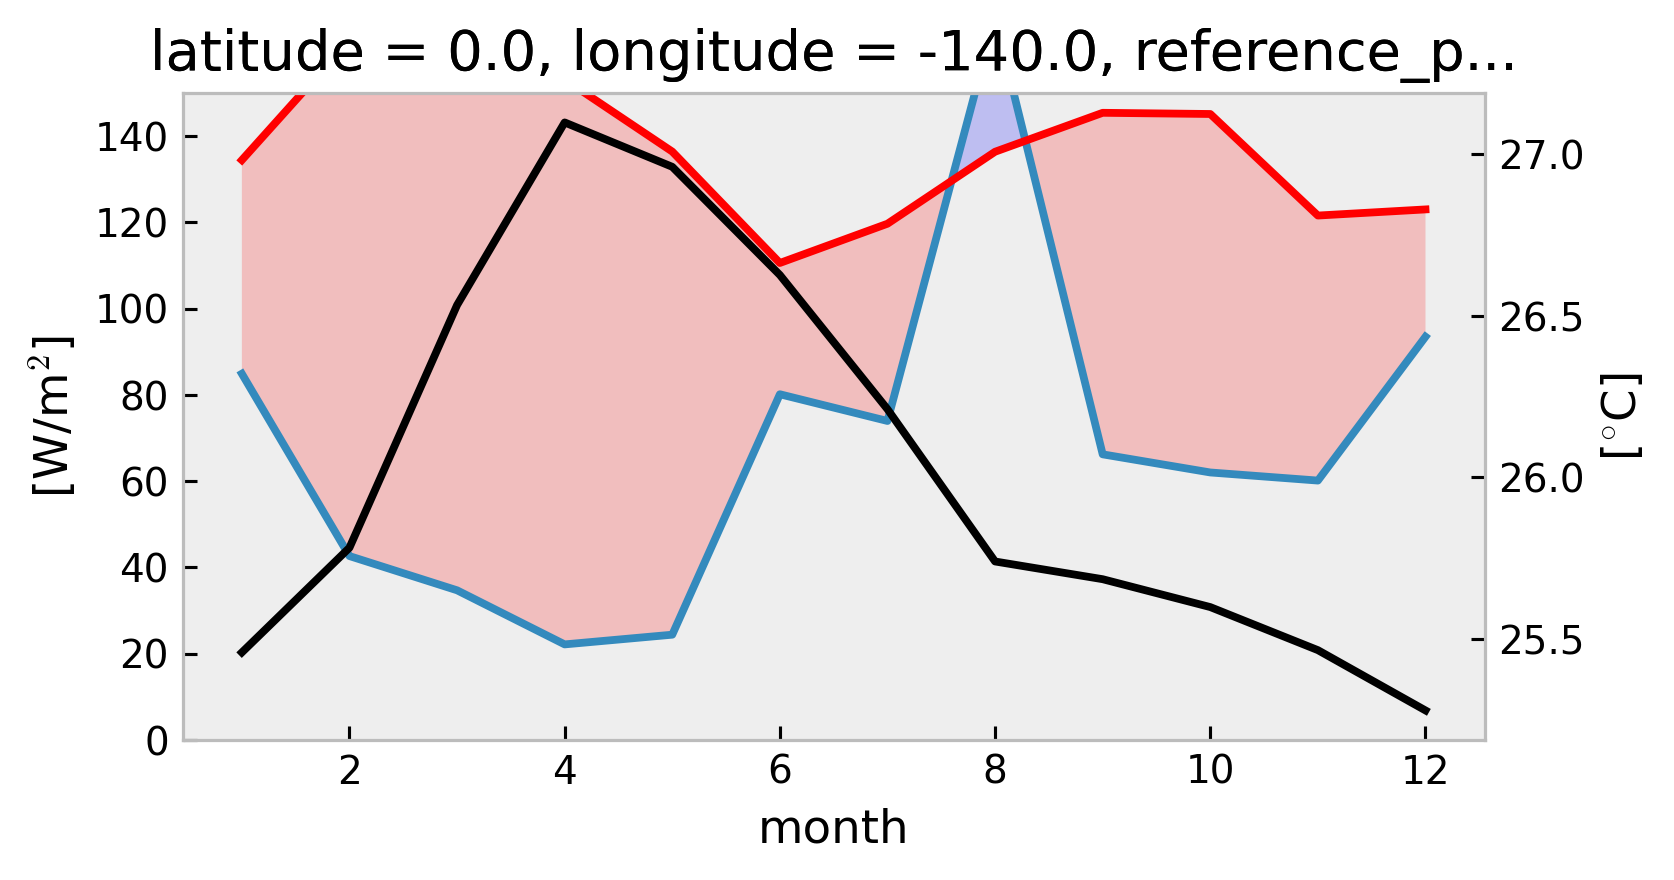
1D Climatological heat budget#
Using TAO
swnet,qnetmeasurements instead of Tropflux
tree["TAO"] = DataTree(tao_gridded)
mixpods.climo_heat_budget_1d(tree["TAO"].ds, penetration="moum")
mixpods.climo_heat_budget_1d(tree["TAO"].ds, penetration="mom")
No artists with labels found to put in legend. Note that artists whose label start with an underscore are ignored when legend() is called with no argument.
No artists with labels found to put in legend. Note that artists whose label start with an underscore are ignored when legend() is called with no argument.
No artists with labels found to put in legend. Note that artists whose label start with an underscore are ignored when legend() is called with no argument.
No artists with labels found to put in legend. Note that artists whose label start with an underscore are ignored when legend() is called with no argument.
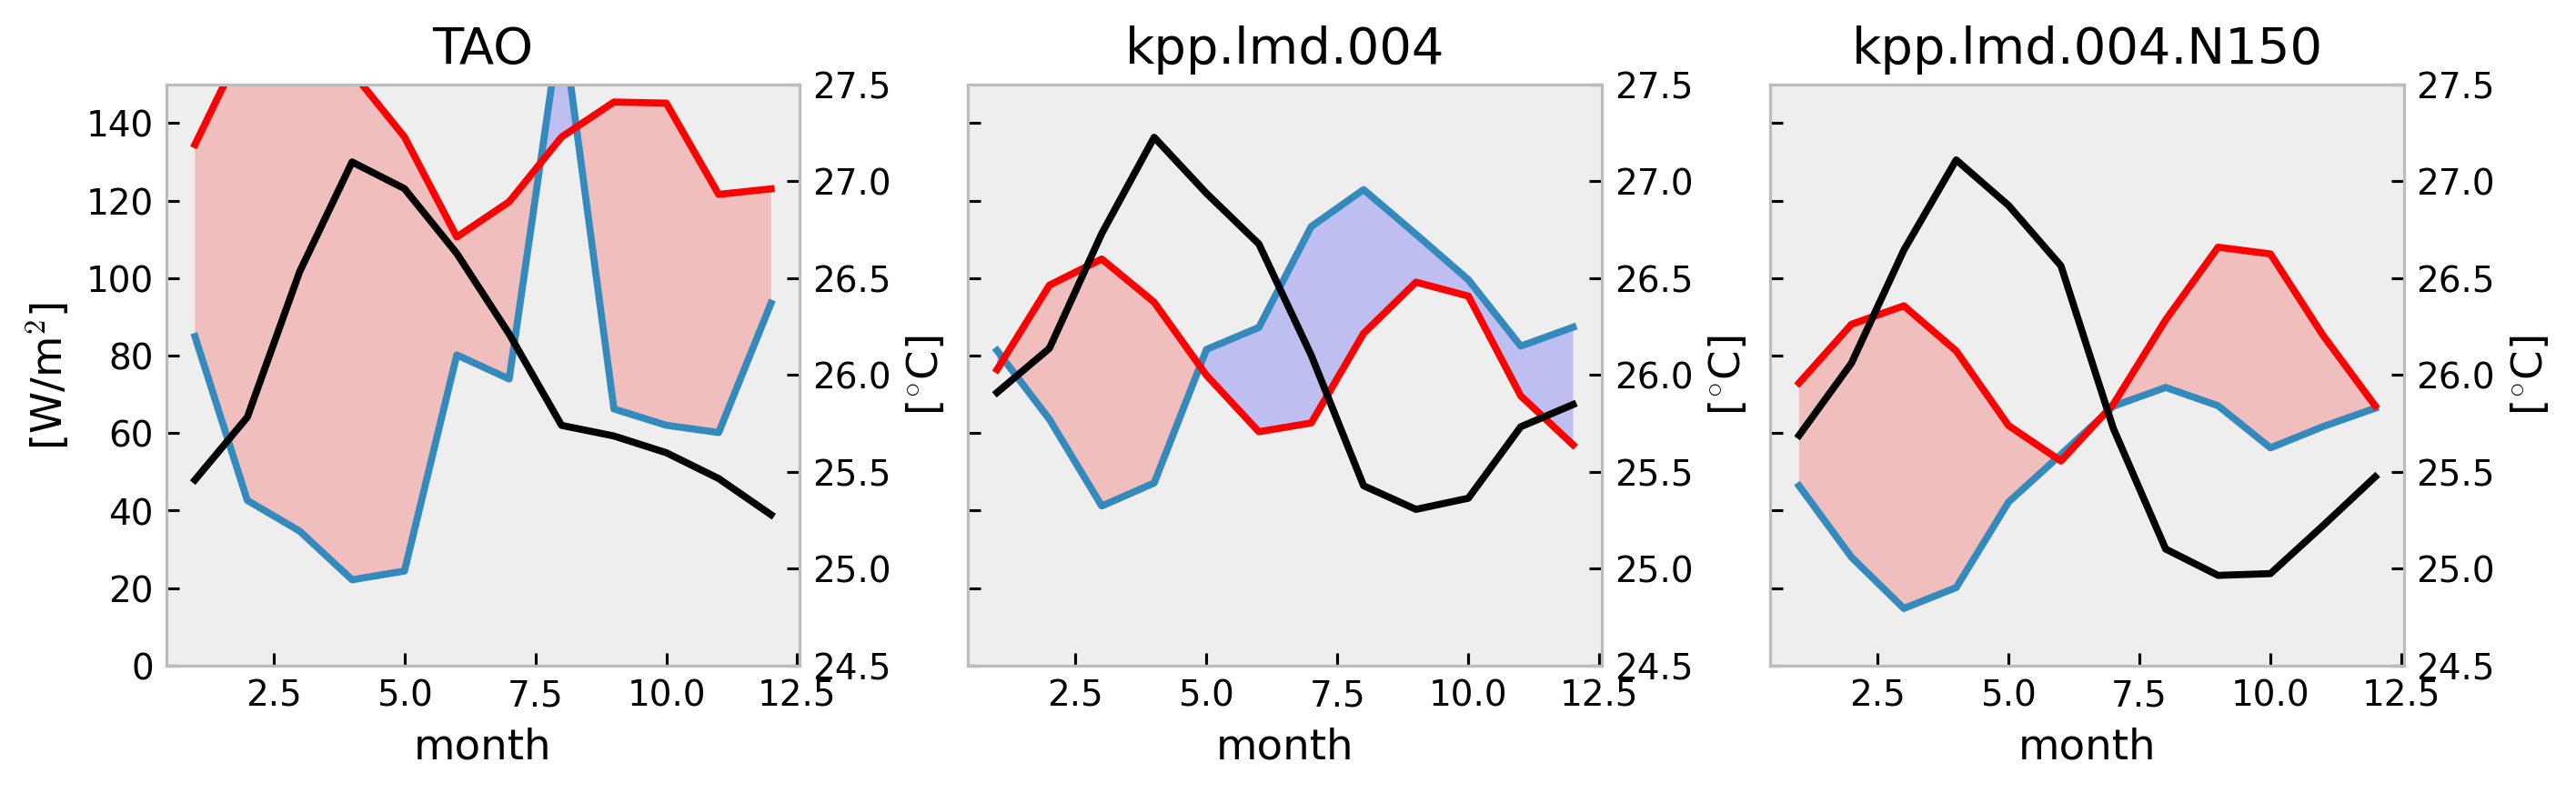
f, ax = plt.subplots(
1,
len(tree),
constrained_layout=True,
squeeze=False,
sharex=True,
sharey=True,
figsize=(10, 3),
)
for axx, (name, node) in zip(ax.flat, tree.children.items()):
mixpods.plot_climo_heat_budget_1d(node.ds, mxldepth=-40, penetration="mom", ax=axx)
axx.set_title(name)
dcpy.plots.clean_axes(ax)
No artists with labels found to put in legend. Note that artists whose label start with an underscore are ignored when legend() is called with no argument.
No artists with labels found to put in legend. Note that artists whose label start with an underscore are ignored when legend() is called with no argument.
No artists with labels found to put in legend. Note that artists whose label start with an underscore are ignored when legend() is called with no argument.
No artists with labels found to put in legend. Note that artists whose label start with an underscore are ignored when legend() is called with no argument.
No artists with labels found to put in legend. Note that artists whose label start with an underscore are ignored when legend() is called with no argument.
No artists with labels found to put in legend. Note that artists whose label start with an underscore are ignored when legend() is called with no argument.
mixpods.plot_climo_heat_budget_1d(tree["kpp.lmd.004.N150"].ds, penetration="mom")
No artists with labels found to put in legend. Note that artists whose label start with an underscore are ignored when legend() is called with no argument.
No artists with labels found to put in legend. Note that artists whose label start with an underscore are ignored when legend() is called with no argument.
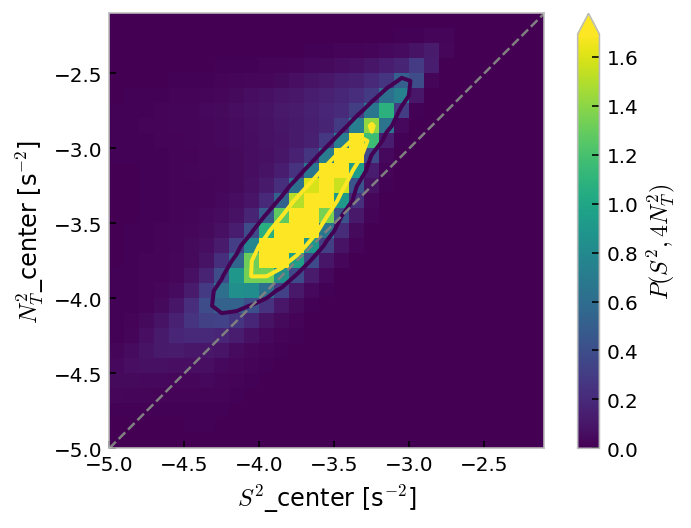
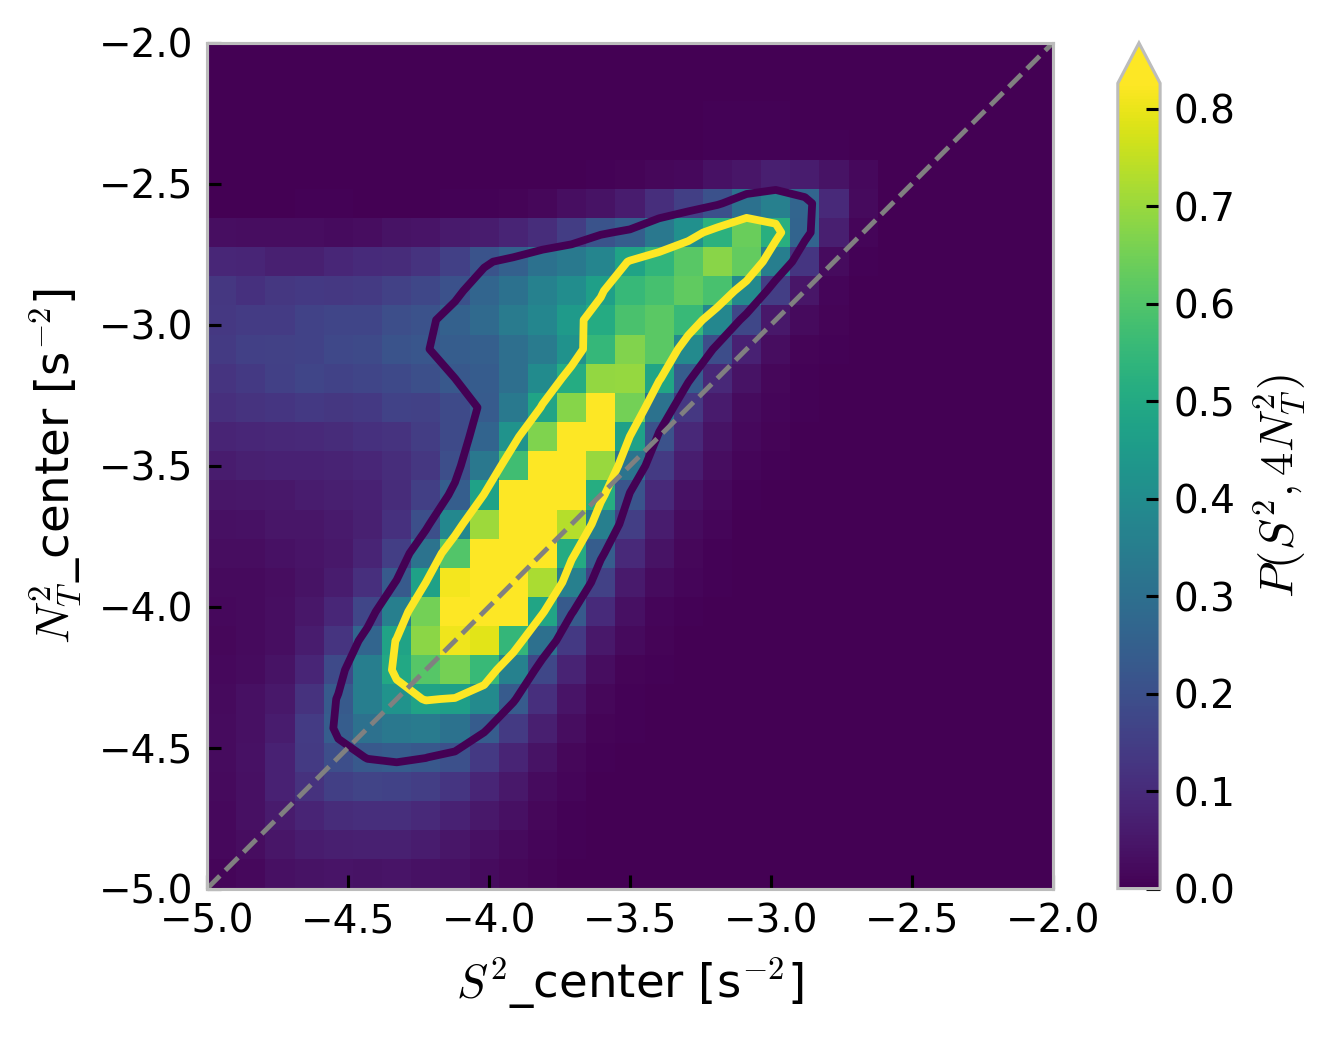
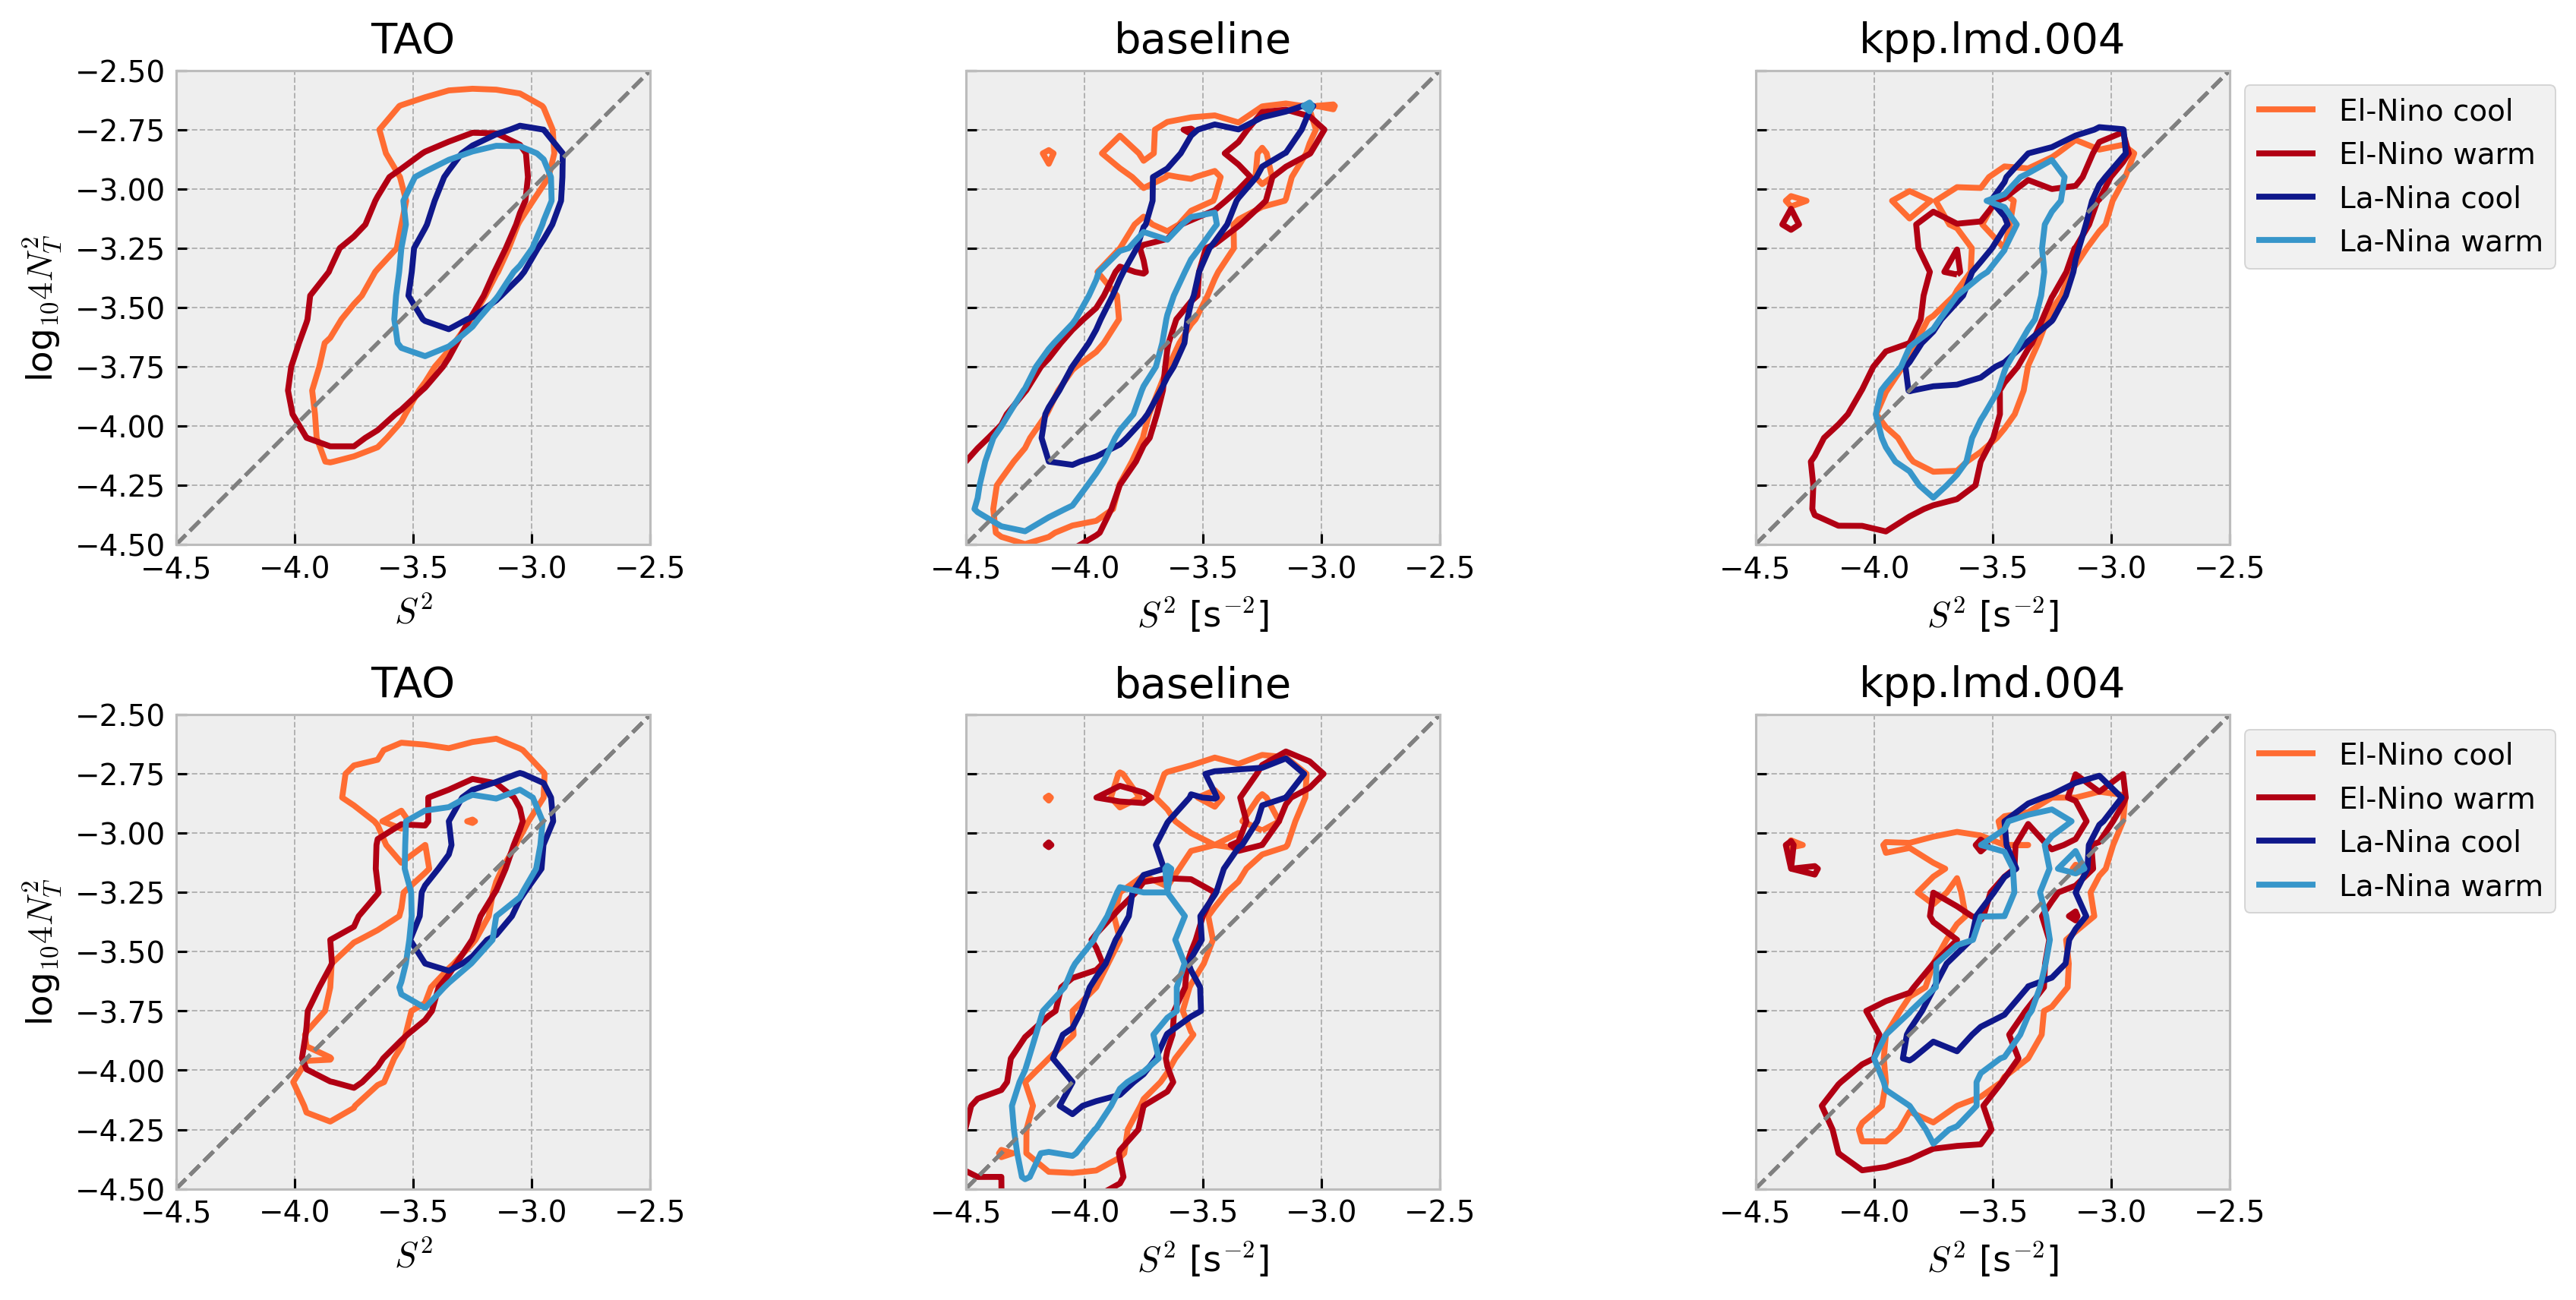
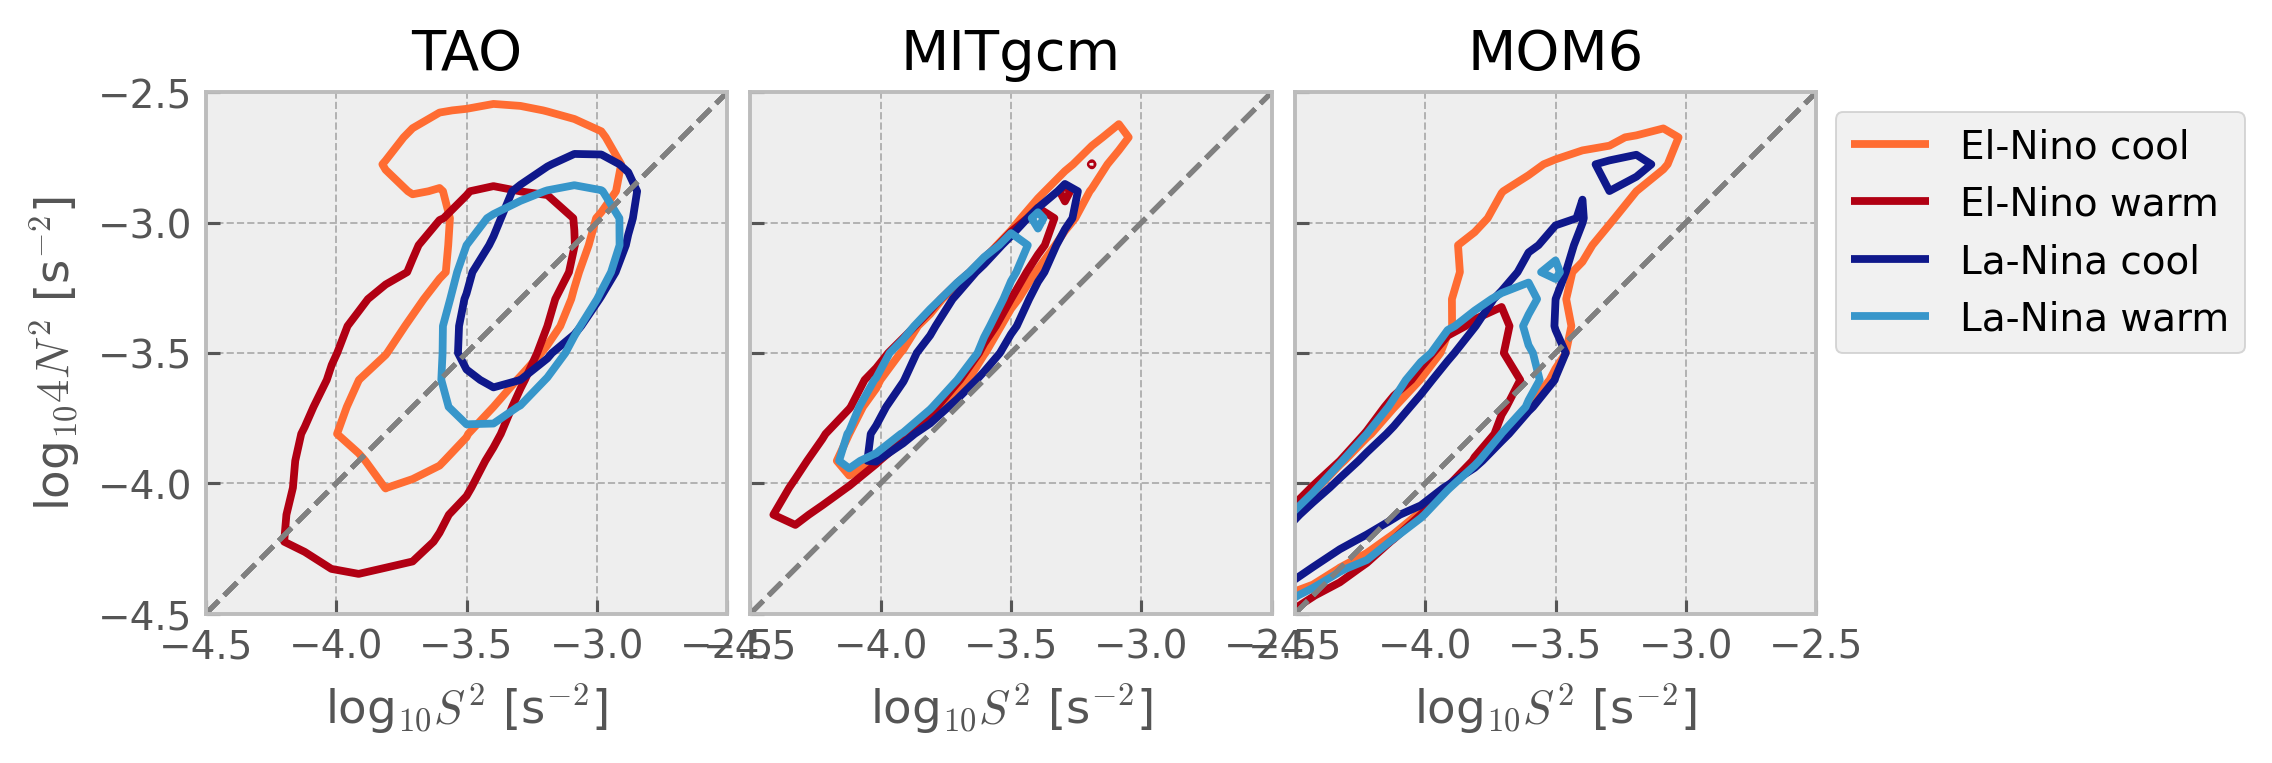
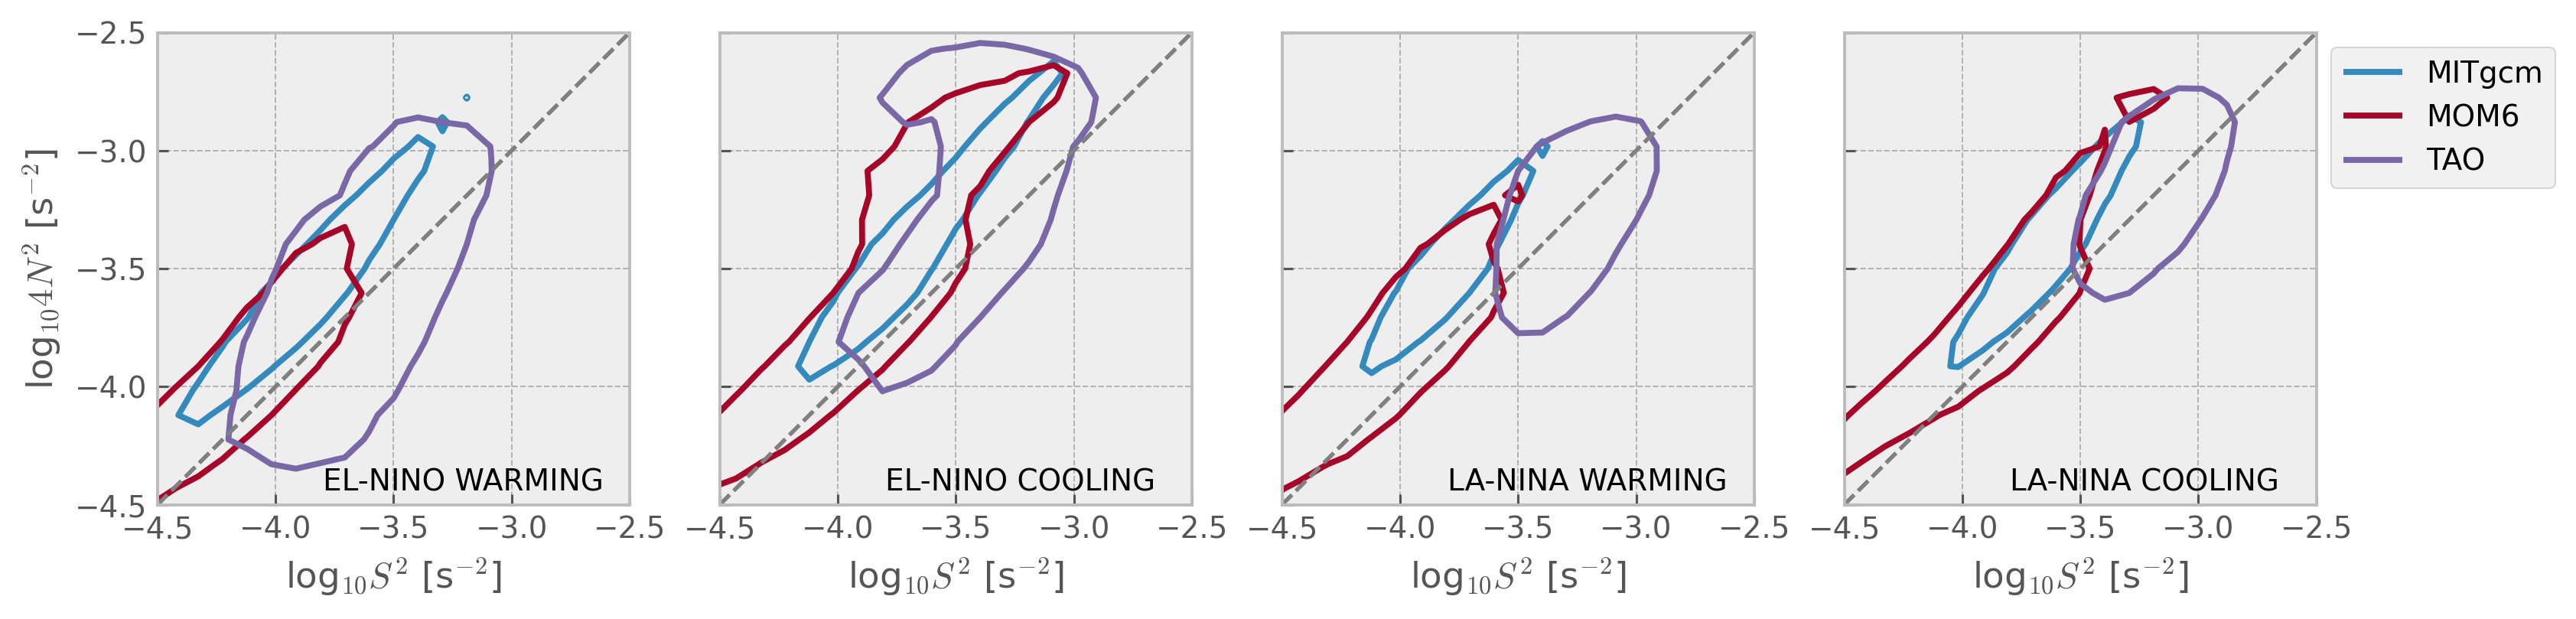
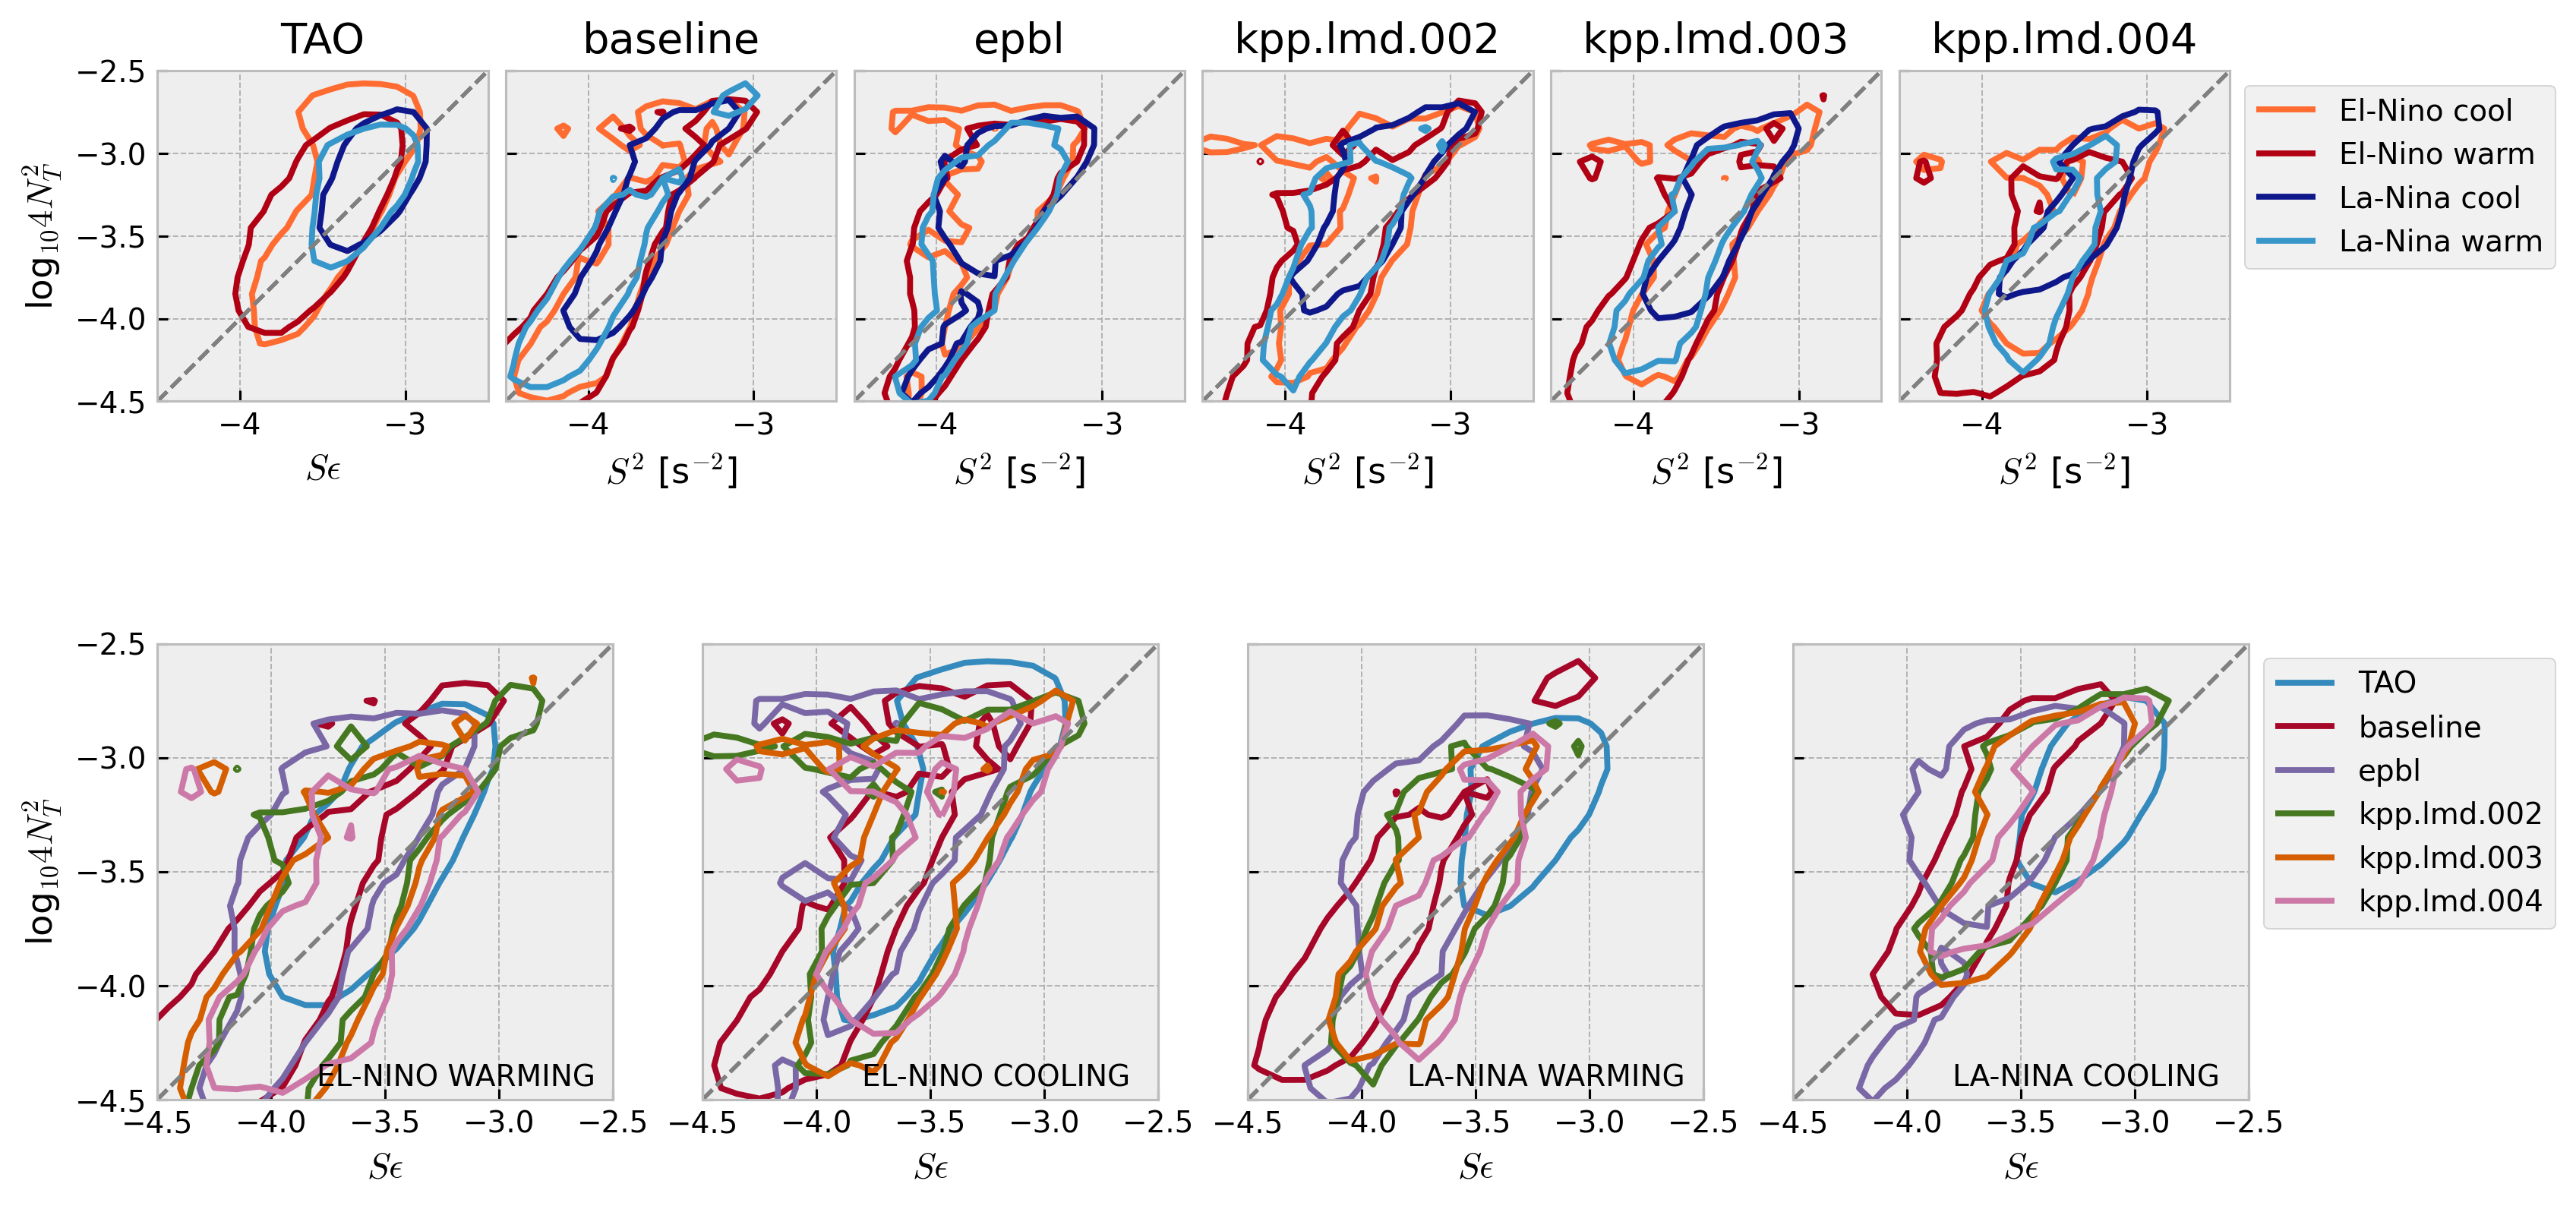
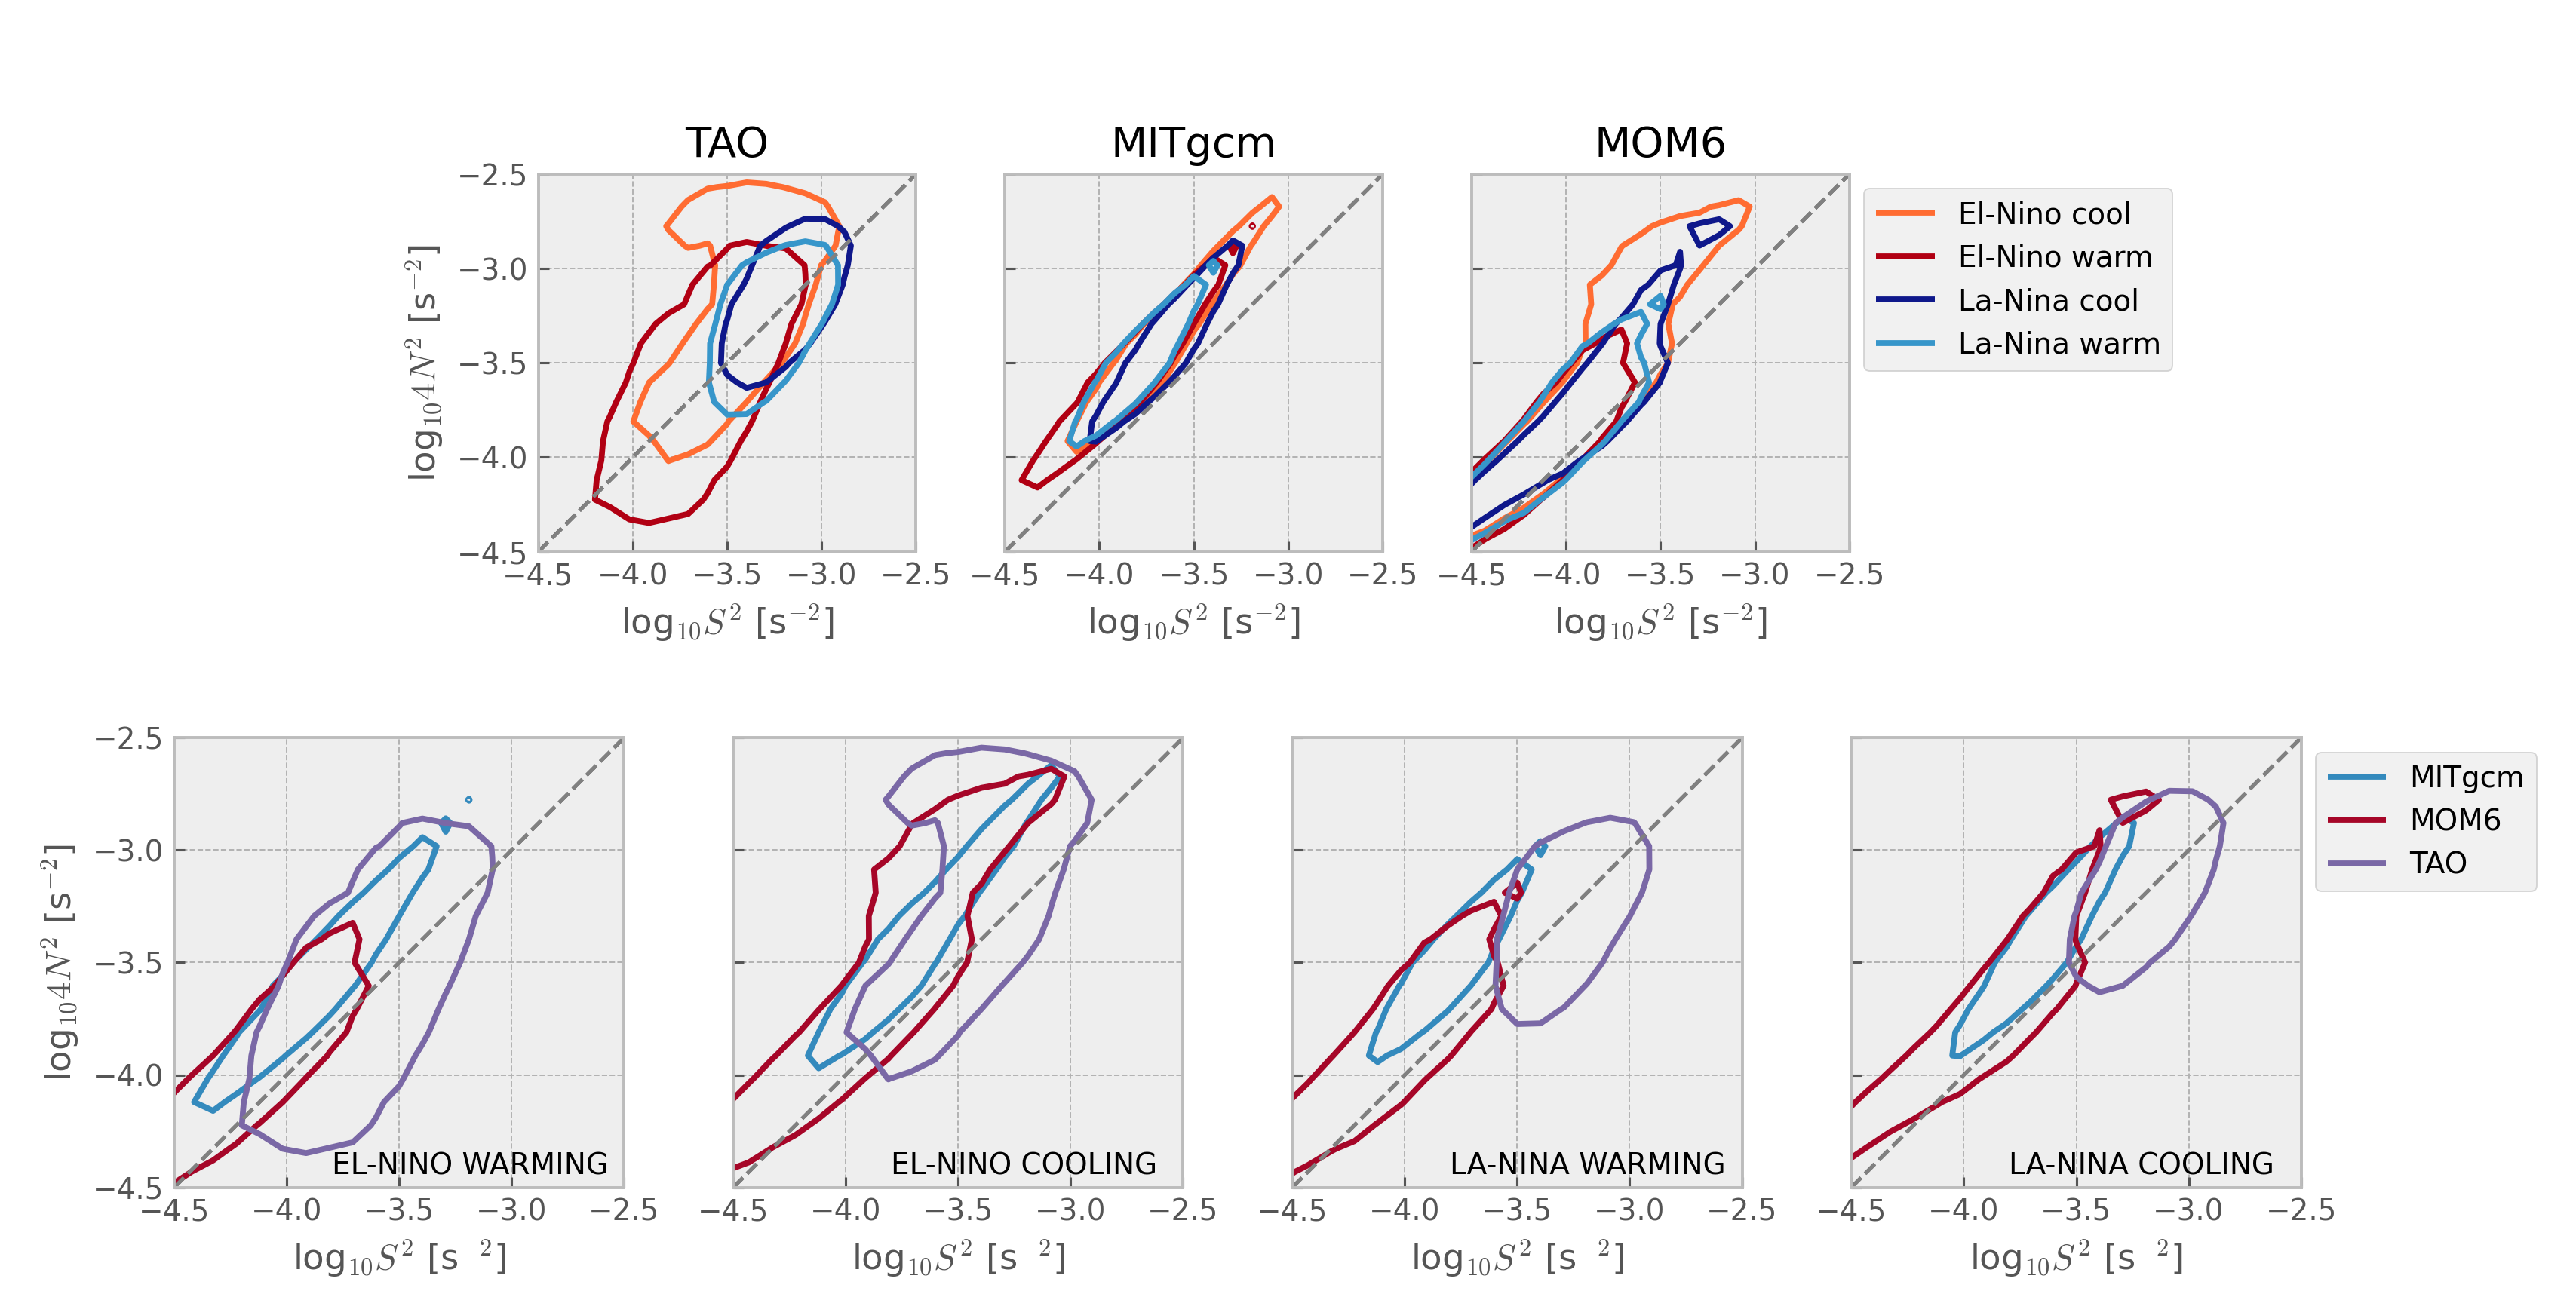
Stability diagram: 4N2-S2 plane#
Warner & Moum (2019):
Both velocity and temperature are hourly averaged before interpolation to 5-m vertical bins
Contours enclose 50% of data
Compare daily vs hourly frequency#
resampled = tree.from_dict(
{k: v.ds.resample(time="D").mean() for k, v in tree.children.items()}
)
# resampled["TAO"].update(mixpods.prepare(resampled["TAO"].ds, oni=mixpods.process_oni()))
for name, node in resampled.children.items():
node.update(
mixpods.prepare(
node.ds,
oni=tree[name]["oni"].resample(time="D").mean().reset_coords(drop=True),
)
)
node.update(mixpods.pdf_N2S2(node.ds))
mixpods.validate_tree(node)
resampled = mixpods.load_tree(resampled)
tree = mixpods.load_tree(tree)
fig = plt.figure(constrained_layout=True, figsize=(12, 6))
subfigs = fig.subfigures(2, 1)
mixpods.plot_stability_diagram_by_dataset(tree, fig=subfigs[0])
mixpods.plot_stability_diagram_by_dataset(resampled, fig=subfigs[1])
Older#
Show code cell source
mixpods.plot_stability_diagram_by_dataset(datasets)
Show code cell source
mixpods.plot_stability_diagram_by_phase(datasets, obs="TAO", fig=None)
Composed#
excluding MLD#
have not matched vertical grid spacing yet.
minor axis is smaller for increasing shear with KPP
prandtl number
interpolate to TAO grid
hybrid HYCOM-like case may have equatorial refinement of vertical grid above EUC
compare hybrid coordinate case resolution
instrumental error on vertical gradients for S2, N2;
if added to model, would it change the bottom tail.
Horizontal or vertical res:
MOM6 at 5km? hah
TIW compositing? La-NIna dec?
top end’s are similar, so maybe not?
sensitivity of cold tongue mean state
horizontal viscosity; controls EUC strength? (increase?)
vertical res; yan li’s paper
POP :thermocline always too diffuse and EUC too thick;
higher order interpolants can control amount diffusion when remapping
get S2, N2 from TPOSE?
Questions:
internal wave spectrum?
minor axis is smaller for model, particularly MITgcm-> too diffusive?
Can we think of this as the model relaxing to critical Ri too quickly
tree = mixpods.load_tree(tree)
fig = plt.figure(constrained_layout=True, figsize=(12, 6))
subfigs = fig.subfigures(2, 1)
mixpods.plot_stability_diagram_by_dataset(tree, fig=subfigs[0])
mixpods.plot_stability_diagram_by_phase(tree, fig=subfigs[1])
Show code cell source
fig = plt.figure(constrained_layout=True, figsize=(12, 6))
subfigs = fig.subfigures(2, 1)
mixpods.plot_stability_diagram_by_dataset(tree, fig=subfigs[0])
mixpods.plot_stability_diagram_by_phase(tree, fig=subfigs[1])
including MLD#
Show code cell source
fig = plt.figure(constrained_layout=True, figsize=(12, 6))
subfigs = fig.subfigures(2, 1, height_ratios=[1.2, 1])
top = subfigs[0].subfigures(1, 3, width_ratios=[1, 5, 1])
mixpods.plot_stability_diagram_by_dataset(datasets, fig=top[1])
mixpods.plot_stability_diagram_by_phase(datasets, fig=subfigs[1])
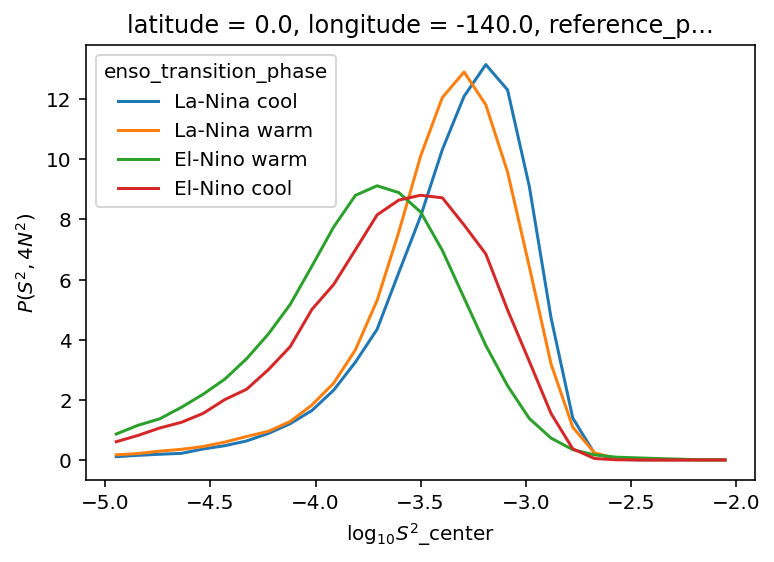
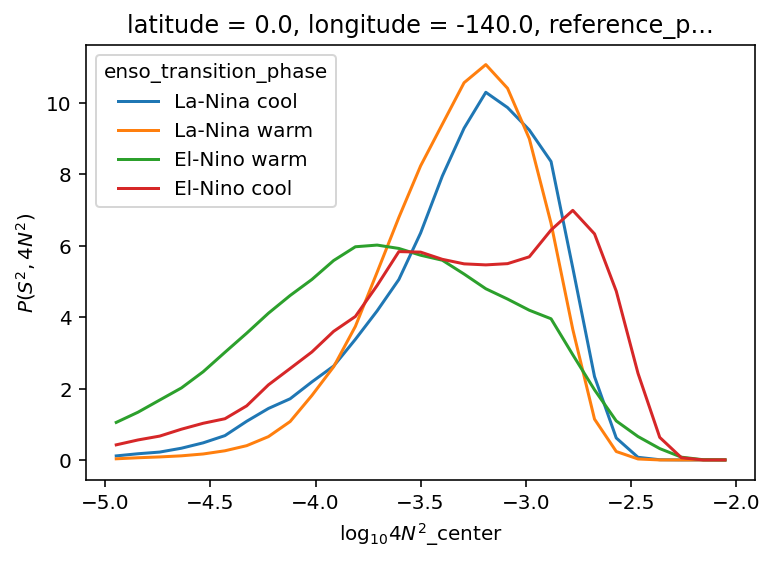
(
tao_gridded.n2s2pdf.sel(
enso_transition_phase=[
"La-Nina cool",
"La-Nina warm",
"El-Nino warm",
"El-Nino cool",
]
)
.sum("N2_bins")
.plot(hue="enso_transition_phase")
)
plt.figure()
(
tao_gridded.n2s2pdf.sel(
enso_transition_phase=[
"La-Nina cool",
"La-Nina warm",
"El-Nino warm",
"El-Nino cool",
]
)
.sum("S2_bins")
.plot(hue="enso_transition_phase")
)
[<matplotlib.lines.Line2D>,
<matplotlib.lines.Line2D>,
<matplotlib.lines.Line2D>,
<matplotlib.lines.Line2D>]
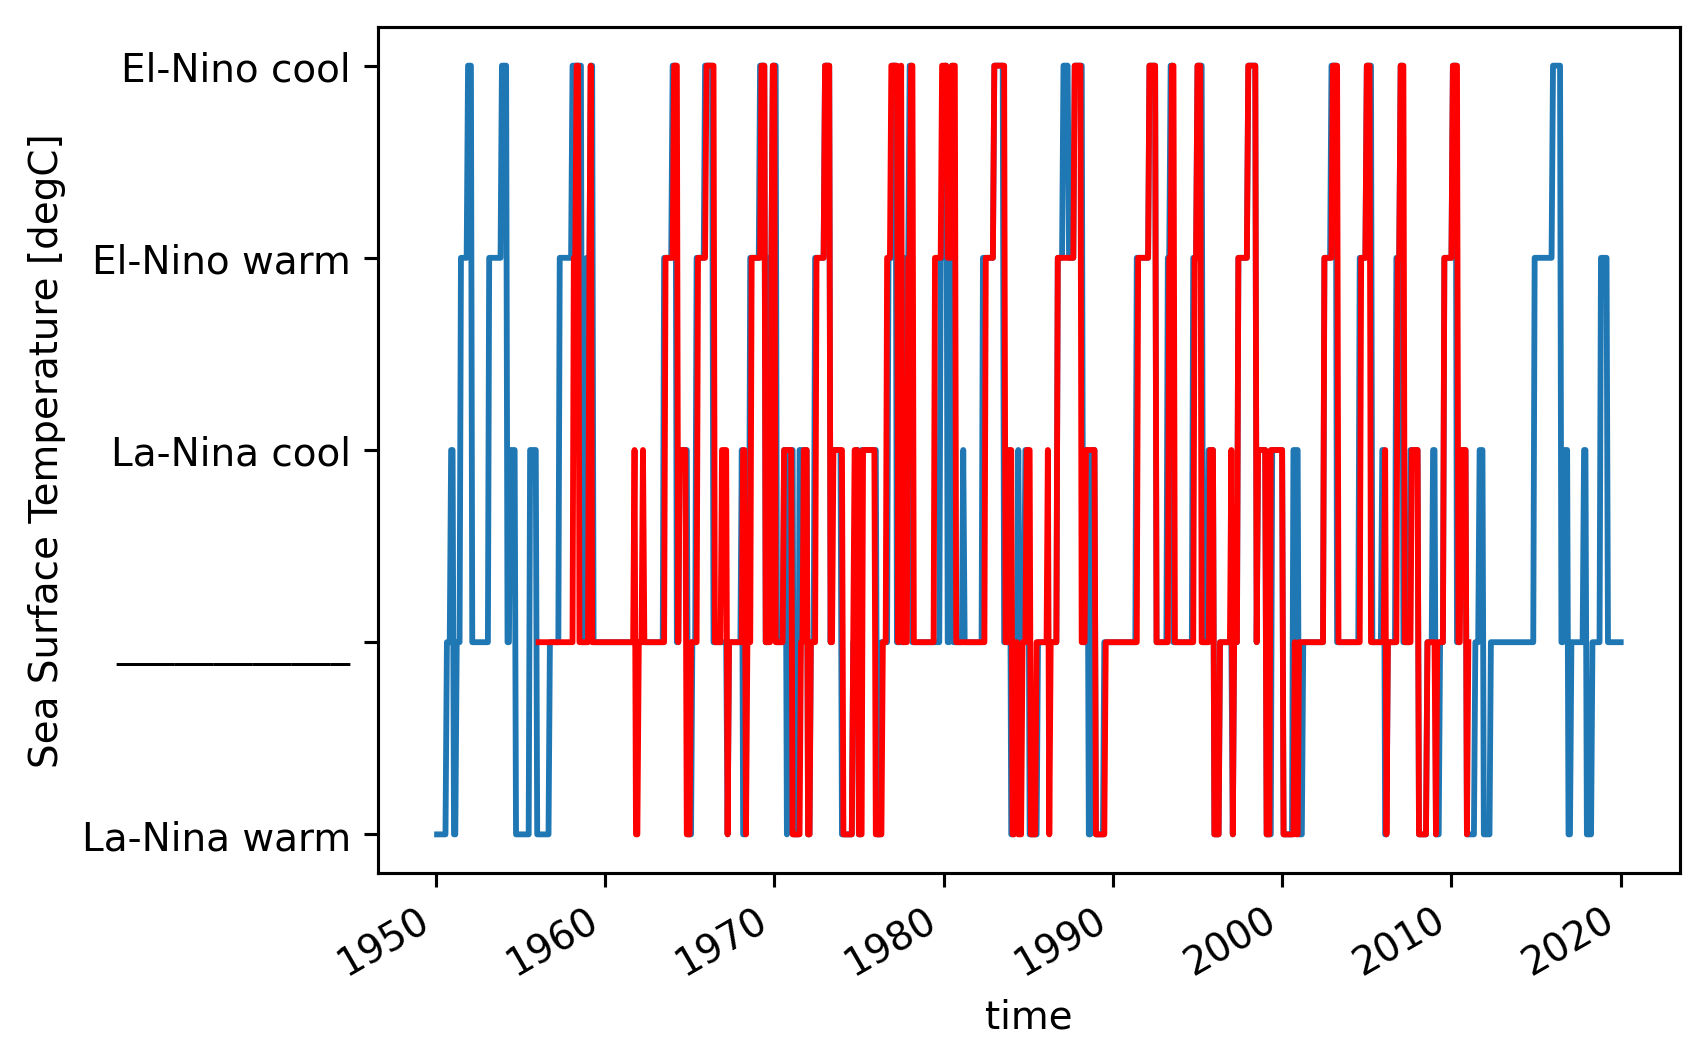
oni = pump.obs.process_oni().sel(time=slice("2005-Oct", "2015"))
(
oni.hvplot.step(color="k")
+ pump.obs.make_enso_transition_mask()
.sel(time=slice("2005-Jun", "2015"))
.reset_coords(drop=True)
.hvplot.step()
).cols(1)
Turbulence#
TODO Mean Turbulence Variable Profiles : depth-space#
h = {
varname: mixpods.map_hvplot(
lambda node, name, muted: (
node.ds.cf[varname]
.reset_coords(drop=True)
.hvplot.line(
ylabel=varname,
label=name,
logx=varname != "sea_water_x_velocity",
invert=True,
)
),
tree,
)
for varname in [
"sea_water_x_velocity",
"sea_water_potential_temperature",
"chi",
"eps",
"ocean_vertical_heat_diffusivity",
"ocean_vertical_momentum_diffusivity",
]
}
h["chi"].opts(ylim=(1e-9, 1e-4))
h["eps"].opts(ylim=(1e-9, 1e-4))
h["ocean_vertical_heat_diffusivity"].opts(ylim=(5e-7, 3))
h["ocean_vertical_momentum_diffusivity"].opts(ylim=(1e-6, 1e-1))
h2 = {
varname: mixpods.map_hvplot(
lambda node, name, muted: node.ds[varname]
.reset_coords(drop=True)
.hvplot.line(ylabel=varname, label=name, logx=False, invert=True),
tree,
)
for varname in ["Rig_T"]
}
plot = (
hv.Layout(list(h.values()) + [h2["Rig_T"].opts(ylim=(0, 3))])
.opts(
hv.opts.Curve(frame_width=150, frame_height=300, xlim=(-150, 150)),
hv.opts.Layout(shared_axes=True),
hv.opts.Overlay(show_legend=True, show_grid=True, legend_position="right"),
*mixpods.HV_TOOLS_OPTIONS,
*mixpods.PRESENTATION_OPTS,
)
.cols(4)
)
select_legends(plot, figure_index=3, legend_position="right")
mixpods.map_hvplot(
lambda ds, name, muted: ds.ds.cf["ocean_vertical_heat_diffusivity"]
.mean("time")
.hvplot.line(label=name, muted=muted),
tree,
).opts(
ylim=(1e-8, 1e1),
legend_position="right",
logx=True,
invert_axes=True,
frame_width=300,
aspect=1 / 3,
)
WARNING:param.OverlayPlot19684: Due to internal constraints, when aspect and width/height is set, the bokeh backend uses those values as frame_width/frame_height instead. This ensures the aspect is respected, but means that the plot might be slightly larger than anticipated. Set the frame_width/frame_height explicitly to suppress this warning.
WARNING:param.OverlayPlot19684: aspect value was ignored because absolute width and height values were provided. Either supply explicit frame_width and frame_height to achieve desired aspect OR supply a combination of width or height and an aspect value.
mixpods.map_hvplot(
lambda ds, name, muted: ds["eps"]
.mean("time")
.load()
.hvplot.line(label=name, muted=muted),
tree,
).opts(
ylim=(1e-10, None),
legend_position="right",
logx=True,
invert_axes=True,
frame_width=300,
aspect=1 / 3,
)
WARNING:param.OverlayPlot18581: Due to internal constraints, when aspect and width/height is set, the bokeh backend uses those values as frame_width/frame_height instead. This ensures the aspect is respected, but means that the plot might be slightly larger than anticipated. Set the frame_width/frame_height explicitly to suppress this warning.
WARNING:param.OverlayPlot18581: aspect value was ignored because absolute width and height values were provided. Either supply explicit frame_width and frame_height to achieve desired aspect OR supply a combination of width or height and an aspect value.
Dan’s suggestions#
I liked your effort to look at shear production= KmdU/dz dot dU/dz = dissipation. I mentioned that it might be worth looking at
buoyancy flux = KT dT/dz * db/dT + KS dS/dz * db/dSwith db/dT, db/dS from equation of state. I think I said KT*N^2, but I hope after checking that this is the same in this region (K_T~K_S). You could then divide buoyancy flux by 0.2 to estimate epsilon for comparison with your estimate based on shear production.
Dimensionless parameters. We alluded to this, but I think it would be interesting to explicitly quantify flux Richardson number Rif= buoyancy flux/shear production (as defined above). And Prt=KT/Km=Rif/Rig, where Rig is the usual gradient Richardson number. Following a similar logic, you might look at Reb= epsilon/nu N^2 with nu constant 1e-6 molecular viscosity. We discussed looking at diffusivity and viscosity in addition to epsilon. But note the similarity between dimensionless diffusivity KT/kappa and viscosity Km/nu, i.e. Reb=Rig*KM/nu. (with kappa a constant molecular diffusivity to make dimensionless)
I like how you continue to push what we can learn from the distributions in S2-N2 parameter space in addition to physical space. It is good for comparing with limited observations or process models. I think you can push this even further to develop metrics quantifying how the momentum and buoyancy fluxes “tango” with each other and with S2 and N2. In addition, perhaps it would be valuable to flip the perspective and look at shear-production-buoyancy flux space? Or consider various two-dimensional spaces of non-dimensional parameters mentioned above: Rig, Reb, Rif, KT/kappa, Km/nu.
Finally, I think it would be interesting to try to examine how momentum flux and shear production below the mixed layer relate to wind stress as well as the local shear. There might be a relationship that emerges in KPP, even if the K profile is formally dependent only on local Rig at these depths.
Deepening#
TODO think about local time zone conversion
Moum et al (2023)
We quantify the progression in time of the deepening of DC turbulence shown in Figures 7–9 by finding the time of the maximum rate of increase of \(𝜖\), \(𝜖_{𝑚𝑎𝑥}^𝑡\) , from each series after filtering each series at 1 hour. This analysis yields the deepening trajectories shown in Figures 10a-c, at the depths where an unambiguous determination of \(𝜖^{𝑚𝑎𝑥}_𝑡\) could be made. These trajectories show the arrival of DC turbulence to be progressively delayed at all depths with weakening winds.
Using a 5 hour running mean smoother
eps = dailies.dc.subset_nodes("eps").dc.concatenate_nodes().eps
layout = (
eps.sel(node="TAO")
.drop_vars("tau_bins")
.hvplot.line(x="hour", col="depth", by="tau_bins", logy=True)
)
layout
/glade/u/home/dcherian/miniconda3/envs/pump/lib/python3.10/site-packages/holoviews/plotting/bokeh/plot.py:588: UserWarning: found multiple competing values for 'toolbar.active_drag' property; using the latest value
plot = gridplot(plots[::-1],
/glade/u/home/dcherian/miniconda3/envs/pump/lib/python3.10/site-packages/holoviews/plotting/bokeh/plot.py:588: UserWarning: found multiple competing values for 'toolbar.active_scroll' property; using the latest value
plot = gridplot(plots[::-1],
idx = (
eps.diff("hour") # .isel(depth=0)
.rolling(hour=5, center=True, min_periods=1)
.mean()
.idxmax("hour")
.assign_attrs(long_name="time of max $ε_t$")
)
# mask = ((-1 * idx.diff("depth", label="lower")) < 0).reindex(
# depth=idx.depth, fill_value=False
# )
# idx = xr.where(mask, idx + 12, idx)
start = (3, -30)
end = 12
plot = hv.Layout(
[
da.hvplot.line(y="depth", by="node")
* hv.Curve([start, (end, -30 - 6 * (end - start[0]))]).opts(
line_dash="dashed", line_color="k"
)
for _, da in idx.groupby("tau_bins")
]
).opts(
hv.opts.Curve(frame_height=300, frame_width=250),
*mixpods.HV_TOOLS_OPTIONS,
*mixpods.PRESENTATION_OPTS
)
select_legends(plot, 2, legend_position="right")
/glade/u/home/dcherian/miniconda3/envs/pump/lib/python3.10/site-packages/holoviews/plotting/bokeh/plot.py:967: UserWarning: found multiple competing values for 'toolbar.active_drag' property; using the latest value
layout_plot = gridplot(
(
eps.isel(depth=[0, 1, 2])
# .diff("hour")
.rolling(hour=5, center=True, min_periods=1).mean()
# .idxmax("hour")
.assign_attrs(long_name="time of max $ε_t$", units=None)
# .drop_vars("tau_bins")
.plot(col="depth", hue="tau_bins", yscale="log")
)
fg = eps.plot(x="hour", hue="depth", col="tau_bins", yscale="log")
for ax, loc in zip(fg.axs.flat, fg.name_dicts.flat):
hour = idx.sel(loc)
eps.sel(**loc, hour=hour).plot.line(
ax=ax, x="hour", marker=".", ls="none", add_legend=False, _labels=False
)
Test with EQUIX#
ds = tree["baseline.kpp.lmd.004"].to_dataset()
jb = ds.Jb.cf.sel(Z=slice(-150, 0), time=slice("2008-10-28", "2008-10-30")).load()
jb.hvplot.quadmesh(x="time", y="zi")
/glade/u/home/dcherian/miniconda3/envs/pump/lib/python3.10/site-packages/bokeh/core/property/bases.py:273: DeprecationWarning: elementwise comparison failed; this will raise an error in the future.
return new == old
/glade/u/home/dcherian/miniconda3/envs/pump/lib/python3.10/site-packages/bokeh/core/property/bases.py:273: DeprecationWarning: elementwise comparison failed; this will raise an error in the future.
return new == old
eps = (
ds.eps.cf.sel(Z=slice(-150, 0), time=slice("2008-10-28", "2008-10-30"))
.resample(time="H")
.mean()
)
(eps.reset_coords(drop=True).hvplot.quadmesh(x="time", clim=(1e-9, 1e-6), cnorm="log"))
/glade/u/home/dcherian/miniconda3/envs/pump/lib/python3.10/site-packages/bokeh/core/property/bases.py:273: DeprecationWarning: elementwise comparison failed; this will raise an error in the future.
return new == old
/glade/u/home/dcherian/miniconda3/envs/pump/lib/python3.10/site-packages/bokeh/core/property/bases.py:273: DeprecationWarning: elementwise comparison failed; this will raise an error in the future.
return new == old
(
eps.diff("time")
.cf.sel(Z=-30, method="nearest")
.resample(time="D")
.map(lambda eps: eps.idxmax("time"))
.load()
)
<xarray.DataArray 'time' (time: 3)>
2008-10-28T14:00:00 2008-10-29T11:00:00 2008-10-30T15:00:00
Coordinates:
yh float64 0.0625
yq float64 -0.0625
xh float64 -140.0
zi float64 -30.1
* time (time) datetime64[ns] 2008-10-28 2008-10-29 2008-10-30
Attributes:
long_name: $ε$
units: W/kgDaily composites#
S2-N2 histogram by hour of day?
daily composites by el-nino phase
figure out what wind stress is used
wind stress diurnal cycle
wind stress in model is relative wind
look at the coupled model
either turbulence parameters
Jess Masich’s papers?
MOM6 uses Large & Pond; χpods use Large & Pond
does it have gustiness; MOM6 uses wind averaged over coupling interval;
Look at 69m-89m range with medium wind stress
Need to get rid of EUC effect:
either EUC-relative coordinate system
or use K, which removes a S2 factor
Do buoyancy flux or Γ
h = mixpods.plot_daily_composites(
dailies.dc.subset_nodes(["S2", "N2", "Rig_T"]), logy=False
).opts(
hv.opts.Curve(frame_width=200, xrotation=45),
hv.opts.GridSpace(show_legend=True),
)
h
h = mixpods.plot_daily_composites(
dailies.dc.subset_nodes(["eps", "KT", "chi"]), logy=True
)
h.opts(
hv.opts.Curve(frame_width=200, xrotation=45),
hv.opts.GridSpace(show_legend=True),
)
ε-Ri means#
mixpods.map_hvplot(
lambda dt, name, muted: mixpods.plot_eps_ri_hist(
dt["eps_ri"].load(), label=name, muted=muted
),
tree.children,
).opts(show_legend=True).opts(hv.opts.Curve(ylim=(1e-8, 2e-6)))
Ri_f histogram#
(
np.log10(np.abs(baseline.Rif.cf.sel(Z=slice(-110, 0))))
.reset_coords(drop=True)
.hvplot.hist(bins=np.linspace(-2, 1, 100))
) * hv.VLine(np.log10(0.2)).opts(line_color="k")
/glade/u/home/dcherian/miniconda3/envs/pump/lib/python3.10/site-packages/xarray/core/computation.py:771: RuntimeWarning: divide by zero encountered in log10
result_data = func(*input_data)
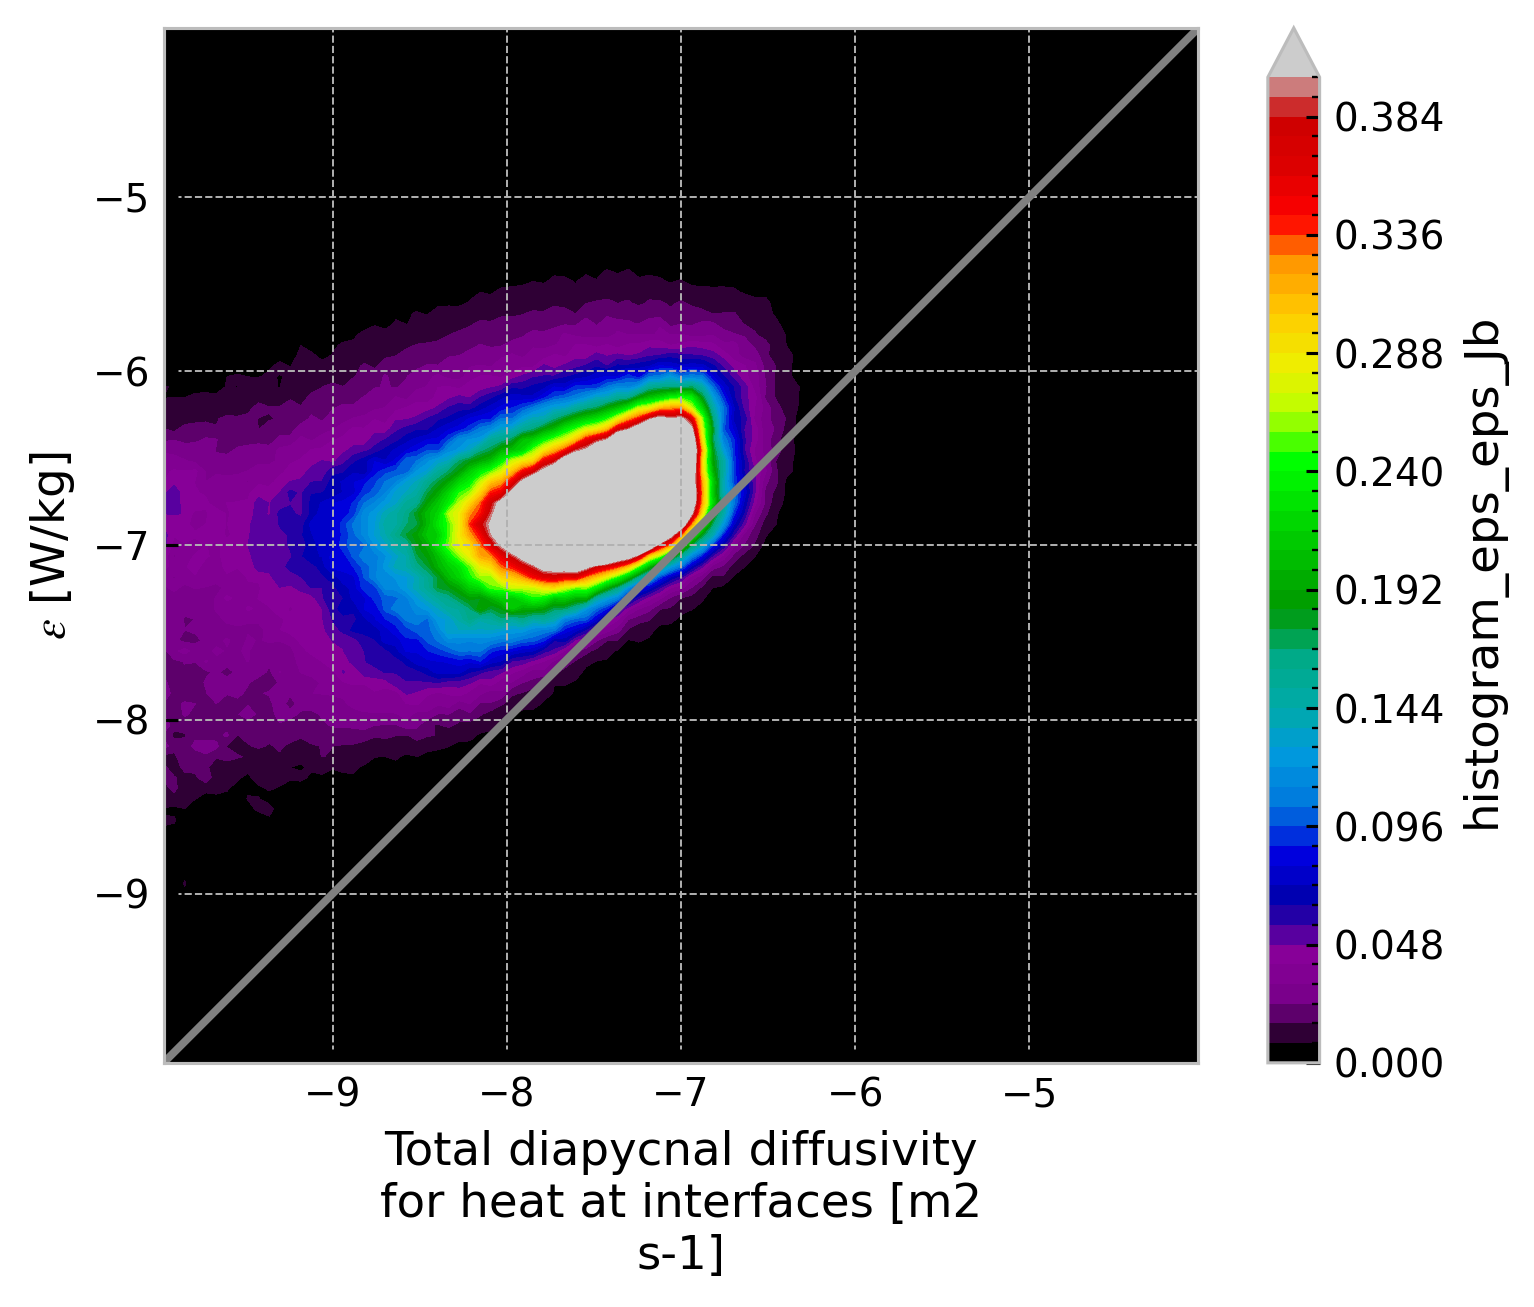
ε-Jb histogram#
from xhistogram.xarray import histogram
jpdf = histogram(
np.log10(baseline.eps),
np.log10(0.2 * baseline.eps_Jb),
density=True,
bins=np.linspace(-10, -4, 100),
).compute()
jpdf.plot.contourf(levels=52, robust=True, cmap=mpl.cm.nipy_spectral)
dcpy.plots.line45()
from mom6_tools import wright_eos
mom6tao = baseline
mom6tao["α"] = wright_eos.alpha_wright_eos(mom6tao.thetao, mom6tao.so, p=0)
mom6tao["α"].attrs = {
"standard_name": "sea_water_thermal_expansion_coefficient",
"units": "kg m-3 C-1",
}
mom6tao["β"] = wright_eos.beta_wright_eos(mom6tao.thetao, mom6tao.so, p=0)
mom6tao["β"].attrs = {
"standard_name": "sea_water_haline_contraction_coefficient",
"units": "kg m-3",
}
(
baseline.Kd_heat * baseline.α * baseline.Tz
+ baseline.Kd_heat * baseline.β * baseline.Sz
)
<xarray.DataArray (time: 507264, zi: 27, zl: 27)>
dask.array<chunksize=(8760, 26, 27), meta=np.ndarray>
Coordinates: (12/14)
* time (time) datetime64[ns] 1958-01-06T00:30:00 ... 2016-12-31...
xh float64 -140.0
yh float64 0.0625
yq float64 -0.0625
* zi (zi) float64 -230.8 -212.0 -194.4 -177.8 ... -5.0 -2.5 -0.0
eucmax (time) float64 dask.array<chunksize=(8760,), meta=np.ndarray>
... ...
en_mask (time) bool False False False False ... False False False
ln_mask (time) bool False False False False ... False False False
warm_mask (time) bool True True True True ... True True True True
cool_mask (time) bool False False False False ... False False False
enso_transition (time) <U12 '____________' ... '____________'
* zl (zl) float64 -240.8 -221.4 -203.2 ... -6.25 -3.75 -1.25
Attributes:
cell_measures: area: areacello
cell_methods: area:mean zi:point yh:mean xh:mean time: mean
long_name: Total diapycnal diffusivity for heat at interfaces
time_avg_info: average_T1,average_T2,average_DT
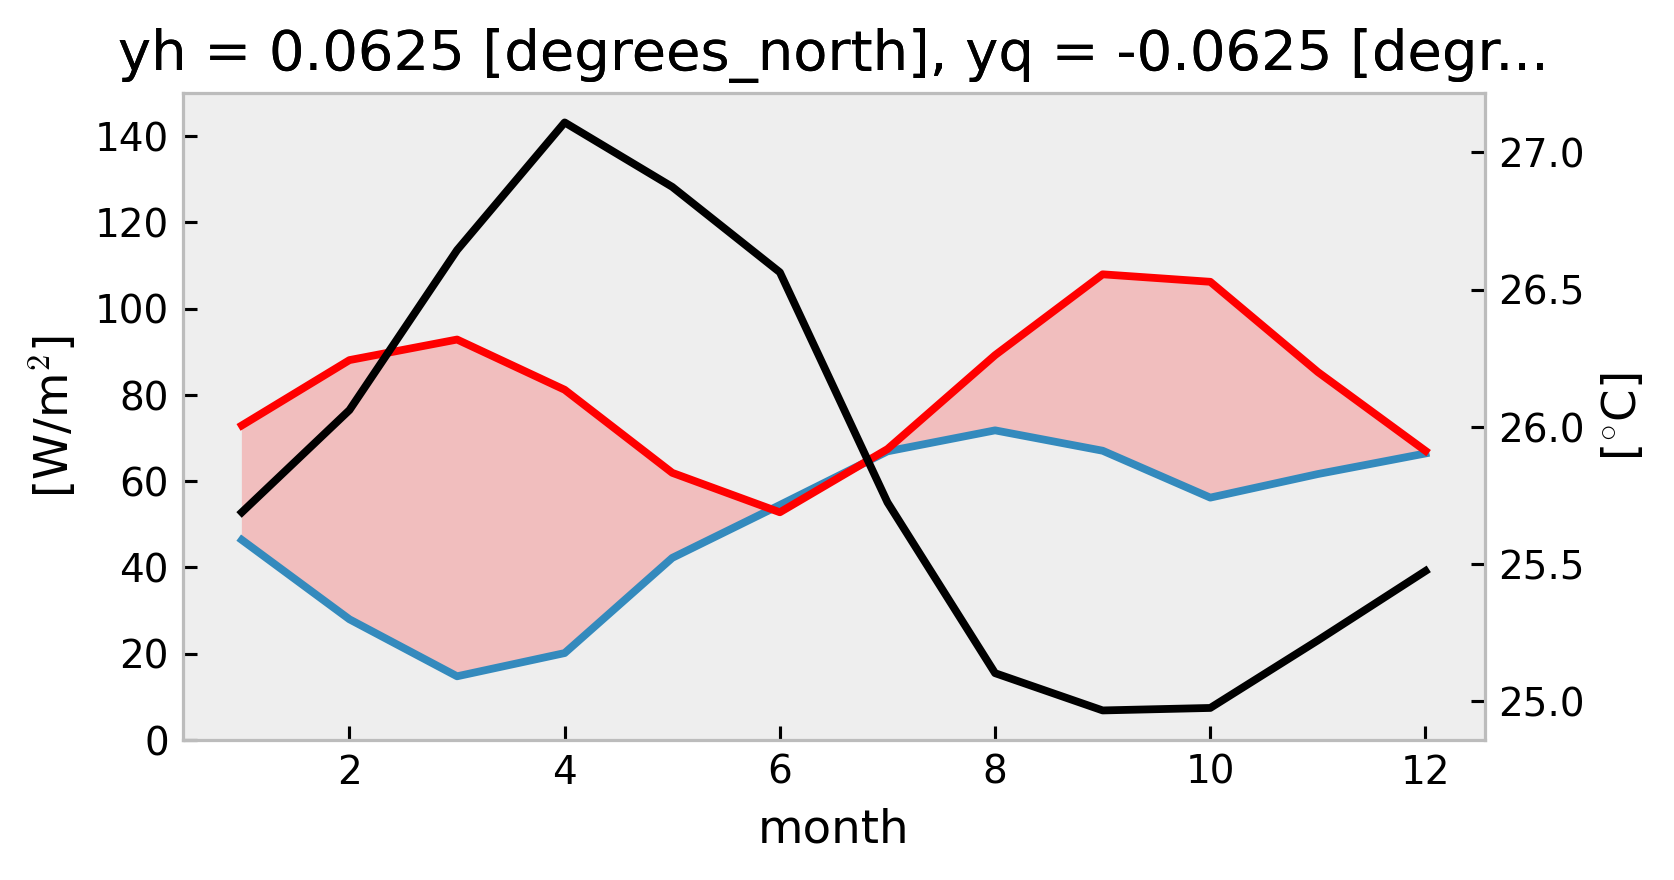
units: m2 s-1Mean SST, Jq#
def flatten(tree):
varnames = next(iter(tree.children.values())).data_vars
out = xr.Dataset()
coord = xr.DataArray(list(tree.keys()), dims="node")
for var in varnames:
variables = (node[var] for name, node in tree.children.items())
out[var] = xr.concat(variables, dim=coord)
return out
sub = tree.map_over_subtree(
lambda node: (
node.cf[["Jq", "sea_surface_temperature", "ocean_vertical_heat_diffusivity"]]
.pipe(np.abs)
.cf.rename(
{"sea_surface_temperature": "sst", "ocean_vertical_heat_diffusivity": "KT"}
)
.cf.sel(Z=slice(-60, -20))
# .cf.mean("Z")
.cf.groupby("time.month")
.mean(["Z", "time"])
.load()
)
).pipe(flatten)
h = (
sub.Jq.hvplot.line(by="node", legend=True)
+ sub.sst.hvplot.line(by="node", logy=True, legend=True)
).cols(1)
h
vertical = tree.map_over_subtree(
lambda node: (
node.cf[["Jq", "ocean_vertical_heat_diffusivity"]]
.cf.rename({"ocean_vertical_heat_diffusivity": "KT"})
.cf.sel(Z=slice(-120, -20))
.groupby("time.season")
.mean()
.sel(season=["DJF", "MAM", "JJA", "SON"])
.load()
)
)
seasonal = {}
seasonal["Jq"] = mixpods.map_hvplot(
lambda ds, name, muted: (
ds["Jq"]
.cf.rename({"Z": "depth"})
.hvplot.line(y="depth", col="season", label=name, muted=muted)
),
vertical.children,
)
seasonal["KT"] = mixpods.map_hvplot(
lambda ds, name, muted: (
ds["KT"]
.cf.rename({"Z": "depth"})
.hvplot.line(logx=True, y="depth", col="season", label=name, muted=muted)
),
vertical.children,
)
def hvplot_facet(tree, varname, col, **kwargs):
by = next(iter(tree.children.values()))[col].data
handles = []
for by_ in by:
handles.append(
hv.Overlay(
[
node.ds.cf[varname]
.sel({col: by_})
.hvplot.line(label=name, **kwargs)
for name, node in tree.children.items()
]
)
)
return hv.Layout(handles)
proc = vertical.map_over_subtree(lambda node: node.cf.rename({"Z": "Z"}))
layout = hv.Layout(
[
hvplot_facet(
proc,
varname="Jq",
col="season",
),
hvplot_facet(
proc,
varname="ocean_vertical_heat_diffusivity",
col="season",
logx=True,
ylim=(1e-6, 1e-1),
),
]
)
layout.opts(
hv.opts.Curve(invert_axes=True, xrotation=20, frame_width=160, frame_height=300),
hv.opts.Overlay(legend_position="bottom_left", shared_axes=True, labelled=["x"]),
)
mixpods.map_hvplot(
lambda ds, name, muted: (ds["Tz"] < 0)
.sum("time")
.hvplot.line(label=name, muted=muted, invert=True),
tree,
)
np.log10(tree["kpp.lmd.004"]["Kd_heat"].resample(time="M").mean()).hvplot.quadmesh(
y="zi"
)
mixpods.map_hvplot(
lambda ds, name, muted: ds.ds.cf["ocean_vertical_heat_diffusivity"]
.mean("time")
.hvplot.line(label=name, muted=muted),
tree.children,
).collate().opts(
ylim=(1e-8, 1e1),
legend_position="right",
logx=True,
invert_axes=True,
frame_width=300,
aspect=1 / 3,
)
WARNING:param.OverlayPlot02012: Due to internal constraints, when aspect and width/height is set, the bokeh backend uses those values as frame_width/frame_height instead. This ensures the aspect is respected, but means that the plot might be slightly larger than anticipated. Set the frame_width/frame_height explicitly to suppress this warning.
WARNING:param.OverlayPlot02012: aspect value was ignored because absolute width and height values were provided. Either supply explicit frame_width and frame_height to achieve desired aspect OR supply a combination of width or height and an aspect value.
WARNING:param.OverlayPlot02072: Due to internal constraints, when aspect and width/height is set, the bokeh backend uses those values as frame_width/frame_height instead. This ensures the aspect is respected, but means that the plot might be slightly larger than anticipated. Set the frame_width/frame_height explicitly to suppress this warning.
WARNING:param.OverlayPlot02072: aspect value was ignored because absolute width and height values were provided. Either supply explicit frame_width and frame_height to achieve desired aspect OR supply a combination of width or height and an aspect value.
mixpods.map_hvplot(
lambda ds, name, muted: ds["Jq"].mean("time").hvplot.line(label=name, muted=muted),
tree.children,
).collate().opts(
legend_position="right", invert_axes=True, frame_width=300, aspect=1 / 3
)
Histograms: Ri, ε#
take out MLD?
handles = [
mixpods.plot_distributions(tree, "chi", bins=np.linspace(-11, -4, 101), log=True),
mixpods.plot_distributions(tree, "eps", bins=np.linspace(-11, -4, 101), log=True),
mixpods.plot_distributions(
tree, "ocean_vertical_heat_diffusivity", bins=np.linspace(-8, -1, 101), log=True
),
# plot_distributions(tree, "Jq", bins=np.linspace(-1000, 0, 51), log=False),
mixpods.plot_distributions(tree, "Rig_T", np.linspace(-0.5, 1.5, 61))
* hv.VLine(0.25).opts(line_color="k"),
]
/glade/u/home/dcherian/miniconda3/envs/pump/lib/python3.10/site-packages/xarray/core/computation.py:761: RuntimeWarning: invalid value encountered in log10
result_data = func(*input_data)
/glade/u/home/dcherian/miniconda3/envs/pump/lib/python3.10/site-packages/xarray/core/computation.py:761: RuntimeWarning: invalid value encountered in log10
result_data = func(*input_data)
plot = (
hv.Layout(handles)
.opts("Overlay", frame_width=500)
.cols(2)
.opts(*mixpods.HV_TOOLS_OPTIONS)
)
select_legends(plot, figure_index=1, legend_position="right")
/glade/u/home/dcherian/miniconda3/envs/pump/lib/python3.10/site-packages/holoviews/plotting/bokeh/plot.py:967: UserWarning: found multiple competing values for 'toolbar.active_drag' property; using the latest value
layout_plot = gridplot(
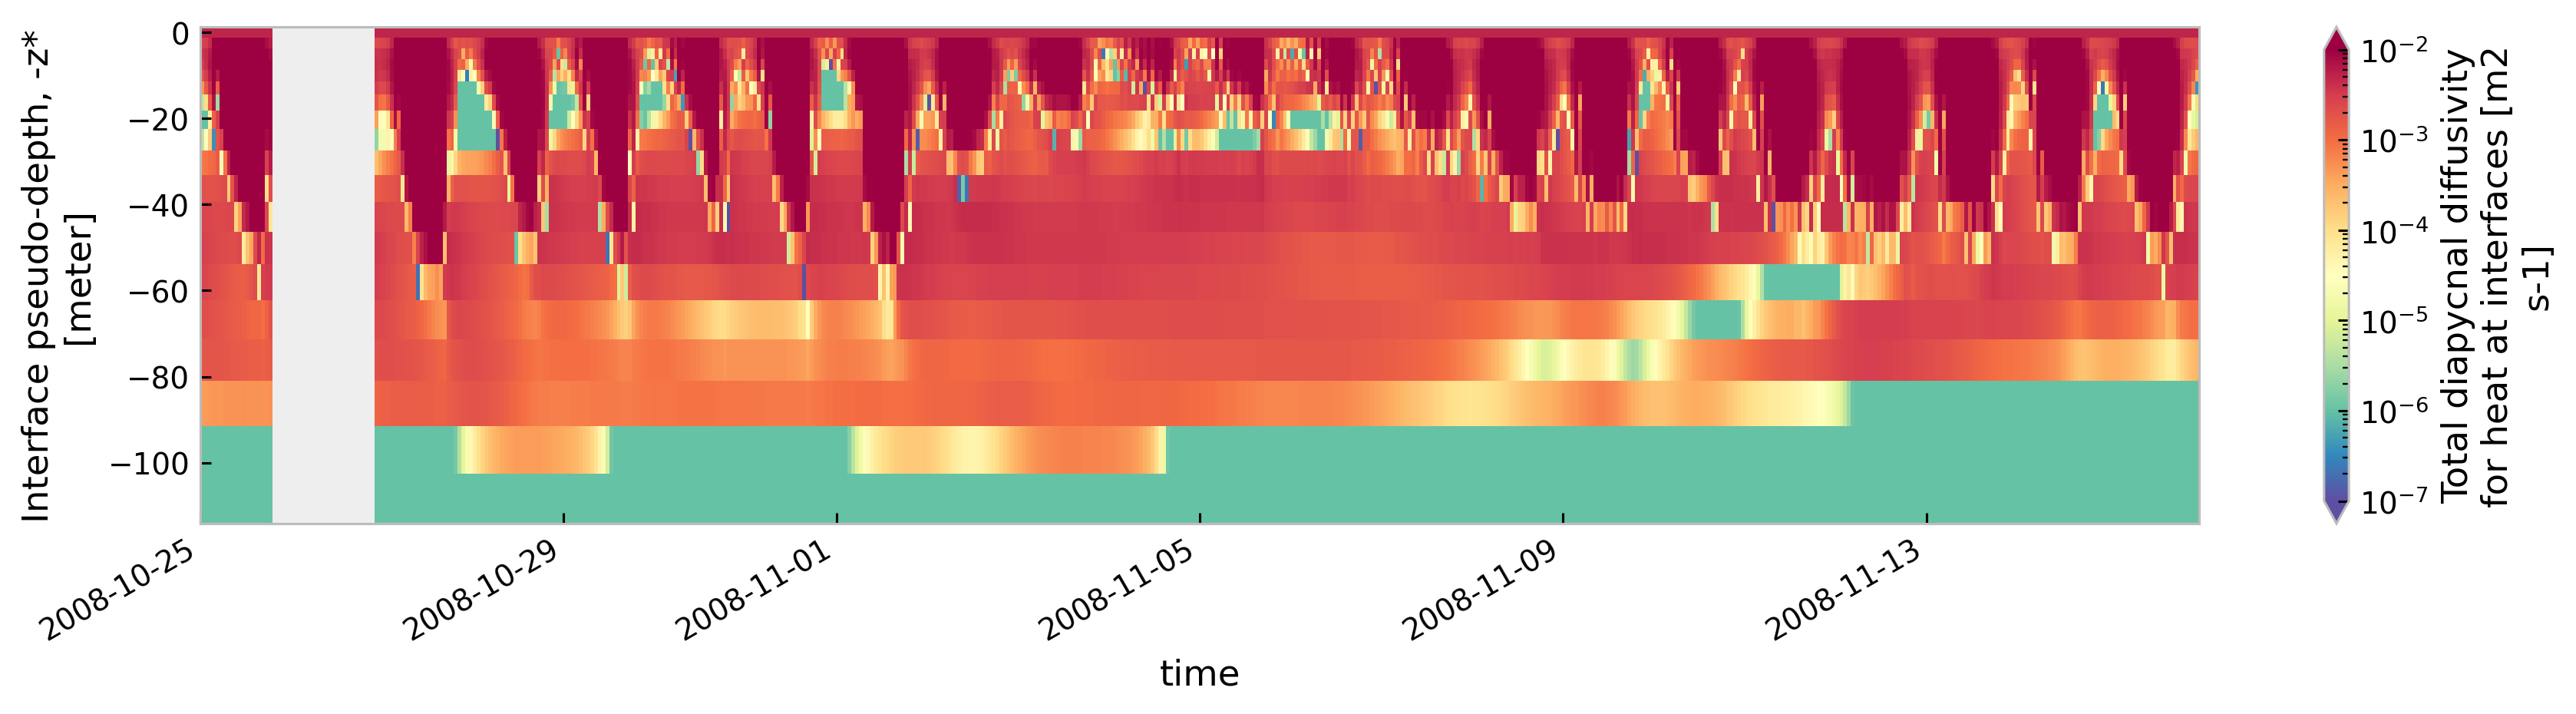
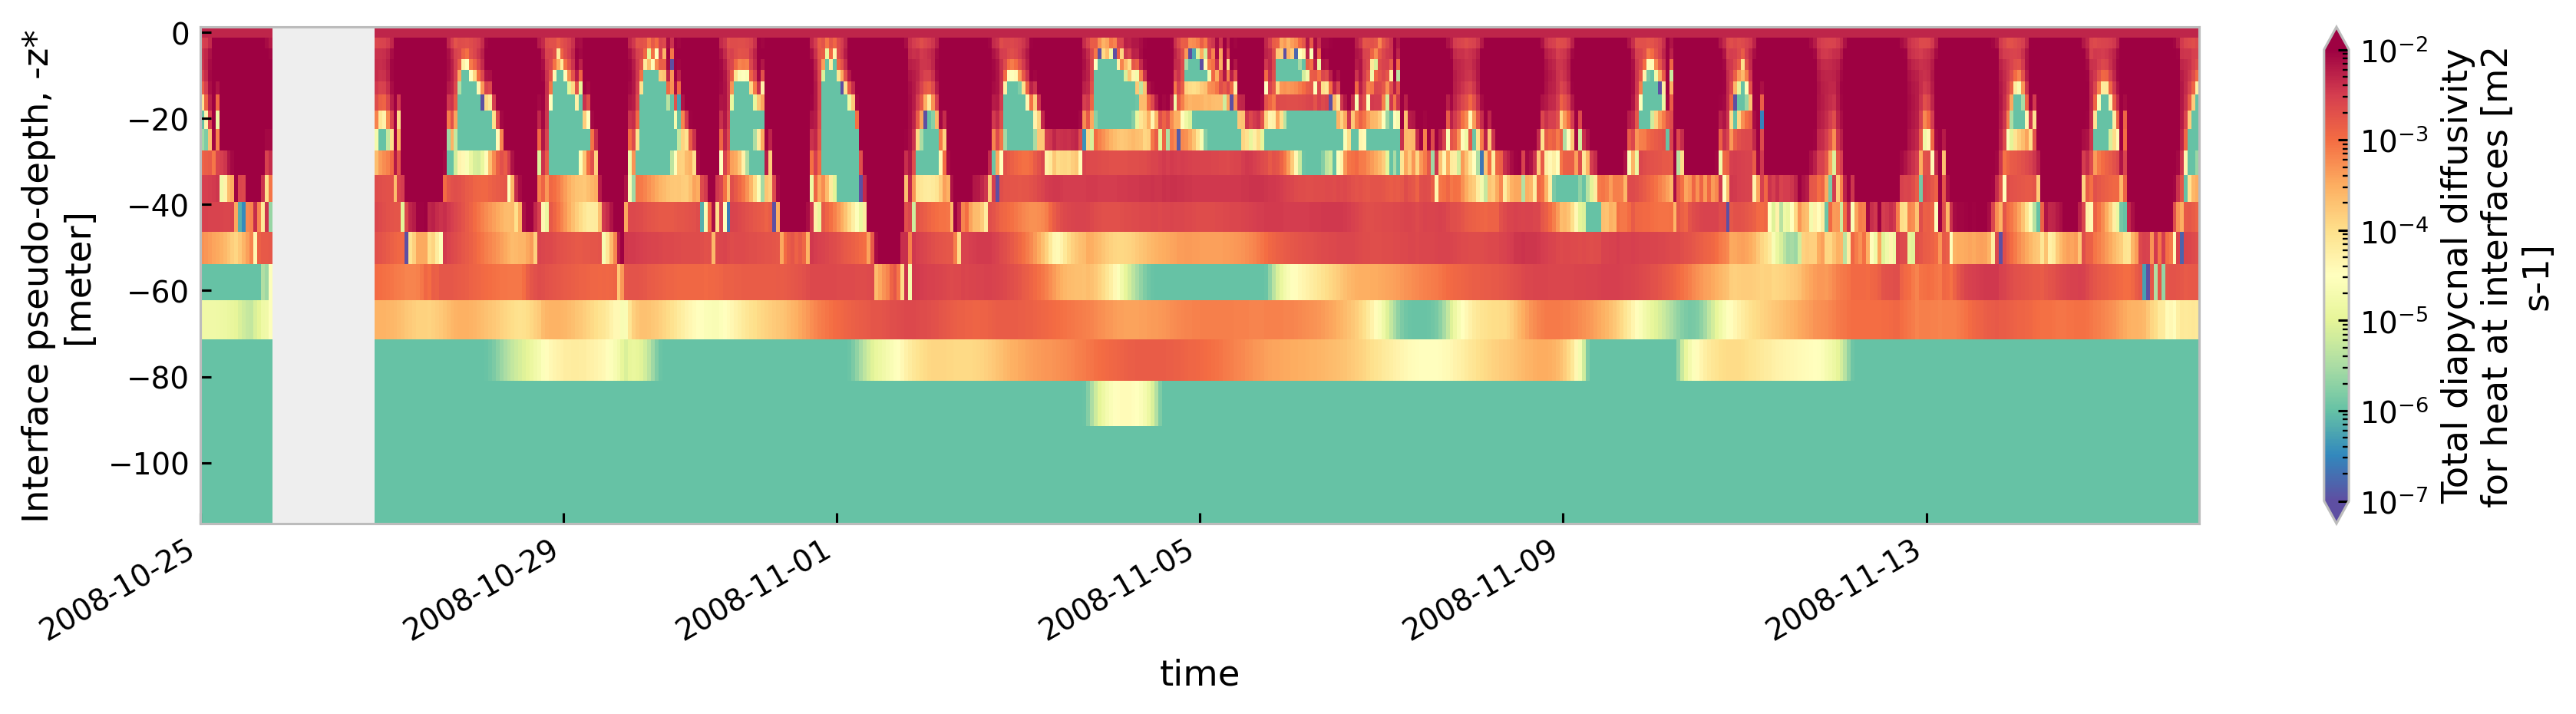
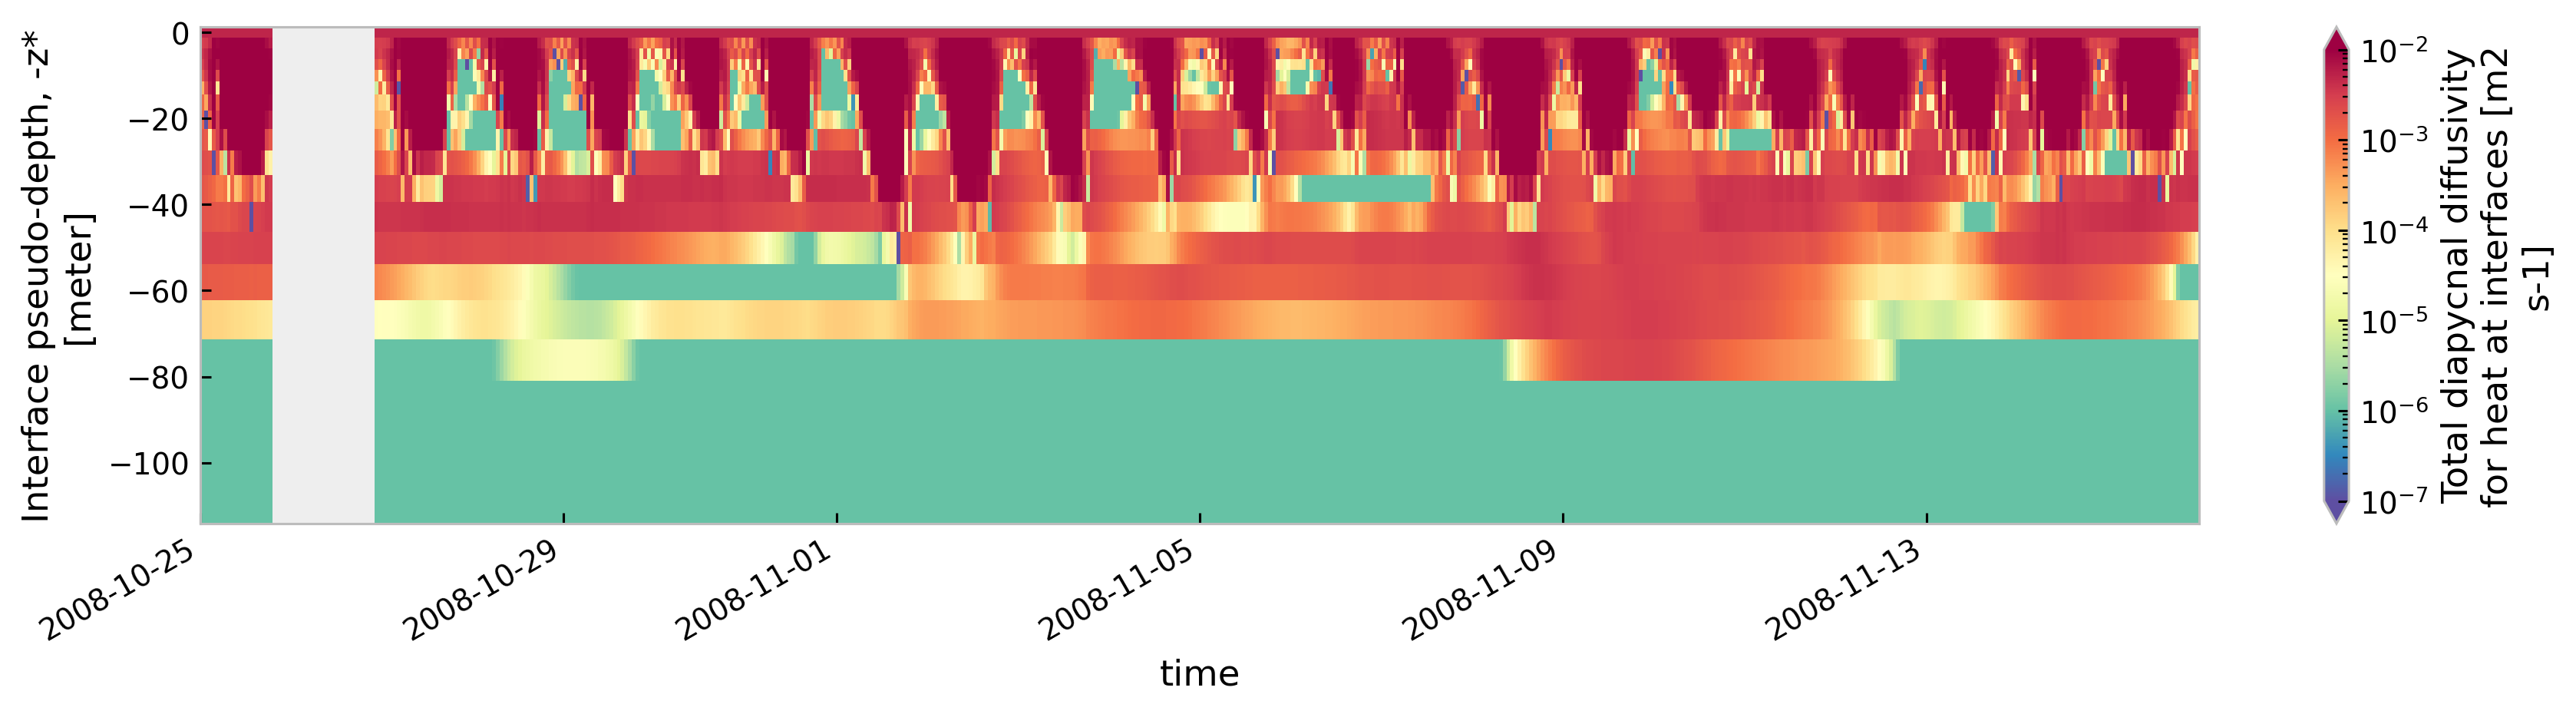
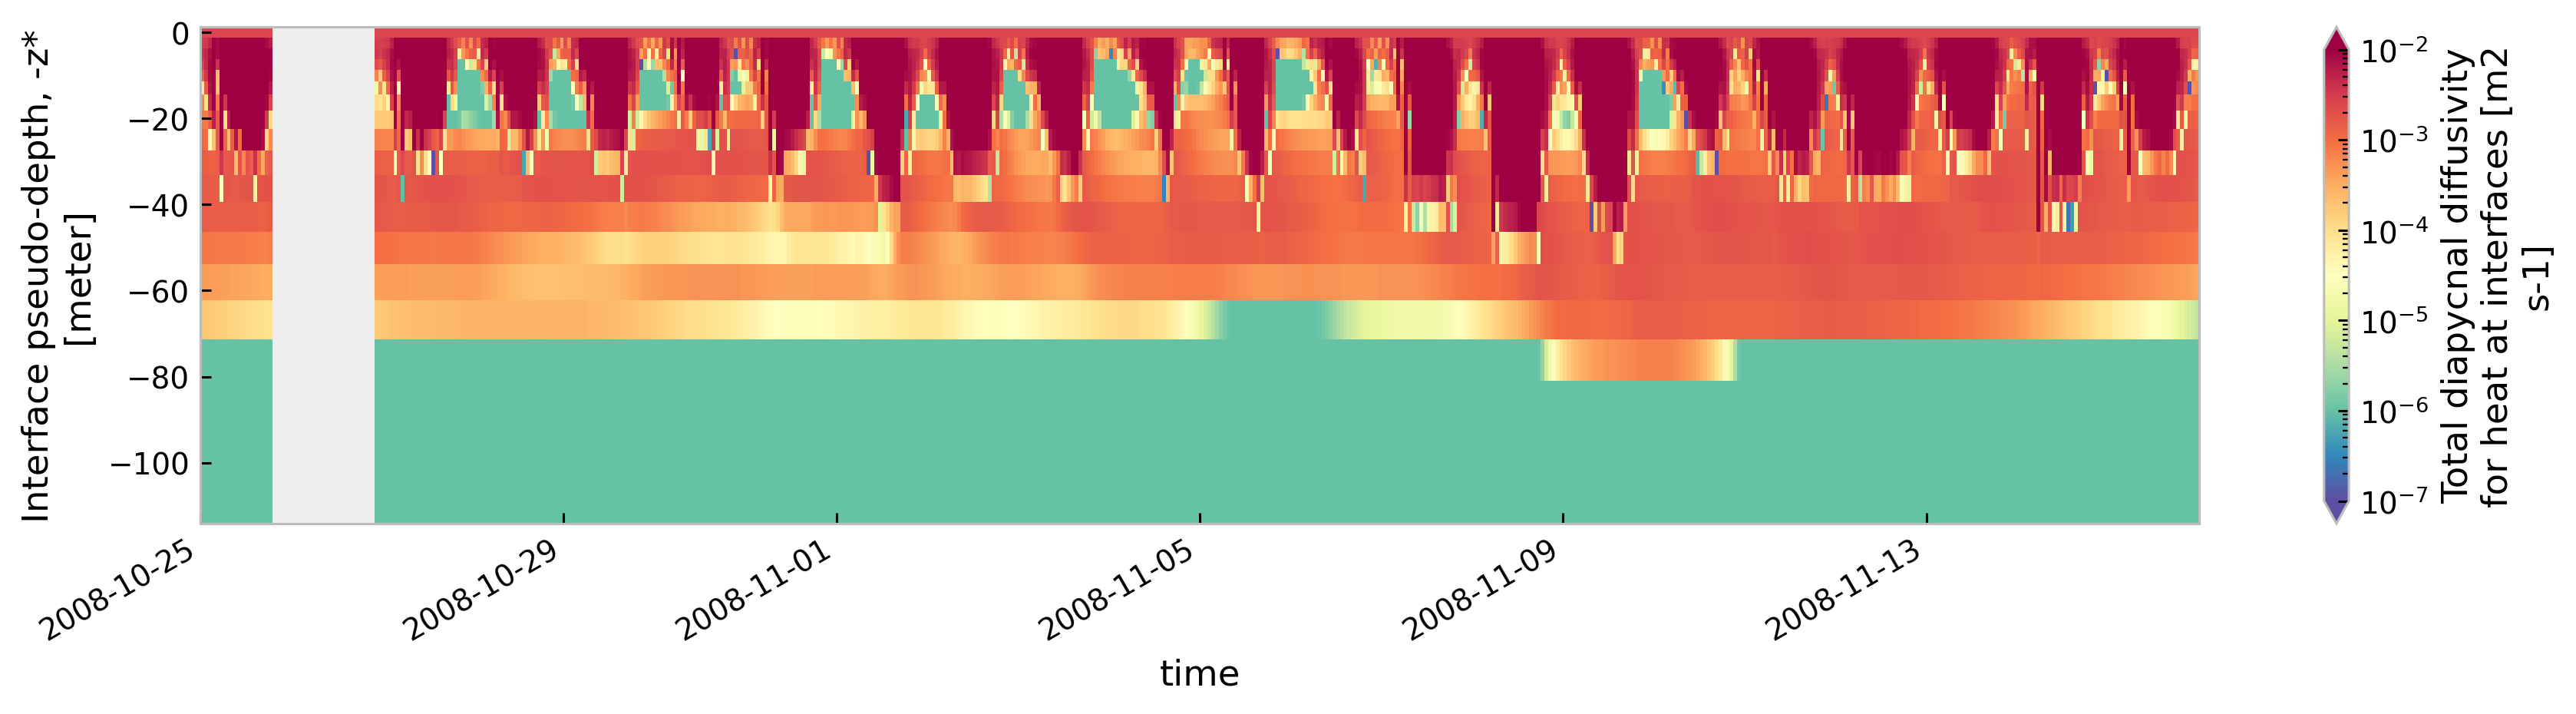
for node in ["baseline", "kpp.lmd.002", "kpp.lmd.003", "kpp.lmd.004"]:
plt.figure()
tree[node].sel(time=slice("2008-10-25", "2008-11-15")).ds.cf["ocean_vertical_heat_diffusivity"]
.cf.sel(Z=slice(-120, None)).reset_coords(drop=True).cf.plot(
cmap=mpl.cm.Spectral_r, size=3, aspect=5, norm=mpl.colors.LogNorm(1e-7, 1e-2)
)
<Figure size 896x672 with 0 Axes>
<Figure size 896x672 with 0 Axes>
<Figure size 896x672 with 0 Axes>
<Figure size 896x672 with 0 Axes>
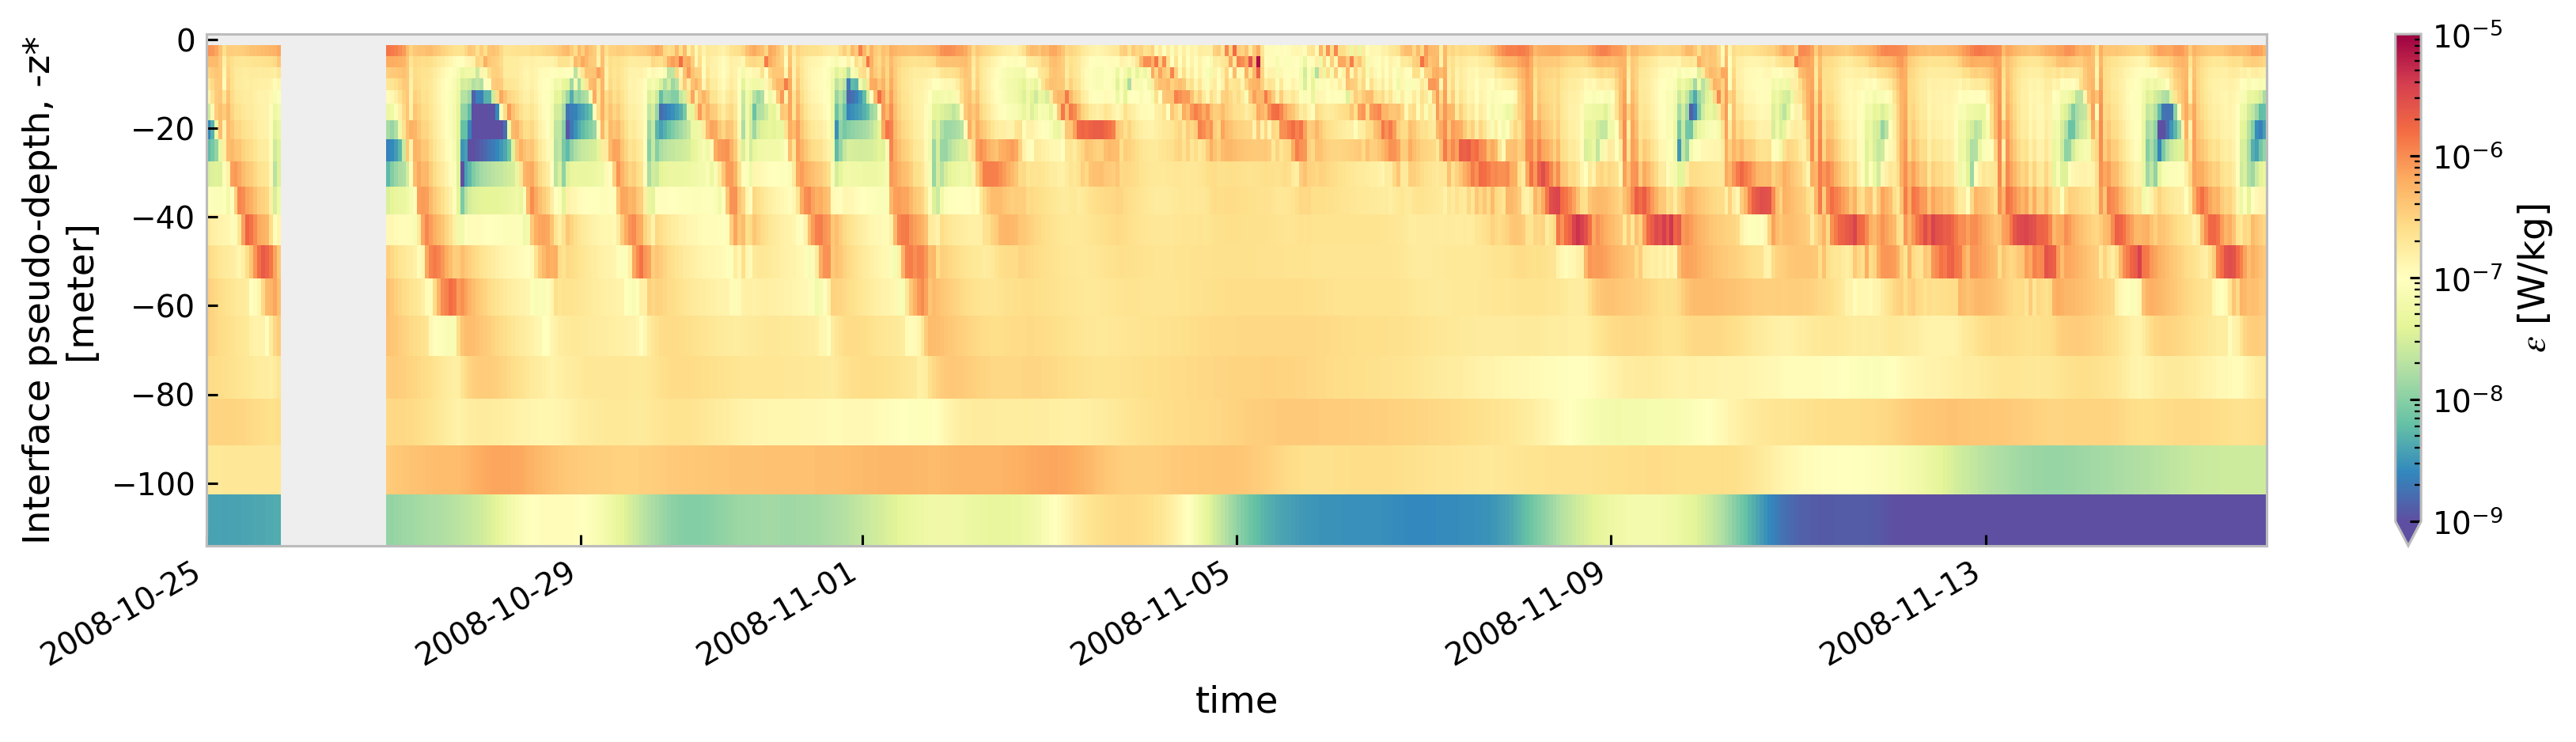
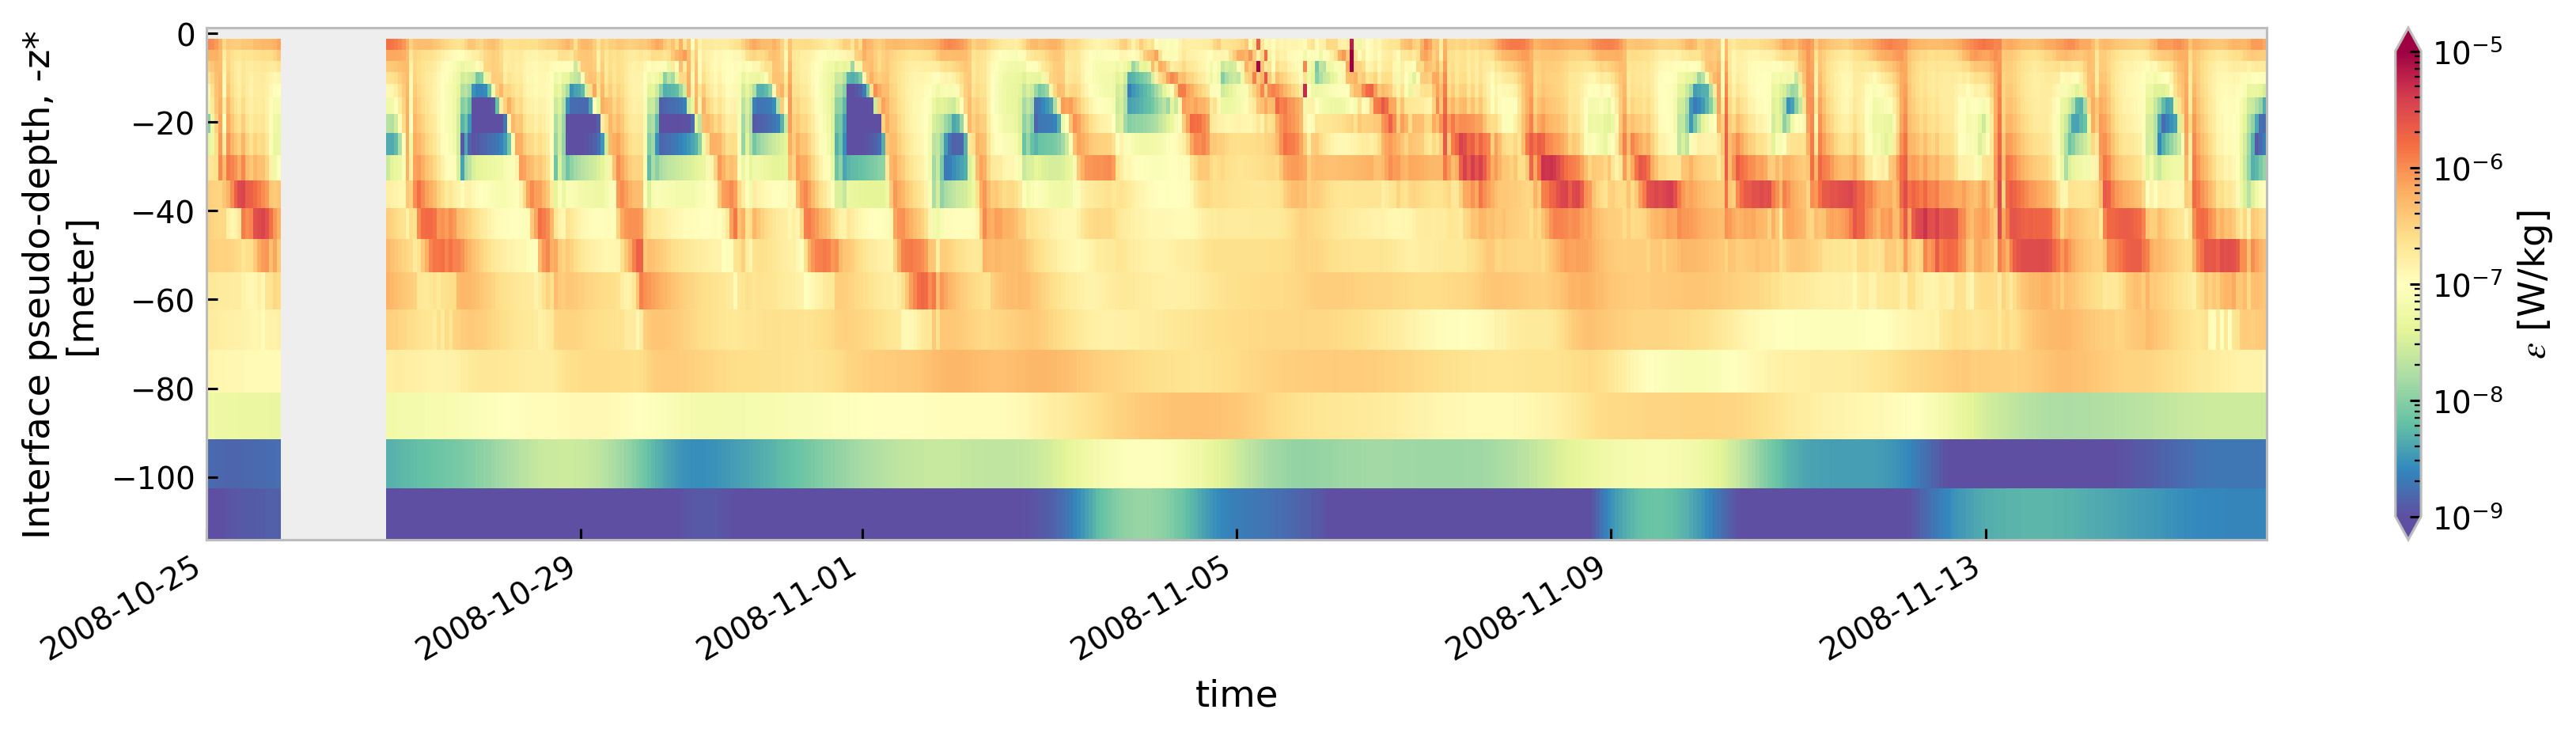
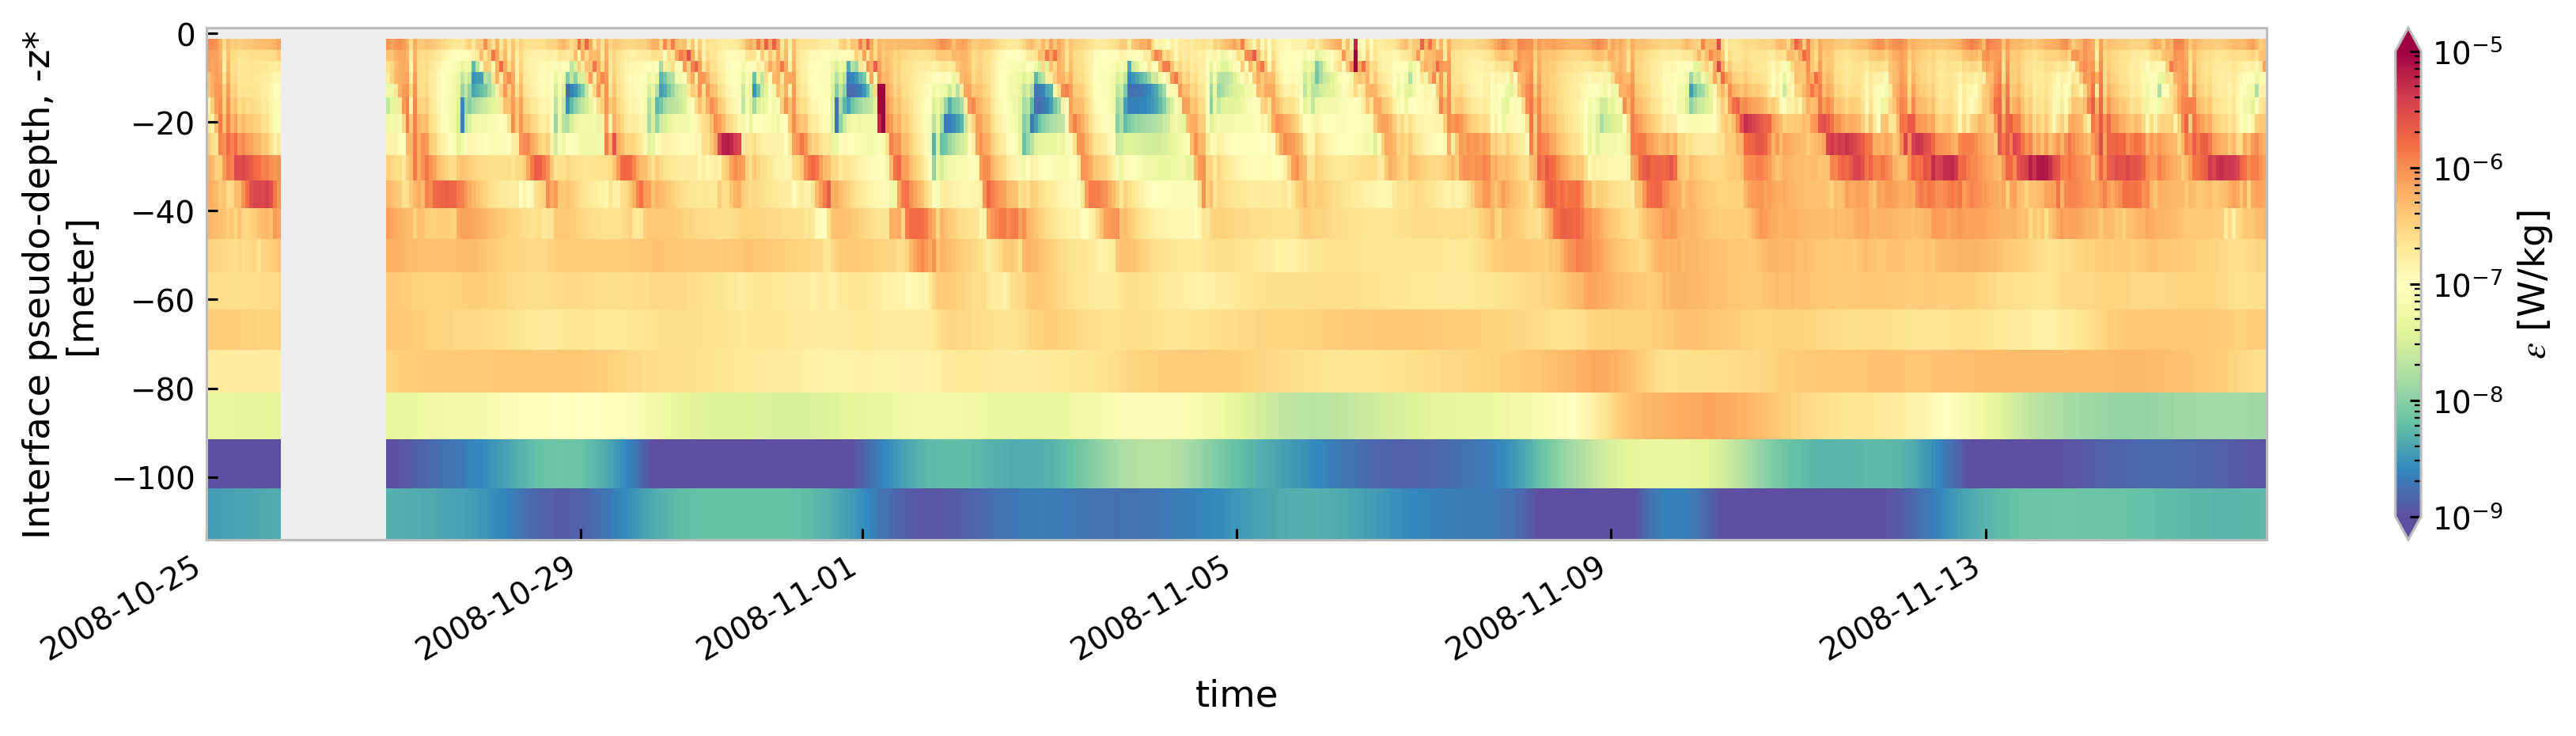
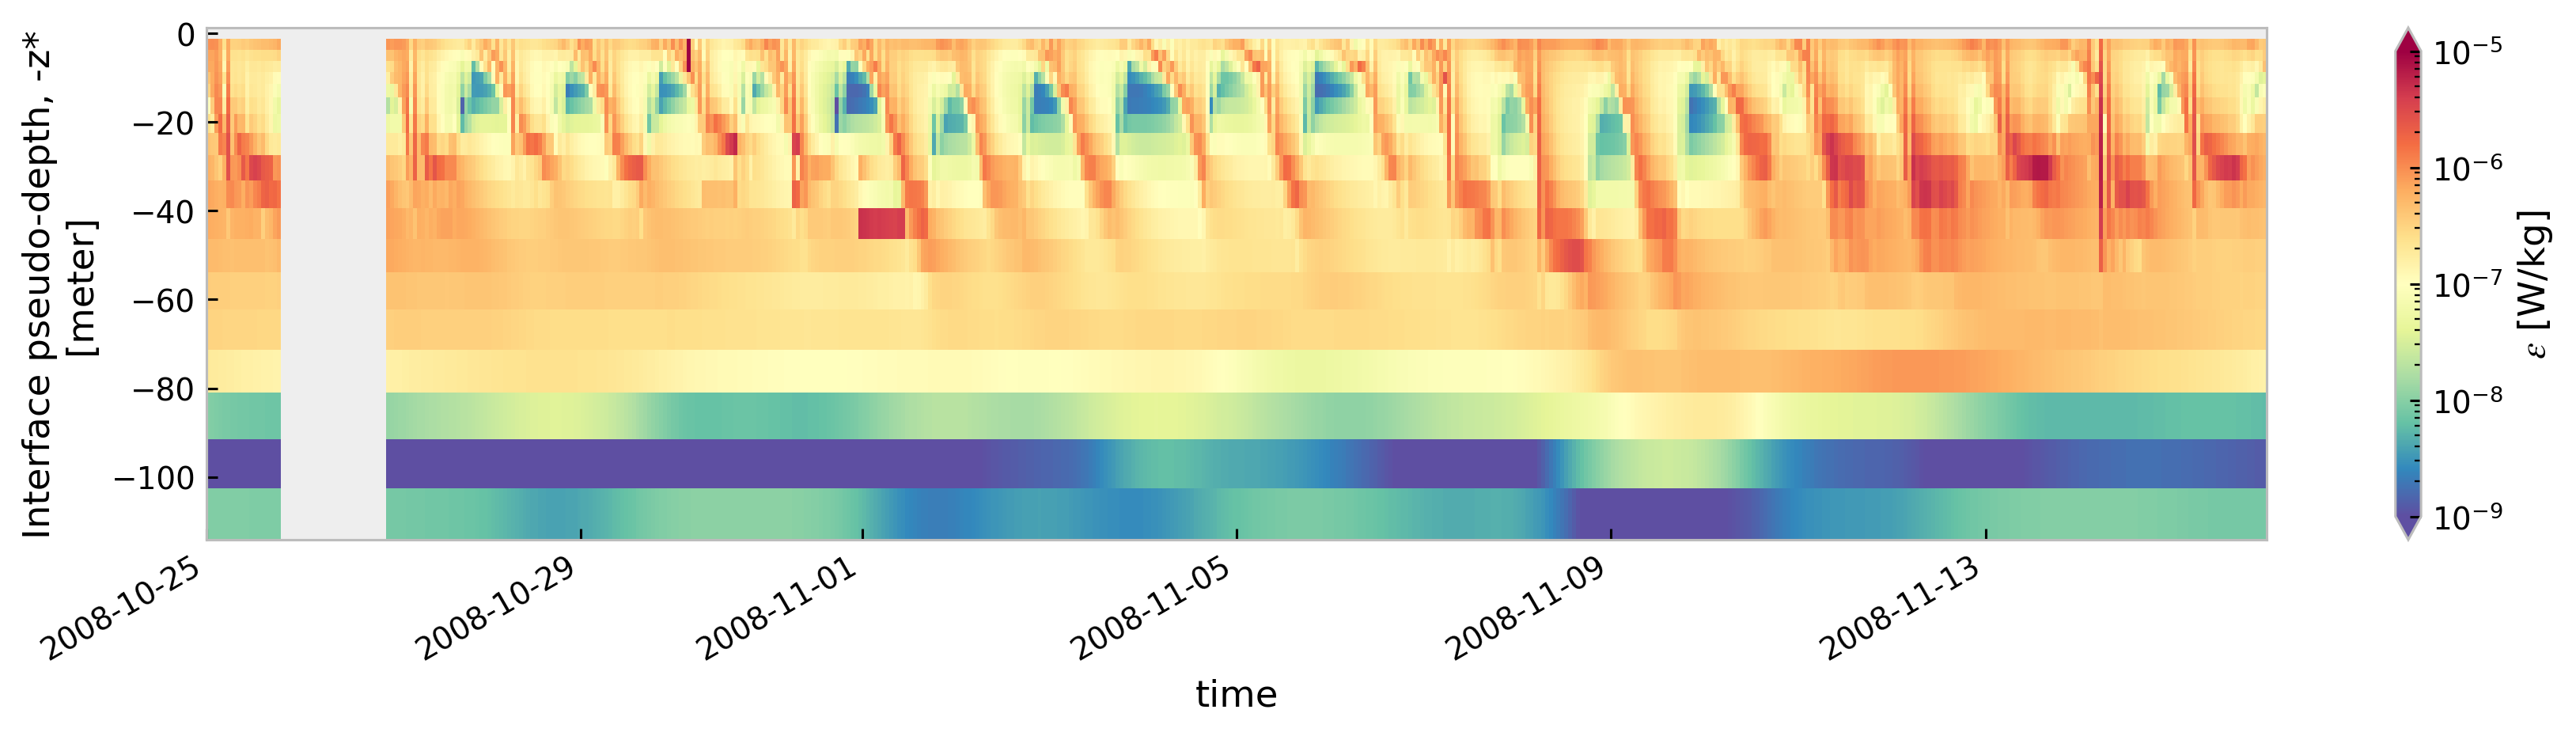
for node in ["baseline", "kpp.lmd.002", "kpp.lmd.003", "kpp.lmd.004"]:
plt.figure()
tree[node].sel(time=slice("2008-10-25", "2008-11-15"))["eps"].cf.sel(
Z=slice(-120, None)
).reset_coords(drop=True).cf.plot(
cmap=mpl.cm.Spectral_r, size=3, aspect=5, norm=mpl.colors.LogNorm(1e-9, 1e-5)
)
<Figure size 896x672 with 0 Axes>
<Figure size 896x672 with 0 Axes>
<Figure size 896x672 with 0 Axes>
<Figure size 896x672 with 0 Axes>
Compare boundary layer depth#
mixing_layer_depth_criteria = {
"boundary_layer_depth": {"name": "KPPhbl|KPP_OBLdepth|ePBL_h_ML"},
}
hbl = (
tree.drop_nodes("TAO")
.dc.subset_nodes("KPP_OBLdepth")
.dc.concatenate_nodes()
.reset_coords(drop=True)
).load()
import hvplot.pandas
(
# hbl.groupby("time.hour").mean().hvplot.line(by="node", flip_yaxis=True)
hbl.groupby("time.hour")
.mean()
.hvplot.line(by="node", flip_yaxis=True)
.opts(show_legend=False)
+ hbl.to_dataframe().hvplot.hist(
by="node",
bins=np.arange(0, 90, 1),
normed=1,
alpha=0.3,
ylim=(0, 0.05),
muted_alpha=0,
)
).opts(
hv.opts.Curve(invert_yaxis=True),
*mixpods.HV_TOOLS_OPTIONS,
*mixpods.PRESENTATION_OPTS,
)
/glade/u/home/dcherian/miniconda3/envs/pump/lib/python3.10/site-packages/holoviews/plotting/bokeh/plot.py:967: UserWarning: found multiple competing values for 'toolbar.active_drag' property; using the latest value
layout_plot = gridplot(
/glade/u/home/dcherian/miniconda3/envs/pump/lib/python3.10/site-packages/holoviews/plotting/bokeh/plot.py:967: UserWarning: found multiple competing values for 'toolbar.active_scroll' property; using the latest value
layout_plot = gridplot(
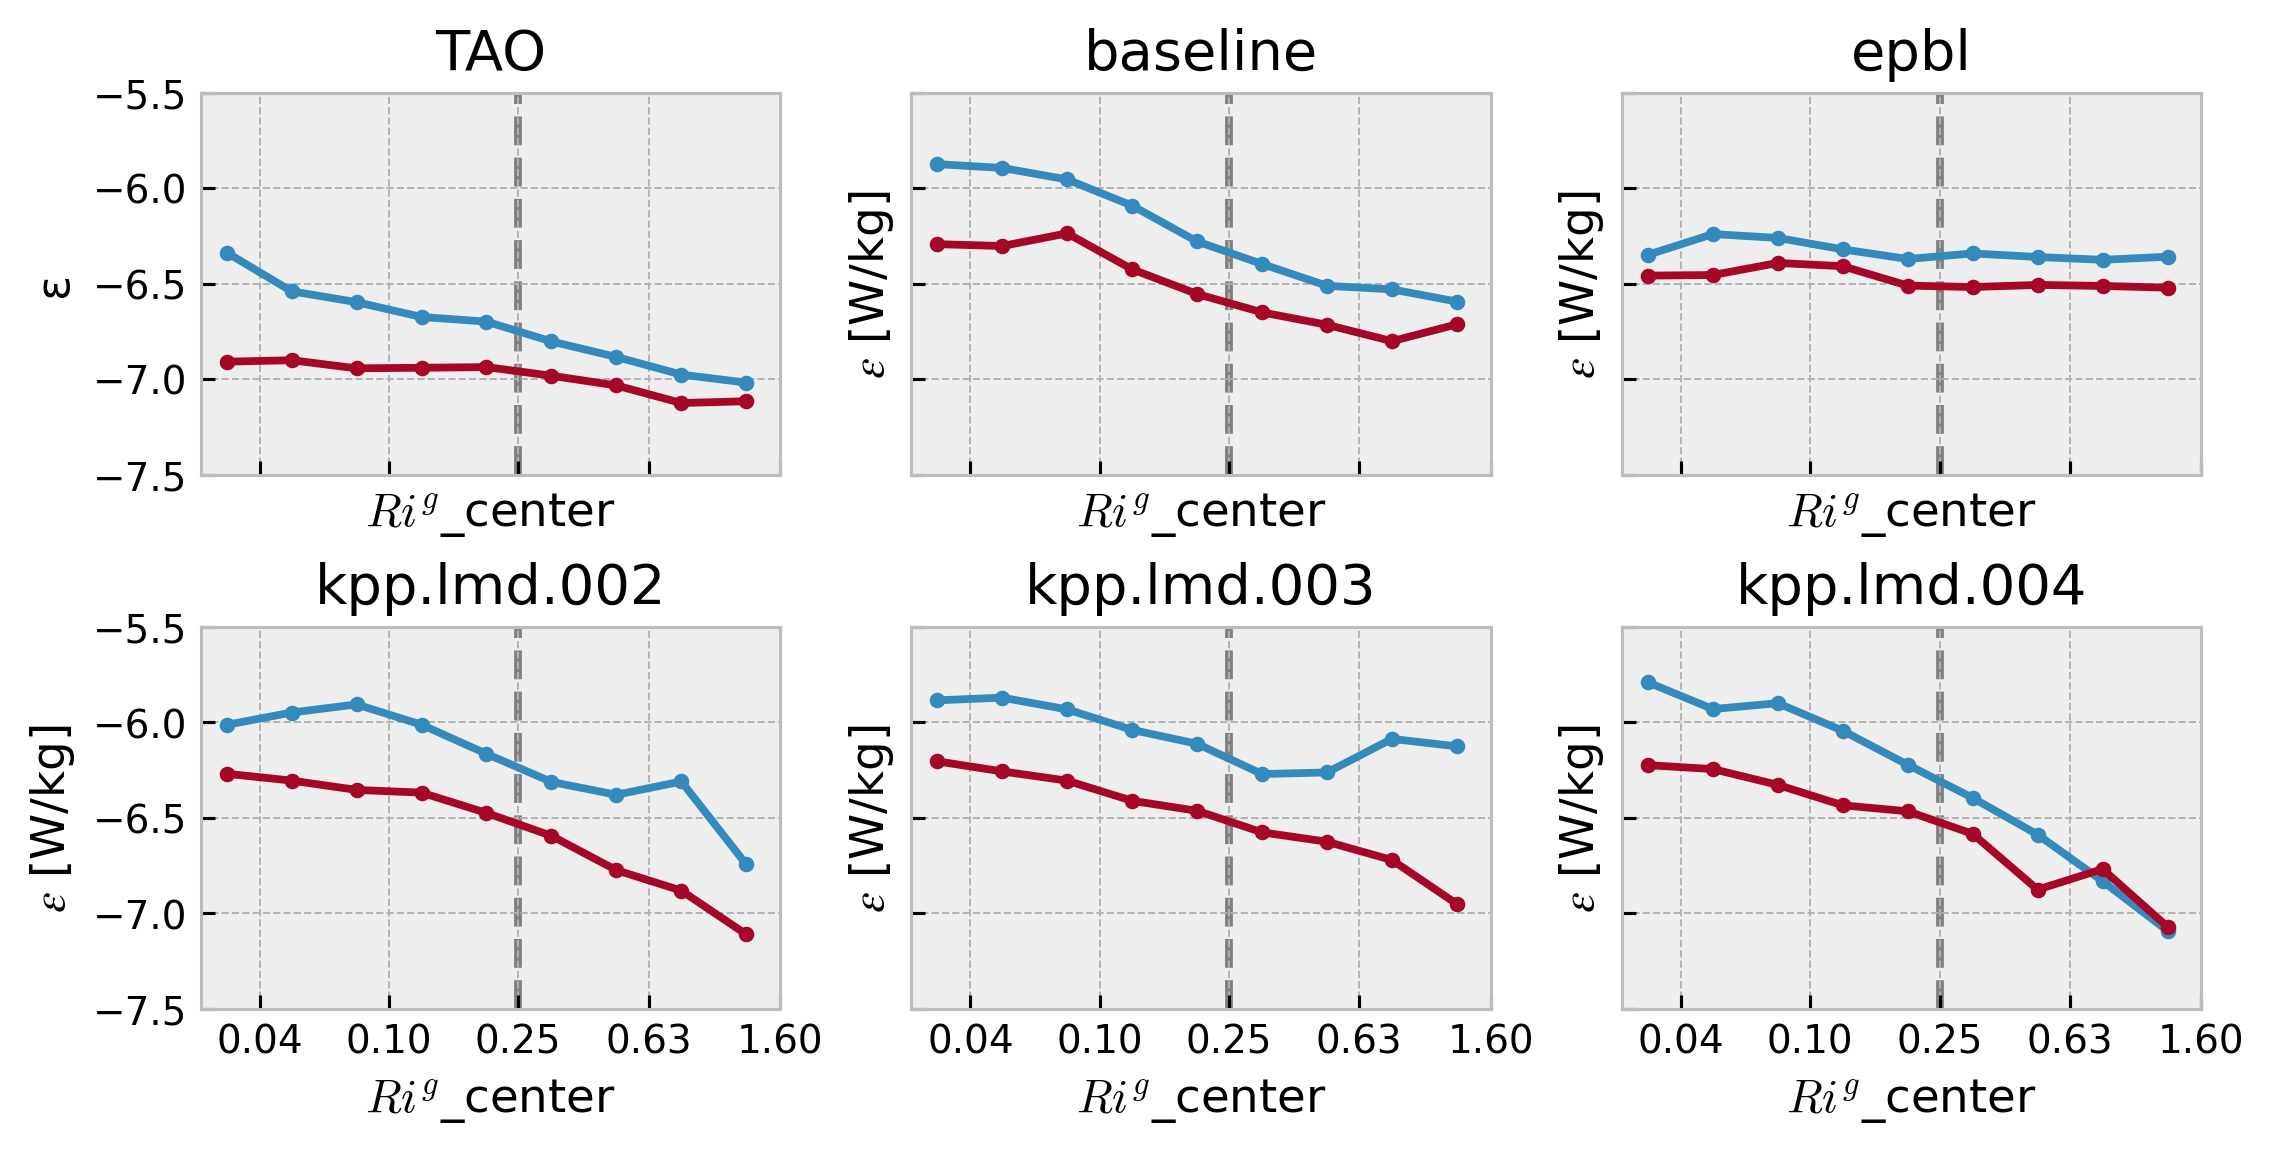
ε vs Ri#
Notes:
My MLD seems deeper even though I use the same ΔT=0.15 threshold. It could be that they’ve used Akima splines to interpolate in the vertical
~I’ve filtered to DCL, so accounting for MLD and EUC movement. I’m not sure they did that.~
Only 𝜒pods between 29 and 69 m are used in this analysis as deeper 𝜒pods are more strongly influenced by the variability of zEUC than by surface forcing.
TODO
EUC strength is proportional to horizontal visc for 1° models
Add \(ε_χ\) for MOM6
Do for K
composite by TIW strength
start with 10min χpod data, then average to hourly.
make composites off the equator: look at strong off-equatorial du/dx; du/dz
f, ax = plt.subplots(
2, len(datasets) // 2, sharex=True, sharey=True, constrained_layout=True
)
for axx, (name, ds) in zip(ax.flat, tree.children.items()):
da = np.log10(ds["eps_ri"])
# da["Rig_T_bins"] = pd.Index(
# [pd.Interval(np.log10(i.left), np.log10(i.right))
# for i in tao_gridded.Rig_T_bins.data]
# )
(
da.sel(stat="mean")
.sel(enso_transition_phase=["La-Nina cool", "El-Nino warm"])
.plot(hue="enso_transition_phase", marker=".", ax=axx, add_legend=False)
)
axx.set_title(name)
ticks = [0.04, 0.1, 0.25, 0.63, 1.6]
# axx.set_yticks([-7.25, -7, -6.5, -6])
axx.set_ylim([-7.5, -5.5])
axx.set_xticks(np.log10(ticks))
axx.set_xticklabels([f"{a:.2f}" for a in ticks])
# axx.tick_params(axis='x', rotation=30)
ax[0, 0].set_ylabel("ε")
dcpy.plots.linex(np.log10(0.25), ax=ax.flat)
# dcpy.plots.clean_axes(ax)
f.set_size_inches((8, 4))
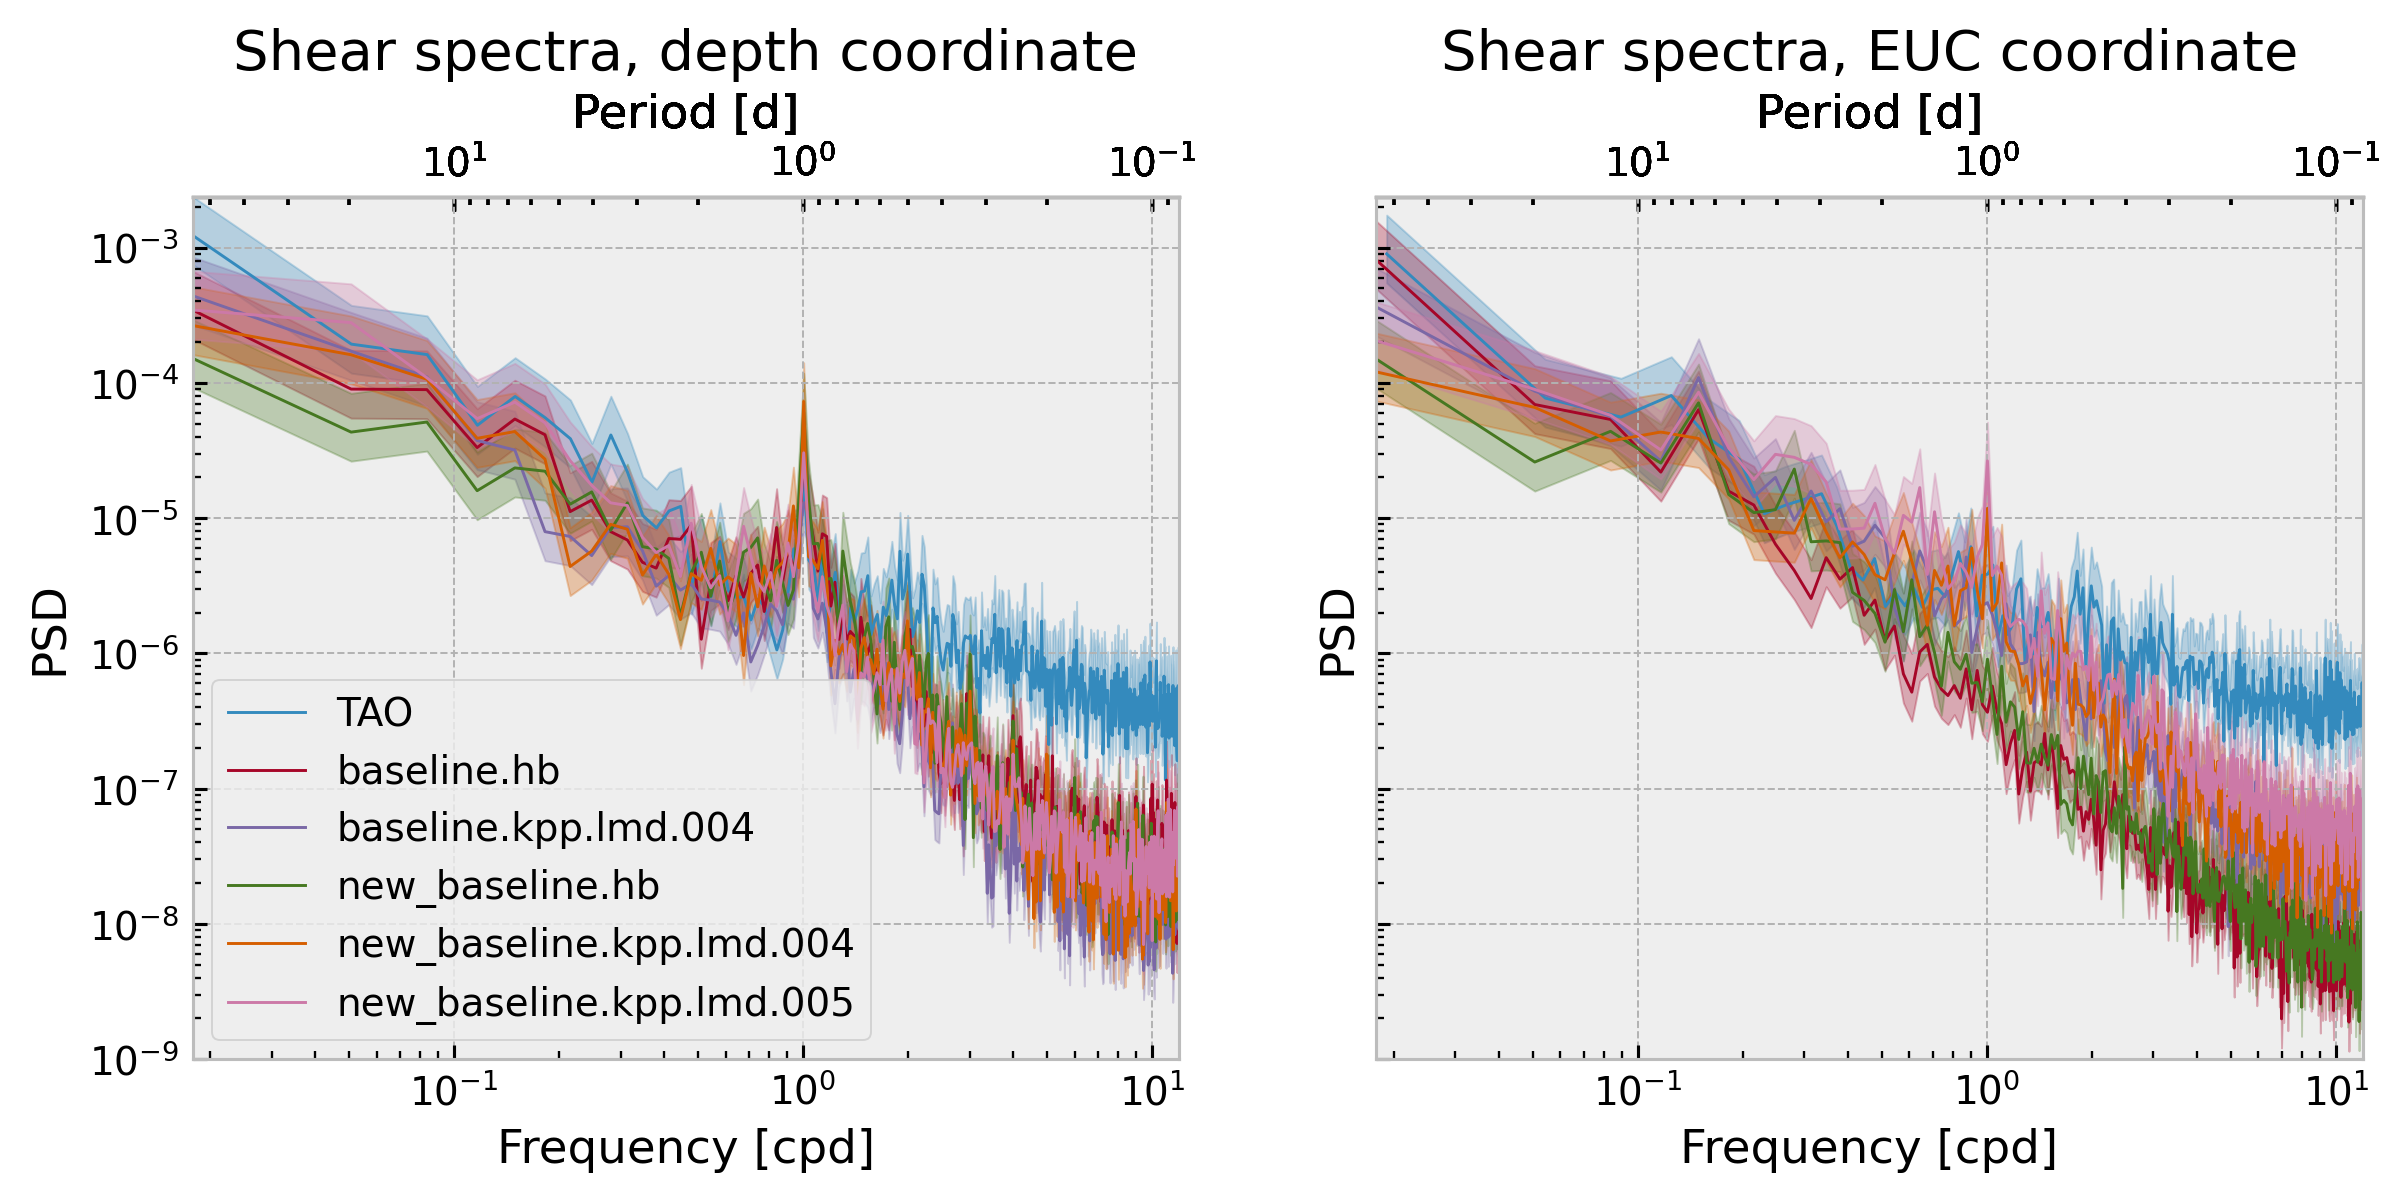
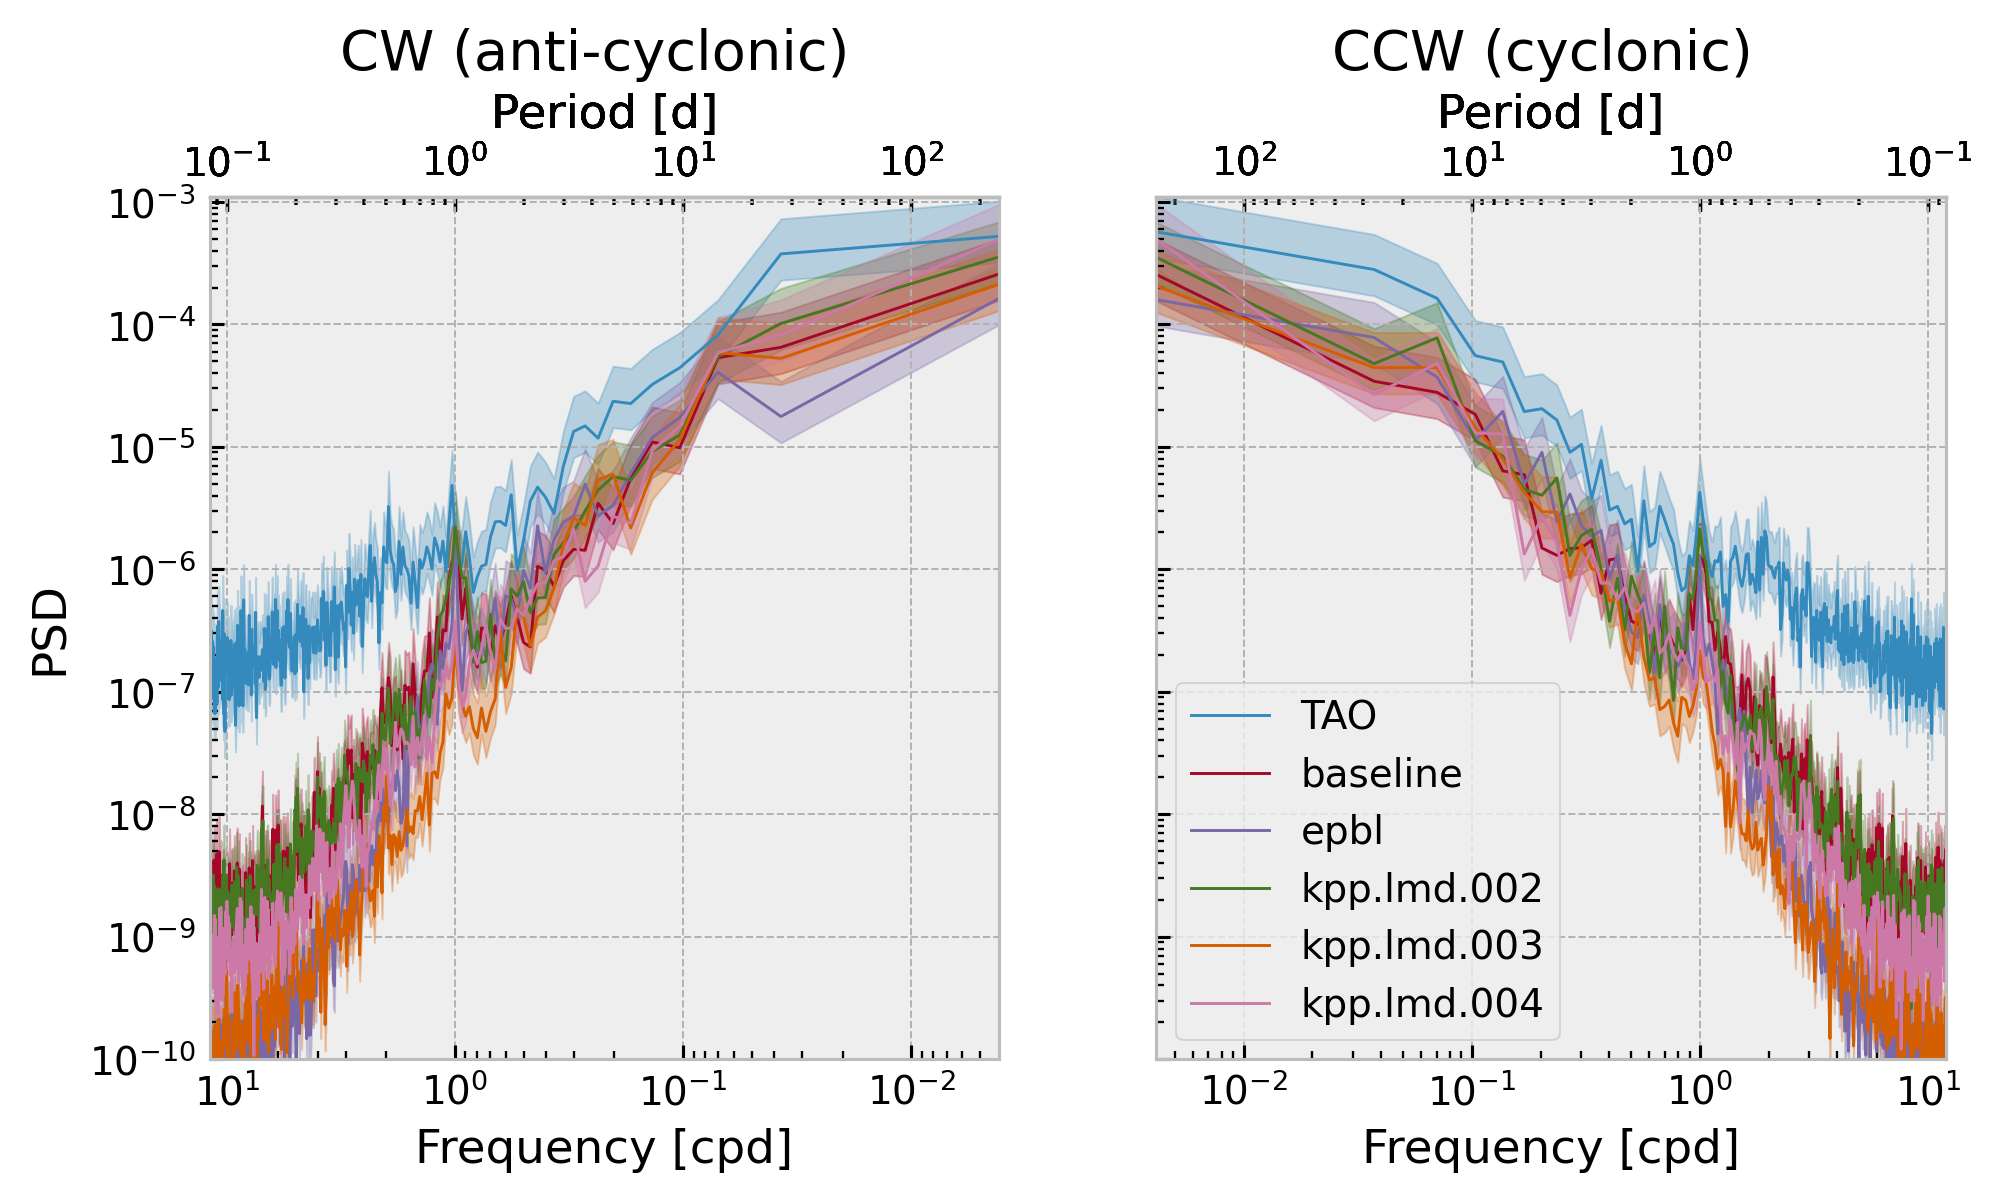
Shear spectra#
Notes#
Now obvious difference between clockwise and counter-clockwise so I’ve chosen to just do the spectrum of the magnitude
think about tides
what is the “DATM coupling interval”
Kelvin’s KPP parameters
what are the momentum and heat fluxes over some resolvable timescale. And how do we compare to obs.
think about vertical migration of EUC
think about regridding, calculate shear…
for name, node in tree.children.items():
ds = node.ds.drop_vars("w")
with xr.set_options(keep_attrs=False):
node["w"] = ds.cf["sea_water_x_velocity"] + 1j * ds.cf["sea_water_y_velocity"]
for name, node in euc.children.items():
ds = node.ds # .drop_vars("w")
with xr.set_options(keep_attrs=False):
node["w"] = ds.cf["sea_water_x_velocity"] + 1j * ds.cf["sea_water_y_velocity"]
node["zeuc"].attrs["axis"] = "Z"
Frequency Spectra#
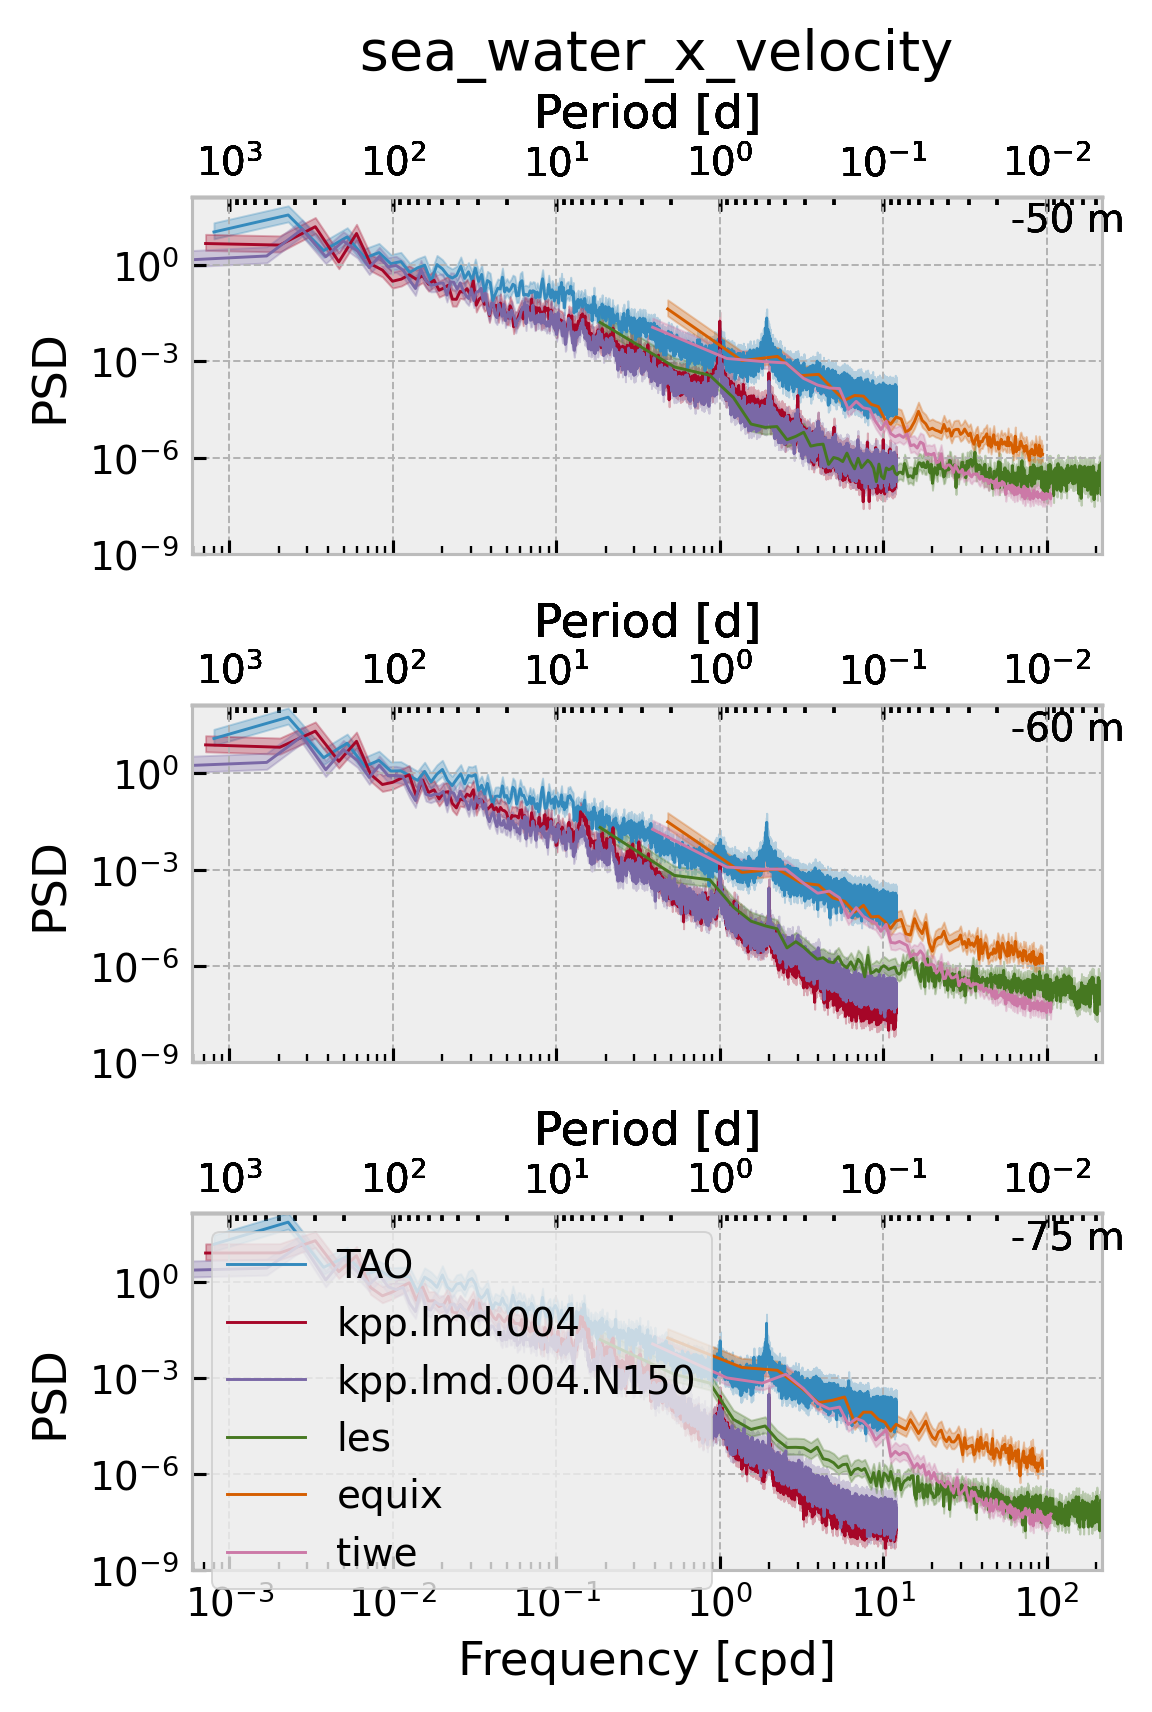
There is sensitivity to coordinate location chosen.
Models are doing quite well at daily frequency at the 40-50m range.
f, ax = plt.subplots(1, 2, sharey=True)
for axis, t, depth in zip(ax, [tree, euc], [-40, 30]):
for name, node in t.children.items():
da = node.ds["w"].reset_coords(drop=True)
dcpy.ts.PlotSpectrum(
np.abs(
da.cf.differentiate("Z")
.cf.sel(Z=depth, method="nearest")
.sel(time="2010")
),
multitaper=False,
nsmooth=12,
label=name,
lw=0.75,
ax=axis,
)
ax[0].set_ylim([1e-9, None])
ax[0].legend()
ax[0].set_title("Shear spectra, depth=-40m")
ax[1].set_title("Shear spectra, zeuc=+30m")
f.set_size_inches((10, 4))
OLD#
Velocity#
DEPTHS = [-50, -60, -75]
f, ax = plt.subplots(
len(DEPTHS), 1, sharex="col", sharey=True, squeeze=False, constrained_layout=True
)
for name in tree.children.keys():
if name == "tropicheat":
continue
ds = tree[name].ds.reset_coords()
u = ds.cf["sea_water_x_velocity"]
v = ds.cf["sea_water_y_velocity"]
S = (u + 1j * v).cf.sel(Z=DEPTHS, method="nearest").load()
for axx, z in zip(ax, DEPTHS):
dcpy.ts.PlotSpectrum(
np.abs(S).cf.sel(Z=z, method="nearest"),
multitaper=False,
nsmooth=12,
label=name,
lw=0.75,
ax=axx[0],
)
axx[-1].text(x=0.9, y=0.9, s=f"{z} m", transform=axx[-1].transAxes)
ax.ravel()[0].set_ylim([1e-9, None])
ax.ravel()[-1].legend()
dcpy.plots.clean_axes(ax)
f.set_size_inches((4, 6))
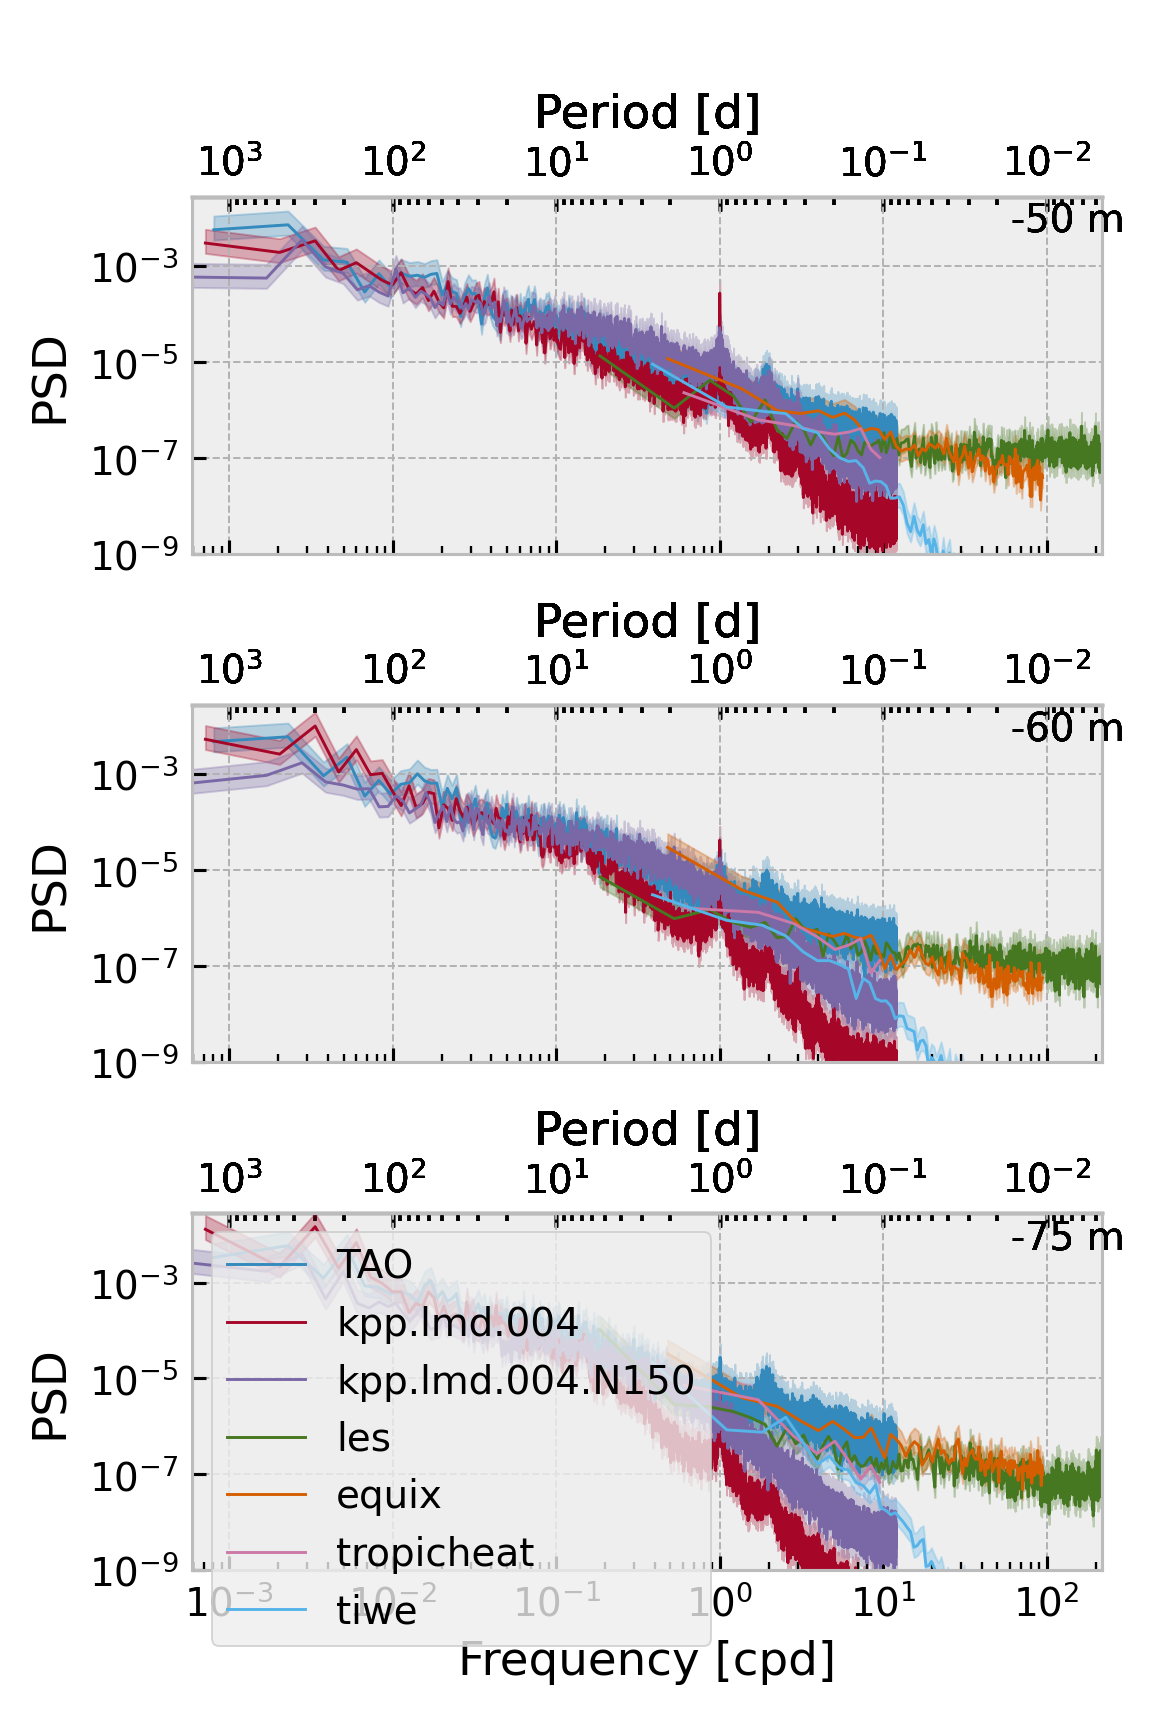
Shear#
f, ax = plt.subplots(
len(DEPTHS), 1, sharex="col", sharey=True, squeeze=False, constrained_layout=True
)
for name in tree.children.keys():
ds = tree[name].ds.reset_coords()
u = ds.cf["sea_water_x_velocity"]
v = ds.cf["sea_water_y_velocity"]
S = (
(u.cf.differentiate("Z") + 1j * v.cf.differentiate("Z"))
.cf.sel(Z=DEPTHS, method="nearest")
.load()
)
for axx, z in zip(ax, DEPTHS):
dcpy.ts.PlotSpectrum(
np.abs(S).cf.sel(Z=z, method="nearest"),
multitaper=False,
nsmooth=12,
label=name,
lw=0.75,
ax=axx[0],
)
axx[-1].text(x=0.9, y=0.9, s=f"{z} m", transform=axx[-1].transAxes)
ax.ravel()[0].set_ylim([1e-9, None])
ax.ravel()[-1].legend()
dcpy.plots.clean_axes(ax)
f.set_size_inches((4, 6))
Vertical wavenumber spectra#
regrid shear
better regridding method
add EQUIX
spec_zeuc = mixpods.hvplot_spectra(
euc.dc.drop_leaves("mean").map_over_subtree(
lambda node: np.abs(
node["w"]
# .reset_coords(drop=True)
.cf.interpolate_na("Z")
.cf.differentiate("Z")
.cf.sel(Z=slice(0, 70))
)
),
"w",
).opts(title="zeuc=slice(0, 50)")
spec_z = mixpods.hvplot_spectra(
tree.dc.drop_leaves("mean")
.dc.drop_leaves("euc")
.map_over_subtree(
lambda node: (
node["w"]
.cf.differentiate("Z")
.cf.sel(Z=slice(-200, 0))
.cf.interp(Z=np.arange(-105, -52, 5))
)
),
"w",
).opts(title="Z=slice(-100, -50)")
(spec_z).opts(legend_position="right")
Two-sided shear frequency spectra#
f, ax = plt.subplots(1, 2, sharey=True, squeeze=False)
for name in tree.children.keys():
ds = tree[name].ds.reset_coords()
u = ds.cf["sea_water_x_velocity"].load()
v = ds.cf["sea_water_y_velocity"].load()
S = u.cf.differentiate("Z") + 1j * v.cf.differentiate("Z")
dcpy.ts.PlotSpectrum(
S.cf.sel(Z=-50, method="nearest").sel(time="2010"),
multitaper=False,
twoside=True,
nsmooth=12,
label=name,
lw=0.75,
ax=ax.ravel(),
)
ax.ravel()[0].set_ylim([1e-10, None])
ax.ravel()[-1].legend()
f.set_size_inches((8, 4))
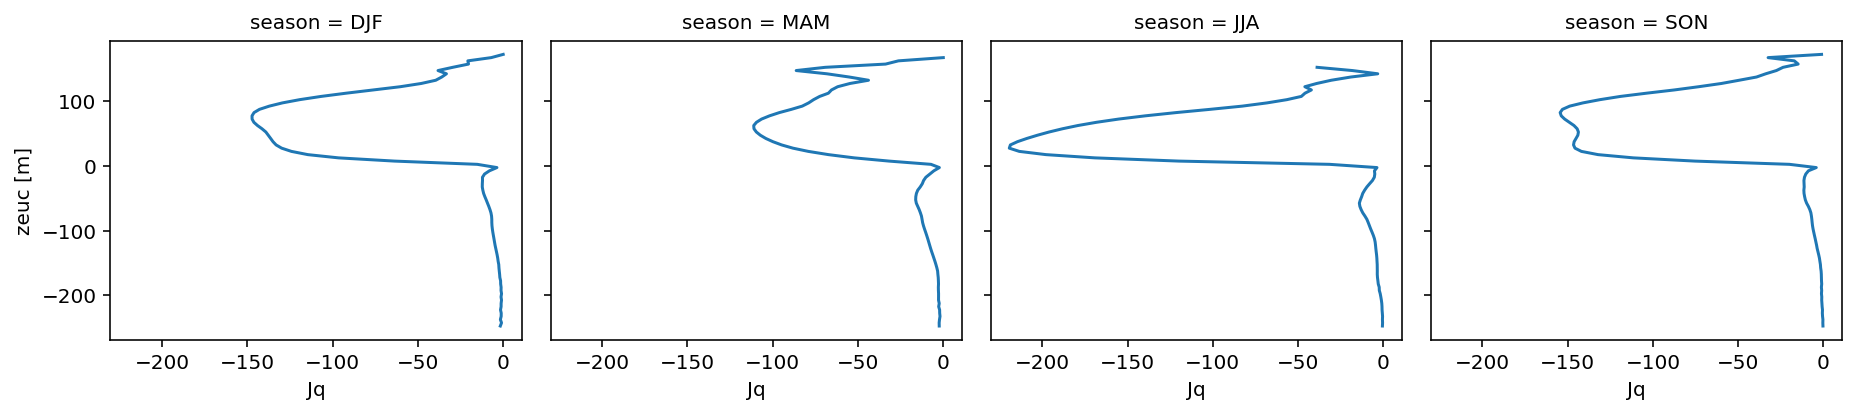
Seasonal mean heat flux#
remapped.Jq.load()
<xarray.DataArray 'Jq' (time: 174000, zeuc: 100)>
array([[ nan, nan, -0.07841657, ..., nan,
nan, nan],
[ nan, nan, -0.07973828, ..., nan,
nan, nan],
[ nan, nan, -0.08094554, ..., nan,
nan, nan],
...,
[ nan, -0.07447129, nan, ..., nan,
nan, nan],
[ nan, -0.07471326, nan, ..., nan,
nan, nan],
[ nan, -0.07509062, nan, ..., nan,
nan, nan]])
Coordinates:
latitude float64 0.025
longitude float64 -140.0
* time (time) datetime64[ns] 1998-12-31T18:00:00 ... 2018-11-06T17:00:00
* zeuc (zeuc) float64 -247.5 -242.5 -237.5 -232.5 ... 237.5 242.5 247.5(
remapped.Jq.groupby("time.season")
.mean()
.reindex(season=["DJF", "MAM", "JJA", "SON"])
.cf.plot.line(col="season")
)
<xarray.plot.facetgrid.FacetGrid>
Below EUC mixing#
as a test for the background mixing params.
Frank: other places to look would be:
overflows
acc , gs
DWBC
ideal age metric?
vertically integrated heat budget term, global map
%autoreload
newtree = mixpods.bin_to_euc_centered_coordinate(tree)
for nodename, _ in tree.children.items():
tree[f"{nodename}/euc"] = newtree[f"{nodename}/euc"]
euc_mean = mixpods.average_euc(tree)
euc_mean.load()
import os
import datatree
micro_zeuc = datatree.open_datatree(
os.path.expanduser("~/datasets/microstructure/equix-tiwe-zeuc.average.nc")
).load()
for nodename, node in micro_zeuc.children.items():
node["u"].attrs["standard_name"] = "sea_water_x_velocity"
node["v"].attrs["standard_name"] = "sea_water_y_velocity"
node["KT"].attrs["standard_name"] = "ocean_vertical_heat_diffusivity"
node["ν"].attrs["standard_name"] = "ocean_vertical_momentum_diffusivity"
del node["Rig_T"].attrs["standard_name"]
del node["N2T"].attrs["standard_name"]
# euc_mean[nodename] = node
for nodename, node in micro_zeuc.children.items():
euc_mean[nodename] = node
euc_mean.to_netcdf("mom6-euc-mean.nc")
h = {
varname: mixpods.map_hvplot(
lambda node, name, muted: (
node.ds.cf[varname]
.reset_coords(drop=True)
.hvplot.line(
ylabel=varname,
label=name,
logx=varname != "sea_water_x_velocity",
invert=True,
)
),
euc_mean,
)
for varname in [
"sea_water_x_velocity",
"sea_water_potential_temperature",
"chi",
"eps",
"ocean_vertical_heat_diffusivity",
"ocean_vertical_momentum_diffusivity",
]
}
h["chi"].opts(ylim=(1e-9, 1e-4))
h["eps"].opts(ylim=(1e-9, 1e-4))
h["ocean_vertical_heat_diffusivity"].opts(ylim=(5e-7, 3))
h["ocean_vertical_momentum_diffusivity"].opts(ylim=(1e-6, 1e-1))
h2 = {
varname: mixpods.map_hvplot(
lambda node, name, muted: node.ds[varname]
.reset_coords(drop=True)
.hvplot.line(ylabel=varname, label=name, logx=False, invert=True),
euc_mean,
)
for varname in ["Rig_T"]
}
hv.Layout(list(h.values()) + [h2["Rig_T"].opts(ylim=(0, 3))]).opts(
hv.opts.Curve(frame_width=150, frame_height=300, xlim=(-150, 150)),
hv.opts.Layout(shared_axes=True),
hv.opts.Overlay(show_legend=True, show_grid=True, legend_position="right"),
*mixpods.HV_TOOLS_OPTIONS,
*mixpods.PRESENTATION_OPTS,
).cols(4)
Ri = (
tree.dc.extract_leaf("euc")
.dc.subset_nodes(["Rig_T"])
.sel(time=slice("1992", "2017"))
.load()
)
mixpods.plot_distributions(
Ri.dc.reorder_nodes(["TAO", ...]),
"Rig_T",
bins=np.arange(0, 5, 0.25),
log=False,
subset=False,
).opts(hv.opts.Overlay(legend_position="right"))
# tree["new_baseline.hb/euc"]["Rig_T"].sel(zeuc=slice(-120, -30)).hvplot.hist(bins=[0, 0.2, 0.5, 0.8, 1, 2, 3, 4, 5])
# tree["baseline/euc"]["Rig_T"].sel(zeuc=slice(-120, -30)).hvplot.hist(bins=[0, 0.2, 0.5, 0.8, 1, 2, 3, 4, 5])
monthly = catalog.search(frequency="monthly", variables="uo").to_datatree()
--> The keys in the returned dictionary of datasets are constructed as follows:
'shortname/stream'
uo = (
monthly.drop_nodes(
set(monthly)
- set(
tree.dc.rename_nodes(
{"baseline": "baseline.001", "kpp.lmd.004": "baseline.kpp.lmd.004"}
)
)
)
.dc.extract_leaf("h")
.sel(xq=-140, method="nearest")
.sel(yh=slice(-10, 10))
.sel(time=slice("0046-01-01", "0058-01-01"))
# .mean("time")
).load()
(
hv.Layout(
[
node["uo"]
.where(node["uo"] < 10)
.reset_coords(drop=True)
.hvplot.quadmesh(x="yh", clim=(-0.01, 0.01), cmap="coolwarm", title=name)
for name, node in uo.mean("time").children.items()
]
)
.cols(2)
.opts(
hv.opts.QuadMesh(invert_yaxis=True, ylim=(2000, 0)),
*mixpods.PRESENTATION_OPTS,
*mixpods.HV_TOOLS_OPTIONS,
)
)
Test out available variables#
KPP_Kheatis non-zero only in KPP_OBL
(mom6140.Tflx_dia_diff * 1025 * 4000).cf.plot(robust=True)
<matplotlib.collections.QuadMesh>
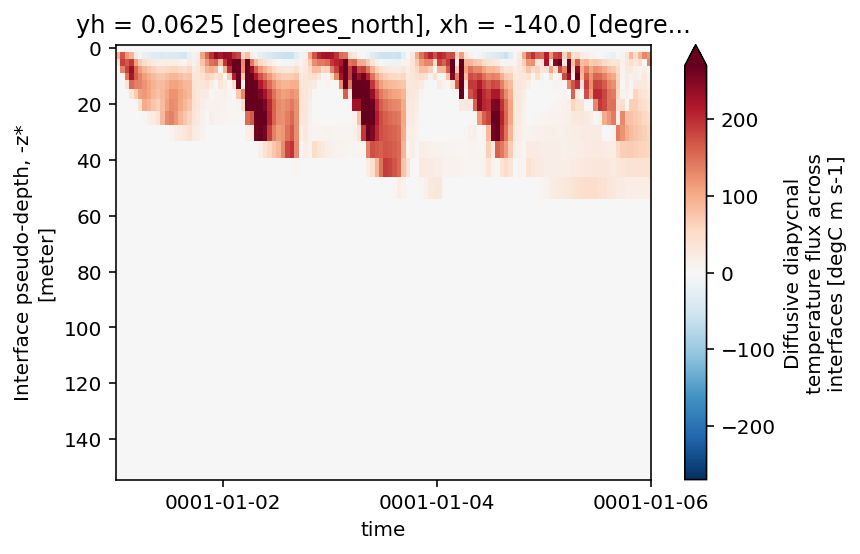
mom6140.Kv_u.cf.plot(norm=mpl.colors.LogNorm(1e-6, 1e-2))
<matplotlib.collections.QuadMesh>
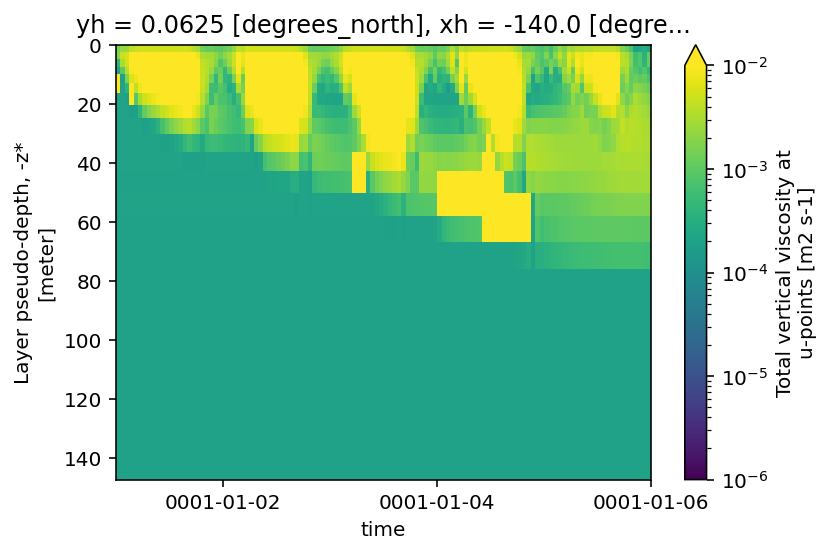
mom6140.Kd_heat.cf.plot(norm=mpl.colors.LogNorm(1e-6, 1e-2))
mom6140.KPP_OBLdepth.plot(color="r")
plt.figure()
mom6140.KPP_kheat.cf.plot(norm=mpl.colors.LogNorm(1e-6, 1e-2))
mom6140.KPP_OBLdepth.plot(color="r")
plt.figure()
(mom6140.KPP_kheat - mom6140.Kd_heat).cf.plot(
robust=True, cmap=mpl.cm.mpl.cm.Reds_r, vmax=0
)
<matplotlib.collections.QuadMesh>
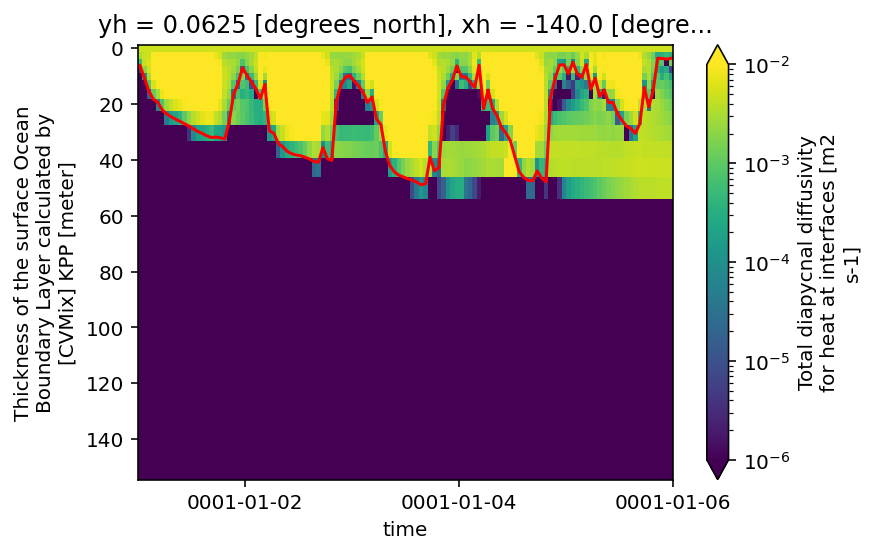
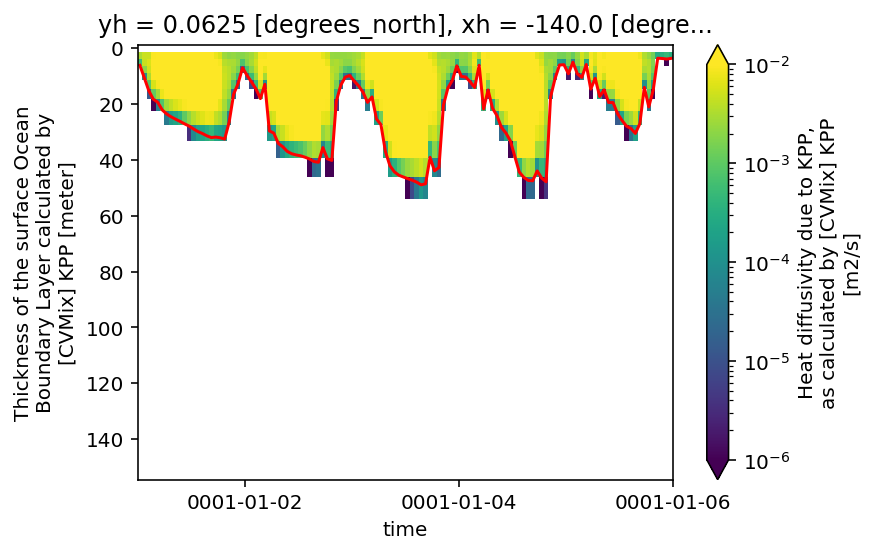
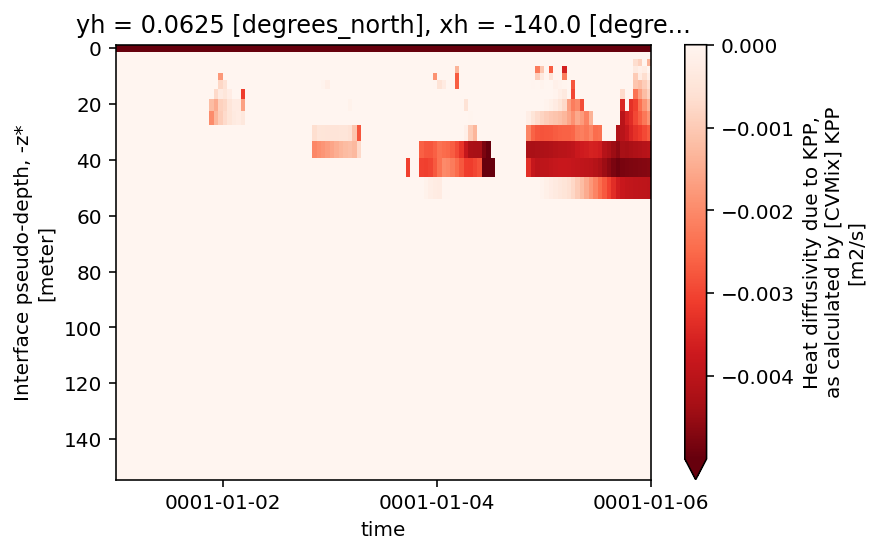
Experiment with manual combining#
from intake.source.utils import reverse_format
years = []
tiles = []
for file in files[:10]:
p = pathlib.Path(file)
params = reverse_format("__{year}.nc.{tile}", p.stem + p.suffix)
years.append(params["year"])
tiles.append(params["tile"])
years, tiles
import toolz as tlz
bytile = {}
for tile, v in tlz.groupby(tileid, files).items():
bytile[tile] = xr.concat(read_raw_files(v, parallel=True), dim="time")
print("\n".join([hash(ds.yh.data.tolist()) for ds in list(bytile.values())]))
from functools import partial
def hash_coords(ds, axis):
dims = ds.cf.axes[axis]
data = np.concatenate([ds[dim].data for dim in dims])
return hash(tuple(data))
grouped = bytile
for axis, concat_axis in [("X", "Y"), ("Y", "X")]:
grouped = tlz.groupby(partial(hash_coords, axis=axis), grouped.values())
grouped = {
k: cfconcat(v, axis=concat_axis, join="exact") for k, v in grouped.items()
}
break
grouped
cfconcat(list(grouped.values()), "X")
combined = xr.combine_by_coords(list(bytile.values()), combine_attrs="override")
def raise_if_bad_index(combined):
bad = []
for idx in combined.indexes:
index = combined.indexes[idx]
if not index.is_monotonic or index.has_duplicates:
bad.append(idx)
if bad:
raise ValueError(f"Indexes {idx} are either not monotonic or have duplicates")
def tileid(path):
p = pathlib.Path(path)
# print(p.suffix)
# params = reverse_format("__{year}.nc.{tile}", p.stem + p.suffix)
return int(p.suffix[1:]) # params["tile"]
# years.append(params["year"])
# tiles.append(params["tile"])
sorted_files = sorted(files, key=tileid)
for tile, files in groupby(sorted_files, tileid):
print(tile, len(list(files)))
Checking background visc, diff#
staticfile = "/glade/campaign/cgd/oce/projects/pump/cesm//gmom.e23.GJRAv3.TL319_t061_zstar_N65.new_baseline.hb/run/*static*.nc"
static = xr.open_mfdataset(staticfile).isel(time=1).squeeze()
static.Kd_bkgnd.cf.sel(Z=200, method="nearest").hvplot.quadmesh(
cmap="spectral_r", cnorm="log", clim=(5e-7, 2e-4)
)