Long-term tubulence in 20-year simulation#
%autoreload 2
%matplotlib inline
%load_ext watermark

import cf_xarray
import dask
import dcpy
import distributed
import matplotlib as mpl
import matplotlib.dates as mdates
import matplotlib.pyplot as plt
import matplotlib.units as munits
import numpy as np
import pandas as pd
import seawater as sw
import xarray as xr
from holoviews import opts

import pump

mpl.rcParams["savefig.dpi"] = 300
mpl.rcParams["savefig.bbox"] = "tight"
mpl.rcParams["figure.dpi"] = 140
munits.registry[np.datetime64] = mdates.ConciseDateConverter()

xr.set_options(keep_attrs=True)


# hv.extension("bokeh")
# hv.opts.defaults(opts.Image(fontscale=1.5), opts.Curve(fontscale=1.5))


xr.DataArray([1.0])

gcmdir = "/glade/campaign/cgd/oce/people/bachman/TPOS_1_20_20_year/OUTPUT/"  # MITgcm output directory
stationdirname = gcmdir

%watermark -iv
dcpy       : 0.1
seawater   : 3.3.4
pandas     : 1.1.3
numpy      : 1.19.2
pump       : 0.1
xarray     : 0.16.3.dev150+g37522e991
cf_xarray  : 0.4.1.dev31+g7a8c620
dask       : 2.30.0
matplotlib : 3.3.2
distributed: 2.30.0
import ncar_jobqueue

if "client" in locals():
    client.close()
    del client
# if "cluster" in locals():
#    cluster.close()

# env = {"OMP_NUM_THREADS": "3", "NUMBA_NUM_THREADS": "3"}

# cluster = distributed.LocalCluster(
#    n_workers=8,
#    threads_per_worker=1,
#    env=env
# )

if "cluster" in locals():
    del cluster

# cluster = ncar_jobqueue.NCARCluster(
#    project="NCGD0011",
#    scheduler_options=dict(dashboard_address=":9797"),
# )
# cluster = dask_jobqueue.PBSCluster(
#    cores=9, processes=9, memory="108GB", walltime="02:00:00", project="NCGD0043",
#    env_extra=env,
# )

import dask_jobqueue

cluster = dask_jobqueue.PBSCluster(
    cores=1,  # The number of cores you want
    memory="23GB",  # Amount of memory
    processes=1,  # How many processes
    queue="casper",  # The type of queue to utilize (/glade/u/apps/dav/opt/usr/bin/execcasper)
    local_directory="$TMPDIR",  # Use your local directory
    resource_spec="select=1:ncpus=1:mem=23GB",  # Specify resources
    project="ncgd0011",  # Input your project ID here
    walltime="02:00:00",  # Amount of wall time
    interface="ib0",  # Interface to use
)
cluster.scale(jobs=4)
/glade/u/home/dcherian/miniconda3/envs/dcpy/lib/python3.8/site-packages/distributed/node.py:151: UserWarning: Port 8787 is already in use.
Perhaps you already have a cluster running?
Hosting the HTTP server on port 41672 instead
  warnings.warn(
cluster
if "client" in locals():
    del client

client = distributed.Client(cluster)
client
Client
|
Cluster
|
Read data#
Full dataset#
# start date for les; noon is a good time (it is before sunrise)
sim_time = pd.Timestamp("2015-09-20 12:00:00")

# ADD a 5 day buffer here (:] all kinds of bugs at the beginning and end)
les_time_length = 180  # (days); length of time for forcing/pushing files

# don't change anything here
output_start_time = pd.Timestamp("1999-01-01")  # don't change
firstfilenum = (
    (
        sim_time - pd.Timedelta("1D") - output_start_time
    )  # add one day offset to avoid bugs
    .to_numpy()
    .astype("timedelta64[D]")
    .astype("int")
)
lastfilenum = firstfilenum + les_time_length


def gen_file_list(suffix):
    files = [
        f"{gcmdir}/File_{num}_{suffix}.nc"
        for num in range(firstfilenum - 1, lastfilenum + 1)
    ]

    return files
coords = pump.model.read_mitgcm_coords(gcmdir)
coords
<xarray.Dataset>
Dimensions:  (RC: 136, RF: 136, XC: 1420, XG: 1420, YC: 400, YG: 400)
Coordinates:
  * XG       (XG) float64 -168.0 -168.0 -167.9 -167.9 ... -97.18 -97.12 -97.08
  * XC       (XC) float64 -168.0 -167.9 -167.9 -167.9 ... -97.15 -97.1 -97.05
  * YG       (YG) float64 -10.0 -9.95 -9.9 -9.85 -9.8 ... 9.75 9.8 9.85 9.9 9.95
  * YC       (YC) float64 -9.975 -9.925 -9.875 -9.825 ... 9.875 9.925 9.975
  * RC       (RC) float64 -1.25 -3.75 -6.25 -8.75 ... -824.4 -881.7 -944.4
  * RF       (RF) float64 0.0 -2.5 -5.0 -7.5 ... -747.1 -797.0 -851.7 -911.6
Data variables:
    *empty*
xarray.Dataset
- RC: 136
- RF: 136
- XC: 1420
- XG: 1420
- YC: 400
- YG: 400
- XG(XG)float64-168.0 -168.0 ... -97.12 -97.08
- axis :
- X
- c_grid_axis_shift :
- -0.5
array([-168.025 , -167.975 , -167.925 , ..., -97.175002, -97.124998, -97.075003]) - XC(XC)float64-168.0 -167.9 ... -97.1 -97.05
- axis :
- X
array([-168. , -167.95 , -167.9 , ..., -97.15 , -97.099997, -97.050002]) - YG(YG)float64-10.0 -9.95 -9.9 ... 9.85 9.9 9.95
- axis :
- Y
- c_grid_axis_shift :
- -0.5
array([-10. , -9.95, -9.9 , ..., 9.85, 9.9 , 9.95])
- YC(YC)float64-9.975 -9.925 ... 9.925 9.975
- axis :
- Y
array([-9.975, -9.925, -9.875, ..., 9.875, 9.925, 9.975])
- RC(RC)float64-1.25 -3.75 -6.25 ... -881.7 -944.4
- axis :
- Z
array([ -1.25 , -3.75 , -6.25 , -8.75 , -11.25 , -13.75 , -16.25 , -18.75 , -21.25 , -23.75 , -26.25 , -28.75 , -31.25 , -33.75 , -36.25 , -38.75 , -41.25 , -43.75 , -46.25 , -48.75 , -51.25 , -53.75 , -56.25 , -58.75 , -61.25 , -63.75 , -66.25 , -68.75 , -71.25 , -73.75 , -76.25 , -78.75 , -81.25 , -83.75 , -86.25 , -88.75 , -91.25 , -93.75 , -96.25 , -98.75 , -101.25 , -103.75 , -106.25 , -108.75 , -111.25 , -113.75 , -116.25 , -118.75 , -121.25 , -123.75 , -126.25 , -128.75 , -131.25 , -133.75 , -136.25 , -138.75 , -141.25 , -143.75 , -146.25 , -148.75 , -151.25 , -153.75 , -156.25 , -158.75 , -161.25 , -163.75 , -166.25 , -168.75 , -171.25 , -173.75 , -176.25 , -178.75 , -181.25 , -183.75 , -186.25 , -188.75 , -191.25 , -193.75 , -196.25 , -198.75 , -201.25 , -203.75 , -206.25 , -208.75 , -211.25 , -213.75 , -216.25 , -218.75 , -221.25 , -223.75 , -226.25 , -228.75 , -231.25 , -233.75 , -236.25 , -238.75 , -241.25 , -243.75 , -246.25 , -248.75 , -251.368744, -254.236298, -257.376251, -260.814514, -264.579407, -268.701935, -273.216156, -278.15921 , -283.571838, -289.498688, -295.988556, -303.09491 , -310.876404, -319.397156, -328.727356, -338.943939, -350.131165, -362.381104, -375.794739, -390.482697, -406.56604 , -424.177338, -443.4617 , -464.578064, -487.700439, -513.01947 , -540.743774, -571.101929, -604.344116, -640.744324, -680.602478, -724.247192, -772.038147, -824.369263, -881.671814, -944.418091]) - RF(RF)float640.0 -2.5 -5.0 ... -851.7 -911.6
- axis :
- Z
- c_grid_axis_shift :
- -0.5
array([   0.      ,   -2.5     ,   -5.      ,   -7.5     ,  -10.      ,
        -12.5     ,  -15.      ,  -17.5     ,  -20.      ,  -22.5     ,
        -25.      ,  -27.5     ,  -30.      ,  -32.5     ,  -35.      ,
        -37.5     ,  -40.      ,  -42.5     ,  -45.      ,  -47.5     ,
        -50.      ,  -52.5     ,  -55.      ,  -57.5     ,  -60.      ,
        -62.5     ,  -65.      ,  -67.5     ,  -70.      ,  -72.5     ,
        -75.      ,  -77.5     ,  -80.      ,  -82.5     ,  -85.      ,
        -87.5     ,  -90.      ,  -92.5     ,  -95.      ,  -97.5     ,
       -100.      , -102.5     , -105.      , -107.5     , -110.      ,
       -112.5     , -115.      , -117.5     , -120.      , -122.5     ,
       -125.      , -127.5     , -130.      , -132.5     , -135.      ,
       -137.5     , -140.      , -142.5     , -145.      , -147.5     ,
       -150.      , -152.5     , -155.      , -157.5     , -160.      ,
       -162.5     , -165.      , -167.5     , -170.      , -172.5     ,
       -175.      , -177.5     , -180.      , -182.5     , -185.      ,
       -187.5     , -190.      , -192.5     , -195.      , -197.5     ,
       -200.      , -202.5     , -205.      , -207.5     , -210.      ,
       -212.5     , -215.      , -217.5     , -220.      , -222.5     ,
       -225.      , -227.5     , -230.      , -232.5     , -235.      ,
       -237.5     , -240.      , -242.5     , -245.      , -247.5     ,
       -250.      , -252.737503, -255.735107, -259.017395, -262.611603,
       -266.547211, -270.856689, -275.575592, -280.742798, -286.400909,
       -292.596497, -299.380615, -306.809204, -314.943604, -323.850708,
       -333.604004, -344.283905, -355.978394, -368.783813, -382.805695,
       -398.159698, -414.972412, -433.382294, -453.541107, -475.61499 ,
       -499.785889, -526.252991, -555.234497, -586.969299, -621.718872,
       -659.769714, -701.435303, -747.059082, -797.017212, -851.721313,
       -911.622314])
# heat budget terms
hb = xr.open_mfdataset(
    gen_file_list(suffix="hb"),
    chunks={"latitude": 120, "longitude": 500},
    combine="by_coords",
    parallel=True,
)
hb_ren = pump.model.rename_mitgcm_budget_terms(hb, coords).update(coords.coords)
/glade/u/home/dcherian/python/xarray/xarray/core/indexing.py:1369: PerformanceWarning: Slicing is producing a large chunk. To accept the large
chunk and silence this warning, set the option
    >>> with dask.config.set(**{'array.slicing.split_large_chunks': False}):
    ...     array[indexer]

To avoid creating the large chunks, set the option
    >>> with dask.config.set(**{'array.slicing.split_large_chunks': True}):
    ...     array[indexer]
  return self.array[key]
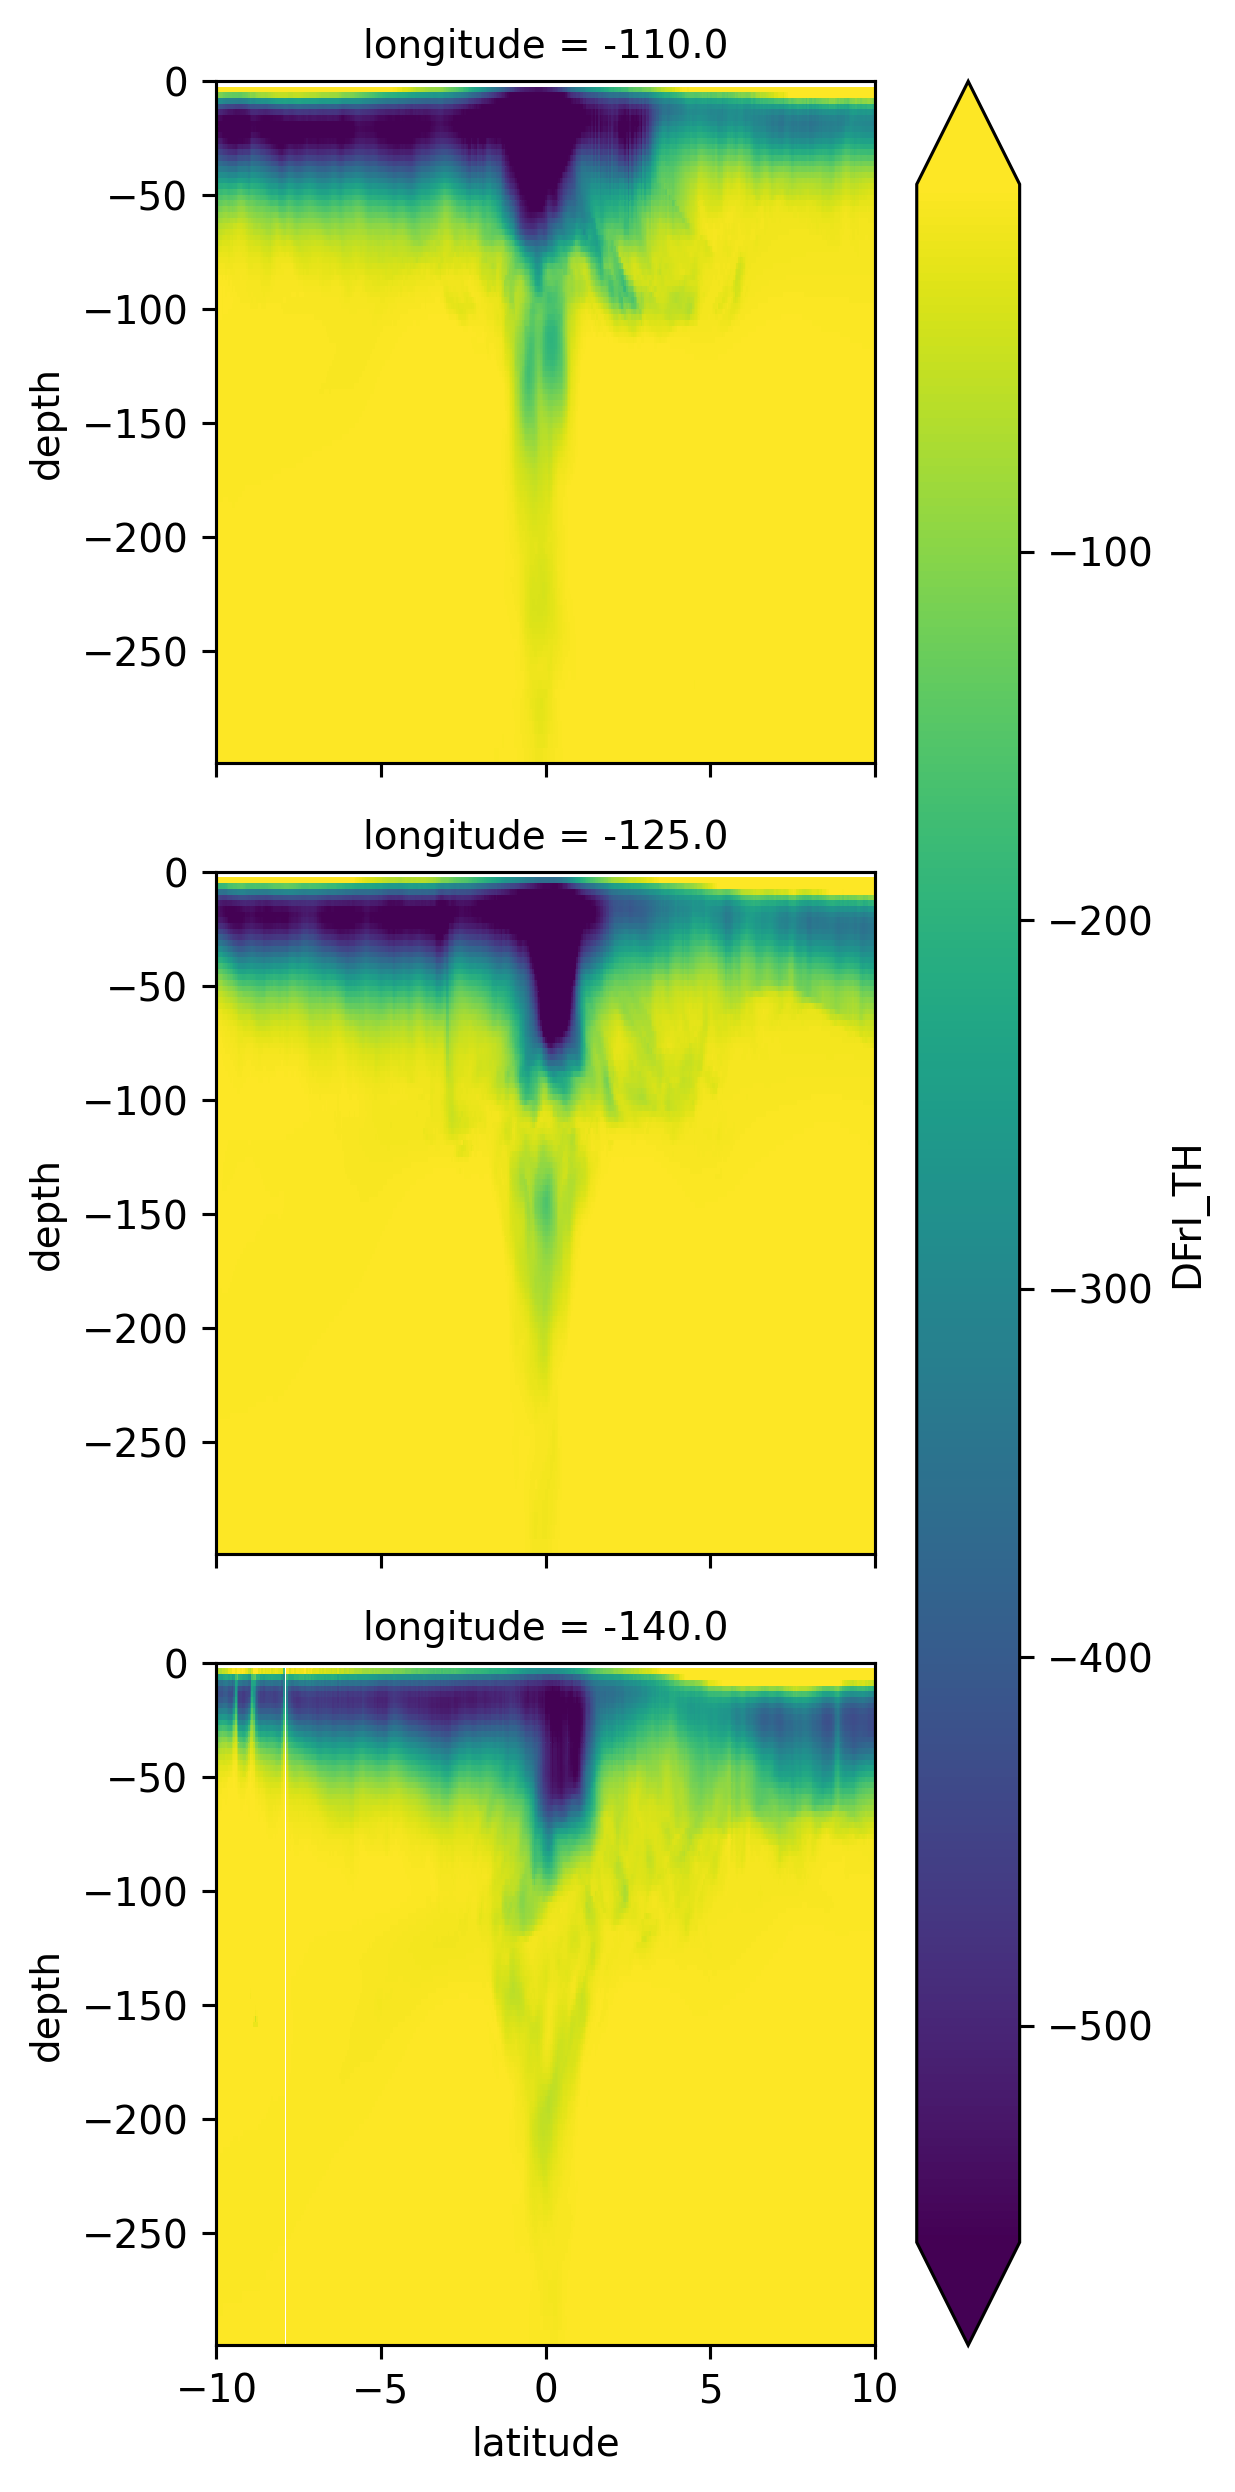
mean_jq = (
    hb.DFrI_TH.sel(longitude=[-110, -125, -140], method="nearest")
    .sel(depth=slice(-300))
    .mean("time")
)
mean_jq.load()
<xarray.DataArray 'DFrI_TH' (depth: 111, latitude: 400, longitude: 3)>
array([[[            nan,             nan,             nan],
        [            nan,             nan,             nan],
        [            nan,             nan,             nan],
        ...,
        [            nan,             nan,             nan],
        [            nan,             nan,             nan],
        [            nan,             nan,             nan]],

       [[ 1.42112747e+02,  5.94594688e+01, -5.93082085e+01],
        [ 1.44666519e+02,  6.14324684e+01, -6.02898674e+01],
        [ 1.44360367e+02,  6.34419479e+01, -6.22355881e+01],
        ...,
        [ 2.31432693e+02,  4.17009491e+02,  4.01192474e+02],
        [ 2.30753906e+02,  4.05777649e+02,  3.98762115e+02],
        [ 2.37696777e+02,  4.13381195e+02,  3.95723633e+02]],

       [[-1.10572083e+02, -1.81223618e+02, -2.25215912e+02],
        [-1.06678154e+02, -1.84810760e+02, -2.31597778e+02],
        [-1.07716698e+02, -1.84303436e+02, -2.38207825e+02],
        ...,
...
        [-3.44992012e-01, -2.88976997e-01, -2.62503415e-01],
        [-3.46459806e-01, -2.89312303e-01, -2.58825988e-01],
        [-3.48412037e-01, -2.89338470e-01, -2.55843401e-01]],

       [[-5.60238361e-01, -1.18054414e+00, -2.38533330e+00],
        [-5.52589178e-01, -1.15252507e+00, -2.35638499e+00],
        [-5.49481094e-01, -1.13359559e+00, -2.33539581e+00],
        ...,
        [-3.42559040e-01, -2.88363278e-01, -2.63150275e-01],
        [-3.43864620e-01, -2.88766146e-01, -2.59617656e-01],
        [-3.45499009e-01, -2.89669156e-01, -2.56860465e-01]],

       [[-5.38183391e-01, -1.07166040e+00, -2.20175934e+00],
        [-5.32029986e-01, -1.04751265e+00, -2.17043352e+00],
        [-5.27017653e-01, -1.02954936e+00, -2.13748431e+00],
        ...,
        [-3.40063900e-01, -2.86965519e-01, -2.61937767e-01],
        [-3.40947121e-01, -2.87385762e-01, -2.58731455e-01],
        [-3.42389703e-01, -2.88775653e-01, -2.56521016e-01]]],
      dtype=float32)
Coordinates:
  * latitude   (latitude) float32 -10.0 -9.95 -9.9 -9.85 ... 9.85 9.9 9.95 10.0
  * longitude  (longitude) float32 -110.0 -125.0 -140.0
  * depth      (depth) float32 -1.25 -3.75 -6.25 -8.75 ... -283.6 -289.5 -296.0
xarray.DataArray
'DFrI_TH'
- depth: 111
- latitude: 400
- longitude: 3
- nan nan nan nan nan nan ... -0.2874 -0.2587 -0.3424 -0.2888 -0.2565
array([[[ nan, nan, nan], [ nan, nan, nan], [ nan, nan, nan], ..., [ nan, nan, nan], [ nan, nan, nan], [ nan, nan, nan]], [[ 1.42112747e+02, 5.94594688e+01, -5.93082085e+01], [ 1.44666519e+02, 6.14324684e+01, -6.02898674e+01], [ 1.44360367e+02, 6.34419479e+01, -6.22355881e+01], ..., [ 2.31432693e+02, 4.17009491e+02, 4.01192474e+02], [ 2.30753906e+02, 4.05777649e+02, 3.98762115e+02], [ 2.37696777e+02, 4.13381195e+02, 3.95723633e+02]], [[-1.10572083e+02, -1.81223618e+02, -2.25215912e+02], [-1.06678154e+02, -1.84810760e+02, -2.31597778e+02], [-1.07716698e+02, -1.84303436e+02, -2.38207825e+02], ..., ... [-3.44992012e-01, -2.88976997e-01, -2.62503415e-01], [-3.46459806e-01, -2.89312303e-01, -2.58825988e-01], [-3.48412037e-01, -2.89338470e-01, -2.55843401e-01]], [[-5.60238361e-01, -1.18054414e+00, -2.38533330e+00], [-5.52589178e-01, -1.15252507e+00, -2.35638499e+00], [-5.49481094e-01, -1.13359559e+00, -2.33539581e+00], ..., [-3.42559040e-01, -2.88363278e-01, -2.63150275e-01], [-3.43864620e-01, -2.88766146e-01, -2.59617656e-01], [-3.45499009e-01, -2.89669156e-01, -2.56860465e-01]], [[-5.38183391e-01, -1.07166040e+00, -2.20175934e+00], [-5.32029986e-01, -1.04751265e+00, -2.17043352e+00], [-5.27017653e-01, -1.02954936e+00, -2.13748431e+00], ..., [-3.40063900e-01, -2.86965519e-01, -2.61937767e-01], [-3.40947121e-01, -2.87385762e-01, -2.58731455e-01], [-3.42389703e-01, -2.88775653e-01, -2.56521016e-01]]], dtype=float32) - latitude(latitude)float32-10.0 -9.95 -9.9 ... 9.9 9.95 10.0
array([-10. , -9.949875, -9.89975 , ..., 9.89975 , 9.949875, 10. ], dtype=float32) - longitude(longitude)float32-110.0 -125.0 -140.0
array([-110.00916, -125.01973, -139.98027], dtype=float32)
- depth(depth)float32-1.25 -3.75 -6.25 ... -289.5 -296.0
array([  -1.25   ,   -3.75   ,   -6.25   ,   -8.75   ,  -11.25   ,  -13.75   ,
        -16.25   ,  -18.75   ,  -21.25   ,  -23.75   ,  -26.25   ,  -28.75   ,
        -31.25   ,  -33.75   ,  -36.25   ,  -38.75   ,  -41.25   ,  -43.75   ,
        -46.25   ,  -48.75   ,  -51.25   ,  -53.75   ,  -56.25   ,  -58.75   ,
        -61.25   ,  -63.75   ,  -66.25   ,  -68.75   ,  -71.25   ,  -73.75   ,
        -76.25   ,  -78.75   ,  -81.25   ,  -83.75   ,  -86.25   ,  -88.75   ,
        -91.25   ,  -93.75   ,  -96.25   ,  -98.75   , -101.25   , -103.75   ,
       -106.25   , -108.75   , -111.25   , -113.75   , -116.25   , -118.75   ,
       -121.25   , -123.75   , -126.25   , -128.75   , -131.25   , -133.75   ,
       -136.25   , -138.75   , -141.25   , -143.75   , -146.25   , -148.75   ,
       -151.25   , -153.75   , -156.25   , -158.75   , -161.25   , -163.75   ,
       -166.25   , -168.75   , -171.25   , -173.75   , -176.25   , -178.75   ,
       -181.25   , -183.75   , -186.25   , -188.75   , -191.25   , -193.75   ,
       -196.25   , -198.75   , -201.25   , -203.75   , -206.25   , -208.75   ,
       -211.25   , -213.75   , -216.25   , -218.75   , -221.25   , -223.75   ,
       -226.25   , -228.75   , -231.25   , -233.75   , -236.25   , -238.75   ,
       -241.25   , -243.75   , -246.25   , -248.75   , -251.36874, -254.2363 ,
       -257.37625, -260.8145 , -264.5794 , -268.70193, -273.21616, -278.1592 ,
       -283.57184, -289.4987 , -295.98856], dtype=float32)
mean_jq.plot(row="longitude", y="depth", robust=True)
<xarray.plot.facetgrid.FacetGrid at 0x2b7c9c8856d0>
Stations#
metrics = pump.model.read_metrics(stationdirname)
stations = pump.model.read_stations_20(stationdirname)
enso = pump.obs.make_enso_mask()
stations["enso"] = enso.reindex(time=stations.time.data, method="nearest")
sections = dcpy.dask.map_copy(
    stations.isel(latitude=slice(1, None, 3), longitude=slice(1, None, 3))
)
sections = pump.calc.calc_reduced_shear(sections)
sections["dcl_base"] = pump.calc.get_dcl_base_Ri(sections)
calc uz
calc vz
calc S2
calc N2
calc shred2
Calc Ri
mld_dcl = xr.open_zarr(
    "/glade/work/dcherian/pump/zarrs/temp_mld_sections.zarr", consolidated=True
)
mld_dcl
<xarray.Dataset>
Dimensions:    (time: 174000, longitude: 4, latitude: 37)
Coordinates:
  * latitude   (latitude) float64 -3.025 -2.775 -2.525 ... 5.475 5.725 5.975
  * longitude  (longitude) float64 -155.0 -140.0 -125.0 -110.0
  * time       (time) datetime64[ns] 1998-12-31T18:00:00 ... 2018-11-06T17:00:00
Data variables:
    dcl_Jq     (time, longitude, latitude) float64 dask.array<chunksize=(6000, 1, 1), meta=np.ndarray>
    dcl_base   (time, longitude, latitude) float32 dask.array<chunksize=(21750, 1, 10), meta=np.ndarray>
    mld        (time, longitude, latitude) float32 dask.array<chunksize=(21750, 1, 10), meta=np.ndarray>
Attributes:
    easting:   longitude
    northing:  latitude
    title:     Station profile, index (i,j)=(1201,240)
xarray.Dataset
- time: 174000
- longitude: 4
- latitude: 37
- latitude(latitude)float64-3.025 -2.775 ... 5.725 5.975
array([-3.025, -2.775, -2.525, -2.275, -2.025, -1.775, -1.525, -1.275, -1.025, -0.775, -0.525, -0.275, -0.025, 0.225, 0.475, 0.725, 0.975, 1.225, 1.475, 1.725, 1.975, 2.225, 2.475, 2.725, 2.975, 3.225, 3.475, 3.725, 3.975, 4.225, 4.475, 4.725, 4.975, 5.225, 5.475, 5.725, 5.975]) - longitude(longitude)float64-155.0 -140.0 -125.0 -110.0
array([-155.024994, -140.024994, -125.025002, -110.025002])
- time(time)datetime64[ns]1998-12-31T18:00:00 ... 2018-11-...
array(['1998-12-31T18:00:00.000000000', '1998-12-31T19:00:00.000000000',
       '1998-12-31T20:00:00.000000000', ..., '2018-11-06T15:00:32.000000000',
       '2018-11-06T16:00:16.000000000', '2018-11-06T17:00:00.000000000'],
      dtype='datetime64[ns]')
- dcl_Jq(time, longitude, latitude)float64dask.array<chunksize=(6000, 1, 1), meta=np.ndarray>
Array Chunk Bytes 206.02 MB 48.00 kB Shape (174000, 4, 37) (6000, 1, 1) Count 4293 Tasks 4292 Chunks Type float64 numpy.ndarray - dcl_base(time, longitude, latitude)float32dask.array<chunksize=(21750, 1, 10), meta=np.ndarray>
- description :
- Deepest depth above EUC where Ri=0.54
- long_name :
- DCL Base (Ri)
- units :
- m
Array Chunk Bytes 103.01 MB 870.00 kB Shape (174000, 4, 37) (21750, 1, 10) Count 129 Tasks 128 Chunks Type float32 numpy.ndarray - mld(time, longitude, latitude)float32dask.array<chunksize=(21750, 1, 10), meta=np.ndarray>
- description :
- Interpolate density to 1m grid. Search for max depth where |drho| > 0.01 and N2 > 1e-5
- long_name :
- MLD
- units :
- m
Array Chunk Bytes 103.01 MB 870.00 kB Shape (174000, 4, 37) (21750, 1, 10) Count 129 Tasks 128 Chunks Type float32 numpy.ndarray
- easting :
- longitude
- northing :
- latitude
- title :
- Station profile, index (i,j)=(1201,240)
sections.update(mld_dcl)
sections = sections.cf.guess_coord_axis()
sections["Jq"] = sections.Jq.persist()
Exploring 2 box idealization#
moor = sections.sel(latitude=0, longitude=-140, method="nearest").sel(depth=slice(-500))
moor = dcpy.dask.map_copy(moor)
moor = moor.persist()
moordaily = moor.resample(time="D").mean()
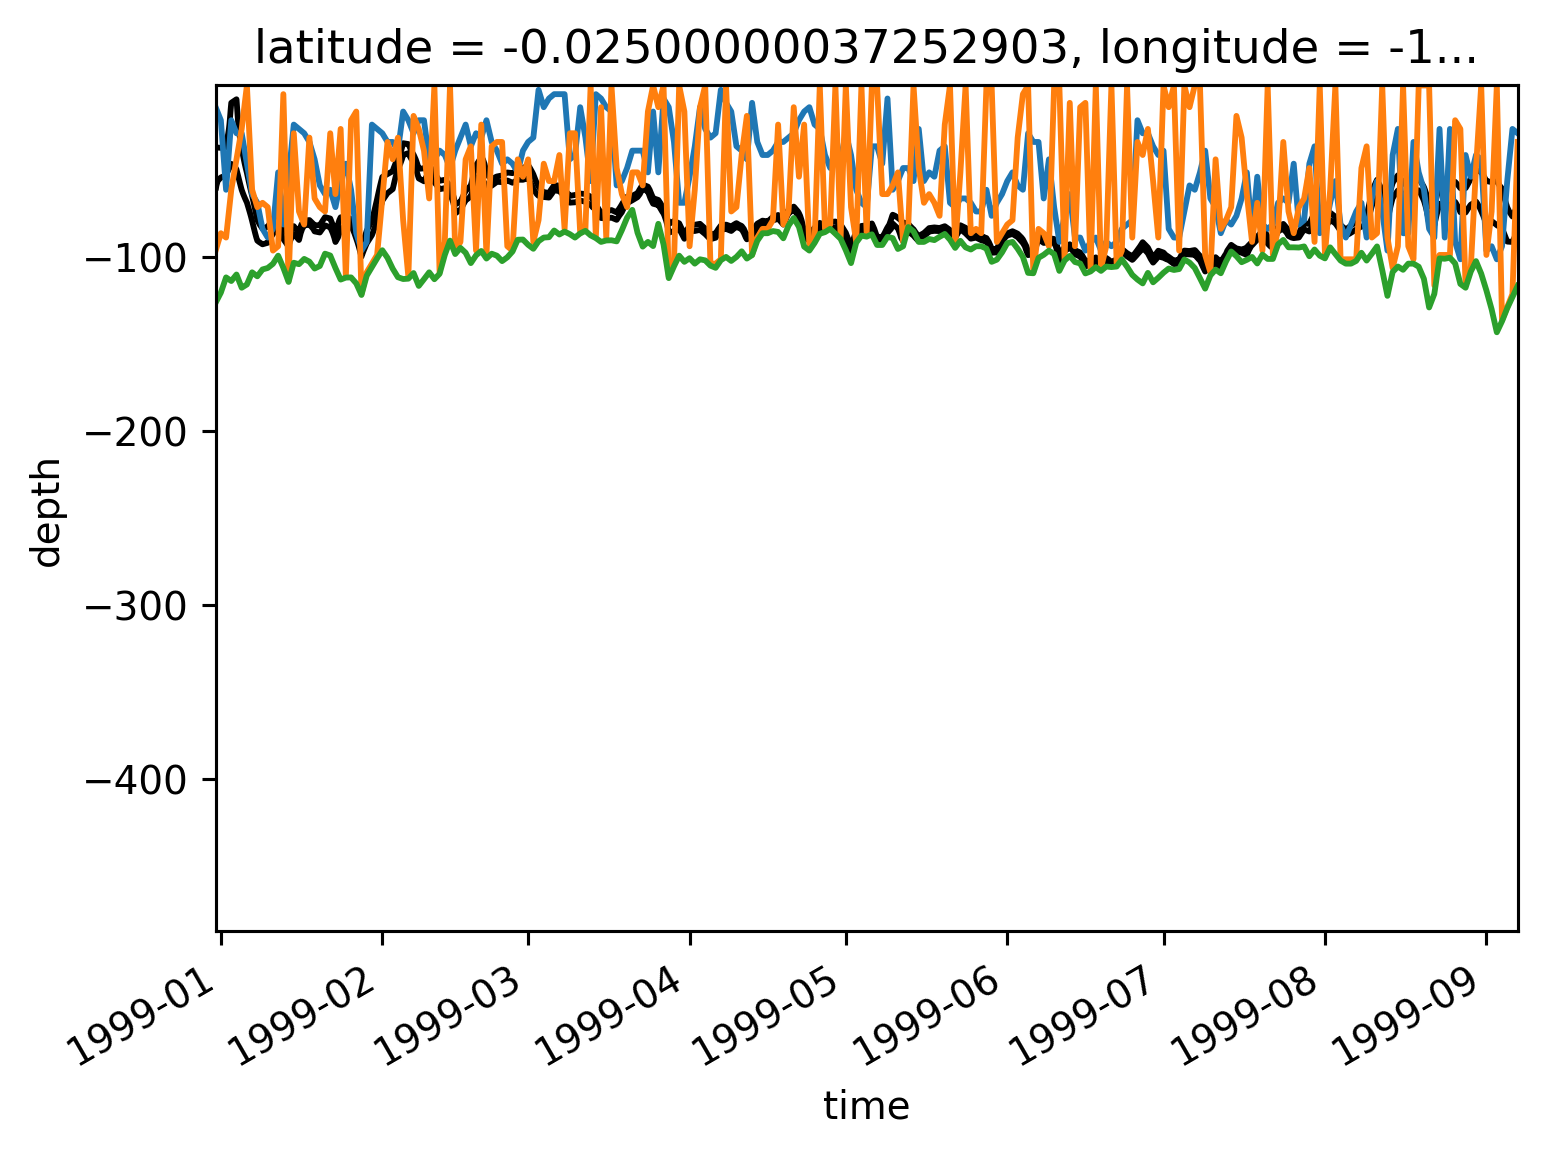
moordaily["zeuc"] = pump.get_euc_max(moordaily.u)
moordaily["zjmax"] = (
    moordaily.Jq.where(moordaily.depth > moordaily.zeuc).idxmin("depth").persist()
)
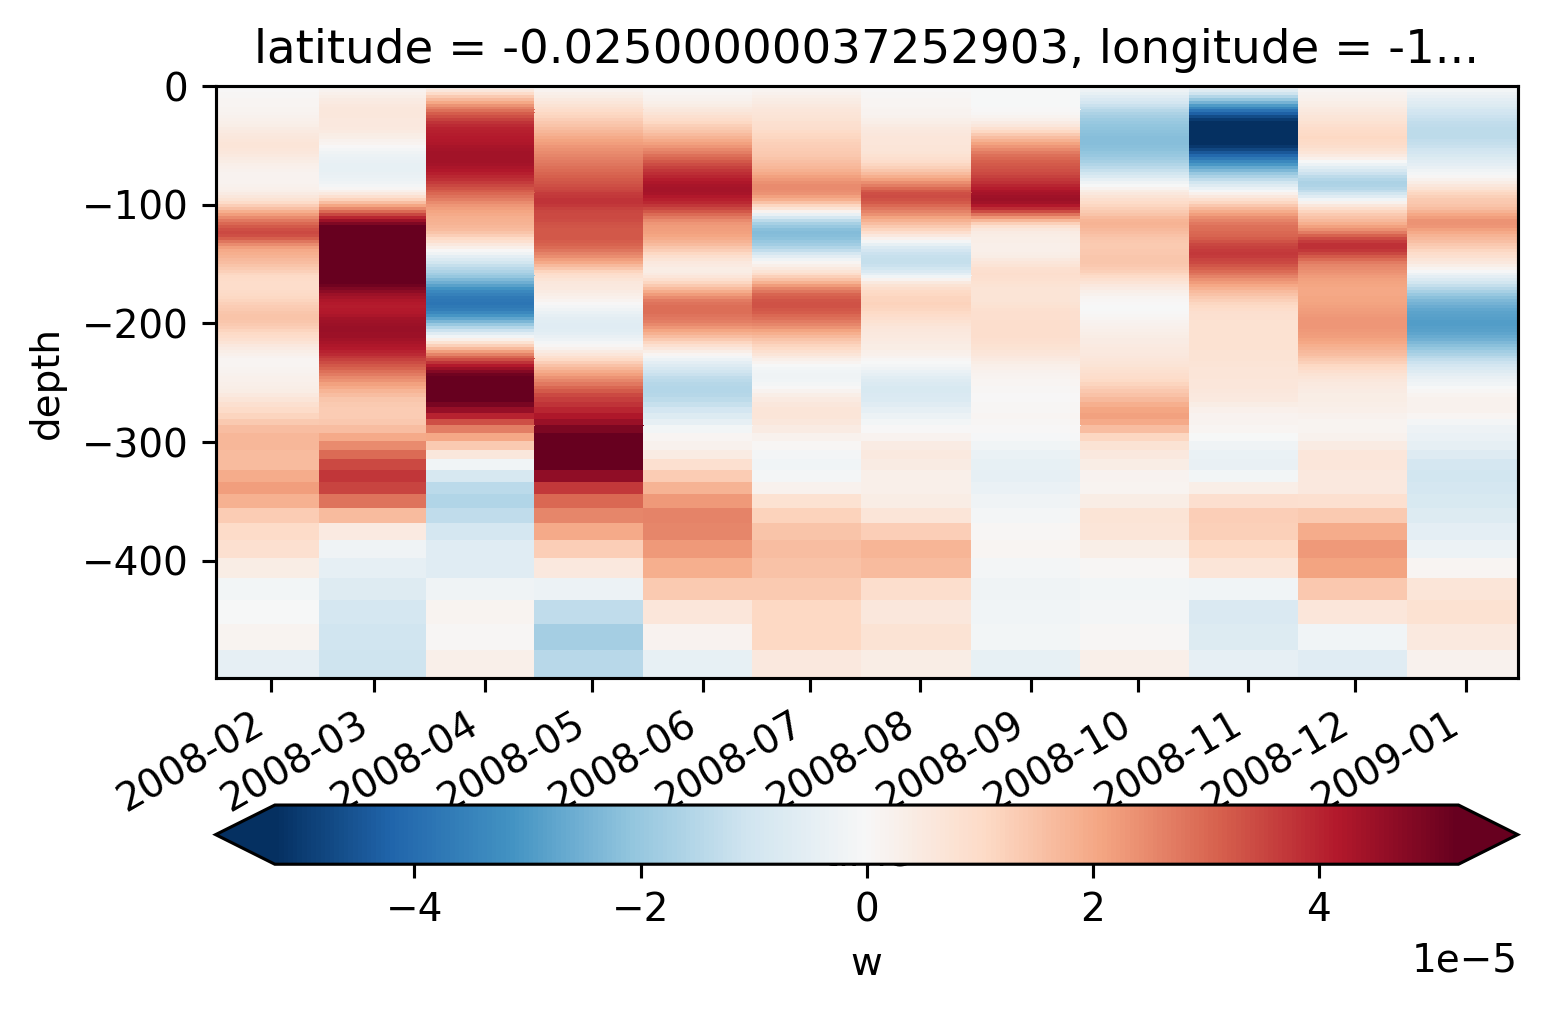
moordaily["zwmax"] = moordaily.w.where(moordaily.depth > moordaily.zeuc).idxmax("depth")
moordaily.w.sel(time="2008").resample(time="M").mean().plot(
    x="time", robust=True, cbar_kwargs={"orientation": "horizontal"}
)
<matplotlib.collections.QuadMesh at 0x2b99f1d648e0>
moordaily.zjmax.plot(x="time")
moordaily.zwmax.plot(x="time")
moordaily.zeuc.plot(x="time")
moordaily.theta.plot.contour(x="time", levels=[21.5, 22], colors="k")
<matplotlib.contour.QuadContourSet at 0x2b99c8e3b370>
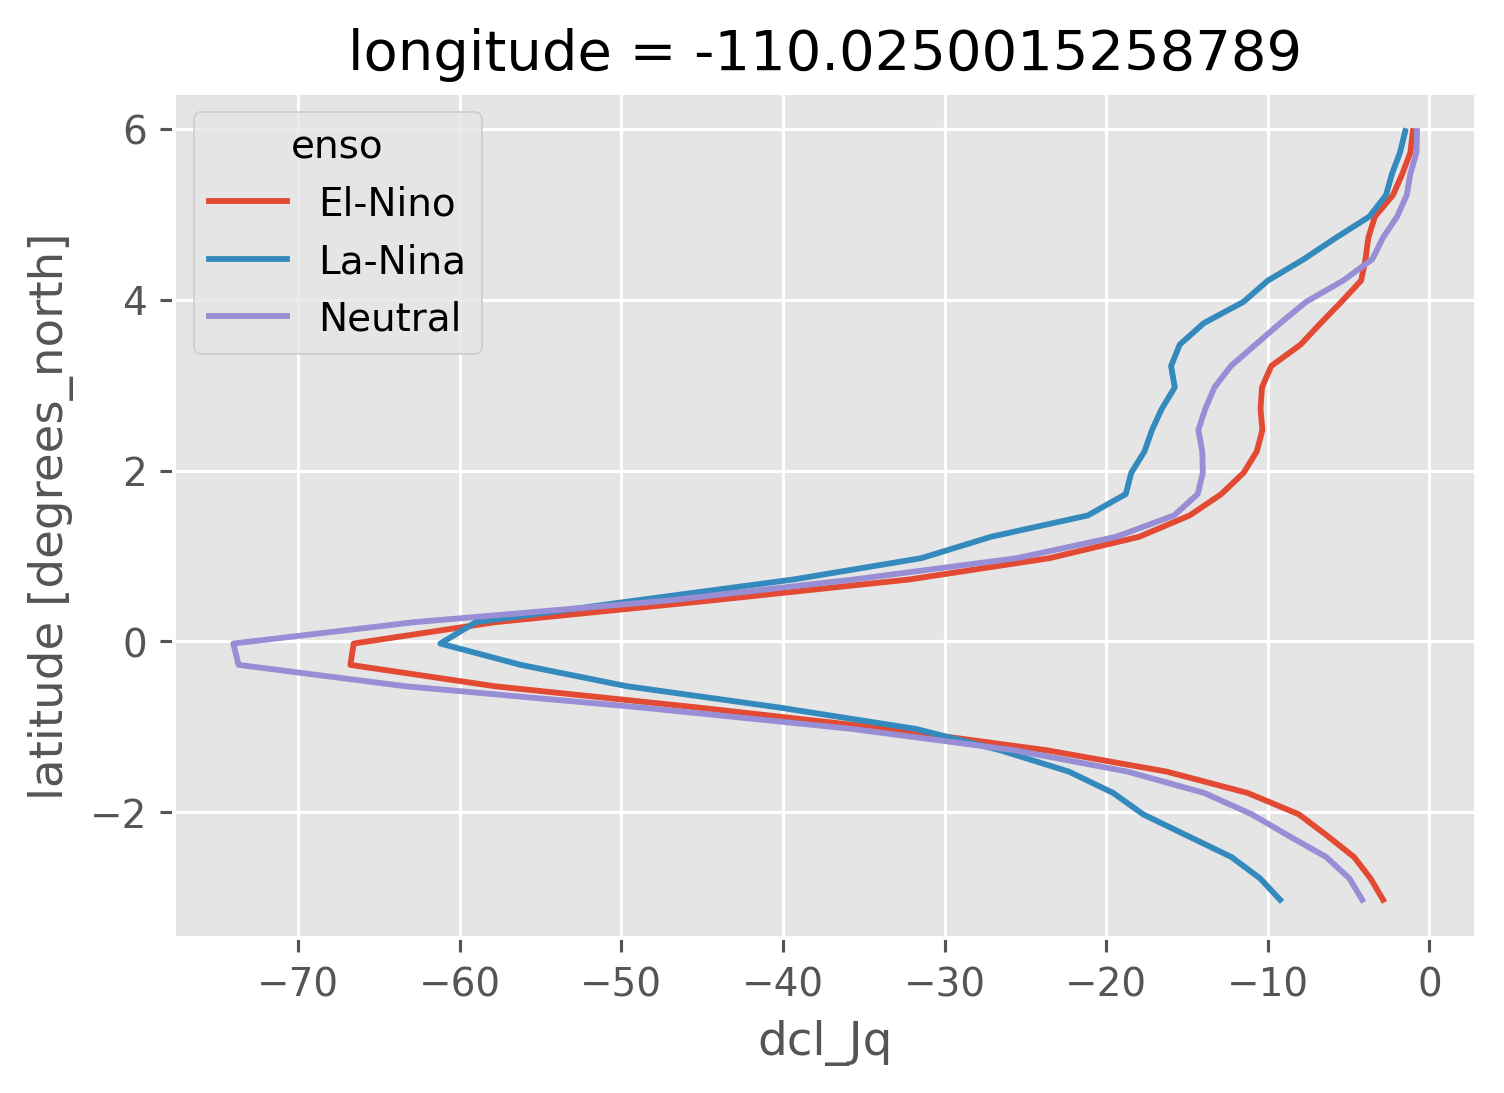
DCL variation with ENSO phase#
sections["dcl"] = sections.mld - sections.dcl_base
sections["dcl_mask"] = (
    (sections.depth < sections.mld)
    & (sections.depth > sections.dcl_base)
    & (sections.dcl > 10)
)

sections["dcl_Jq"] = sections.Jq.where(sections.dcl_mask).sum("depth") / 30
sections
<xarray.Dataset>
Dimensions:        (depth: 185, latitude: 37, longitude: 4, time: 174000)
Coordinates:
  * depth          (depth) float32 -1.25 -3.75 -6.25 ... -5.658e+03 -5.758e+03
  * latitude       (latitude) float64 -3.025 -2.775 -2.525 ... 5.475 5.725 5.975
  * longitude      (longitude) float64 -155.0 -140.0 -125.0 -110.0
  * time           (time) datetime64[ns] 1998-12-31T18:00:00 ... 2018-11-06T1...
Data variables: (12/32)
    DFrI_TH        (depth, time, longitude, latitude) float32 dask.array<chunksize=(185, 6000, 1, 1), meta=np.ndarray>
    KPPdiffKzT     (depth, time, longitude, latitude) float32 dask.array<chunksize=(185, 6000, 1, 1), meta=np.ndarray>
    KPPg_TH        (depth, time, longitude, latitude) float32 dask.array<chunksize=(185, 6000, 1, 1), meta=np.ndarray>
    KPPhbl         (time, longitude, latitude) float32 dask.array<chunksize=(6000, 1, 1), meta=np.ndarray>
    KPPviscAz      (depth, time, longitude, latitude) float32 dask.array<chunksize=(185, 6000, 1, 1), meta=np.ndarray>
    SSH            (time, longitude, latitude) float32 dask.array<chunksize=(6000, 1, 1), meta=np.ndarray>
    ...             ...
    Ri             (depth, time, longitude, latitude) float64 dask.array<chunksize=(185, 6000, 1, 1), meta=np.ndarray>
    dcl_base       (time, longitude, latitude) float32 dask.array<chunksize=(21750, 1, 10), meta=np.ndarray>
    enso           (time) <U8 'La-Nina' 'La-Nina' ... 'Neutral' 'Neutral'
    dcl_Jq         (time, longitude, latitude) float64 dask.array<chunksize=(6000, 1, 1), meta=np.ndarray>
    dcl            (time, longitude, latitude) float32 dask.array<chunksize=(21750, 1, 10), meta=np.ndarray>
    dcl_mask       (depth, time, longitude, latitude) bool dask.array<chunksize=(185, 21750, 1, 10), meta=np.ndarray>
Attributes:
    easting:   longitude
    northing:  latitude
    title:     Station profile, index (i,j)=(1201,240)
xarray.Dataset
- depth: 185
- latitude: 37
- longitude: 4
- time: 174000
- depth(depth)float32-1.25 -3.75 ... -5.758e+03
- axis :
- Z
array([-1.250000e+00, -3.750000e+00, -6.250000e+00, -8.750000e+00, -1.125000e+01, -1.375000e+01, -1.625000e+01, -1.875000e+01, -2.125000e+01, -2.375000e+01, -2.625000e+01, -2.875000e+01, -3.125000e+01, -3.375000e+01, -3.625000e+01, -3.875000e+01, -4.125000e+01, -4.375000e+01, -4.625000e+01, -4.875000e+01, -5.125000e+01, -5.375000e+01, -5.625000e+01, -5.875000e+01, -6.125000e+01, -6.375000e+01, -6.625000e+01, -6.875000e+01, -7.125000e+01, -7.375000e+01, -7.625000e+01, -7.875000e+01, -8.125000e+01, -8.375000e+01, -8.625000e+01, -8.875000e+01, -9.125000e+01, -9.375000e+01, -9.625000e+01, -9.875000e+01, -1.012500e+02, -1.037500e+02, -1.062500e+02, -1.087500e+02, -1.112500e+02, -1.137500e+02, -1.162500e+02, -1.187500e+02, -1.212500e+02, -1.237500e+02, -1.262500e+02, -1.287500e+02, -1.312500e+02, -1.337500e+02, -1.362500e+02, -1.387500e+02, -1.412500e+02, -1.437500e+02, -1.462500e+02, -1.487500e+02, -1.512500e+02, -1.537500e+02, -1.562500e+02, -1.587500e+02, -1.612500e+02, -1.637500e+02, -1.662500e+02, -1.687500e+02, -1.712500e+02, -1.737500e+02, -1.762500e+02, -1.787500e+02, -1.812500e+02, -1.837500e+02, -1.862500e+02, -1.887500e+02, -1.912500e+02, -1.937500e+02, -1.962500e+02, -1.987500e+02, -2.012500e+02, -2.037500e+02, -2.062500e+02, -2.087500e+02, -2.112500e+02, -2.137500e+02, -2.162500e+02, -2.187500e+02, -2.212500e+02, -2.237500e+02, -2.262500e+02, -2.287500e+02, -2.312500e+02, -2.337500e+02, -2.362500e+02, -2.387500e+02, -2.412500e+02, -2.437500e+02, -2.462500e+02, -2.487500e+02, -2.513687e+02, -2.542363e+02, -2.573763e+02, -2.608145e+02, -2.645794e+02, -2.687019e+02, -2.732162e+02, -2.781592e+02, -2.835718e+02, -2.894987e+02, -2.959886e+02, -3.030949e+02, -3.108764e+02, -3.193972e+02, -3.287274e+02, -3.389439e+02, -3.501312e+02, -3.623811e+02, -3.757947e+02, -3.904827e+02, -4.065660e+02, -4.241773e+02, -4.434617e+02, -4.645781e+02, -4.877004e+02, -5.130195e+02, -5.407438e+02, -5.711019e+02, -6.043441e+02, -6.407443e+02, -6.806025e+02, -7.242472e+02, -7.720381e+02, -8.243693e+02, -8.816718e+02, -9.444181e+02, -1.013125e+03, -1.088360e+03, -1.170741e+03, -1.260949e+03, -1.358099e+03, -1.458099e+03, -1.558099e+03, -1.658099e+03, -1.758099e+03, -1.858099e+03, -1.958099e+03, -2.058098e+03, -2.158098e+03, -2.258098e+03, -2.358098e+03, -2.458098e+03, -2.558098e+03, -2.658098e+03, -2.758098e+03, -2.858098e+03, -2.958098e+03, -3.058098e+03, -3.158098e+03, -3.258098e+03, -3.358098e+03, -3.458098e+03, -3.558098e+03, -3.658098e+03, -3.758098e+03, -3.858098e+03, -3.958098e+03, -4.058098e+03, -4.158099e+03, -4.258099e+03, -4.358099e+03, -4.458099e+03, -4.558099e+03, -4.658099e+03, -4.758099e+03, -4.858099e+03, -4.958099e+03, -5.058099e+03, -5.158099e+03, -5.258099e+03, -5.358099e+03, -5.458099e+03, -5.558099e+03, -5.658099e+03, -5.758099e+03], dtype=float32) - latitude(latitude)float64-3.025 -2.775 ... 5.725 5.975
- units :
- degrees_north
- standard_name :
- latitude
array([-3.025, -2.775, -2.525, -2.275, -2.025, -1.775, -1.525, -1.275, -1.025, -0.775, -0.525, -0.275, -0.025, 0.225, 0.475, 0.725, 0.975, 1.225, 1.475, 1.725, 1.975, 2.225, 2.475, 2.725, 2.975, 3.225, 3.475, 3.725, 3.975, 4.225, 4.475, 4.725, 4.975, 5.225, 5.475, 5.725, 5.975]) - longitude(longitude)float64-155.0 -140.0 -125.0 -110.0
- units :
- degrees_east
- standard_name :
- longitude
array([-155.024994, -140.024994, -125.025002, -110.025002])
- time(time)datetime64[ns]1998-12-31T18:00:00 ... 2018-11-...
- axis :
- T
- standard_name :
- time
array(['1998-12-31T18:00:00.000000000', '1998-12-31T19:00:00.000000000',
       '1998-12-31T20:00:00.000000000', ..., '2018-11-06T15:00:32.000000000',
       '2018-11-06T16:00:16.000000000', '2018-11-06T17:00:00.000000000'],
      dtype='datetime64[ns]')
- DFrI_TH(depth, time, longitude, latitude)float32dask.array<chunksize=(185, 6000, 1, 1), meta=np.ndarray>
Array Chunk Bytes 19.06 GB 4.44 MB Shape (185, 174000, 4, 37) (185, 6000, 1, 1) Count 17197 Tasks 4292 Chunks Type float32 numpy.ndarray - KPPdiffKzT(depth, time, longitude, latitude)float32dask.array<chunksize=(185, 6000, 1, 1), meta=np.ndarray>
Array Chunk Bytes 19.06 GB 4.44 MB Shape (185, 174000, 4, 37) (185, 6000, 1, 1) Count 17197 Tasks 4292 Chunks Type float32 numpy.ndarray - KPPg_TH(depth, time, longitude, latitude)float32dask.array<chunksize=(185, 6000, 1, 1), meta=np.ndarray>
Array Chunk Bytes 19.06 GB 4.44 MB Shape (185, 174000, 4, 37) (185, 6000, 1, 1) Count 30073 Tasks 4292 Chunks Type float32 numpy.ndarray - KPPhbl(time, longitude, latitude)float32dask.array<chunksize=(6000, 1, 1), meta=np.ndarray>
Array Chunk Bytes 103.01 MB 24.00 kB Shape (174000, 4, 37) (6000, 1, 1) Count 17197 Tasks 4292 Chunks Type float32 numpy.ndarray - KPPviscAz(depth, time, longitude, latitude)float32dask.array<chunksize=(185, 6000, 1, 1), meta=np.ndarray>
Array Chunk Bytes 19.06 GB 4.44 MB Shape (185, 174000, 4, 37) (185, 6000, 1, 1) Count 17197 Tasks 4292 Chunks Type float32 numpy.ndarray - SSH(time, longitude, latitude)float32dask.array<chunksize=(6000, 1, 1), meta=np.ndarray>
Array Chunk Bytes 103.01 MB 24.00 kB Shape (174000, 4, 37) (6000, 1, 1) Count 17197 Tasks 4292 Chunks Type float32 numpy.ndarray - VISrI_Um(depth, time, longitude, latitude)float32dask.array<chunksize=(185, 6000, 1, 1), meta=np.ndarray>
Array Chunk Bytes 19.06 GB 4.44 MB Shape (185, 174000, 4, 37) (185, 6000, 1, 1) Count 17197 Tasks 4292 Chunks Type float32 numpy.ndarray - VISrI_Vm(depth, time, longitude, latitude)float32dask.array<chunksize=(185, 6000, 1, 1), meta=np.ndarray>
Array Chunk Bytes 19.06 GB 4.44 MB Shape (185, 174000, 4, 37) (185, 6000, 1, 1) Count 17197 Tasks 4292 Chunks Type float32 numpy.ndarray - salt(depth, time, longitude, latitude)float32dask.array<chunksize=(185, 6000, 1, 1), meta=np.ndarray>
Array Chunk Bytes 19.06 GB 4.44 MB Shape (185, 174000, 4, 37) (185, 6000, 1, 1) Count 17197 Tasks 4292 Chunks Type float32 numpy.ndarray - theta(depth, time, longitude, latitude)float32dask.array<chunksize=(185, 6000, 1, 1), meta=np.ndarray>
Array Chunk Bytes 19.06 GB 4.44 MB Shape (185, 174000, 4, 37) (185, 6000, 1, 1) Count 17197 Tasks 4292 Chunks Type float32 numpy.ndarray - u(depth, time, longitude, latitude)float32dask.array<chunksize=(185, 6000, 1, 1), meta=np.ndarray>
Array Chunk Bytes 19.06 GB 4.44 MB Shape (185, 174000, 4, 37) (185, 6000, 1, 1) Count 17197 Tasks 4292 Chunks Type float32 numpy.ndarray - v(depth, time, longitude, latitude)float32dask.array<chunksize=(185, 6000, 1, 1), meta=np.ndarray>
Array Chunk Bytes 19.06 GB 4.44 MB Shape (185, 174000, 4, 37) (185, 6000, 1, 1) Count 17197 Tasks 4292 Chunks Type float32 numpy.ndarray - w(depth, time, longitude, latitude)float32dask.array<chunksize=(185, 6000, 1, 1), meta=np.ndarray>
Array Chunk Bytes 19.06 GB 4.44 MB Shape (185, 174000, 4, 37) (185, 6000, 1, 1) Count 17197 Tasks 4292 Chunks Type float32 numpy.ndarray - Jq_shear(depth, time, longitude, latitude)float64dask.array<chunksize=(185, 6000, 1, 1), meta=np.ndarray>
Array Chunk Bytes 38.11 GB 8.88 MB Shape (185, 174000, 4, 37) (185, 6000, 1, 1) Count 38962 Tasks 4292 Chunks Type float64 numpy.ndarray - nonlocal_flux(depth, time, longitude, latitude)float64dask.array<chunksize=(185, 6000, 1, 1), meta=np.ndarray>
Array Chunk Bytes 38.11 GB 8.88 MB Shape (185, 174000, 4, 37) (185, 6000, 1, 1) Count 38962 Tasks 4292 Chunks Type float64 numpy.ndarray - dens(depth, time, longitude, latitude)float64dask.array<chunksize=(185, 6000, 1, 1), meta=np.ndarray>
Array Chunk Bytes 38.11 GB 8.88 MB Shape (185, 174000, 4, 37) (185, 6000, 1, 1) Count 38687 Tasks 4292 Chunks Type float64 numpy.ndarray - mld(time, longitude, latitude)float32dask.array<chunksize=(21750, 1, 10), meta=np.ndarray>
- description :
- Interpolate density to 1m grid. Search for max depth where |drho| > 0.01 and N2 > 1e-5
- long_name :
- MLD
- units :
- m
Array Chunk Bytes 103.01 MB 870.00 kB Shape (174000, 4, 37) (21750, 1, 10) Count 129 Tasks 128 Chunks Type float32 numpy.ndarray - Jq(depth, time, longitude, latitude)float64dask.array<chunksize=(185, 6000, 1, 1), meta=np.ndarray>
Array Chunk Bytes 38.11 GB 8.88 MB Shape (185, 174000, 4, 37) (185, 6000, 1, 1) Count 4292 Tasks 4292 Chunks Type float64 numpy.ndarray - dJdz(depth, time, longitude, latitude)float64dask.array<chunksize=(185, 6000, 1, 1), meta=np.ndarray>
Array Chunk Bytes 38.11 GB 8.88 MB Shape (185, 174000, 4, 37) (185, 6000, 1, 1) Count 99079 Tasks 4292 Chunks Type float64 numpy.ndarray - dTdt(depth, time, longitude, latitude)float64dask.array<chunksize=(185, 6000, 1, 1), meta=np.ndarray>
- long_name :
- $∂T/∂t = -1/(ρ_0c_p) ∂J_q/∂z$
- units :
- °C/month
Array Chunk Bytes 38.11 GB 8.88 MB Shape (185, 174000, 4, 37) (185, 6000, 1, 1) Count 120539 Tasks 4292 Chunks Type float64 numpy.ndarray - uz(depth, time, longitude, latitude)float32dask.array<chunksize=(185, 6000, 1, 1), meta=np.ndarray>
Array Chunk Bytes 19.06 GB 4.44 MB Shape (185, 174000, 4, 37) (185, 6000, 1, 1) Count 42949 Tasks 4292 Chunks Type float32 numpy.ndarray - vz(depth, time, longitude, latitude)float32dask.array<chunksize=(185, 6000, 1, 1), meta=np.ndarray>
Array Chunk Bytes 19.06 GB 4.44 MB Shape (185, 174000, 4, 37) (185, 6000, 1, 1) Count 42949 Tasks 4292 Chunks Type float32 numpy.ndarray - S2(depth, time, longitude, latitude)float32dask.array<chunksize=(185, 6000, 1, 1), meta=np.ndarray>
- long_name :
- $S^2$
- units :
- s$^{-2}$
Array Chunk Bytes 19.06 GB 4.44 MB Shape (185, 174000, 4, 37) (185, 6000, 1, 1) Count 98774 Tasks 4292 Chunks Type float32 numpy.ndarray - shear(depth, time, longitude, latitude)float32dask.array<chunksize=(185, 6000, 1, 1), meta=np.ndarray>
- long_name :
- |$u_z$|
- units :
- s$^{-1}$
Array Chunk Bytes 19.06 GB 4.44 MB Shape (185, 174000, 4, 37) (185, 6000, 1, 1) Count 103066 Tasks 4292 Chunks Type float32 numpy.ndarray - N2(depth, time, longitude, latitude)float64dask.array<chunksize=(185, 6000, 1, 1), meta=np.ndarray>
- long_name :
- $N^2$
- units :
- s$^{-2}$
Array Chunk Bytes 38.11 GB 8.88 MB Shape (185, 174000, 4, 37) (185, 6000, 1, 1) Count 68731 Tasks 4292 Chunks Type float64 numpy.ndarray - shred2(depth, time, longitude, latitude)float64dask.array<chunksize=(185, 6000, 1, 1), meta=np.ndarray>
- long_name :
- Reduced shear$^2$
- units :
- $s^{-2}$
Array Chunk Bytes 38.11 GB 8.88 MB Shape (185, 174000, 4, 37) (185, 6000, 1, 1) Count 176089 Tasks 4292 Chunks Type float64 numpy.ndarray - Ri(depth, time, longitude, latitude)float64dask.array<chunksize=(185, 6000, 1, 1), meta=np.ndarray>
- long_name :
- Ri
- units :
Array Chunk Bytes 38.11 GB 8.88 MB Shape (185, 174000, 4, 37) (185, 6000, 1, 1) Count 171797 Tasks 4292 Chunks Type float64 numpy.ndarray - dcl_base(time, longitude, latitude)float32dask.array<chunksize=(21750, 1, 10), meta=np.ndarray>
- description :
- Deepest depth above EUC where Ri=0.54
- long_name :
- DCL Base (Ri)
- units :
- m
Array Chunk Bytes 103.01 MB 870.00 kB Shape (174000, 4, 37) (21750, 1, 10) Count 129 Tasks 128 Chunks Type float32 numpy.ndarray - enso(time)<U8'La-Nina' 'La-Nina' ... 'Neutral'
- description :
- ENSO phase; El-Nino = NINO34 SSTA > 0.4 for at least 6 months; La-Nina = NINO34 SSTA < -0.4 for at least 6 months
array(['La-Nina', 'La-Nina', 'La-Nina', ..., 'Neutral', 'Neutral', 'Neutral'], dtype='<U8') - dcl_Jq(time, longitude, latitude)float64dask.array<chunksize=(6000, 1, 1), meta=np.ndarray>
Array Chunk Bytes 206.02 MB 48.00 kB Shape (174000, 4, 37) (6000, 1, 1) Count 55727 Tasks 5328 Chunks Type float64 numpy.ndarray - dcl(time, longitude, latitude)float32dask.array<chunksize=(21750, 1, 10), meta=np.ndarray>
- description :
- Interpolate density to 1m grid. Search for max depth where |drho| > 0.01 and N2 > 1e-5
- long_name :
- MLD
- units :
- m
Array Chunk Bytes 103.01 MB 870.00 kB Shape (174000, 4, 37) (21750, 1, 10) Count 386 Tasks 128 Chunks Type float32 numpy.ndarray - dcl_mask(depth, time, longitude, latitude)booldask.array<chunksize=(185, 21750, 1, 10), meta=np.ndarray>
- axis :
- Z
Array Chunk Bytes 4.76 GB 40.24 MB Shape (185, 174000, 4, 37) (185, 21750, 1, 10) Count 1411 Tasks 128 Chunks Type bool numpy.ndarray
- easting :
- longitude
- northing :
- latitude
- title :
- Station profile, index (i,j)=(1201,240)
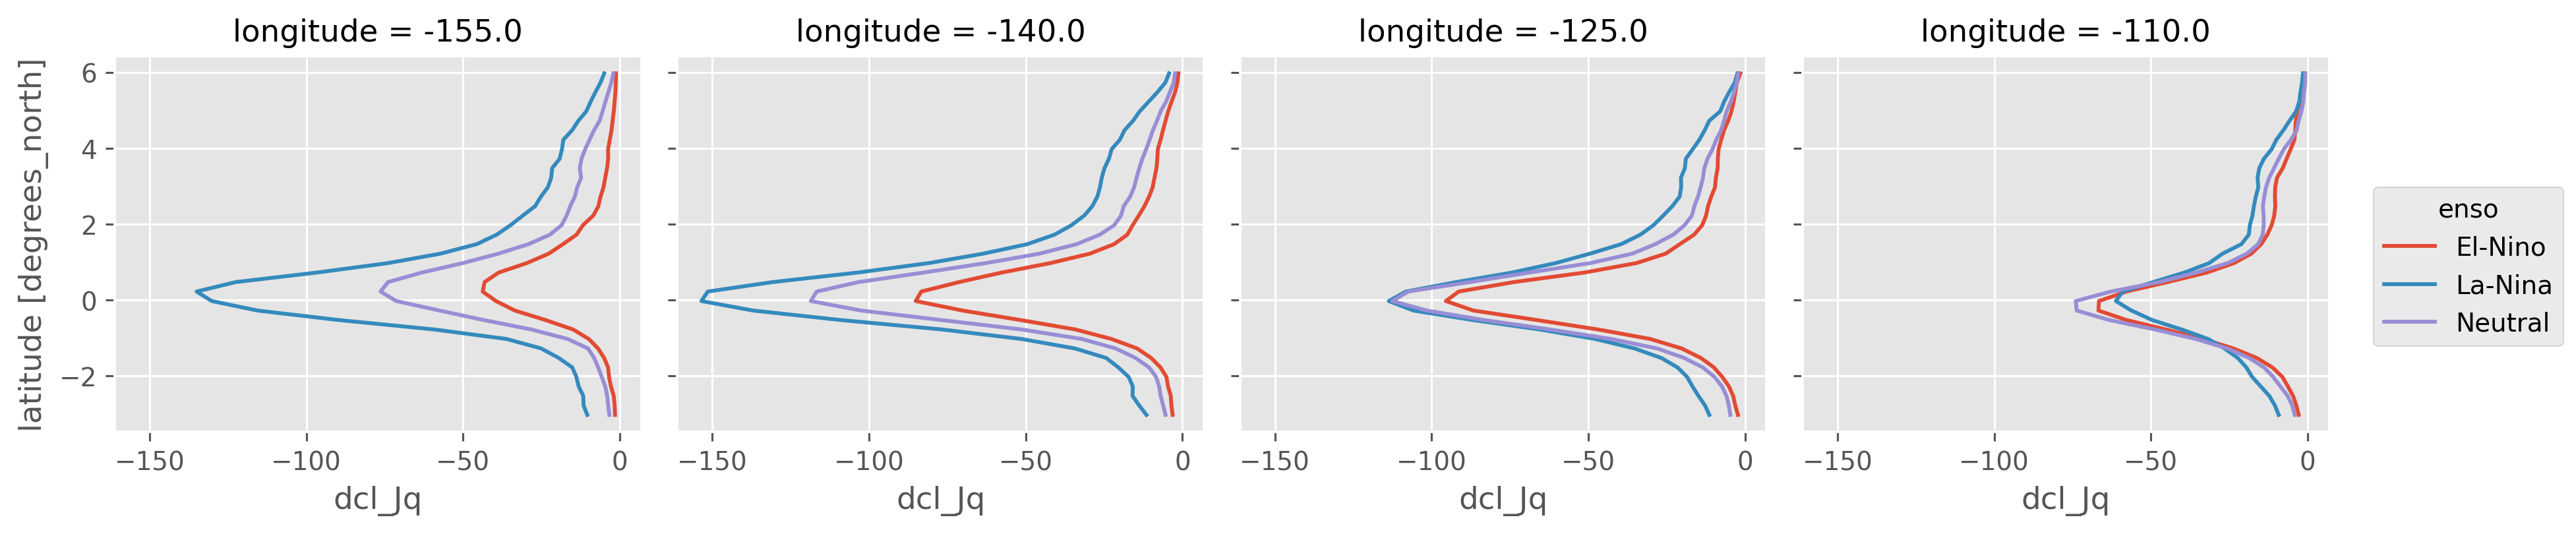
At least 10m DCL; at each hour, mean \(J_q\) in deep cycle layer is calcualted as \(1/(30m)∫ J_q dz\) integrated in depth between \(z_{MLD}\) and \(z_{Ri}\) assuming a mean deep-cycle layer width of 30m
plt.style.use("ggplot")
enso_mean_Jq = sections.dcl_Jq.groupby(sections.enso).mean().compute()
At least 10m DCL width
enso_mean_Jq.plot(hue="enso", col="longitude", y="latitude")
<xarray.plot.facetgrid.FacetGrid at 0x2b69d49489d0>
enso_sum_Jq = sections.dcl_Jq.groupby(sections.enso).sum().compute()
enso_count_Jq = sections.dcl_Jq.groupby(sections.enso).count().compute()
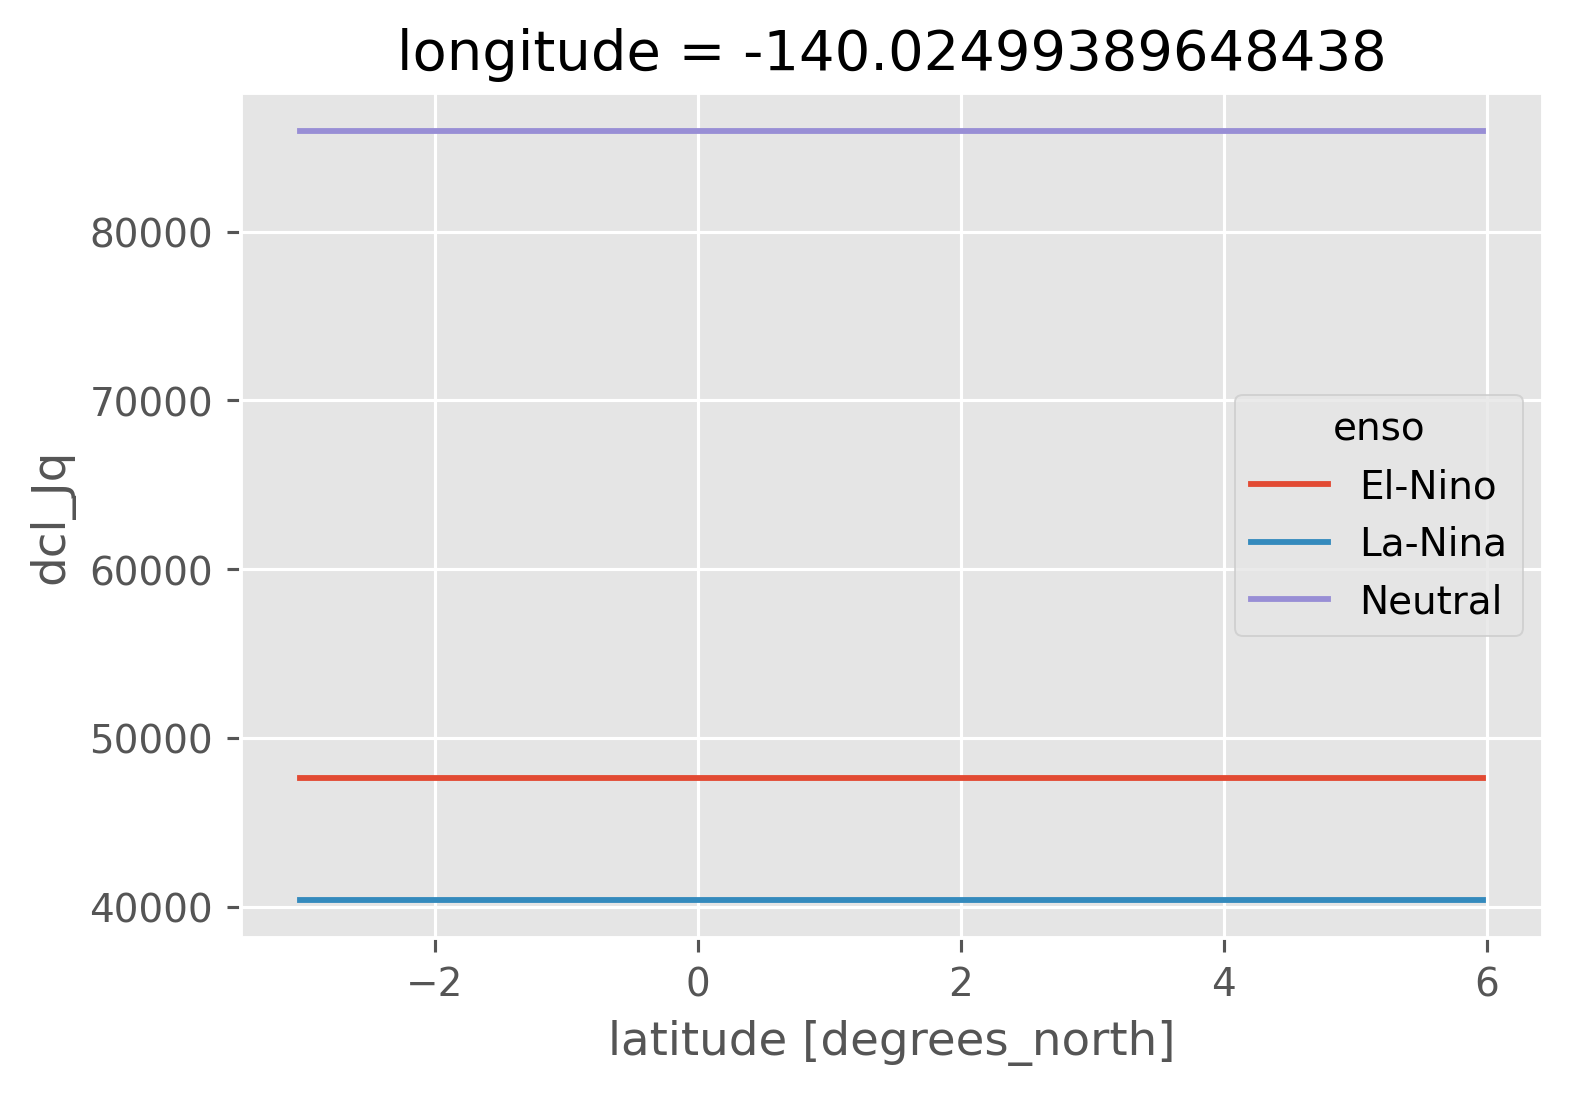
enso_count_Jq.sel(longitude=-140, method="nearest").plot(hue="enso")
[<matplotlib.lines.Line2D at 0x2b5550672e50>,
 <matplotlib.lines.Line2D at 0x2b5550672d60>,
 <matplotlib.lines.Line2D at 0x2b5550672ca0>]
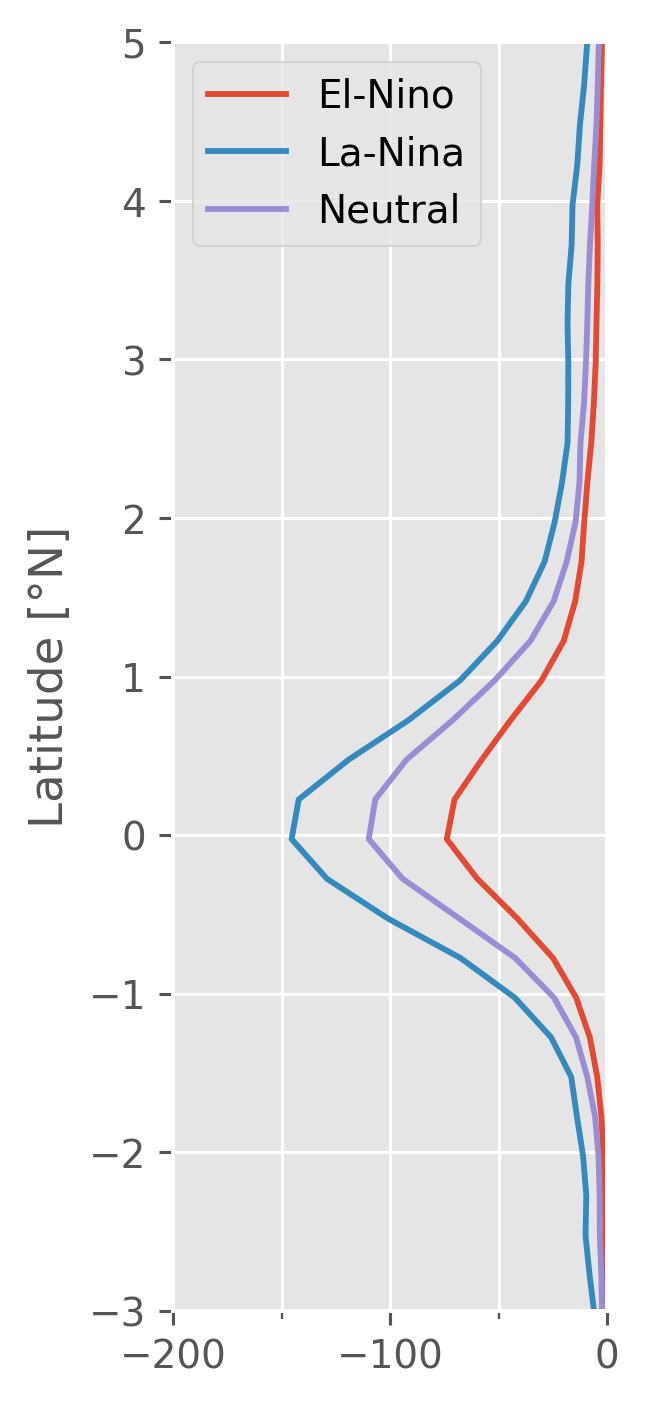
(enso_mean_Jq.sel(longitude=-140, method="nearest")).plot(
    y="latitude", hue="enso", size=4, aspect=1, ylim=(-3, 5)
)
ax = plt.gca()
ax.get_legend().set_title("")
ax.set_xlabel("")
ax.set_ylabel("Latitude [°N]")
ax.set_title("140°W")
ax.set_xlim([-200, 0])
plt.gcf().set_size_inches((2, 6))

for aa in [ax]:
    aa.set_title("")
    aa.xaxis.set_minor_locator(mpl.ticker.AutoMinorLocator(2))
    aa.grid(True, which="both")
    aa.set_ylim((-3, 5))
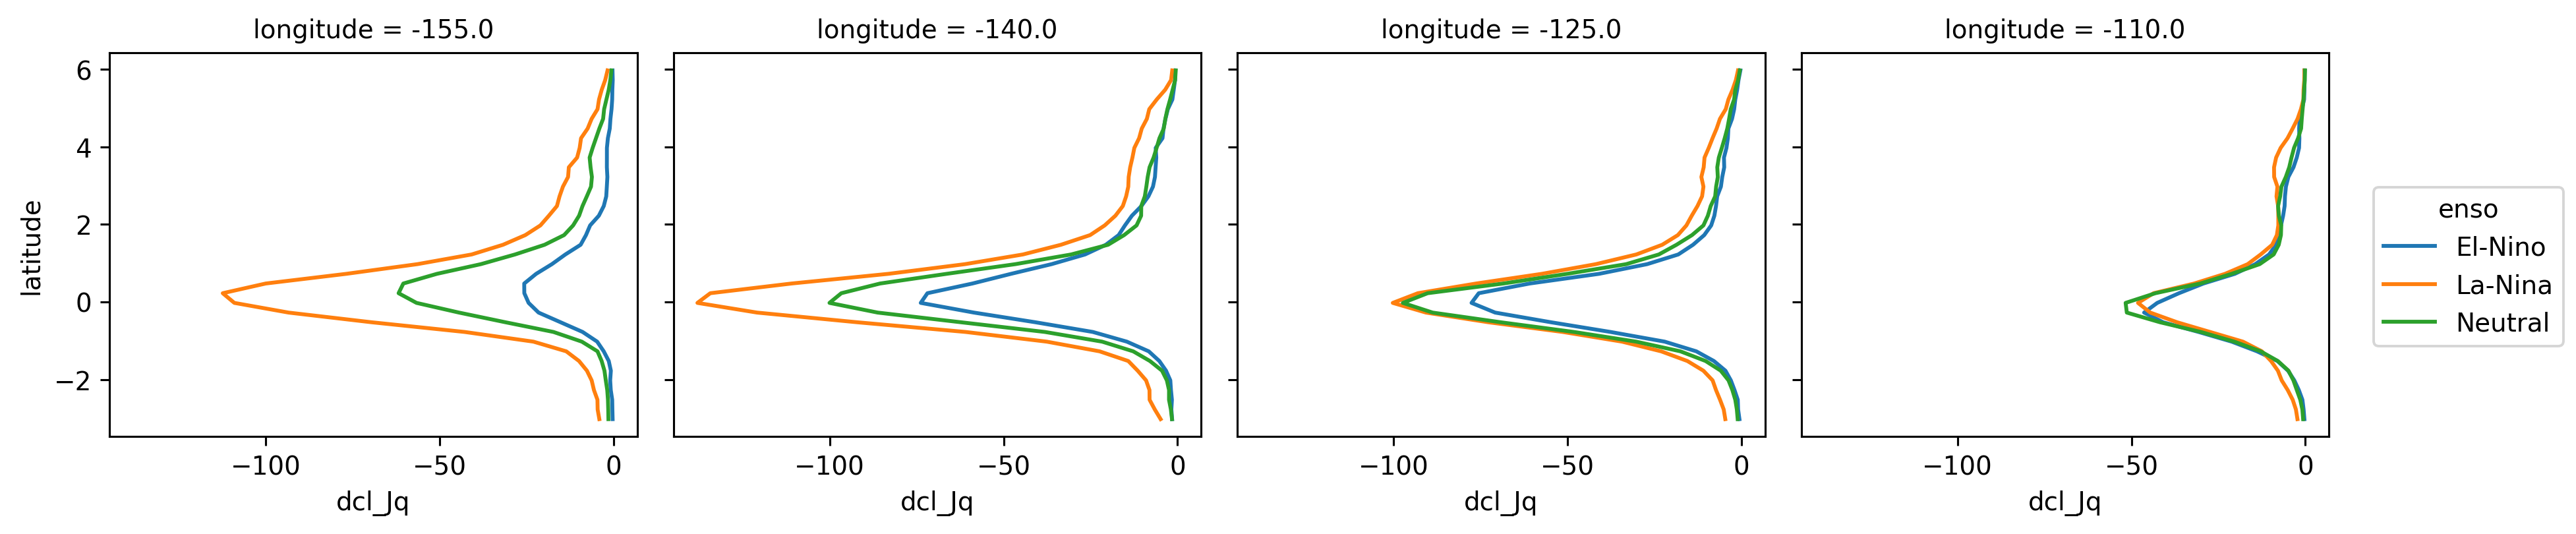
At least 30m DCL
sections.dcl_Jq.groupby(sections.enso).mean().plot(
    hue="enso", col="longitude", y="latitude"
)
<xarray.plot.facetgrid.FacetGrid at 0x2b85fd2ee760>
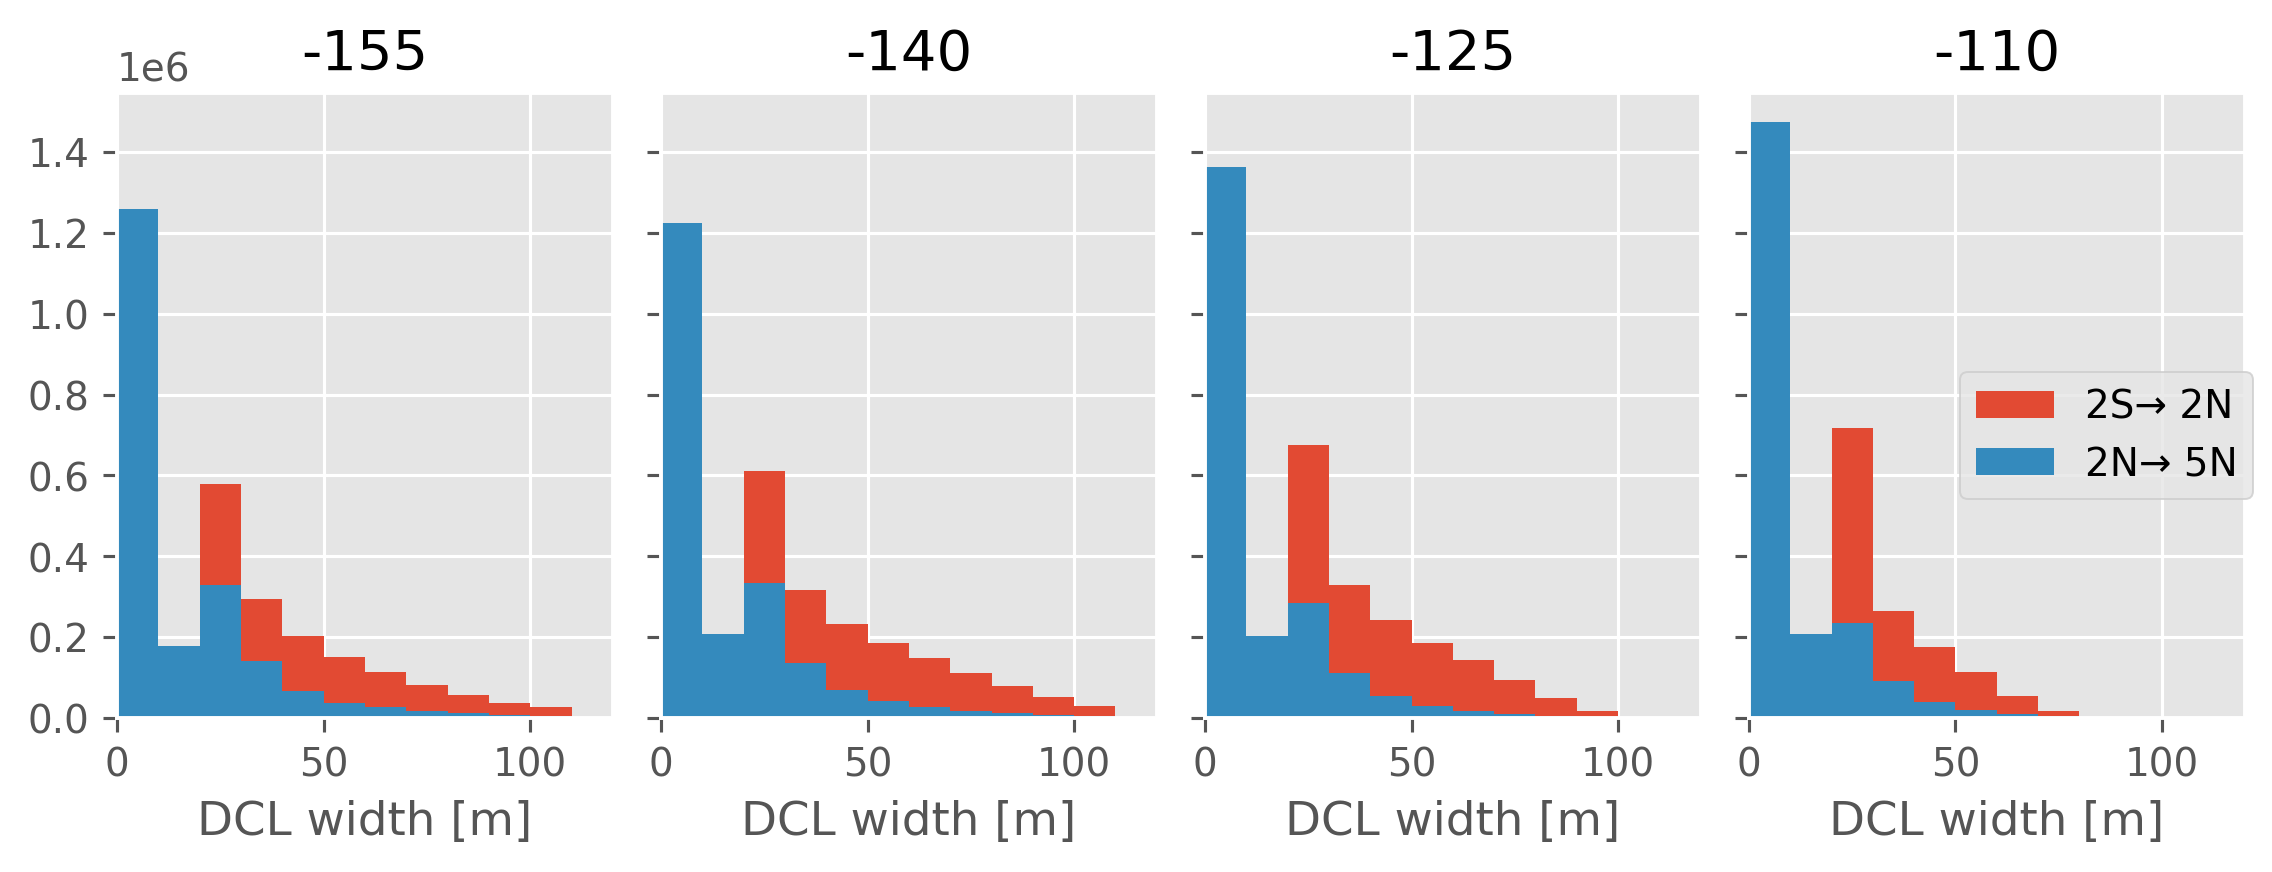
DCL width histograms#
sections.dcl.attrs["long_name"] = "DCL width"
hdl = [None, None]
f, axx = plt.subplots(1, 4, sharex=True, sharey=True, constrained_layout=True)
for lon, ax in zip([-155, -140, -125, -110], axx):
    kwargs = dict(ax=ax, bins=range(0, 111, 10), histtype="bar")
    hdl[0] = (
        sections.dcl.sel(longitude=lon, method="nearest")
        .sel(latitude=slice(-2, 2))
        .plot.hist(**kwargs)[2]
    )
    hdl[1] = (
        sections.dcl.sel(longitude=lon, method="nearest")
        .sel(latitude=slice(2, 5))
        .plot.hist(**kwargs)[2]
    )
    ax.set_title(f"{lon}")
    ax.set_xlim([0, 120])
f.legend(handles=hdl, labels=["2S→ 2N", "2N→ 5N"], loc="right")
f.set_size_inches((8, 3))
sections.v.sel(latitude=0, method="nearest").sel(depth=slice(-80, 0))
<xarray.DataArray 'v' (depth: 0, time: 174000, longitude: 4)>
dask.array<getitem, shape=(0, 174000, 4), dtype=float32, chunksize=(0, 6000, 1), chunktype=numpy.ndarray>
Coordinates:
  * depth      (depth) float32
    latitude   float64 -0.025
  * longitude  (longitude) float64 -155.0 -140.0 -125.0 -110.0
  * time       (time) datetime64[ns] 1998-12-31T18:00:00 ... 2018-11-06T17:00:00
xarray.DataArray
'v'
- depth: 0
- time: 174000
- longitude: 4
- dask.array<chunksize=(0, 6000, 1), meta=np.ndarray>
Array Chunk Bytes 0 B 0 B Shape (0, 174000, 4) (0, 6000, 1) Count 17429 Tasks 116 Chunks Type float32 numpy.ndarray - depth(depth)float32
- axis :
- Z
array([], dtype=float32)
- latitude()float64-0.025
- units :
- degrees_north
- standard_name :
- latitude
array(-0.025)
- longitude(longitude)float64-155.0 -140.0 -125.0 -110.0
- units :
- degrees_east
- standard_name :
- longitude
array([-155.024994, -140.024994, -125.025002, -110.025002])
- time(time)datetime64[ns]1998-12-31T18:00:00 ... 2018-11-...
- axis :
- T
- standard_name :
- time
array(['1998-12-31T18:00:00.000000000', '1998-12-31T19:00:00.000000000',
       '1998-12-31T20:00:00.000000000', ..., '2018-11-06T15:00:32.000000000',
       '2018-11-06T16:00:16.000000000', '2018-11-06T17:00:00.000000000'],
      dtype='datetime64[ns]')
def calc_tiw_ke(v, interp_gaps=False):
    import xfilter

    vmean = v.sel(depth=slice(0, -80)).mean("depth")

    if interp_gaps:
        vmean = vmean.chunk({"time": -1}).interpolate_na("time", max_gap="10D")
    # Moum et al. 2009 metric
    v = xfilter.bandpass(
        vmean.compute(),
        "time",
        freq=[1 / 12, 1 / 33],
        cycles_per="D",
        debug=False,
        num_discard=120,
    )
    tiwke = xfilter.lowpass(
        v**2 / 2,
        "time",
        freq=1 / 20,
        cycles_per="D",
    )
    tiwke.attrs = {"long_name": "TIW KE", "units": "m²/s²"}
    return tiwke


tiwke = calc_tiw_ke(sections.v.sel(latitude=0, method="nearest"))
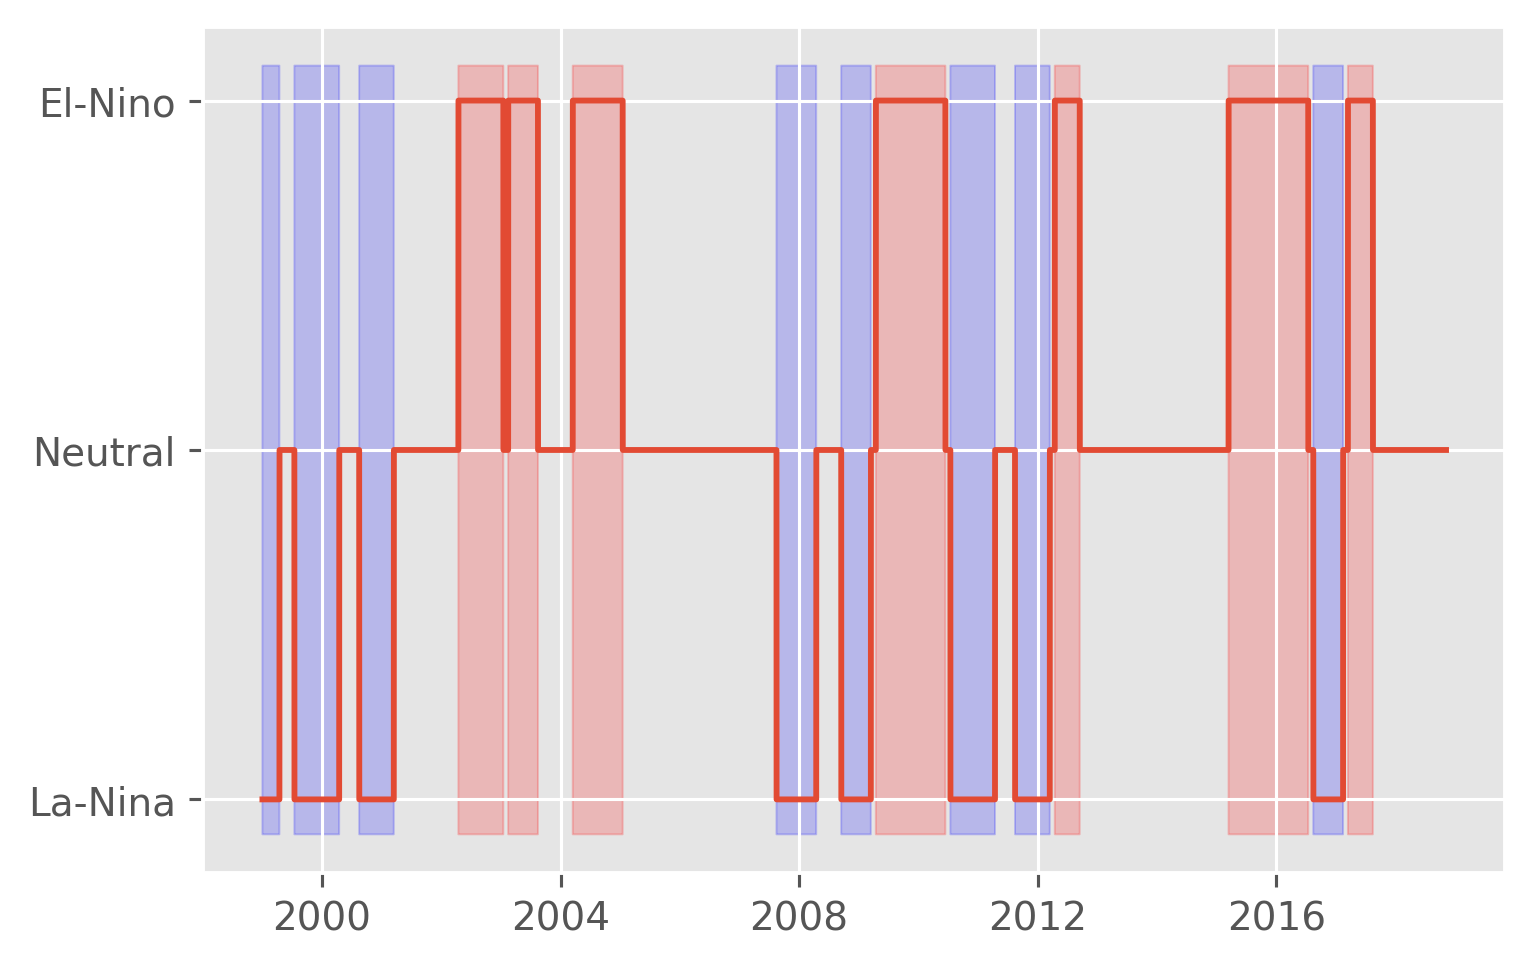
plt.plot(sections.time, sections.enso)
pump.plot.highlight_enso(plt.gca(), sections.enso)
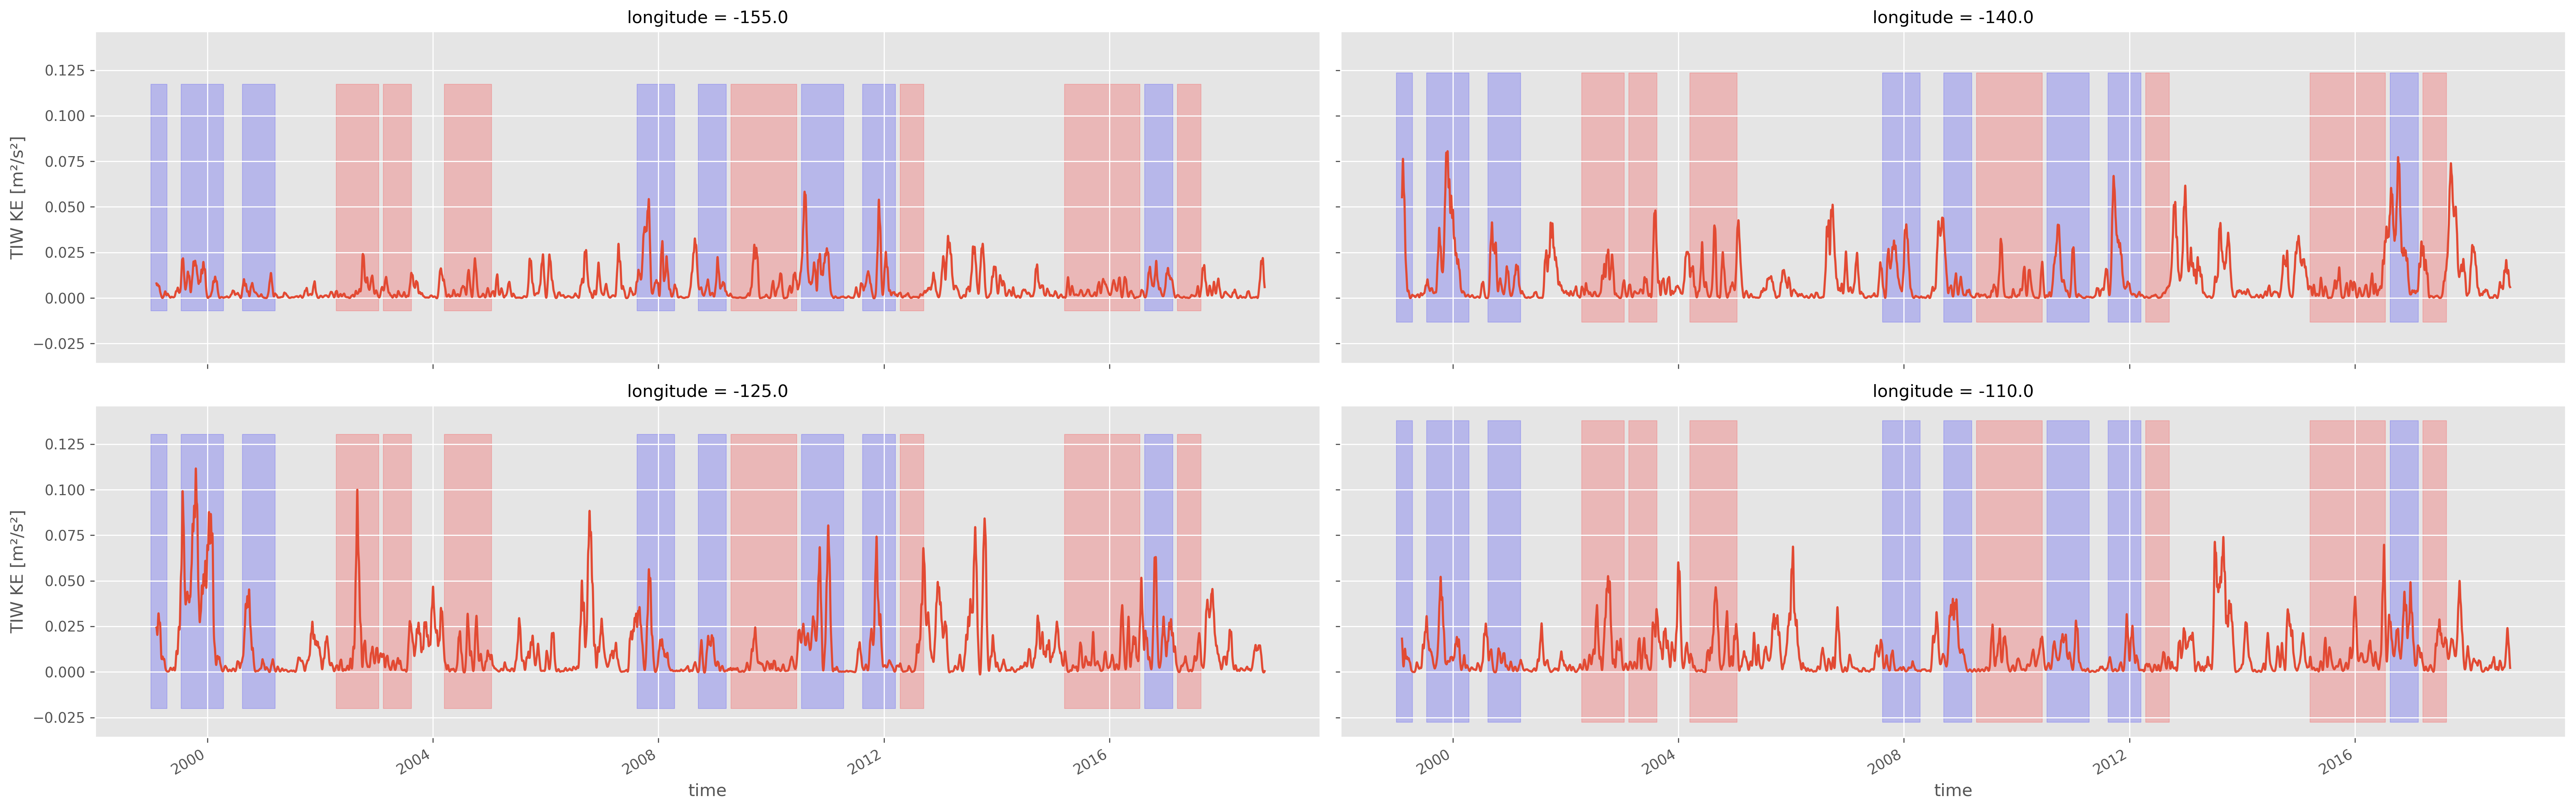
Check ENSO definition vs TIWKE#
fg = tiwke.plot(col="longitude", size=4, aspect=3, col_wrap=2)
[pump.plot.highlight_enso(ax, sections.enso) for ax in fg.axes.flat]
[None, None, None, None]
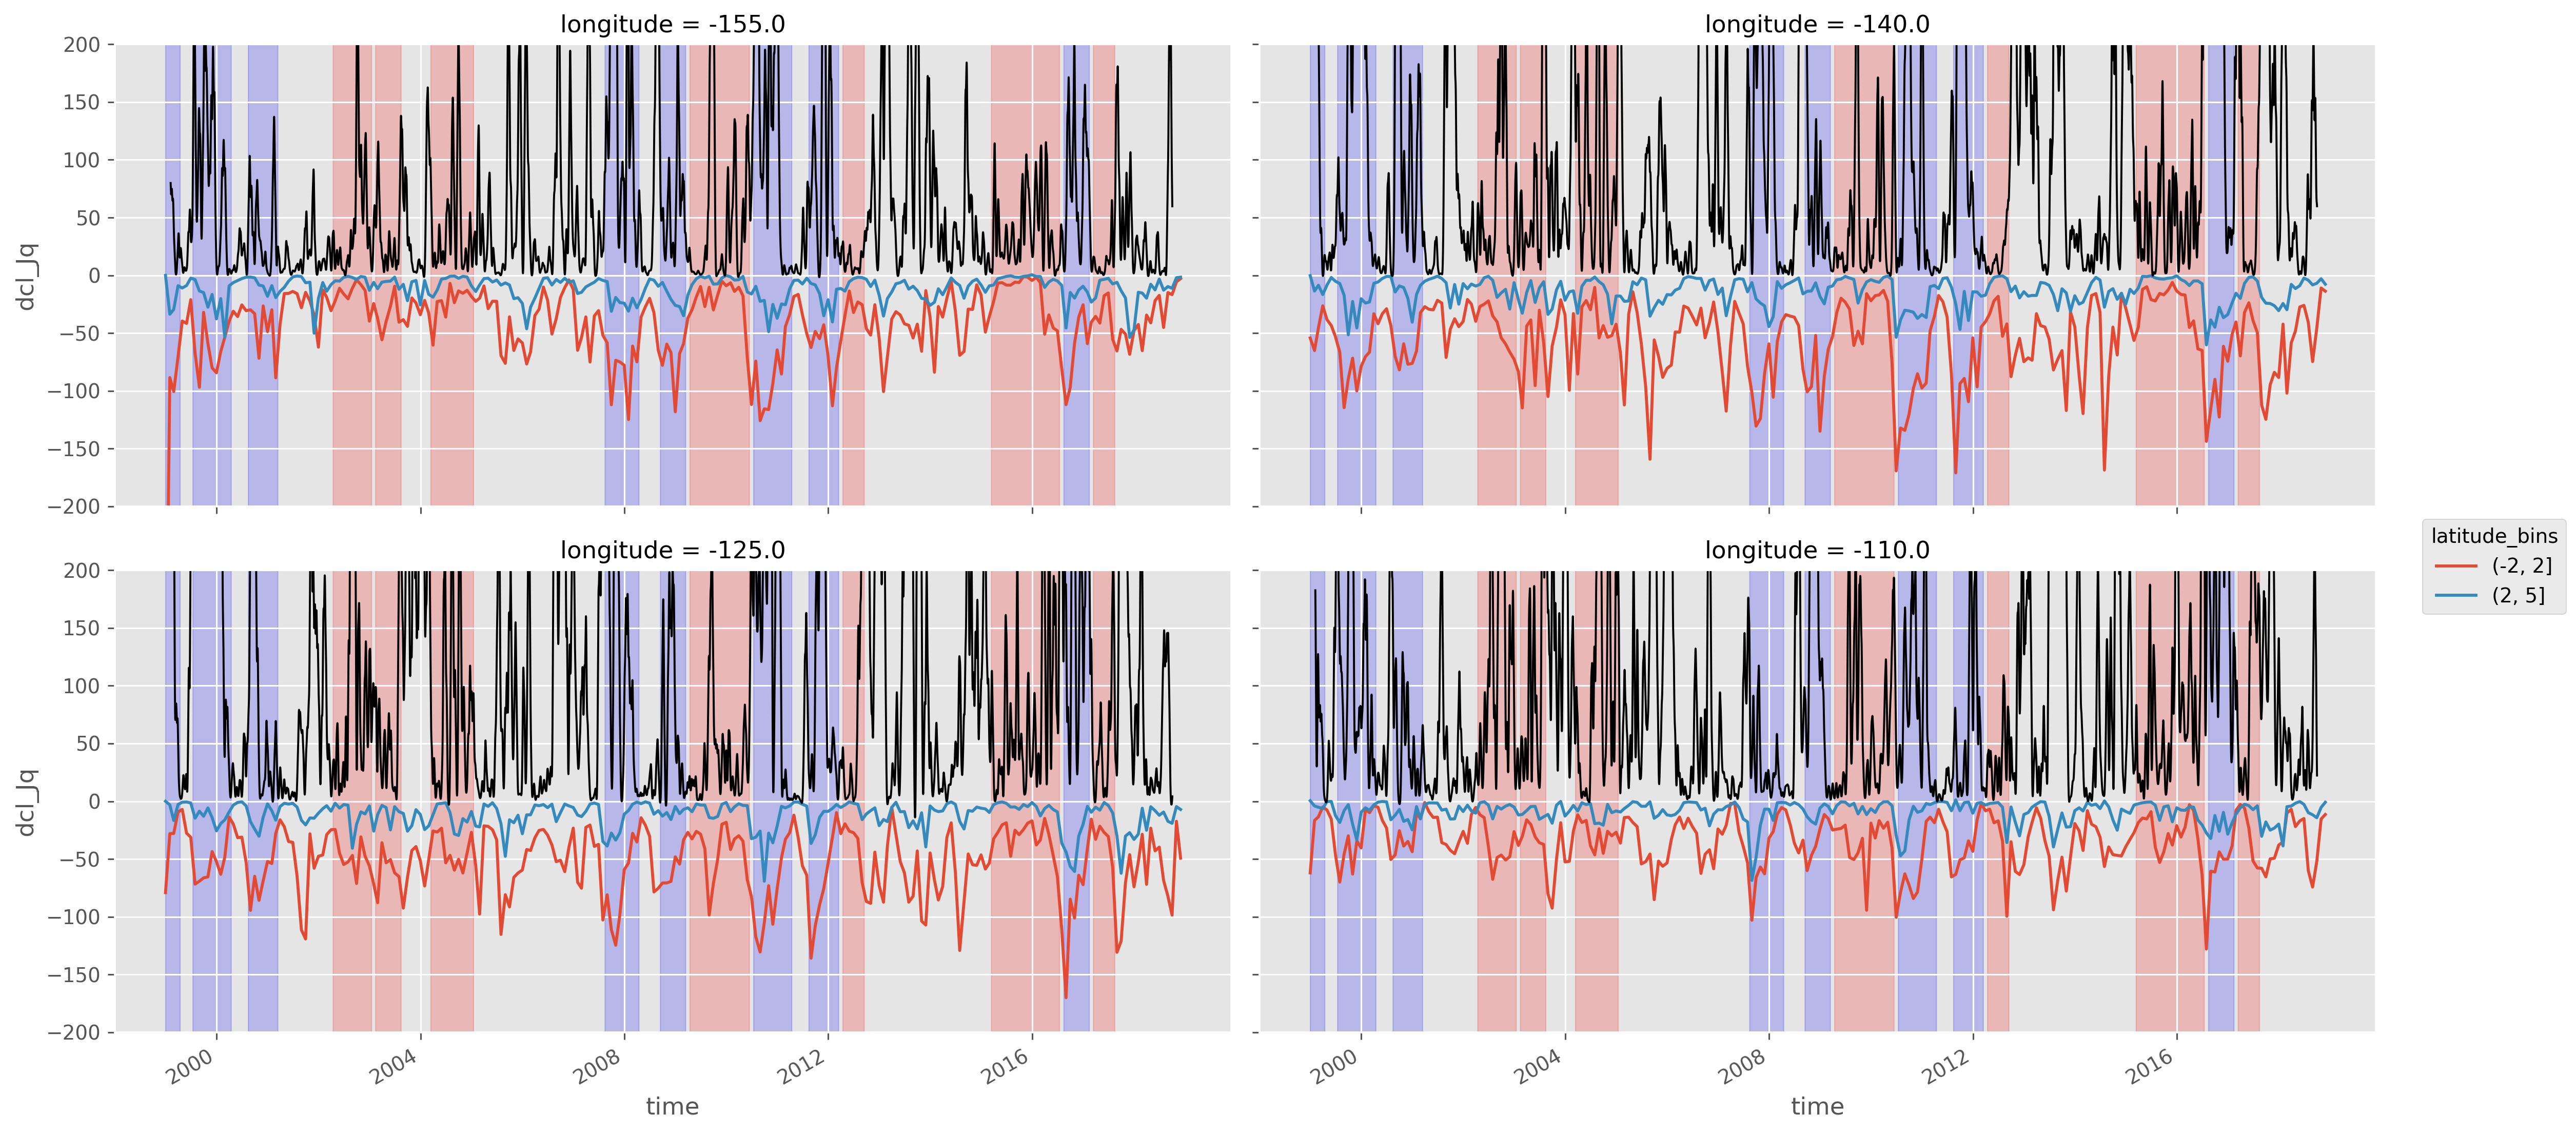
Lat binned Jq_dcl with enso phase, TIW KE#
lat_binned_Jq = sections.dcl_Jq.groupby_bins("latitude", (-2, 2, 5)).mean().compute()
fg = (
    lat_binned_Jq.resample(time="M")
    .mean()
    .plot(
        hue="latitude_bins",
        col="longitude",
        col_wrap=2,
        size=4,
        aspect=2,
        ylim=(-200, 200),
    )
)
for ax, loc in zip(fg.axes.flat, fg.name_dicts.flat):
    (1e4 * tiwke).sel(loc).plot(x="time", ax=ax, color="k", _labels=False, lw=1)
[pump.plot.highlight_enso(ax, sections.enso) for ax in fg.axes.flat]
[None, None, None, None]
Debug metric with period4 TIW#
inconclusive AFAIR
# period4 = xr.open_dataset("/glade/scratch/dcherian/TPOS_MITgcm_1_hb/110w-period-4-with-jq.nc")

period4 = xr.open_zarr(
    "/glade/work/dcherian/pump/zarrs/110w-period-4-4.zarr", consolidated=True
).chunk({"time": 50})
period4
<xarray.Dataset>
Dimensions:    (depth: 200, latitude: 400, longitude: 3, time: 779)
Coordinates:
  * depth      (depth) float32 -0.5 -1.5 -2.5 -3.5 ... -197.5 -198.5 -199.5
  * latitude   (latitude) float32 -10.0 -9.95 -9.9 -9.85 ... 9.85 9.9 9.95 10.0
  * longitude  (longitude) float32 -110.1 -110.0 -110.0
  * time       (time) datetime64[ns] 1995-11-14T17:00:00 ... 1995-12-17T03:00:00
Data variables:
    DFrI_TH    (time, depth, latitude, longitude) float32 dask.array<chunksize=(50, 200, 400, 3), meta=np.ndarray>
    ETAN       (time, latitude, longitude) float32 dask.array<chunksize=(50, 400, 3), meta=np.ndarray>
    Jq         (time, depth, latitude, longitude) float64 dask.array<chunksize=(50, 200, 400, 3), meta=np.ndarray>
    KPPRi      (time, depth, latitude, longitude) float32 dask.array<chunksize=(50, 200, 400, 3), meta=np.ndarray>
    KPPbo      (time, latitude, longitude) float32 dask.array<chunksize=(50, 400, 3), meta=np.ndarray>
    KPPdiffT   (time, depth, latitude, longitude) float32 dask.array<chunksize=(50, 200, 400, 3), meta=np.ndarray>
    KPPg_TH    (time, depth, latitude, longitude) float32 dask.array<chunksize=(50, 200, 400, 3), meta=np.ndarray>
    KPPhbl     (time, latitude, longitude) float32 dask.array<chunksize=(50, 400, 3), meta=np.ndarray>
    KPPviscA   (time, depth, latitude, longitude) float32 dask.array<chunksize=(50, 200, 400, 3), meta=np.ndarray>
    N2         (time, depth, latitude, longitude) float64 dask.array<chunksize=(50, 200, 400, 3), meta=np.ndarray>
    Ri         (time, depth, latitude, longitude) float64 dask.array<chunksize=(50, 200, 400, 3), meta=np.ndarray>
    S2         (time, depth, latitude, longitude) float32 dask.array<chunksize=(50, 200, 400, 3), meta=np.ndarray>
    Um_Diss    (time, depth, latitude, longitude) float32 dask.array<chunksize=(50, 200, 400, 3), meta=np.ndarray>
    VISrI_Um   (time, depth, latitude, longitude) float32 dask.array<chunksize=(50, 200, 400, 3), meta=np.ndarray>
    VISrI_Vm   (time, depth, latitude, longitude) float32 dask.array<chunksize=(50, 200, 400, 3), meta=np.ndarray>
    Vm_Diss    (time, depth, latitude, longitude) float32 dask.array<chunksize=(50, 200, 400, 3), meta=np.ndarray>
    dcl        (time, latitude, longitude) float32 dask.array<chunksize=(50, 400, 3), meta=np.ndarray>
    dcl_base   (time, latitude, longitude) float32 dask.array<chunksize=(50, 400, 3), meta=np.ndarray>
    dens       (time, depth, latitude, longitude) float64 dask.array<chunksize=(50, 200, 400, 3), meta=np.ndarray>
    eucmax     (time, longitude) float64 dask.array<chunksize=(50, 3), meta=np.ndarray>
    mld        (time, latitude, longitude) float32 dask.array<chunksize=(50, 400, 3), meta=np.ndarray>
    salt       (time, depth, latitude, longitude) float32 dask.array<chunksize=(50, 200, 400, 3), meta=np.ndarray>
    shear      (time, depth, latitude, longitude) float32 dask.array<chunksize=(50, 200, 400, 3), meta=np.ndarray>
    shred2     (time, depth, latitude, longitude) float64 dask.array<chunksize=(50, 200, 400, 3), meta=np.ndarray>
    sst        (time, latitude, longitude) float32 dask.array<chunksize=(50, 400, 3), meta=np.ndarray>
    theta      (time, depth, latitude, longitude) float32 dask.array<chunksize=(50, 200, 400, 3), meta=np.ndarray>
    u          (time, depth, latitude, longitude) float32 dask.array<chunksize=(50, 200, 400, 3), meta=np.ndarray>
    uz         (time, depth, latitude, longitude) float32 dask.array<chunksize=(50, 200, 400, 3), meta=np.ndarray>
    v          (time, depth, latitude, longitude) float32 dask.array<chunksize=(50, 200, 400, 3), meta=np.ndarray>
    vz         (time, depth, latitude, longitude) float32 dask.array<chunksize=(50, 200, 400, 3), meta=np.ndarray>
    w          (time, depth, latitude, longitude) float32 dask.array<chunksize=(50, 200, 400, 3), meta=np.ndarray>
Attributes:
    easting:            longitude
    field_julian_date:  400296
    julian_day_unit:    days since 1950-01-01 00:00:00
    northing:           latitude
    title:              daily snapshot from 1/20 degree Equatorial Pacific MI...
xarray.Dataset
- depth: 200
- latitude: 400
- longitude: 3
- time: 779
- depth(depth)float32-0.5 -1.5 -2.5 ... -198.5 -199.5
- units :
- m
array([ -0.5, -1.5, -2.5, -3.5, -4.5, -5.5, -6.5, -7.5, -8.5, -9.5, -10.5, -11.5, -12.5, -13.5, -14.5, -15.5, -16.5, -17.5, -18.5, -19.5, -20.5, -21.5, -22.5, -23.5, -24.5, -25.5, -26.5, -27.5, -28.5, -29.5, -30.5, -31.5, -32.5, -33.5, -34.5, -35.5, -36.5, -37.5, -38.5, -39.5, -40.5, -41.5, -42.5, -43.5, -44.5, -45.5, -46.5, -47.5, -48.5, -49.5, -50.5, -51.5, -52.5, -53.5, -54.5, -55.5, -56.5, -57.5, -58.5, -59.5, -60.5, -61.5, -62.5, -63.5, -64.5, -65.5, -66.5, -67.5, -68.5, -69.5, -70.5, -71.5, -72.5, -73.5, -74.5, -75.5, -76.5, -77.5, -78.5, -79.5, -80.5, -81.5, -82.5, -83.5, -84.5, -85.5, -86.5, -87.5, -88.5, -89.5, -90.5, -91.5, -92.5, -93.5, -94.5, -95.5, -96.5, -97.5, -98.5, -99.5, -100.5, -101.5, -102.5, -103.5, -104.5, -105.5, -106.5, -107.5, -108.5, -109.5, -110.5, -111.5, -112.5, -113.5, -114.5, -115.5, -116.5, -117.5, -118.5, -119.5, -120.5, -121.5, -122.5, -123.5, -124.5, -125.5, -126.5, -127.5, -128.5, -129.5, -130.5, -131.5, -132.5, -133.5, -134.5, -135.5, -136.5, -137.5, -138.5, -139.5, -140.5, -141.5, -142.5, -143.5, -144.5, -145.5, -146.5, -147.5, -148.5, -149.5, -150.5, -151.5, -152.5, -153.5, -154.5, -155.5, -156.5, -157.5, -158.5, -159.5, -160.5, -161.5, -162.5, -163.5, -164.5, -165.5, -166.5, -167.5, -168.5, -169.5, -170.5, -171.5, -172.5, -173.5, -174.5, -175.5, -176.5, -177.5, -178.5, -179.5, -180.5, -181.5, -182.5, -183.5, -184.5, -185.5, -186.5, -187.5, -188.5, -189.5, -190.5, -191.5, -192.5, -193.5, -194.5, -195.5, -196.5, -197.5, -198.5, -199.5], dtype=float32) - latitude(latitude)float32-10.0 -9.95 -9.9 ... 9.9 9.95 10.0
array([-10. , -9.949875, -9.89975 , ..., 9.89975 , 9.949875, 10. ], dtype=float32) - longitude(longitude)float32-110.1 -110.0 -110.0
array([-110.0592 , -110.00916, -109.95913], dtype=float32)
- time(time)datetime64[ns]1995-11-14T17:00:00 ... 1995-12-...
- _CoordinateAxisType :
- Time
- axis :
- T
- long_name :
- Time (hours since 1950-01-01)
- standard_name :
- time
array(['1995-11-14T17:00:00.000000000', '1995-11-14T18:00:00.000000000',
       '1995-11-14T19:00:00.000000000', ..., '1995-12-17T01:00:00.000000000',
       '1995-12-17T02:00:00.000000000', '1995-12-17T03:00:00.000000000'],
      dtype='datetime64[ns]')
- DFrI_TH(time, depth, latitude, longitude)float32dask.array<chunksize=(50, 200, 400, 3), meta=np.ndarray>
Array Chunk Bytes 747.84 MB 48.00 MB Shape (779, 200, 400, 3) (50, 200, 400, 3) Count 796 Tasks 16 Chunks Type float32 numpy.ndarray - ETAN(time, latitude, longitude)float32dask.array<chunksize=(50, 400, 3), meta=np.ndarray>
Array Chunk Bytes 3.74 MB 240.00 kB Shape (779, 400, 3) (50, 400, 3) Count 796 Tasks 16 Chunks Type float32 numpy.ndarray - Jq(time, depth, latitude, longitude)float64dask.array<chunksize=(50, 200, 400, 3), meta=np.ndarray>
- long_name :
- $J^t_q$
- units :
- W/m²
Array Chunk Bytes 1.50 GB 96.00 MB Shape (779, 200, 400, 3) (50, 200, 400, 3) Count 796 Tasks 16 Chunks Type float64 numpy.ndarray - KPPRi(time, depth, latitude, longitude)float32dask.array<chunksize=(50, 200, 400, 3), meta=np.ndarray>
Array Chunk Bytes 747.84 MB 48.00 MB Shape (779, 200, 400, 3) (50, 200, 400, 3) Count 796 Tasks 16 Chunks Type float32 numpy.ndarray - KPPbo(time, latitude, longitude)float32dask.array<chunksize=(50, 400, 3), meta=np.ndarray>
Array Chunk Bytes 3.74 MB 240.00 kB Shape (779, 400, 3) (50, 400, 3) Count 796 Tasks 16 Chunks Type float32 numpy.ndarray - KPPdiffT(time, depth, latitude, longitude)float32dask.array<chunksize=(50, 200, 400, 3), meta=np.ndarray>
Array Chunk Bytes 747.84 MB 48.00 MB Shape (779, 200, 400, 3) (50, 200, 400, 3) Count 796 Tasks 16 Chunks Type float32 numpy.ndarray - KPPg_TH(time, depth, latitude, longitude)float32dask.array<chunksize=(50, 200, 400, 3), meta=np.ndarray>
Array Chunk Bytes 747.84 MB 48.00 MB Shape (779, 200, 400, 3) (50, 200, 400, 3) Count 796 Tasks 16 Chunks Type float32 numpy.ndarray - KPPhbl(time, latitude, longitude)float32dask.array<chunksize=(50, 400, 3), meta=np.ndarray>
Array Chunk Bytes 3.74 MB 240.00 kB Shape (779, 400, 3) (50, 400, 3) Count 796 Tasks 16 Chunks Type float32 numpy.ndarray - KPPviscA(time, depth, latitude, longitude)float32dask.array<chunksize=(50, 200, 400, 3), meta=np.ndarray>
Array Chunk Bytes 747.84 MB 48.00 MB Shape (779, 200, 400, 3) (50, 200, 400, 3) Count 796 Tasks 16 Chunks Type float32 numpy.ndarray - N2(time, depth, latitude, longitude)float64dask.array<chunksize=(50, 200, 400, 3), meta=np.ndarray>
- long_name :
- $N²$
- units :
- $s^{-2}$
Array Chunk Bytes 1.50 GB 96.00 MB Shape (779, 200, 400, 3) (50, 200, 400, 3) Count 796 Tasks 16 Chunks Type float64 numpy.ndarray - Ri(time, depth, latitude, longitude)float64dask.array<chunksize=(50, 200, 400, 3), meta=np.ndarray>
- long_name :
- $Ri$
- units :
Array Chunk Bytes 1.50 GB 96.00 MB Shape (779, 200, 400, 3) (50, 200, 400, 3) Count 796 Tasks 16 Chunks Type float64 numpy.ndarray - S2(time, depth, latitude, longitude)float32dask.array<chunksize=(50, 200, 400, 3), meta=np.ndarray>
- long_name :
- $S²$
- units :
- $s^{-2}$
Array Chunk Bytes 747.84 MB 48.00 MB Shape (779, 200, 400, 3) (50, 200, 400, 3) Count 796 Tasks 16 Chunks Type float32 numpy.ndarray - Um_Diss(time, depth, latitude, longitude)float32dask.array<chunksize=(50, 200, 400, 3), meta=np.ndarray>
Array Chunk Bytes 747.84 MB 48.00 MB Shape (779, 200, 400, 3) (50, 200, 400, 3) Count 796 Tasks 16 Chunks Type float32 numpy.ndarray - VISrI_Um(time, depth, latitude, longitude)float32dask.array<chunksize=(50, 200, 400, 3), meta=np.ndarray>
Array Chunk Bytes 747.84 MB 48.00 MB Shape (779, 200, 400, 3) (50, 200, 400, 3) Count 796 Tasks 16 Chunks Type float32 numpy.ndarray - VISrI_Vm(time, depth, latitude, longitude)float32dask.array<chunksize=(50, 200, 400, 3), meta=np.ndarray>
Array Chunk Bytes 747.84 MB 48.00 MB Shape (779, 200, 400, 3) (50, 200, 400, 3) Count 796 Tasks 16 Chunks Type float32 numpy.ndarray - Vm_Diss(time, depth, latitude, longitude)float32dask.array<chunksize=(50, 200, 400, 3), meta=np.ndarray>
Array Chunk Bytes 747.84 MB 48.00 MB Shape (779, 200, 400, 3) (50, 200, 400, 3) Count 796 Tasks 16 Chunks Type float32 numpy.ndarray - dcl(time, latitude, longitude)float32dask.array<chunksize=(50, 400, 3), meta=np.ndarray>
- description :
- Interpolate density to 1m grid. Search for max depth where |drho| > 0.01 and N2 > 1e-5
- long_name :
- MLD
- units :
- m
Array Chunk Bytes 3.74 MB 240.00 kB Shape (779, 400, 3) (50, 400, 3) Count 796 Tasks 16 Chunks Type float32 numpy.ndarray - dcl_base(time, latitude, longitude)float32dask.array<chunksize=(50, 400, 3), meta=np.ndarray>
- description :
- Deepest depth above EUC where Ri=0.54
- long_name :
- DCL Base (Ri)
- units :
- m
Array Chunk Bytes 3.74 MB 240.00 kB Shape (779, 400, 3) (50, 400, 3) Count 796 Tasks 16 Chunks Type float32 numpy.ndarray - dens(time, depth, latitude, longitude)float64dask.array<chunksize=(50, 200, 400, 3), meta=np.ndarray>
Array Chunk Bytes 1.50 GB 96.00 MB Shape (779, 200, 400, 3) (50, 200, 400, 3) Count 796 Tasks 16 Chunks Type float64 numpy.ndarray - eucmax(time, longitude)float64dask.array<chunksize=(50, 3), meta=np.ndarray>
- long_name :
- Depth of EUC max
- units :
- m
Array Chunk Bytes 18.70 kB 1.20 kB Shape (779, 3) (50, 3) Count 34 Tasks 16 Chunks Type float64 numpy.ndarray - mld(time, latitude, longitude)float32dask.array<chunksize=(50, 400, 3), meta=np.ndarray>
- description :
- Interpolate density to 1m grid. Search for max depth where |drho| > 0.01 and N2 > 1e-5
- long_name :
- MLD
- units :
- m
Array Chunk Bytes 3.74 MB 240.00 kB Shape (779, 400, 3) (50, 400, 3) Count 796 Tasks 16 Chunks Type float32 numpy.ndarray - salt(time, depth, latitude, longitude)float32dask.array<chunksize=(50, 200, 400, 3), meta=np.ndarray>
Array Chunk Bytes 747.84 MB 48.00 MB Shape (779, 200, 400, 3) (50, 200, 400, 3) Count 796 Tasks 16 Chunks Type float32 numpy.ndarray - shear(time, depth, latitude, longitude)float32dask.array<chunksize=(50, 200, 400, 3), meta=np.ndarray>
- long_name :
- |$u_z$|
- units :
- s$^{-1}$
Array Chunk Bytes 747.84 MB 48.00 MB Shape (779, 200, 400, 3) (50, 200, 400, 3) Count 796 Tasks 16 Chunks Type float32 numpy.ndarray - shred2(time, depth, latitude, longitude)float64dask.array<chunksize=(50, 200, 400, 3), meta=np.ndarray>
- long_name :
- Reduced shear$^2$
- units :
- $s^{-2}$
Array Chunk Bytes 1.50 GB 96.00 MB Shape (779, 200, 400, 3) (50, 200, 400, 3) Count 796 Tasks 16 Chunks Type float64 numpy.ndarray - sst(time, latitude, longitude)float32dask.array<chunksize=(50, 400, 3), meta=np.ndarray>
Array Chunk Bytes 3.74 MB 240.00 kB Shape (779, 400, 3) (50, 400, 3) Count 796 Tasks 16 Chunks Type float32 numpy.ndarray - theta(time, depth, latitude, longitude)float32dask.array<chunksize=(50, 200, 400, 3), meta=np.ndarray>
Array Chunk Bytes 747.84 MB 48.00 MB Shape (779, 200, 400, 3) (50, 200, 400, 3) Count 796 Tasks 16 Chunks Type float32 numpy.ndarray - u(time, depth, latitude, longitude)float32dask.array<chunksize=(50, 200, 400, 3), meta=np.ndarray>
Array Chunk Bytes 747.84 MB 48.00 MB Shape (779, 200, 400, 3) (50, 200, 400, 3) Count 796 Tasks 16 Chunks Type float32 numpy.ndarray - uz(time, depth, latitude, longitude)float32dask.array<chunksize=(50, 200, 400, 3), meta=np.ndarray>
Array Chunk Bytes 747.84 MB 48.00 MB Shape (779, 200, 400, 3) (50, 200, 400, 3) Count 796 Tasks 16 Chunks Type float32 numpy.ndarray - v(time, depth, latitude, longitude)float32dask.array<chunksize=(50, 200, 400, 3), meta=np.ndarray>
Array Chunk Bytes 747.84 MB 48.00 MB Shape (779, 200, 400, 3) (50, 200, 400, 3) Count 796 Tasks 16 Chunks Type float32 numpy.ndarray - vz(time, depth, latitude, longitude)float32dask.array<chunksize=(50, 200, 400, 3), meta=np.ndarray>
Array Chunk Bytes 747.84 MB 48.00 MB Shape (779, 200, 400, 3) (50, 200, 400, 3) Count 796 Tasks 16 Chunks Type float32 numpy.ndarray - w(time, depth, latitude, longitude)float32dask.array<chunksize=(50, 200, 400, 3), meta=np.ndarray>
Array Chunk Bytes 747.84 MB 48.00 MB Shape (779, 200, 400, 3) (50, 200, 400, 3) Count 796 Tasks 16 Chunks Type float32 numpy.ndarray
- easting :
- longitude
- field_julian_date :
- 400296
- julian_day_unit :
- days since 1950-01-01 00:00:00
- northing :
- latitude
- title :
- daily snapshot from 1/20 degree Equatorial Pacific MITgcm simulation
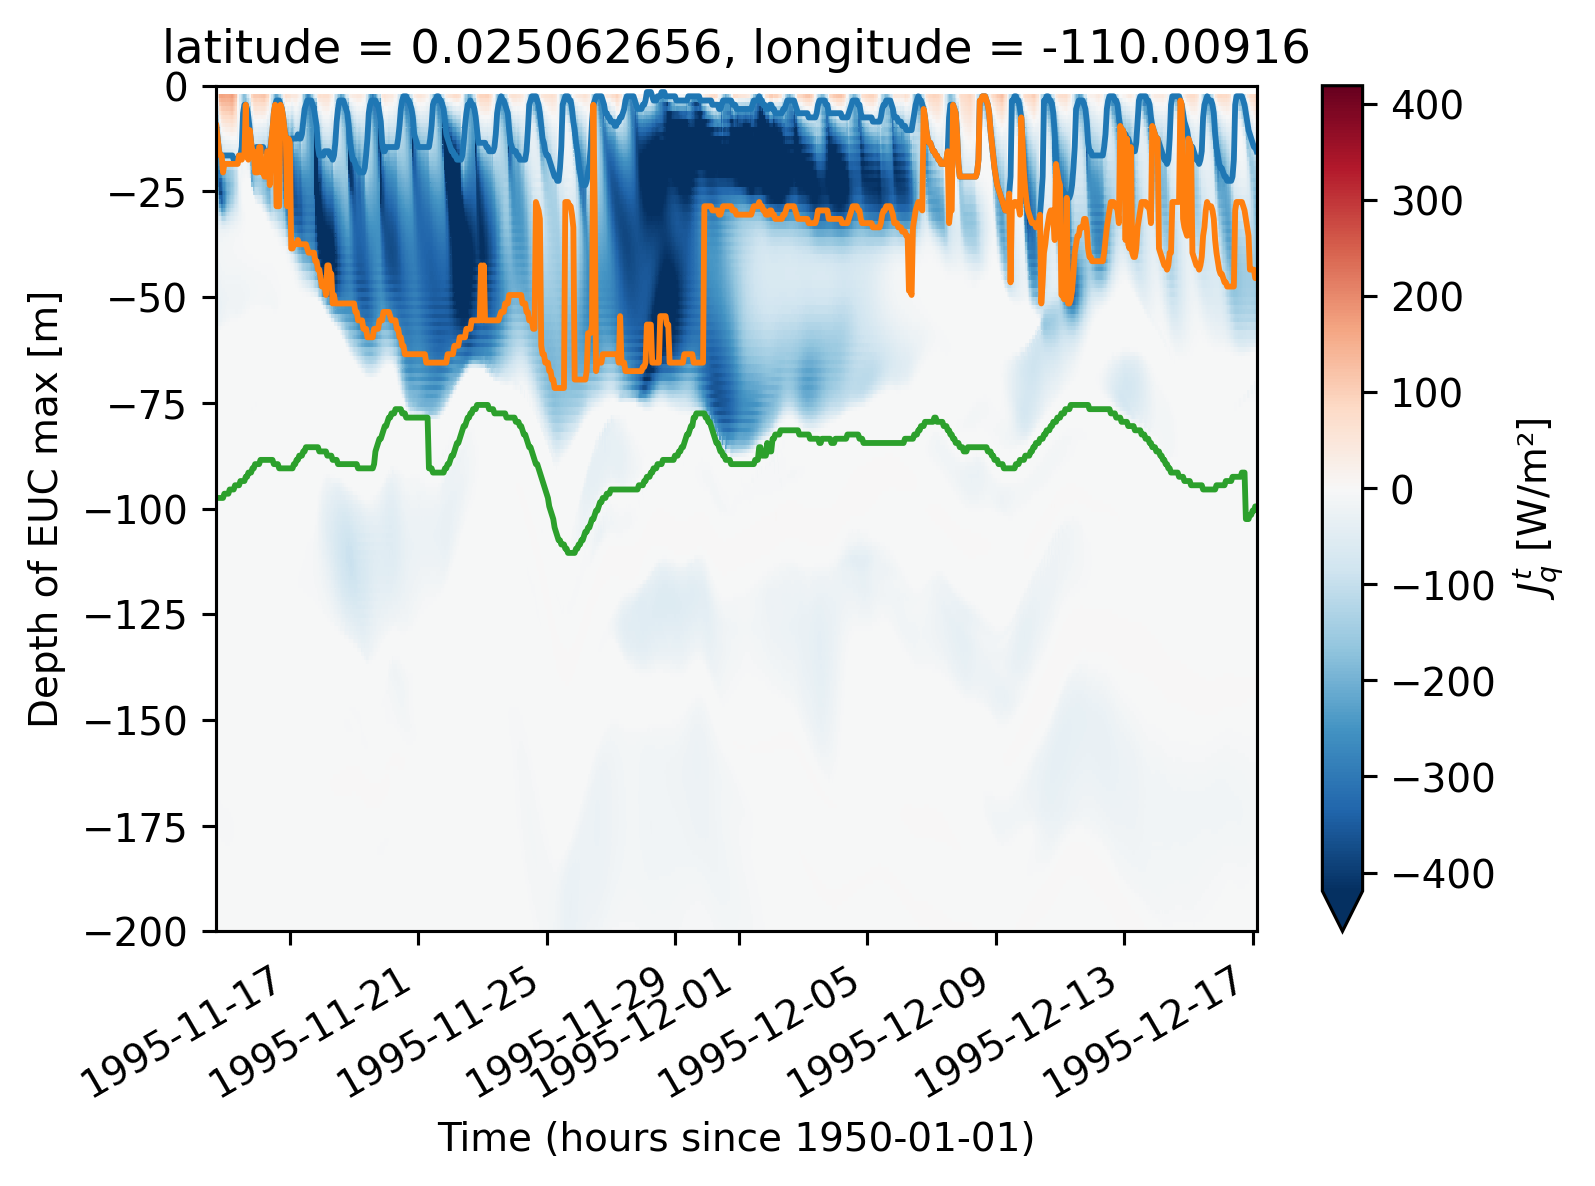
Heat flux & divergence#
subset = period4.isel(longitude=1).sel(latitude=0, method="nearest")

(subset.Jq.rolling(depth=2).mean().compute()).plot(x="time", robust=True)
subset.mld.plot()
subset.dcl_base.plot()
subset.eucmax.plot()
[<matplotlib.lines.Line2D at 0x2b2da959fe50>]
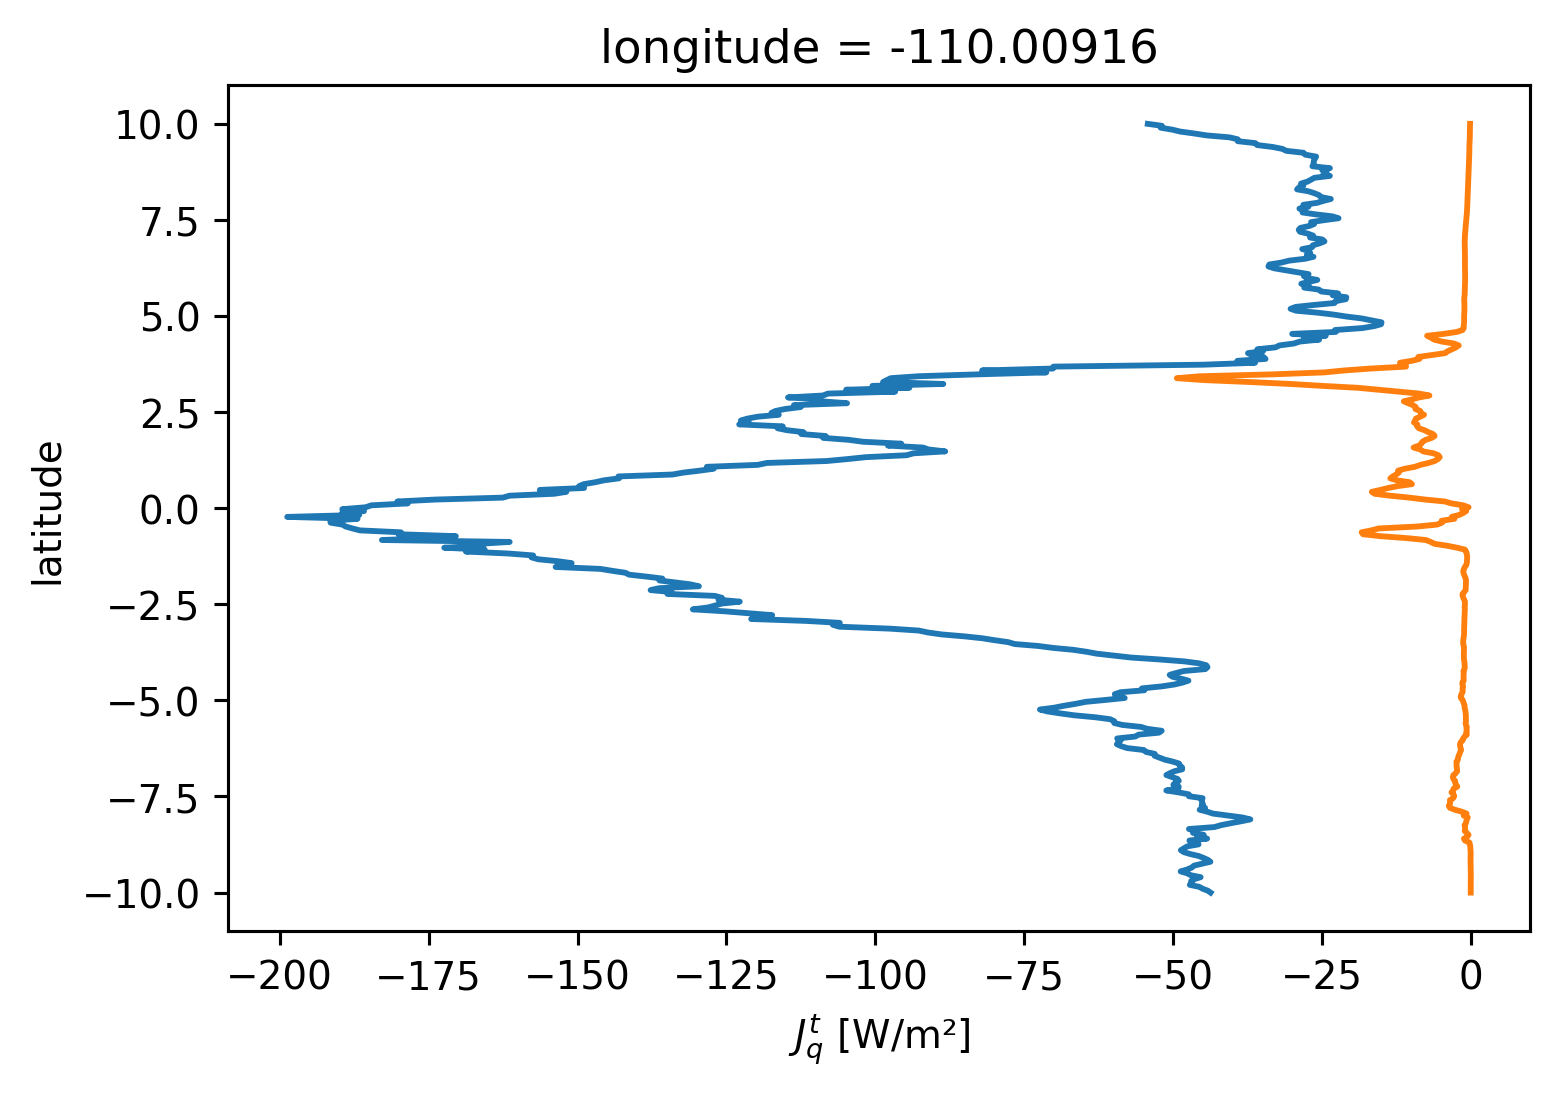
subset = period4.isel(longitude=1)
subset.Jq.sel(depth=subset.mld).mean("time").plot(y="latitude")
subset.Jq.sel(depth=subset.eucmax).mean("time").plot(y="latitude")
[<matplotlib.lines.Line2D at 0x2b2daa2dc310>]
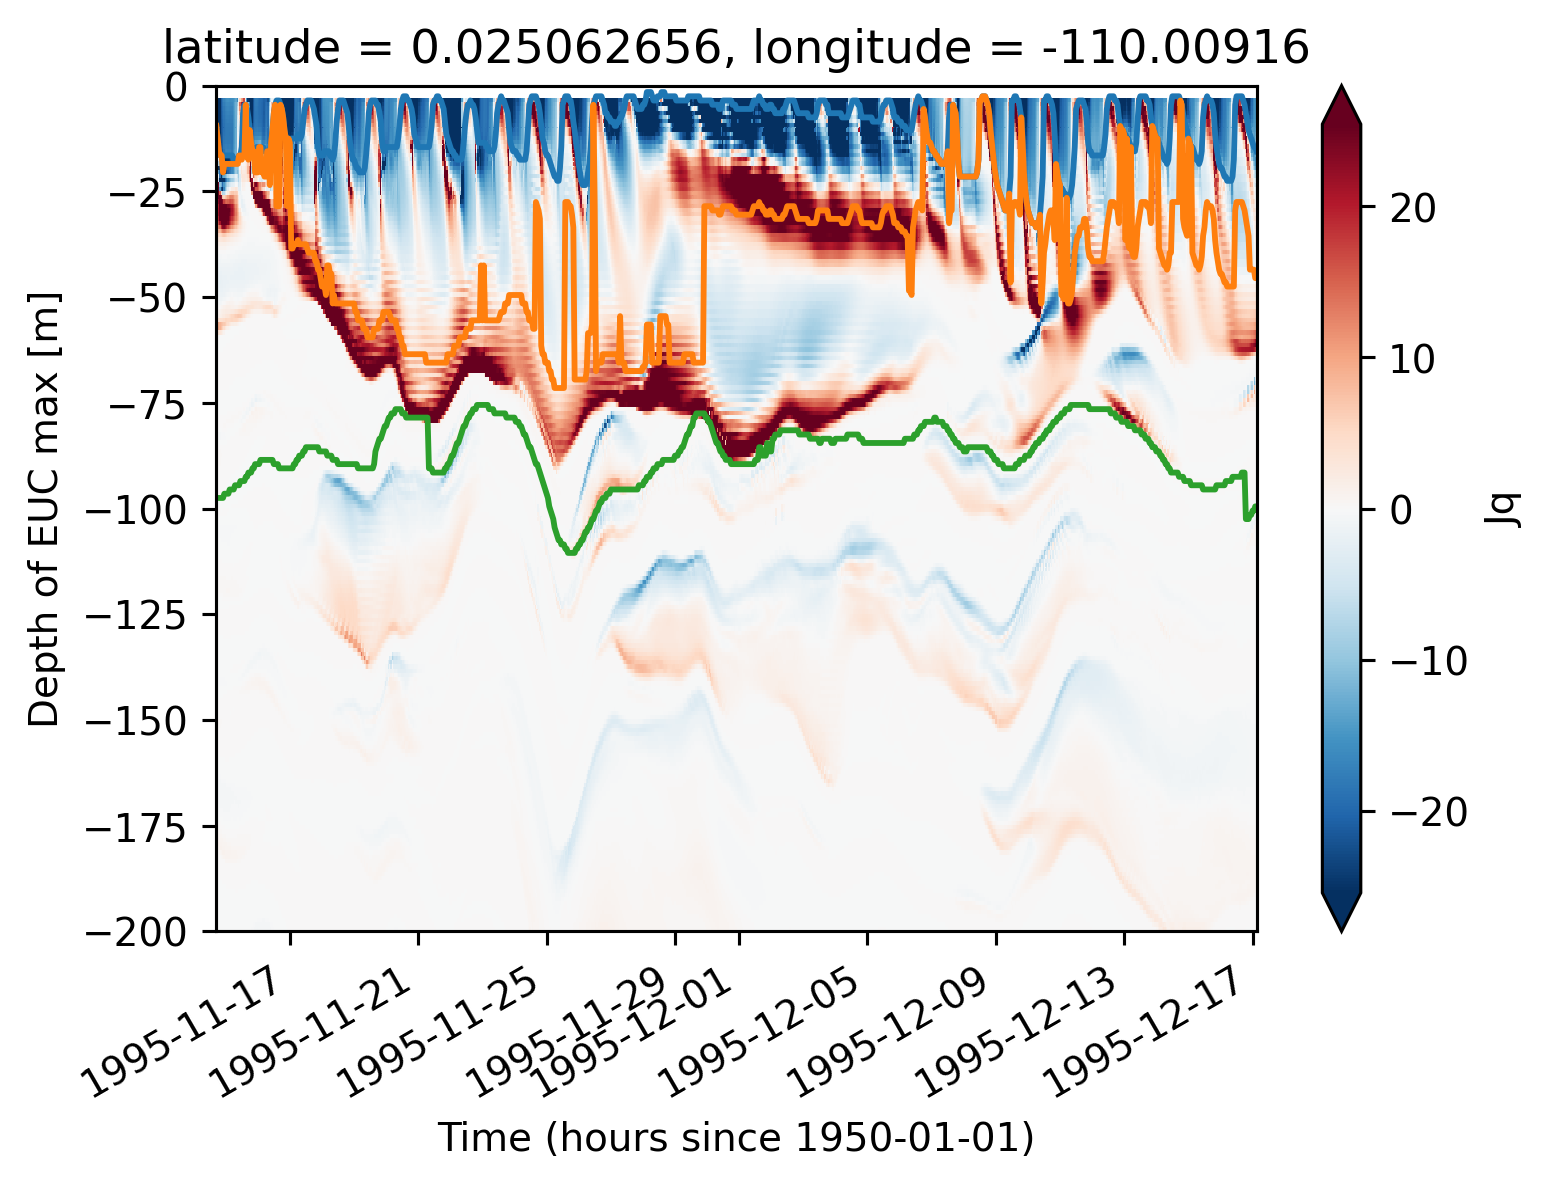
subset = period4.isel(longitude=1).sel(latitude=0, method="nearest")

dJdz = -1 * subset.Jq.rolling(depth=2).mean().compute().differentiate("depth")

dJdz.plot(x="time", robust=True)
subset.mld.plot()
subset.dcl_base.plot()
subset.eucmax.plot()
[<matplotlib.lines.Line2D at 0x2b2db2ec3c10>]
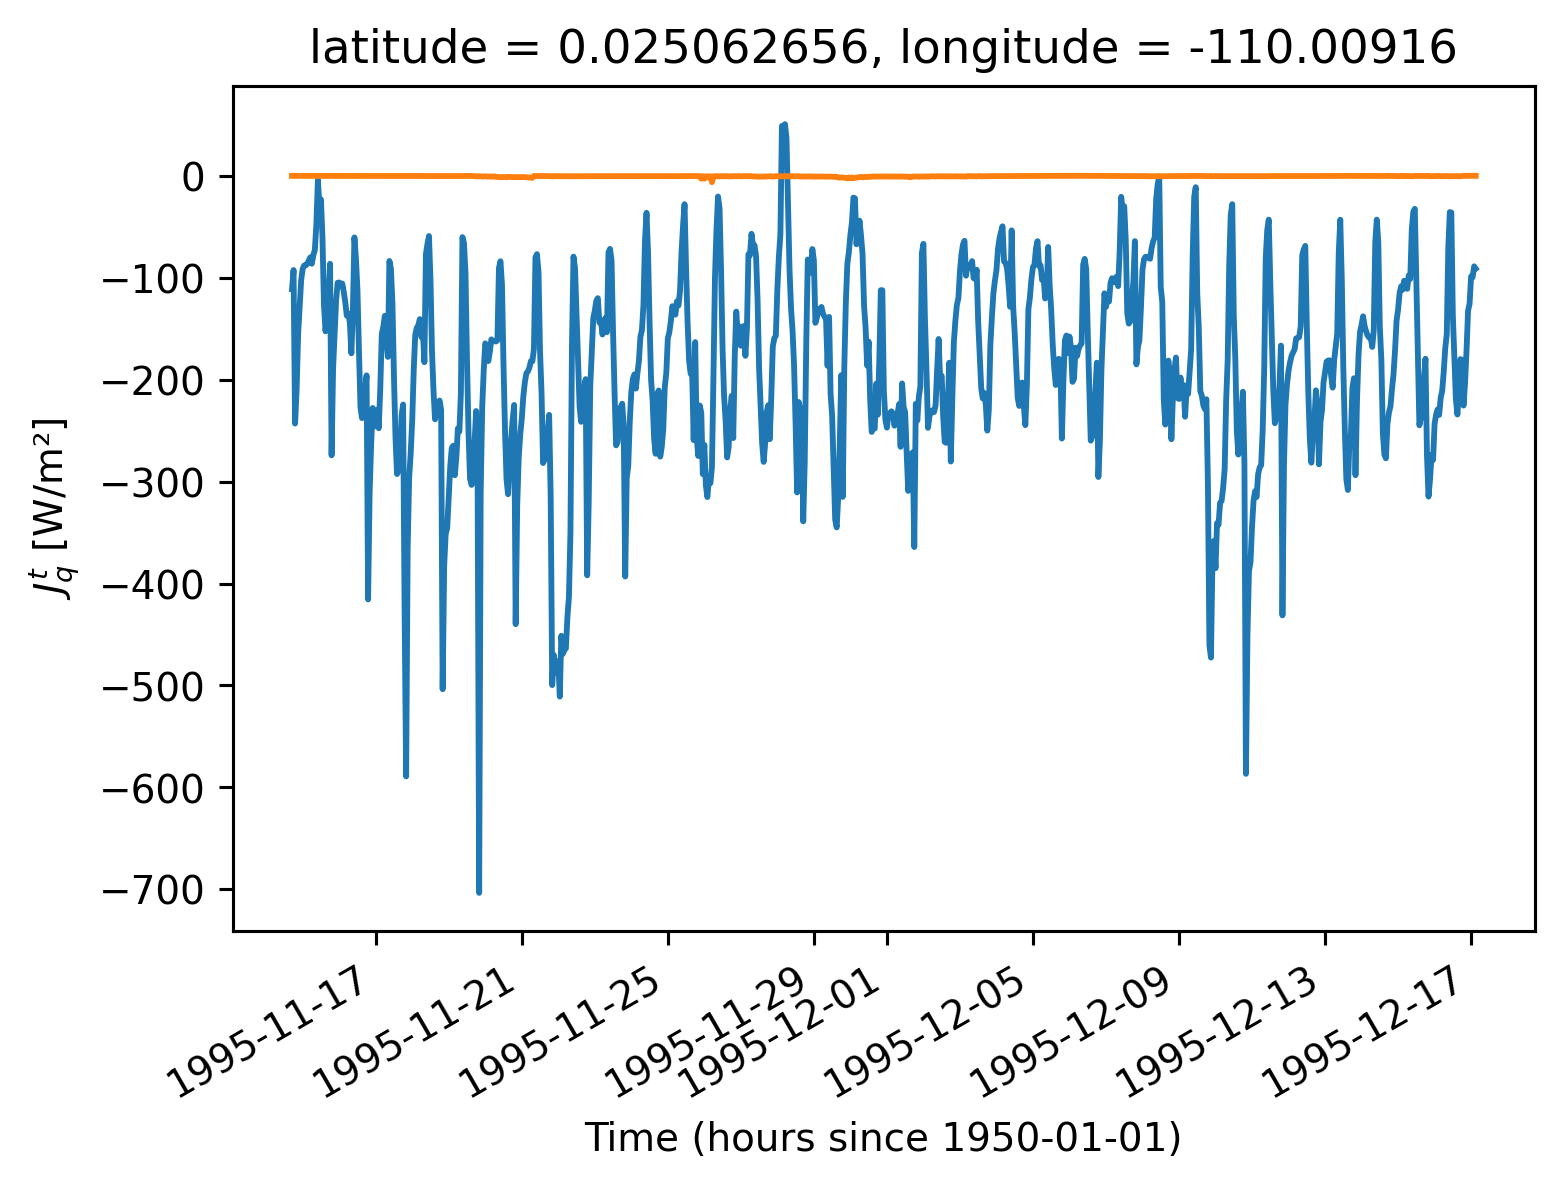
subset.Jq.sel(depth=subset.mld).plot()
# subset.Jq.sel(depth = subset.dcl_base).plot()
subset.Jq.sel(depth=subset.eucmax).plot()
[<matplotlib.lines.Line2D at 0x2b2daa2928e0>]
sections["Jq_mld"] = sections.Jq.sel(depth=sections.mld)
sections["Jq_mld"].to_netcdf("Jq_mld_sections.nc")
sections["Jq_mld"].groupby(sections.enso).mean("time").plot(
    hue="enso", col="longitude", y="latitude"
)
<xarray.plot.facetgrid.FacetGrid at 0x2b4e4c1b3700>
sections["Jq_mld"].load()
<xarray.DataArray 'Jq_mld' (time: 174000, longitude: 4, latitude: 37)>
array([[[            nan,             nan,             nan, ...,
                     nan,             nan,             nan],
        [            nan,             nan,             nan, ...,
                     nan,             nan,             nan],
        [-1.03868298e+02, -9.28047124e+01, -9.99855702e+01, ...,
         -9.77457590e-03, -5.46678154e-03, -1.31514762e-02],
        [-1.00227533e+02, -1.11465126e+02, -1.13720828e+02, ...,
          2.00975608e-02,  3.01864413e-03,  6.58229011e-03]],

       [[            nan,             nan,             nan, ...,
                     nan,             nan,             nan],
        [            nan,             nan,             nan, ...,
                     nan,             nan,             nan],
        [-1.35672958e+02, -1.31546214e+02, -2.72644760e+02, ...,
         -1.07197526e+01, -4.62216833e+00, -1.57760598e-02],
        [-1.38687687e+02, -2.02954585e+02, -2.14228750e+02, ...,
          3.73455863e-02,  2.04356325e-02,  3.12642052e-02]],

       [[            nan,             nan,             nan, ...,
                     nan,             nan,             nan],
...
        [-1.35402024e+02, -1.63813413e+02, -1.59360881e+02, ...,
         -6.39950970e+01, -5.33501704e+01, -6.75277379e+01]],

       [[            nan,             nan,             nan, ...,
                     nan,             nan,             nan],
        [            nan,             nan,             nan, ...,
                     nan,             nan,             nan],
        [-1.81391421e+02, -2.11108676e+02, -1.70734973e+02, ...,
         -1.60332500e+00, -2.67643897e+02, -2.43871351e+02],
        [-4.73042316e-01, -3.66597133e+02, -3.58837630e+02, ...,
         -9.48874752e+01, -7.65177667e+01, -8.04016605e+01]],

       [[            nan,             nan,             nan, ...,
                     nan,             nan,             nan],
        [            nan,             nan,             nan, ...,
                     nan,             nan,             nan],
        [-4.74883680e+02, -3.78872528e+02,  1.76388468e-01, ...,
         -7.78753898e+00, -1.49216702e+02, -8.76803926e+01],
        [-6.13561940e+01, -1.10279850e+02, -1.28682563e+02, ...,
         -5.74036643e+01, -5.34922762e+01, -4.18560529e+01]]])
Coordinates:
  * longitude  (longitude) float64 -155.0 -140.0 -125.0 -110.0
  * latitude   (latitude) float64 -3.025 -2.775 -2.525 ... 5.475 5.725 5.975
  * time       (time) datetime64[ns] 1998-12-31T18:00:00 ... 2018-11-06T17:00:00
xarray.DataArray
'Jq_mld'
- time: 174000
- longitude: 4
- latitude: 37
- nan nan nan nan nan nan ... 8.612 -77.12 -50.13 -57.4 -53.49 -41.86
array([[[ nan, nan, nan, ..., nan, nan, nan], [ nan, nan, nan, ..., nan, nan, nan], [-1.03868298e+02, -9.28047124e+01, -9.99855702e+01, ..., -9.77457590e-03, -5.46678154e-03, -1.31514762e-02], [-1.00227533e+02, -1.11465126e+02, -1.13720828e+02, ..., 2.00975608e-02, 3.01864413e-03, 6.58229011e-03]], [[ nan, nan, nan, ..., nan, nan, nan], [ nan, nan, nan, ..., nan, nan, nan], [-1.35672958e+02, -1.31546214e+02, -2.72644760e+02, ..., -1.07197526e+01, -4.62216833e+00, -1.57760598e-02], [-1.38687687e+02, -2.02954585e+02, -2.14228750e+02, ..., 3.73455863e-02, 2.04356325e-02, 3.12642052e-02]], [[ nan, nan, nan, ..., nan, nan, nan], ... [-1.35402024e+02, -1.63813413e+02, -1.59360881e+02, ..., -6.39950970e+01, -5.33501704e+01, -6.75277379e+01]], [[ nan, nan, nan, ..., nan, nan, nan], [ nan, nan, nan, ..., nan, nan, nan], [-1.81391421e+02, -2.11108676e+02, -1.70734973e+02, ..., -1.60332500e+00, -2.67643897e+02, -2.43871351e+02], [-4.73042316e-01, -3.66597133e+02, -3.58837630e+02, ..., -9.48874752e+01, -7.65177667e+01, -8.04016605e+01]], [[ nan, nan, nan, ..., nan, nan, nan], [ nan, nan, nan, ..., nan, nan, nan], [-4.74883680e+02, -3.78872528e+02, 1.76388468e-01, ..., -7.78753898e+00, -1.49216702e+02, -8.76803926e+01], [-6.13561940e+01, -1.10279850e+02, -1.28682563e+02, ..., -5.74036643e+01, -5.34922762e+01, -4.18560529e+01]]]) - longitude(longitude)float64-155.0 -140.0 -125.0 -110.0
array([-155.024994, -140.024994, -125.025002, -110.025002])
- latitude(latitude)float64-3.025 -2.775 ... 5.725 5.975
array([-3.025, -2.775, -2.525, -2.275, -2.025, -1.775, -1.525, -1.275, -1.025, -0.775, -0.525, -0.275, -0.025, 0.225, 0.475, 0.725, 0.975, 1.225, 1.475, 1.725, 1.975, 2.225, 2.475, 2.725, 2.975, 3.225, 3.475, 3.725, 3.975, 4.225, 4.475, 4.725, 4.975, 5.225, 5.475, 5.725, 5.975]) - time(time)datetime64[ns]1998-12-31T18:00:00 ... 2018-11-...
array(['1998-12-31T18:00:00.000000000', '1998-12-31T19:00:00.000000000',
       '1998-12-31T20:00:00.000000000', ..., '2018-11-06T15:00:32.000000000',
       '2018-11-06T16:00:16.000000000', '2018-11-06T17:00:00.000000000'],
      dtype='datetime64[ns]')
plt.figure()
plt.plot(sections.time, sections.enso)
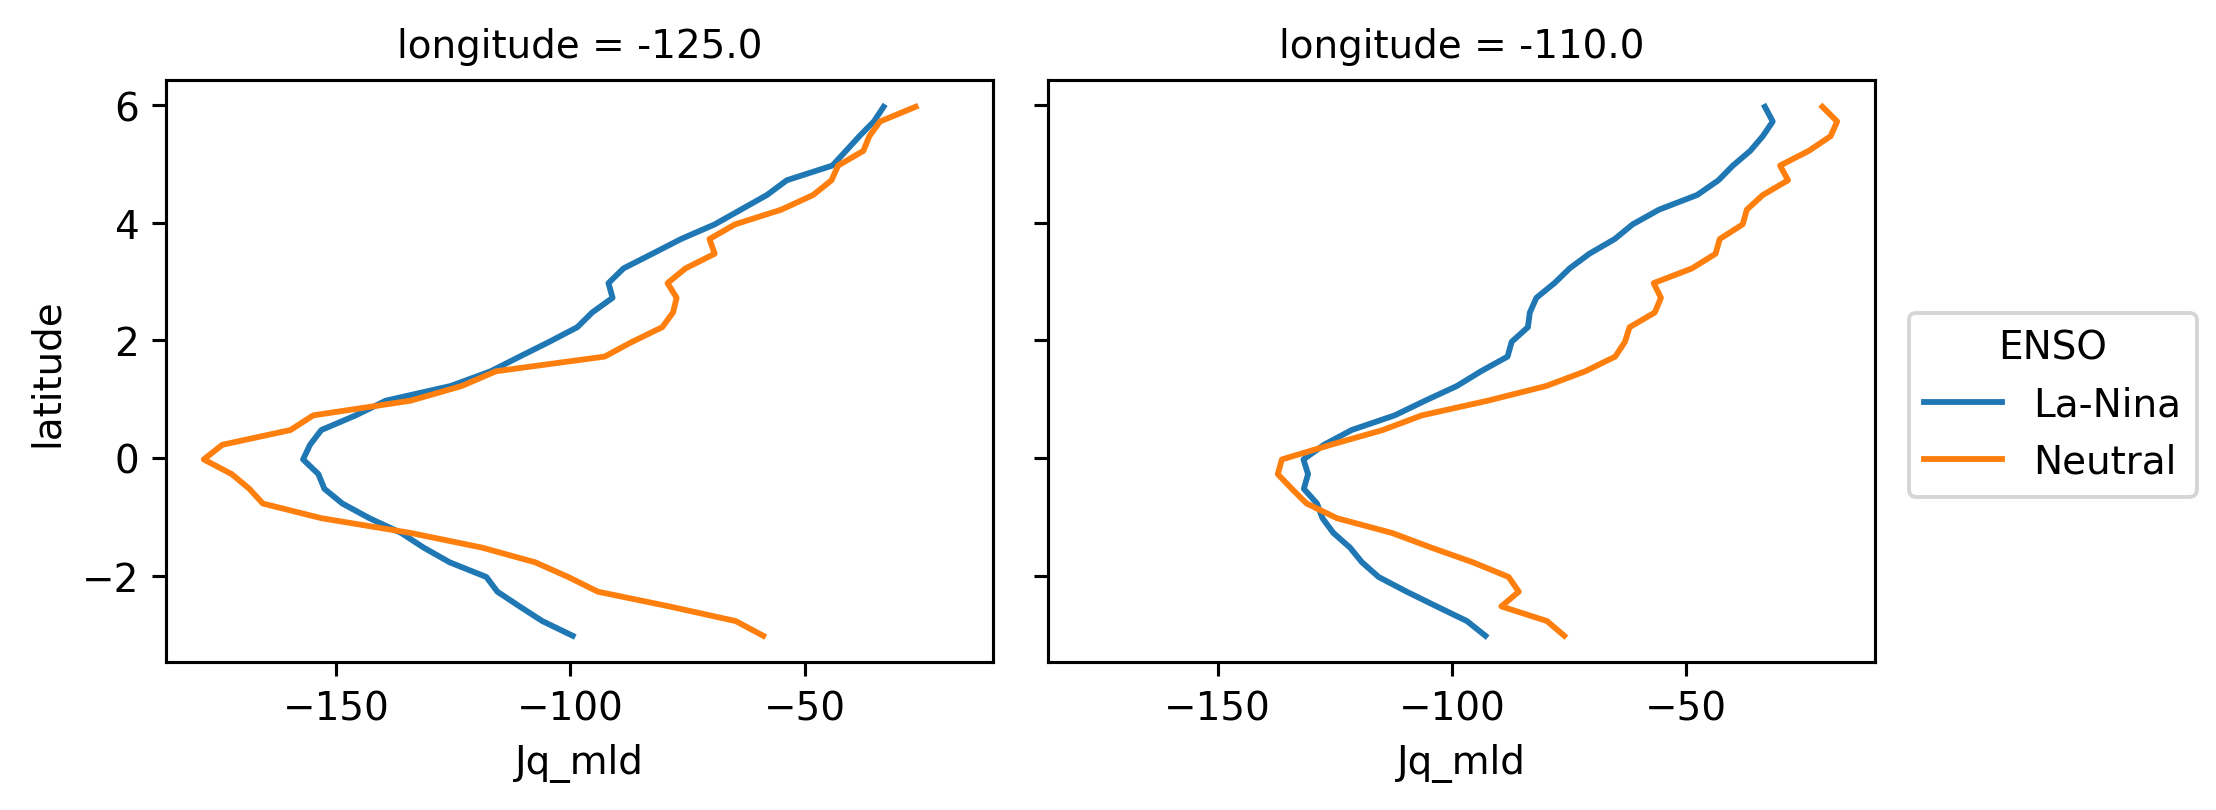
(
    sections.Jq_mld.sel(longitude=[-125, -110], method="nearest")
    .groupby(enso)
    .mean("time")
    .plot(y="latitude", col="longitude", hue="ENSO")
)
<xarray.plot.facetgrid.FacetGrid at 0x2b2d8dbaf520>
sections.dcl_Jq.load()
sections["dcl_Jq"].groupby(sections.enso).mean("time").sel(
    longitude=-110, method="nearest"
).plot(hue="enso", y="latitude")
[<matplotlib.lines.Line2D at 0x2b69c0884610>,
 <matplotlib.lines.Line2D at 0x2b69c0884580>,
 <matplotlib.lines.Line2D at 0x2b69c08840a0>]