TIW Compositing#
load data#
%load_ext autoreload
# %autoreload 2

%matplotlib inline

import dask
import matplotlib as mpl
import matplotlib.pyplot as plt
import numpy as np
import seawater as sw

%aimport xarray
import xarray as xr

# import hvplot.xarray

%aimport dcpy
%aimport pump

# import facetgrid

mpl.rcParams["savefig.dpi"] = 300
mpl.rcParams["savefig.bbox"] = "tight"
mpl.rcParams["figure.dpi"] = 120

xr.set_options(keep_attrs=False)

import distributed
import dask_jobqueue

from distributed import performance_report

print(dask.__version__)
print(distributed.__version__)
print(xr.__version__)
The autoreload extension is already loaded. To reload it, use:
  %reload_ext autoreload
2.9.1
2.9.1
0.14.0+145.ga834dde4
if "client" in locals():
    client.close()
    cluster.close()

env = {"OMP_NUM_THREADS": "3", "NUMBA_NUM_THREADS": "3"}
cluster = distributed.LocalCluster(n_workers=12, threads_per_worker=1, env=env)
# cluster = dask_jobqueue.SLURMCluster(
#    cores=1, processes=1, memory="25GB", walltime="02:00:00", project="NCGD0011"
# )
# cluster = dask_jobqueue.PBSCluster(
#    cores=9, processes=9, memory="108GB", walltime="02:00:00", project="NCGD0043",
#    env_extra=env,
# )

client = distributed.Client(cluster)
cluster
# cluster.adapt(minimum_jobs=1, maximum_jobs=12, wait_count=300)
gcm1 = pump.model(
    "../glade/TPOS_MITgcm_1_hb/HOLD_NC_LINKS/",
    name="gcm1",
    full=True,
    budget=False,
)
# gcm1.tao.load()
# gcm1.tao = xr.merge([gcm1.tao, pump.calc.get_tiw_phase(gcm1.tao.v)])
gcm1.surface["zeta"] = xr.open_dataset(gcm1.dirname + "obs_subset/surface_zeta.nc").zeta
# gcm1.surface = gcm1.surface.chunk({"time": 1})
# gcm1.surface["zeta"] = gcm1.surface.v.differentiate("longitude") - gcm1.surface.u.differentiate("latitude")
Reading all files took 53.975971937179565 seconds
gcm1.tao["mld"] = pump.calc.get_mld(gcm1.tao.dens)
gcm1.tao["dcl"] = pump.calc.get_dcl_base_Ri(gcm1.tao)
remake surface file#
ds = xr.open_mfdataset(
    "../glade/TPOS_MITgcm_1_hb/HOLD/Day_[0-9][0-9][0-9][0-9].nc",
    engine="h5netcdf",
    coords="minimal",
    compat="override",
    combine="by_coords",
    chunks={"depth": 1},
    parallel=True,
)
ds = ds.chunk({"depth": 1, "time": 24})
surface = ds.isel(depth=0)
surface.load()
<xarray.Dataset>
Dimensions:          (latitude: 480, longitude: 1500, time: 2947)
Coordinates:
  * latitude         (latitude) float32 -12.0 -11.949896 ... 11.949896 12.0
    depth            float32 -0.5
  * longitude        (longitude) float32 -170.0 -169.94997 ... -95.05003 -95.0
  * time             (time) datetime64[ns] 1995-09-01 ... 1997-01-04T12:00:00
Data variables:
    theta            (time, latitude, longitude) float32 28.838287 ... 27.546913
    u                (time, latitude, longitude) float32 -0.2352903 ... 0.06463741
    v                (time, latitude, longitude) float32 -0.05014921 ... -0.013393667
    w                (time, latitude, longitude) float32 nan nan nan ... nan nan
    salt             (time, latitude, longitude) float32 34.7925 ... 33.598953
    KPP_diffusivity  (time, latitude, longitude) float32 nan nan nan ... nan nan
Attributes:
    title:              daily snapshot from 1/20 degree Equatorial Pacific MI...
    easting:            longitude
    northing:           latitude
    field_julian_date:  400296
    julian_day_unit:    days since 1950-01-01 00:00:00
import xfilter

filt = xfilter.lowpass(
    gcm1.tao.v,
    coord="time",
    freq=1 / 10,
    cycles_per="D",
    num_discard=0,
)
surface.to_netcdf("../glade/TPOS_MITgcm_1_hb/HOLD/obs_subset/surface.nc")
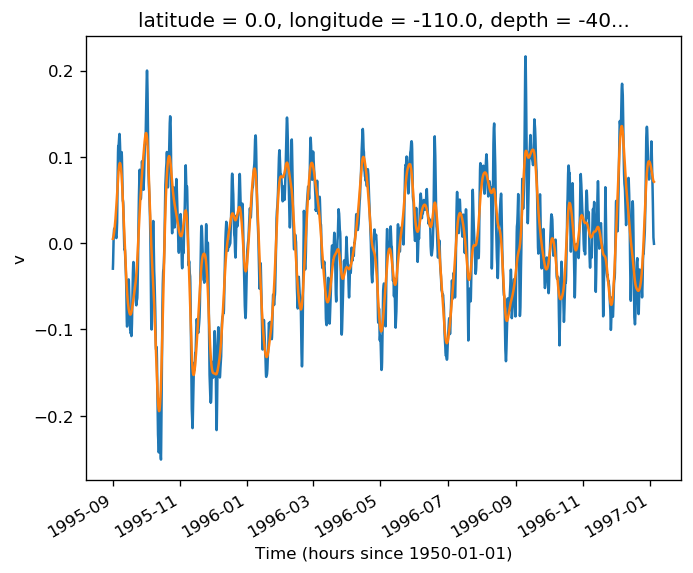
gcm1.tao.v.sel(longitude=-110, method="nearest").isel(latitude=3, depth=-5).plot()
filt.sel(longitude=-110, method="nearest").isel(latitude=3, depth=-5).plot()
[<matplotlib.lines.Line2D at 0x2b5e3928d2e8>]
gcm1.surface = gcm1.surface.chunk({"time": 100})
gcm1.surface["zeta"] = gcm1.surface.v.differentiate(
    "longitude"
) - gcm1.surface.u.differentiate("latitude")
gcm1.surface.zeta.to_netcdf(gcm1.dirname + "/obs_subset/surface_zeta.nc")
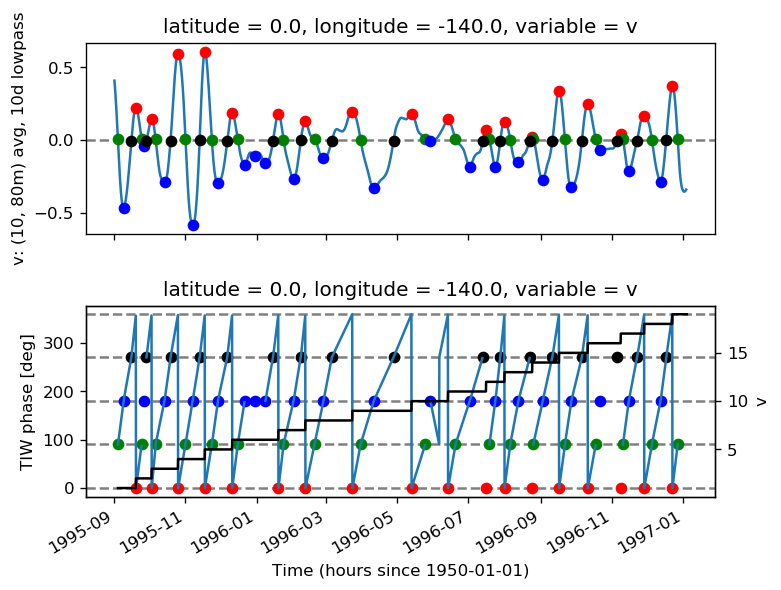
tao0140 = gcm1.tao.sel(latitude=0, longitude=-140)
tao0140 = xr.merge([pump.calc.get_tiw_phase(tao0140.v), tao0140])
surf140 = gcm1.surface.sel(
    longitude=-140, method="nearest"
)  # .sel(time=slice(None, "1996-01-01"))

pump.calc.get_tiw_phase(tao0140.v, debug=True)
/glade/u/home/dcherian/pump/pump/calc.py:359: UserWarning: Secondary peaks detected!
  warnings.warn("Secondary peaks detected!")
/glade/u/home/dcherian/miniconda3/envs/dcpy/lib/python3.6/site-packages/pandas/plotting/_matplotlib/converter.py:103: FutureWarning: Using an implicitly registered datetime converter for a matplotlib plotting method. The converter was registered by pandas on import. Future versions of pandas will require you to explicitly register matplotlib converters.

To register the converters:
	>>> from pandas.plotting import register_matplotlib_converters
	>>> register_matplotlib_converters()
  warnings.warn(msg, FutureWarning)
/glade/u/home/dcherian/pump/pump/calc.py:359: UserWarning: Secondary peaks detected!
  warnings.warn("Secondary peaks detected!")
<xarray.Dataset>
Dimensions:    (time: 2947)
Coordinates:
    latitude   float64 0.0
    longitude  float64 -140.0
  * time       (time) datetime64[ns] 1995-09-01 ... 1997-01-04T12:00:00
    variable   <U1 'v'
Data variables:
    tiw_phase  (time) float32 nan nan nan nan nan nan ... nan nan nan nan nan
    period     (time) float32 nan nan nan nan nan ... 19.0 19.0 19.0 19.0 19.0
tao = gcm1.tao.sel(latitude=2, longitude=-110)
T = tao.theta.isel(depth=0)
v = tao.v.isel(depth=0)
(v * (T - T.mean("time"))).plot()
# v.plot()
# (T-T.mean("time")).plot()
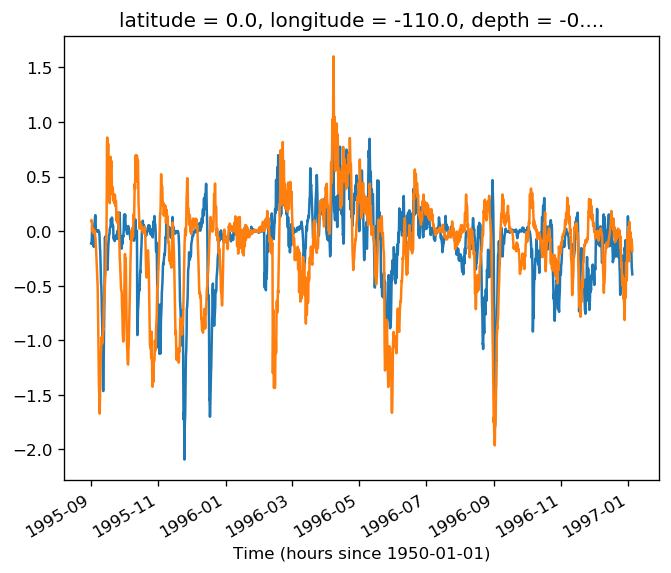
tao = gcm1.tao.sel(latitude=0, longitude=-110)
T = tao.theta.isel(depth=0)
v = tao.v.isel(depth=0)
(v * (T - T.mean("time"))).plot()
# v.plot()
# (T-T.mean("time")).plot()
[<matplotlib.lines.Line2D at 0x2b21fa47a588>]
groupby plotting#
obj = surf140.theta.groupby(tao0140.period)

from xarray import DataArray, Dataset

dim = obj._group_dim
fg = xr.plot.FacetGrid(data=obj, col="period", col_wrap=3, sharex=False, sharey=True)


def map_dataarray_groupby(self, func, x, y, **kwargs):
    from xarray.plot.utils import _process_cmap_cbar_kwargs, _infer_xy_labels
    from xarray.core.utils import peek_at

    if kwargs.get("cbar_ax", None) is not None:
        raise ValueError("cbar_ax not supported by FacetGrid.")

    cmap_params, cbar_kwargs = _process_cmap_cbar_kwargs(
        func, self.data._obj.values, **kwargs
    )

    self._cmap_extend = cmap_params.get("extend")

    # Order is important
    func_kwargs = {
        k: v
        for k, v in kwargs.items()
        if k not in {"cmap", "colors", "cbar_kwargs", "levels"}
    }
    func_kwargs.update(cmap_params)
    func_kwargs.update({"add_colorbar": False, "add_labels": False})

    # Get x, y labels for the first subplot
    x, y = _infer_xy_labels(
        darray=peek_at(self.data._iter_grouped())[0],
        x=x,
        y=y,
        imshow=func.__name__ == "imshow",
        rgb=kwargs.get("rgb", None),
    )

    for (_, subset), ax in zip(self.data, self.axes.flat):
        mappable = func(subset, x=x, y=y, ax=ax, **func_kwargs)
        self._mappables.append(mappable)

    self._finalize_grid(x, y)

    if kwargs.get("add_colorbar", True):
        self.add_colorbar(**cbar_kwargs)

    return self


map_dataarray_groupby(
    fg, xr.plot.pcolormesh, x="time", y="latitude", cmap=mpl.cm.RdYlBu_r, robust=True
)
<xarray.plot.facetgrid.FacetGrid at 0x2b3f432eac50>
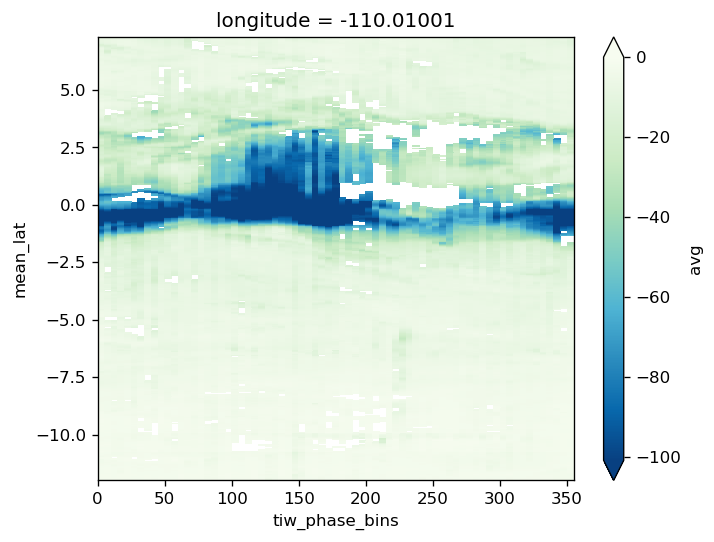
Phase average#
surf140 = surf140.chunk({"time": 100})
grouped = surf140.where(tao0140.period.isin([1, 3, 4])).groupby_bins(
tao0140.tiw_phase, bins=np.arange(0, 360, 5)
)
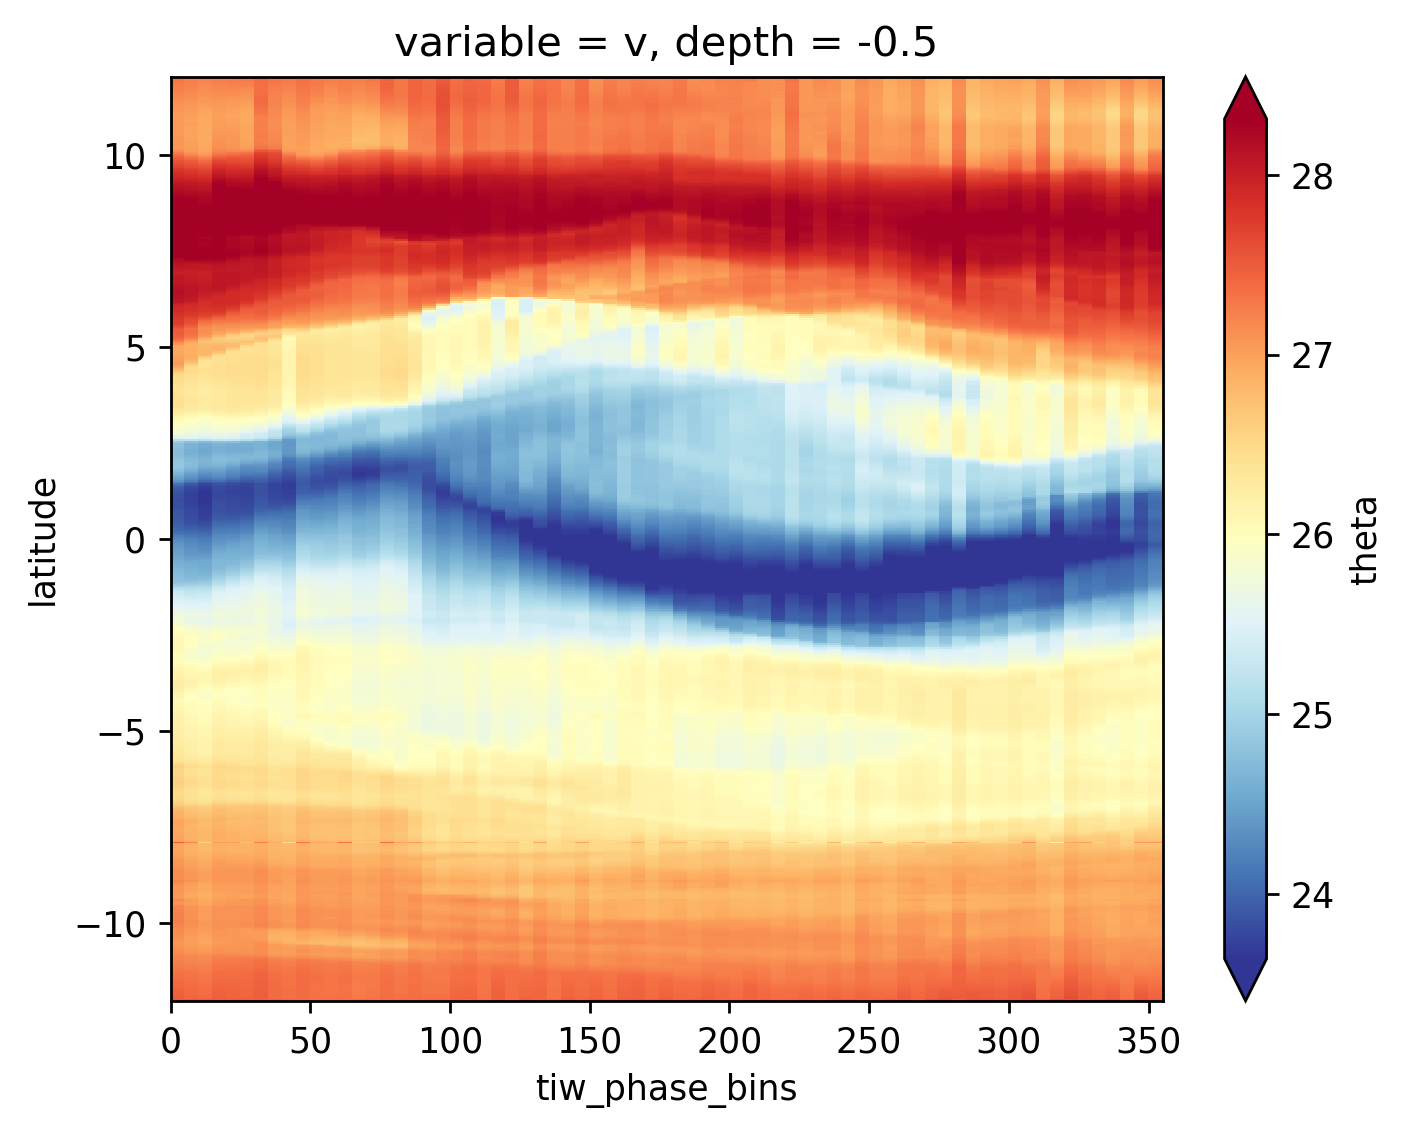
avg_surf = grouped.mean()
avg_surf.theta.plot(x="tiw_phase_bins", cmap=mpl.cm.RdYlBu_r, robust=True)
<matplotlib.collections.QuadMesh at 0x2b41d9e62550>
time compositing#
tao110 = gcm1.tao.sel(longitude=-110, latitude=0)
subset = surf110.where(tao110.period.isin([4, 5, 6]), drop=True)

grouped = subset.groupby_bins(subset.tiw_phase, bins=np.arange(0, 360, 5))
avg_surf = grouped.mean()
---------------------------------------------------------------------------
NameError                                 Traceback (most recent call last)
<ipython-input-6-267ede8632a2> in <module>
----> 1 subset = surf110.where(tao110.period.isin([4, 5, 6]), drop=True)
      2
      3 grouped = subset.groupby_bins(subset.tiw_phase, bins=np.arange(0, 360, 5))
      4 avg_surf = grouped.mean()

NameError: name 'surf110' is not defined
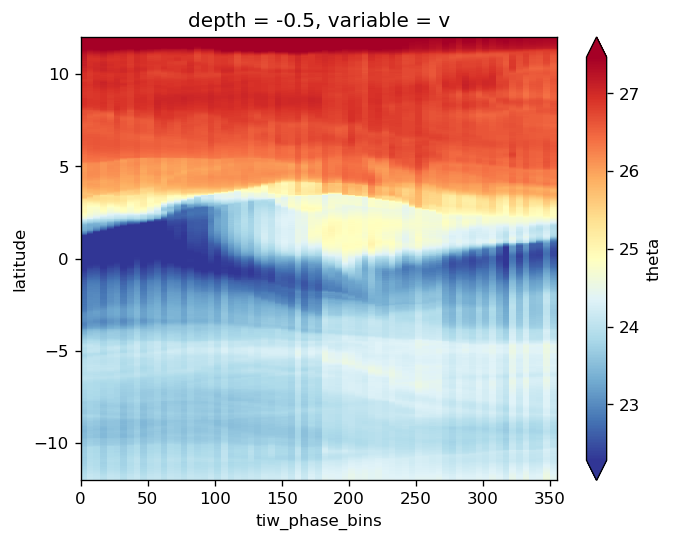
avg_surf.theta.plot(y="latitude", robust=True, cmap=mpl.cm.RdYlBu_r)
<matplotlib.collections.QuadMesh at 0x2ac1c406d278>
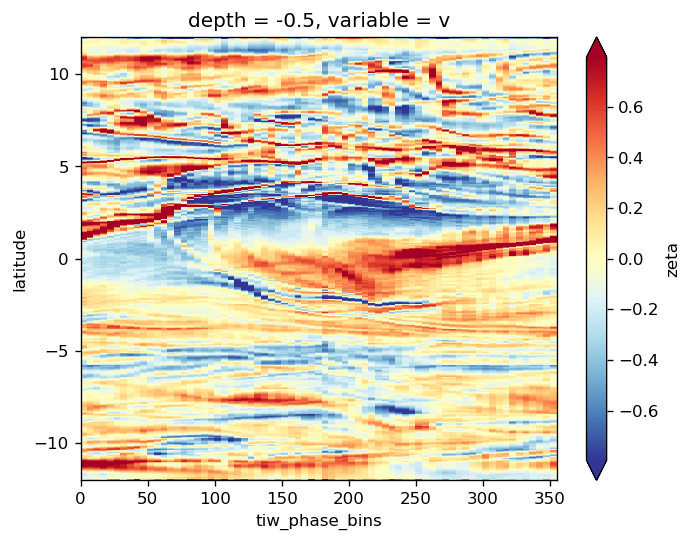
avg_surf.zeta.plot(y="latitude", robust=True, cmap=mpl.cm.RdYlBu_r)
<matplotlib.collections.QuadMesh at 0x2ac1bfeb10f0>
surface compositing#
sst = surf.theta.groupby("period").mean("time")
/gpfs/u/home/dcherian/python/xarray/xarray/core/common.py:664: FutureWarning: This DataArray contains multi-dimensional coordinates. In the future, the dimension order of these coordinates will be restored as well unless you specify restore_coord_dims=False.
  self, group, squeeze=squeeze, restore_coord_dims=restore_coord_dims
grouped = surf.theta.where(~np.isnan(surf.theta.period), drop=True).groupby("period")
(grouped - grouped.mean("time")).reindex(time=surf.time).plot(x="time", robust=True)
/gpfs/u/home/dcherian/python/xarray/xarray/core/common.py:674: FutureWarning: This DataArray contains multi-dimensional coordinates. In the future, the dimension order of these coordinates will be restored as well unless you specify restore_coord_dims=False.
  self, group, squeeze=squeeze, restore_coord_dims=restore_coord_dims

<matplotlib.collections.QuadMesh at 0x2aeacf32c198>
surf = gcm1.surface.theta.sel(longitude=-110, method="nearest").assign_coords(
    gcm1.tao[["tiw_phase", "period"]]
    .sel(longitude=-110, latitude=0, drop=True)
    .variables
)
surf = surf.chunk({"latitude": 20})
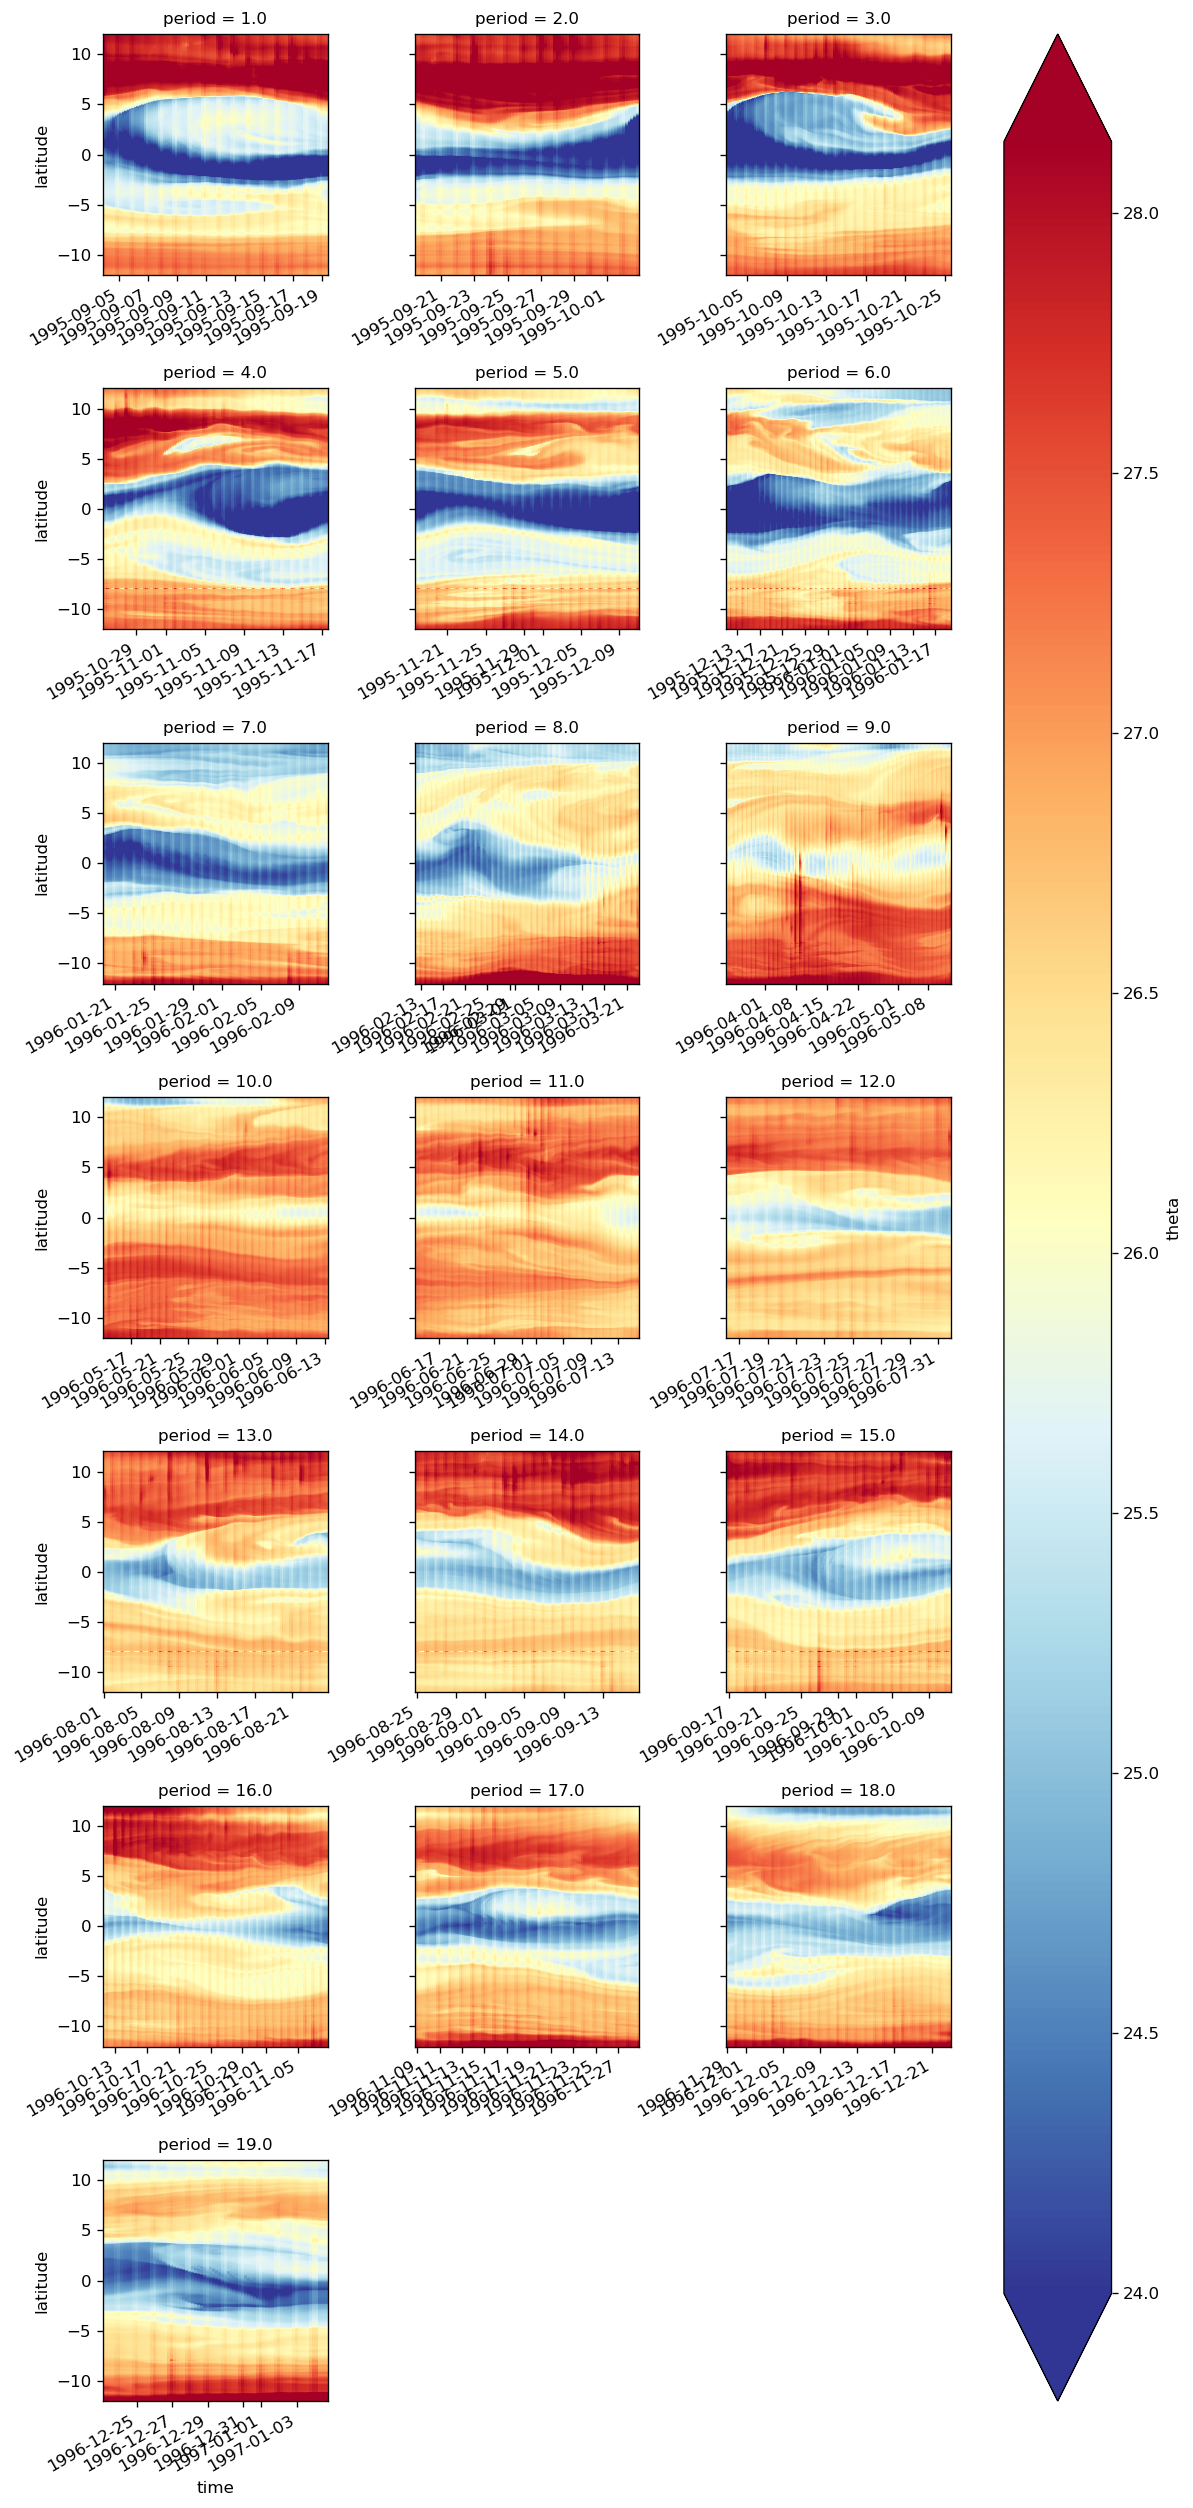
tanom = surf.groupby("period") - surf.groupby("period").mean()
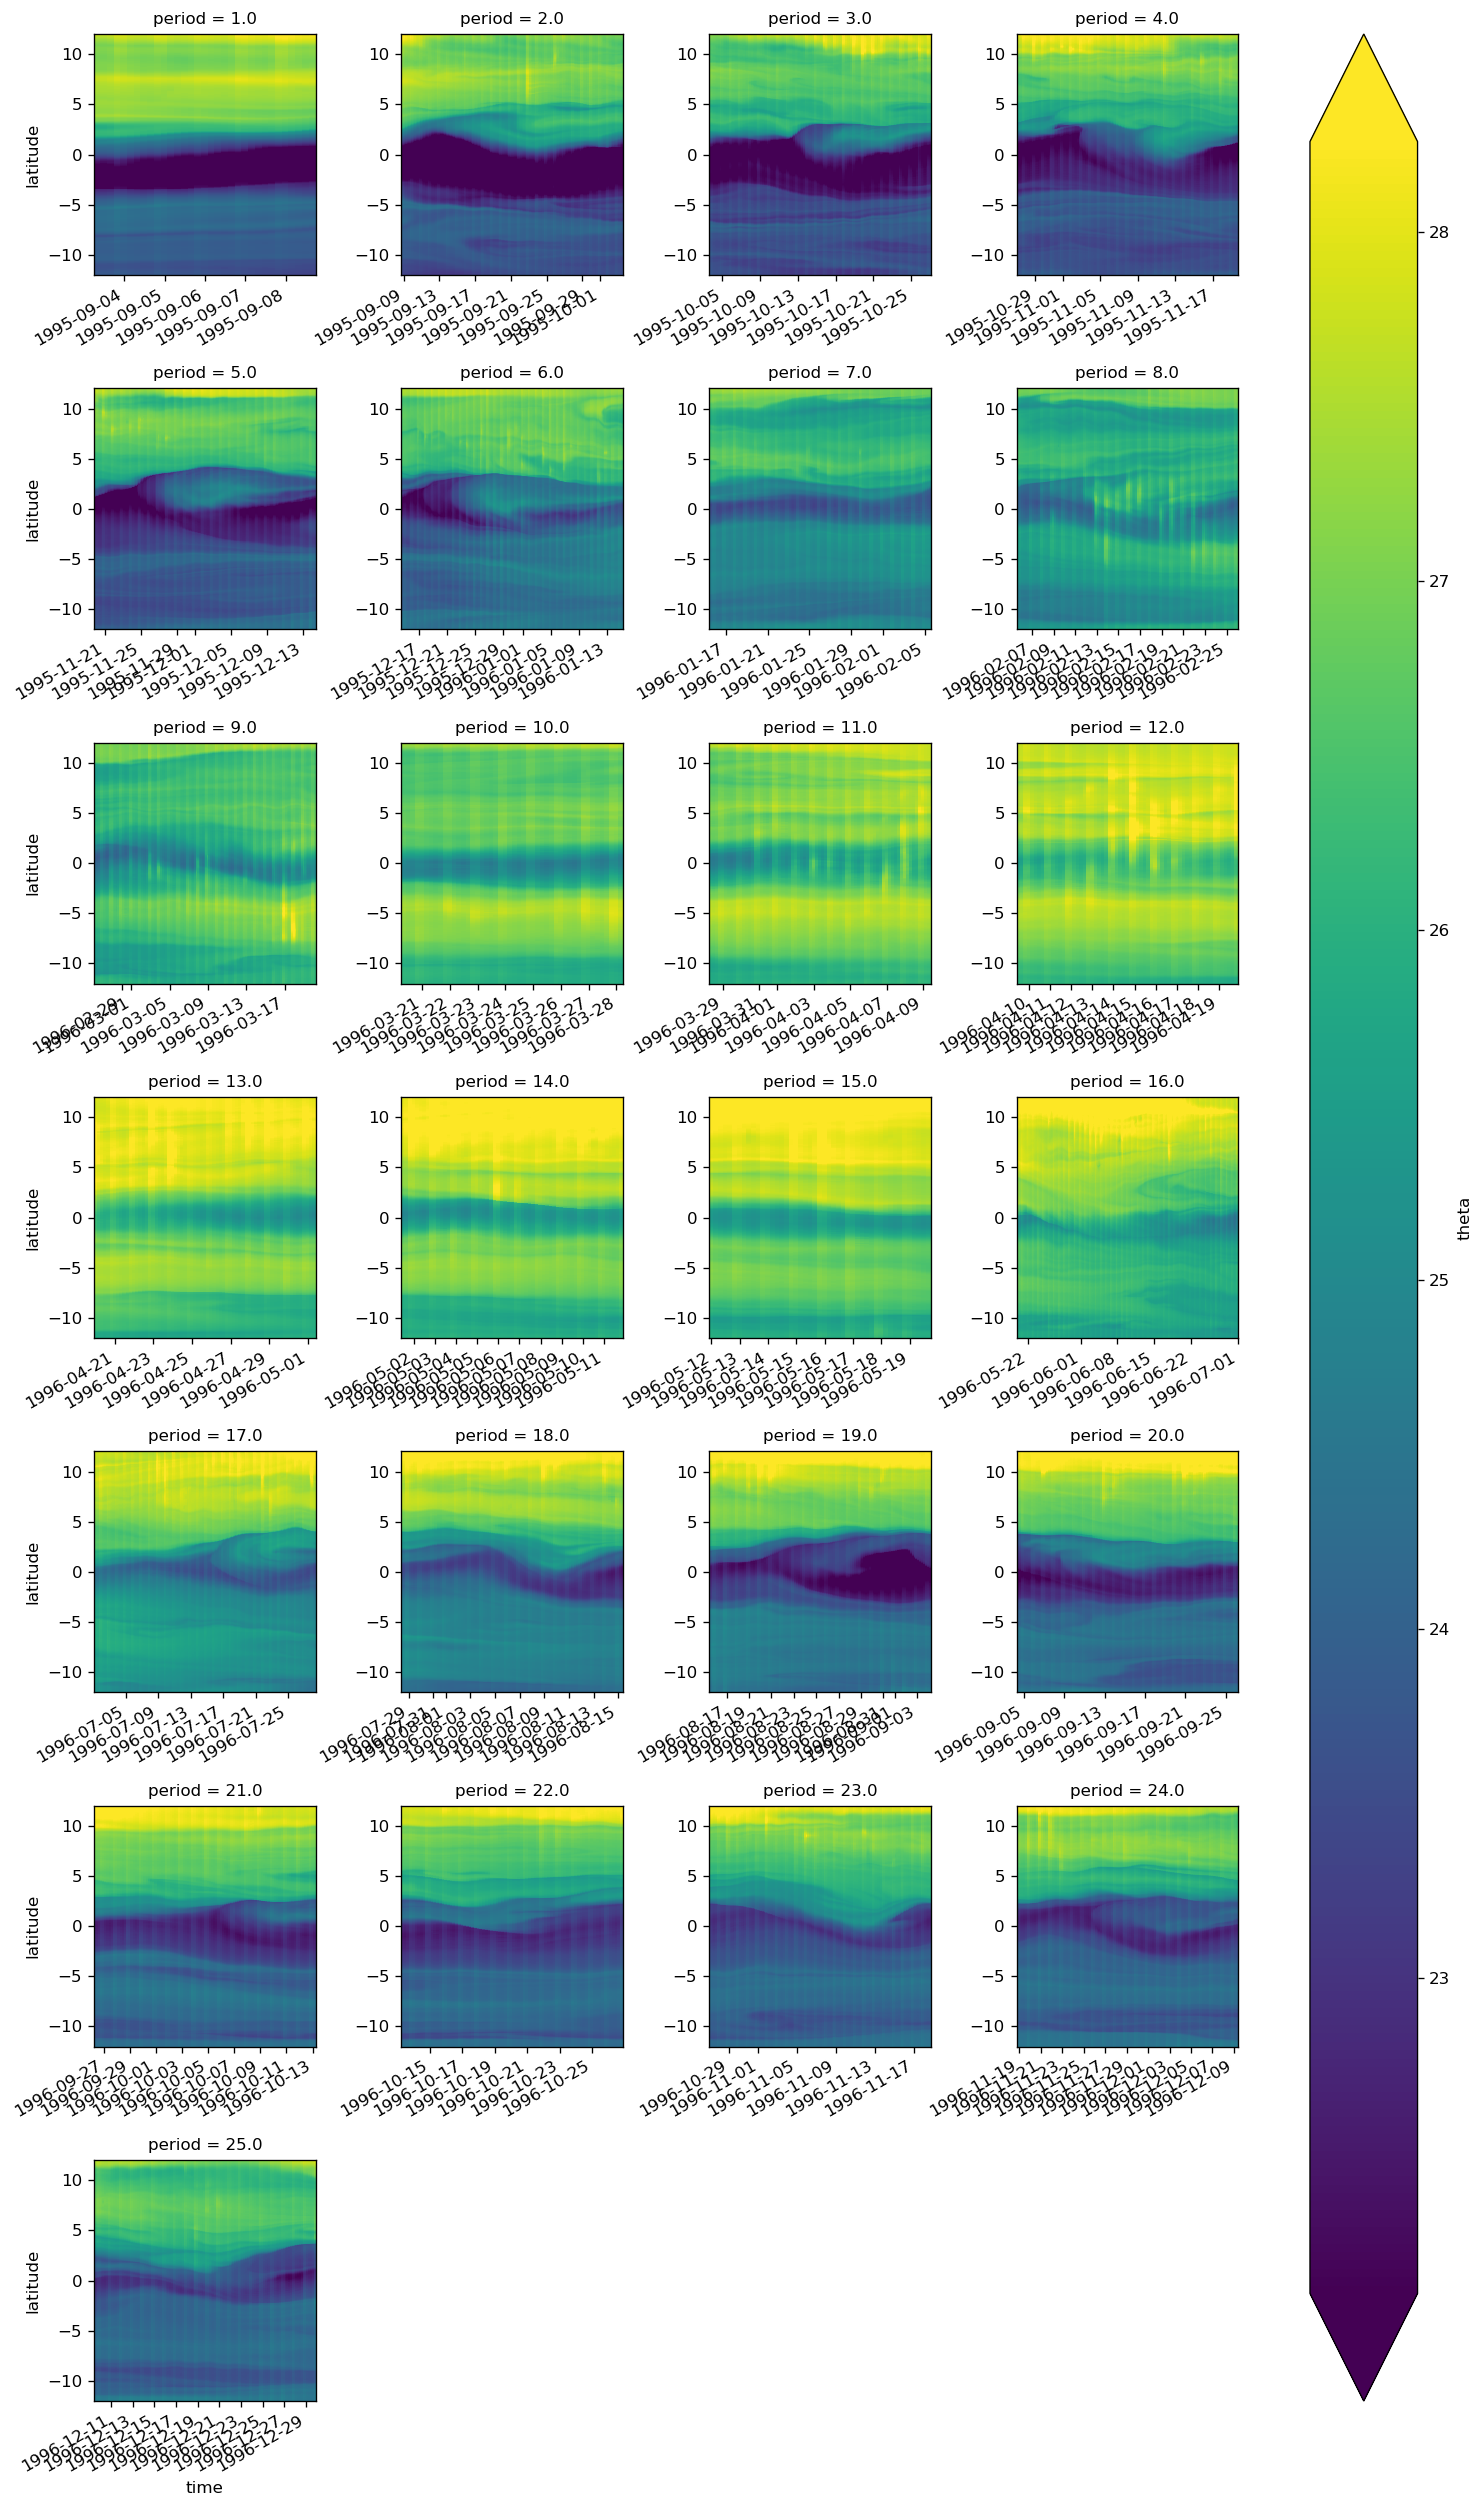
surf.groupby(gcm1.tao.period.sel(longitude=-110, latitude=0)).plot(
    col="period", col_wrap=4, x="time", robust=True
)
<xarray.plot.facetgrid.FacetGrid at 0x2b3c81fe6c18>
gcm1.surface = gcm1.surface.assign_coords(
    gcm1.tao[["tiw_phase", "period"]]
    .sel(longitude=-110, latitude=0, drop=True)
    .variables
)
---------------------------------------------------------------------------
KeyError                                  Traceback (most recent call last)
/gpfs/u/home/dcherian/python/xarray/xarray/core/dataset.py in _copy_listed(self, names)
   1113             try:
-> 1114                 variables[name] = self._variables[name]
   1115             except KeyError:

KeyError: 'tiw_phase'

During handling of the above exception, another exception occurred:

KeyError                                  Traceback (most recent call last)
<ipython-input-5-5b5947e97185> in <module>
      1 gcm1.surface =  gcm1.surface.assign_coords(
----> 2     gcm1.tao[["tiw_phase", "period"]].sel(longitude=-110, latitude=0, drop=True).variables
      3 )

/gpfs/u/home/dcherian/python/xarray/xarray/core/dataset.py in __getitem__(self, key)
   1236             return self._construct_dataarray(key)
   1237         else:
-> 1238             return self._copy_listed(np.asarray(key))
   1239
   1240     def __setitem__(self, key: Hashable, value) -> None:

/gpfs/u/home/dcherian/python/xarray/xarray/core/dataset.py in _copy_listed(self, names)
   1115             except KeyError:
   1116                 ref_name, var_name, var = _get_virtual_variable(
-> 1117                     self._variables, name, self._level_coords, self.dims
   1118                 )
   1119                 variables[var_name] = var

/gpfs/u/home/dcherian/python/xarray/xarray/core/dataset.py in _get_virtual_variable(variables, key, level_vars, dim_sizes)
    146         ref_var = dim_var.to_index_variable().get_level_variable(ref_name)
    147     else:
--> 148         ref_var = variables[ref_name]
    149
    150     if var_name is None:

KeyError: 'tiw_phase'
obj = gcm1.surface.theta.chunk({"latitude": 60, "longitude": 100})
obj = gcm1.surface.theta.sel(latitude=0, longitude=-110, method="nearest")
gcm1.surface = gcm1.surface.chunk({"latitude": 120, "longitude": 500, "time": 1})
filtufunc = pump.utils.lowpass(
    gcm1.surface.theta.chunk({"time": None}).fillna(0),
    "time",
    freq=0.4,
    cycles_per="D",
    use_overlap=False,
)
filtover = pump.utils.lowpass(
    gcm1.surface.theta.fillna(0), "time", freq=0.4, cycles_per="D", use_overlap=True
)
cluster.scale(24)
dcpy.util.dask_len(filtufunc)
35425
filtered = pump.utils.lowpass(
    gcm1.surface.chunk({"time"L ,
    "time",
    freq=0.5,
    cycles_per="D",
)
surface variables#
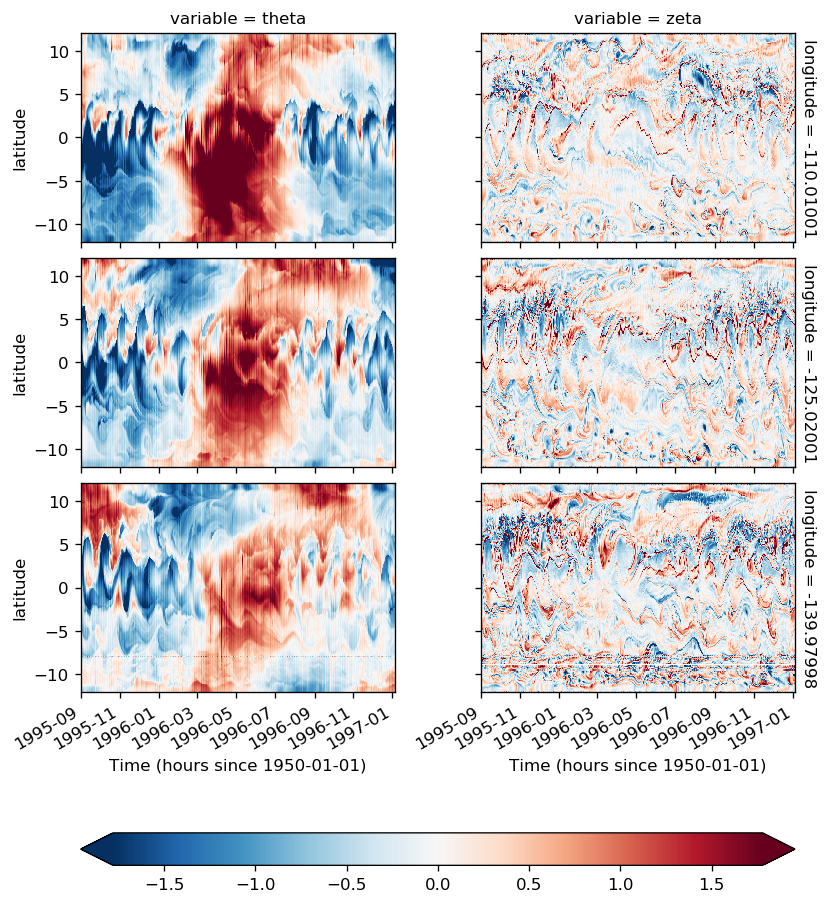
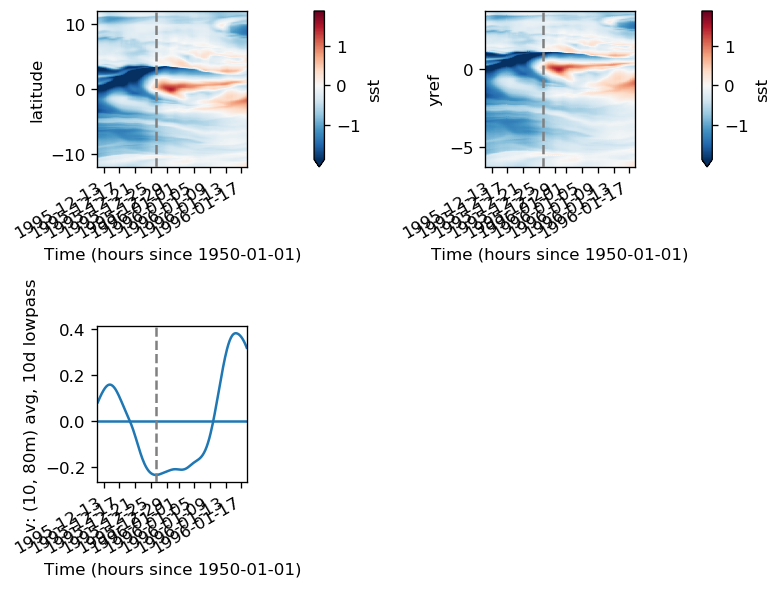
sst = gcm1.surface.theta.sel(longitude=[-110, -125, -140], method="nearest")
ssz = gcm1.surface.zeta.sel(longitude=[-110, -125, -140], method="nearest")
sstz = xr.merge([sst, ssz]).load()
(sstz - sstz.mean("time")).to_array().plot(
    row="longitude",
    col="variable",
    robust=True,
    x="time",
    cbar_kwargs={"orientation": "horizontal"},
)
/gpfs/u/home/dcherian/python/xarray/xarray/core/nanops.py:140: RuntimeWarning: Mean of empty slice
  return np.nanmean(a, axis=axis, dtype=dtype)
<xarray.plot.facetgrid.FacetGrid at 0x2ac4d316cb00>
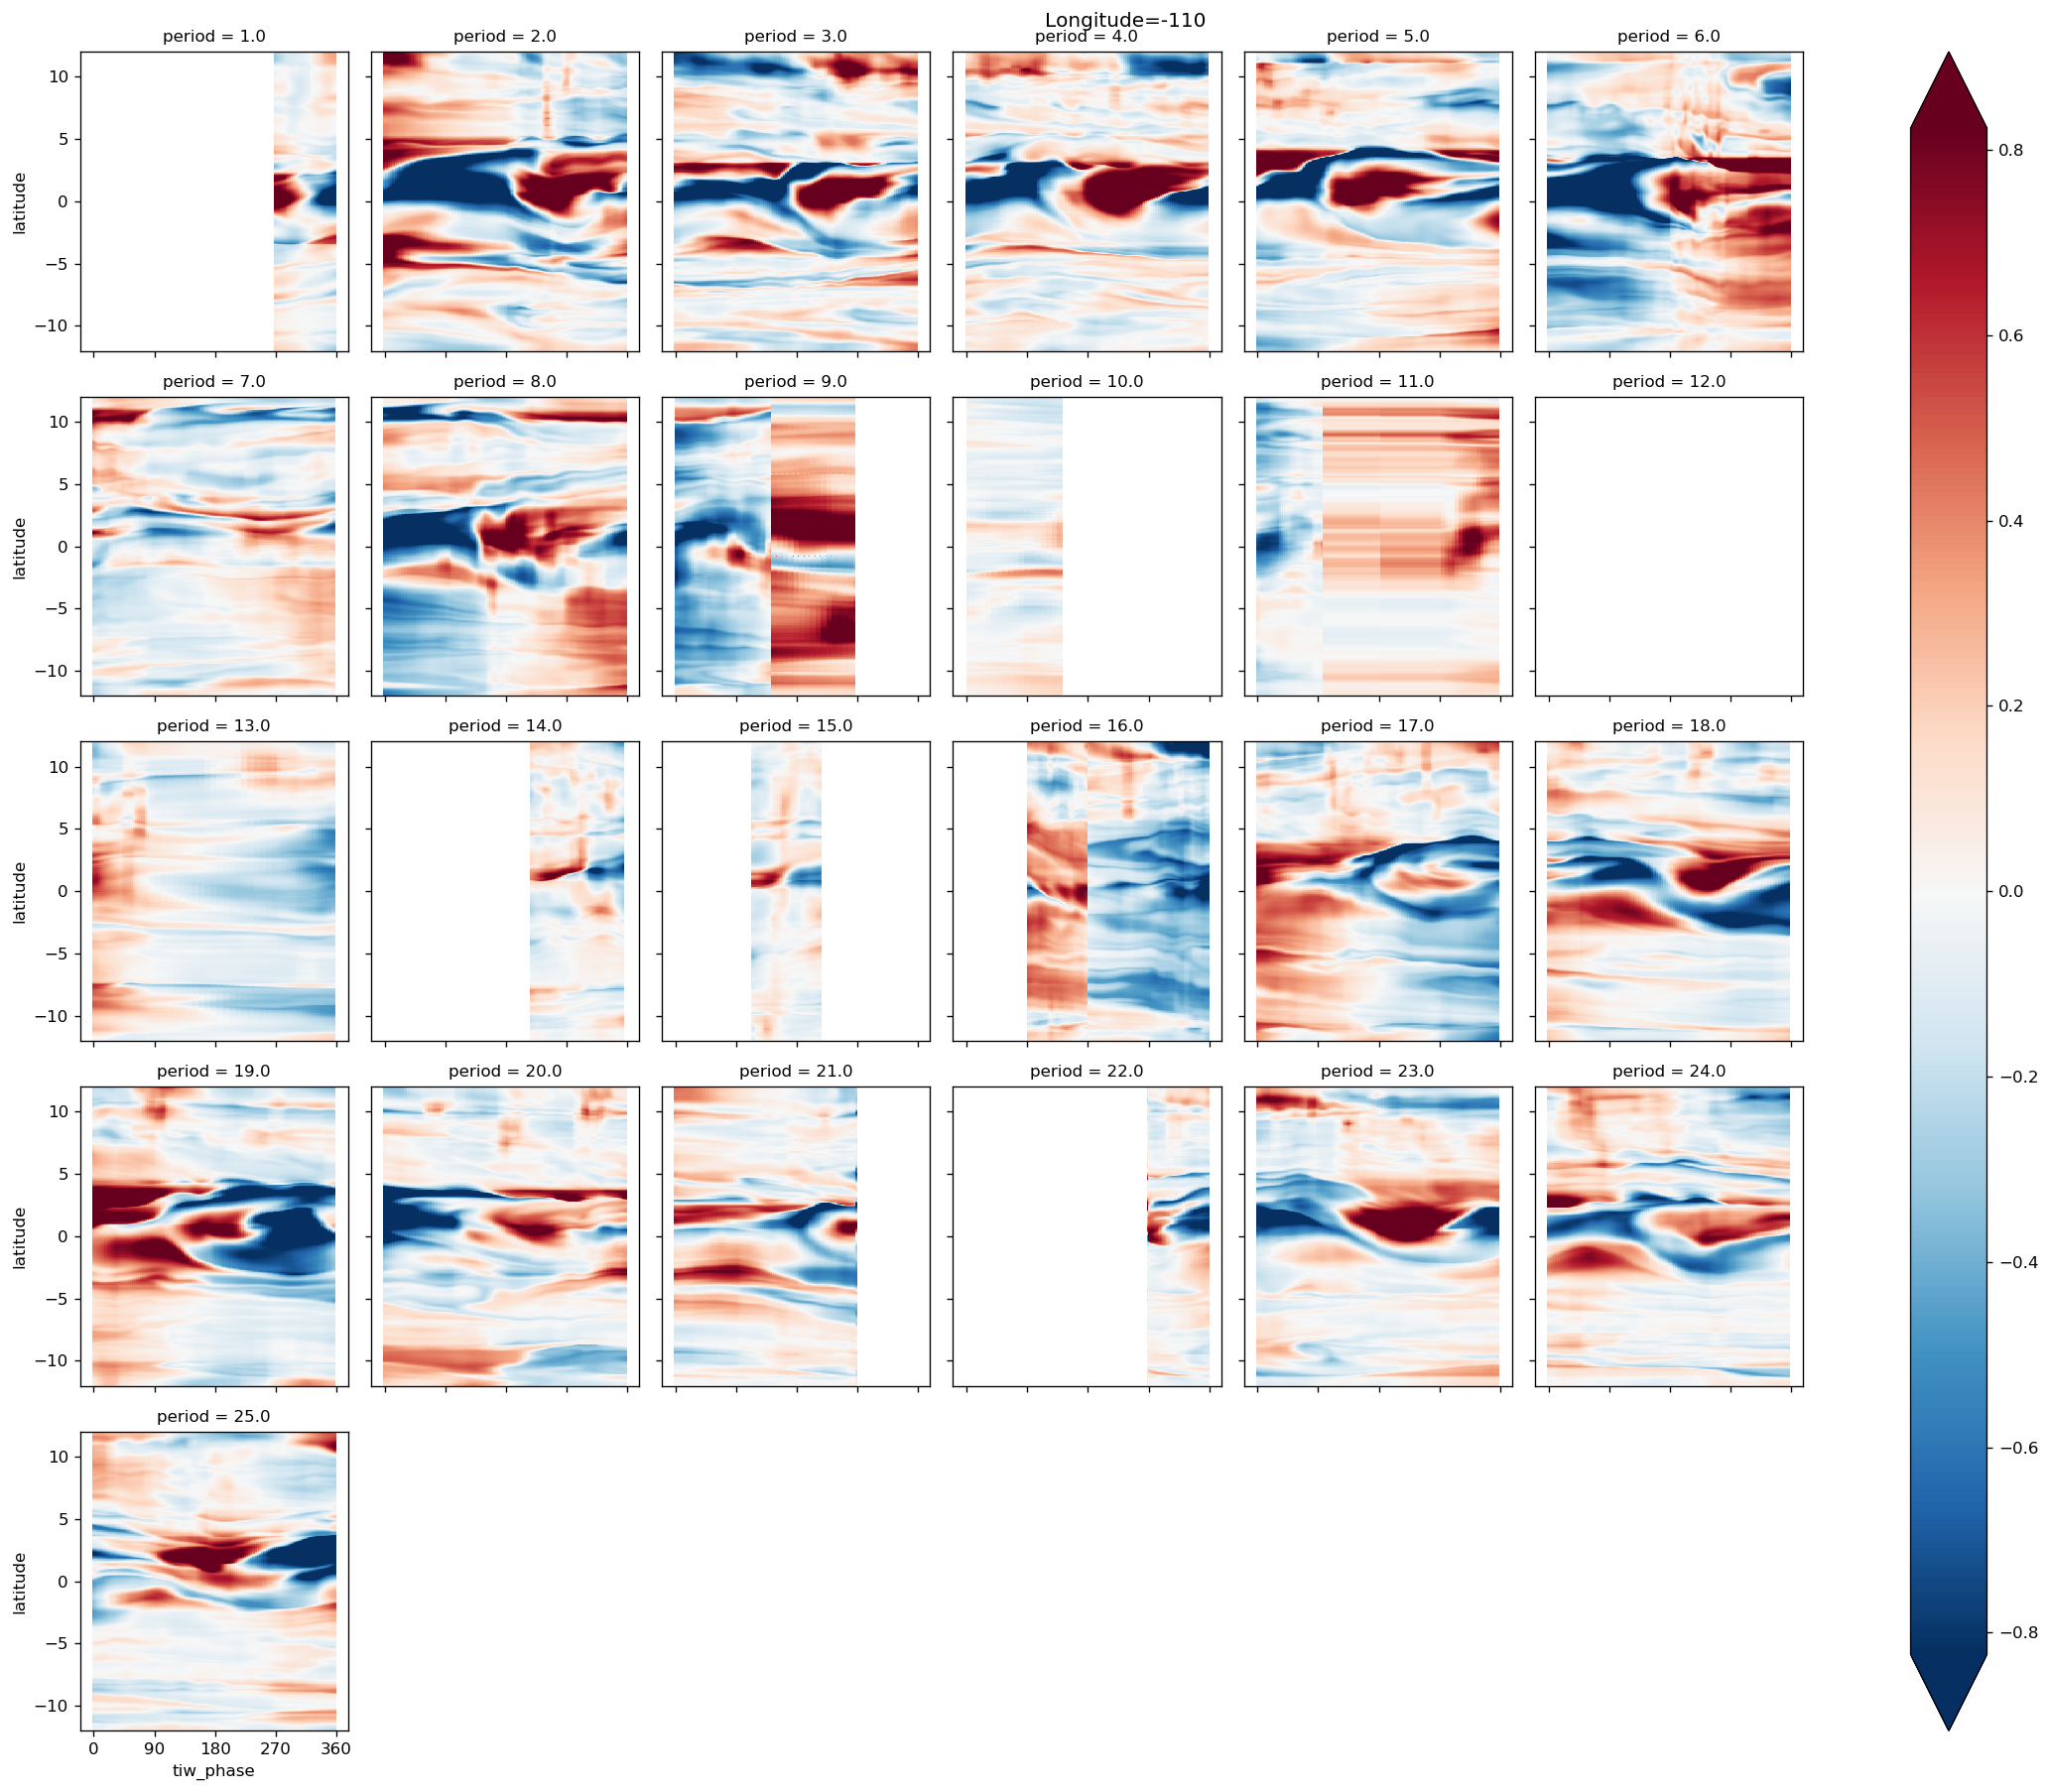
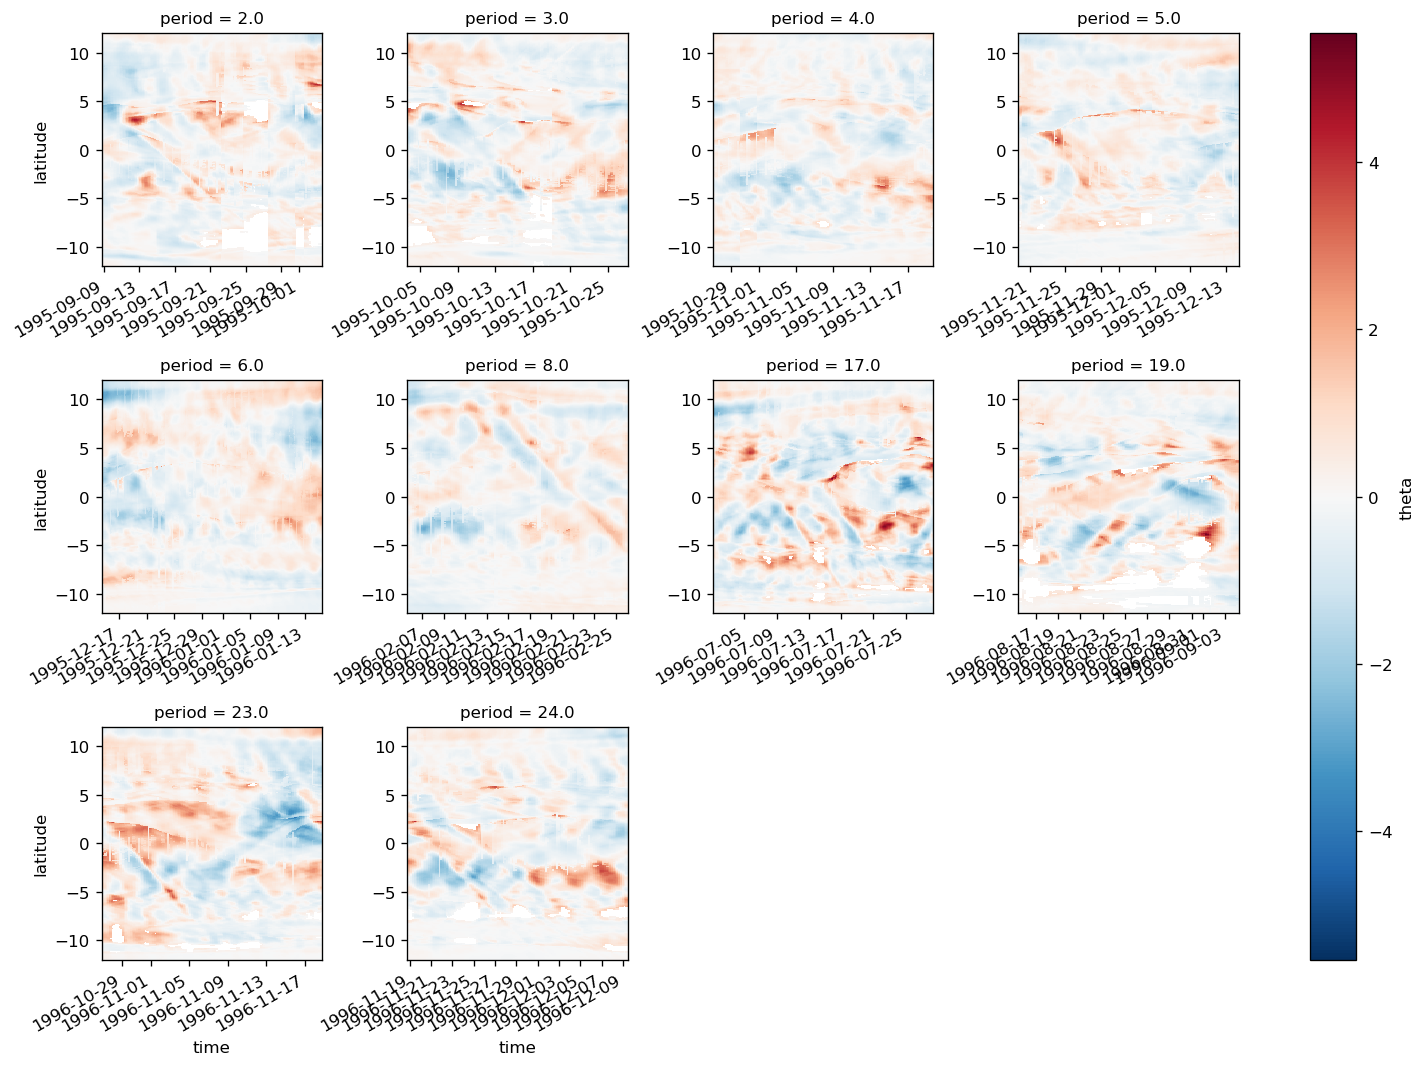
look at surface anomalies#
%matplotlib inline


def plot_tiw_sst_anom(longitude, x="tiw_phase", y="latitude"):
    tao = gcm1.tao.sel(longitude=longitude, latitude=0, drop=True)
    Tsmooth = (
        sst.sel(longitude=longitude, method="nearest")
        .chunk({"latitude": 20, "time": None})
        .rolling(time=6, center=True)
        .mean(allow_lazy=True)
        .compute()
    ).assign_coords(tao[["tiw_phase", "period"]].variables)
    Tsmooth["tiw_phase"] = Tsmooth.tiw_phase.interpolate_na("time")

    grouped = Tsmooth.groupby("period")

    (
        (grouped - grouped.mean("time"))
        .groupby("period")
        .plot(
            col="period",
            col_wrap=6,
            x=x,
            y=y,
            robust=True,
            sharey=True,
            sharex=True,
            xticks=[0, 90, 180, 270, 360],
        )
    )
    plt.gcf().suptitle(f"Longitude={longitude}", y=1)


plot_tiw_sst_anom(-110)
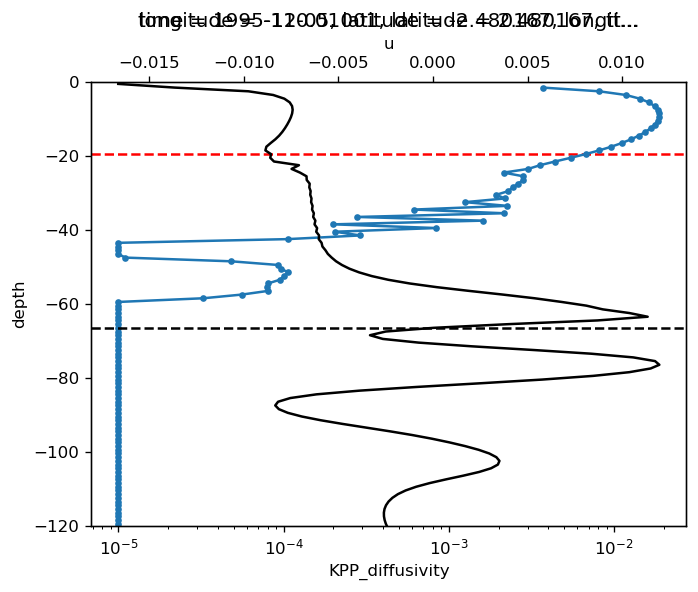
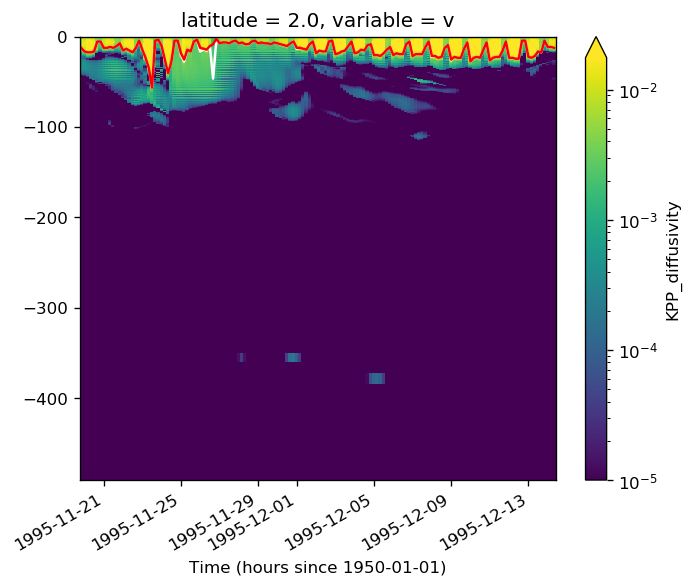
KPP mixing layer depth#
Looks like the best way to detect it from the diffusivity. I pick the K value at one grid point below the surface \(K_{-1}\). and find the shallowest depth where \(K ≤ K_{-1} / 3\)
sub = gcm1.full.sel(longitude=-110, time="1995-12-05 00:00", method="nearest")[
    ["u", "v", "dens"]
].load()
JobQueueCluster.scale_down was called with a number of worker greater than what is already running or pending.
sub_diff = gcm1.full.KPP_diffusivity.sel(
    time="1995-12-05 00:00", method="nearest", longitude=-110
).load()
gcm1
pump.calc.kpp_diff_depth(sub_diff.sel(latitude=2.5, method="nearest"), debug=True)
ax = plt.gca().twiny()
# sub.u.sel(latitude=-2.5, method="nearest").differentiate("depth").plot(ax=ax,y="depth")
# (-1 * sub.dens.sel(latitude=-2.5, method="nearest").differentiate("depth")).plot(ax=ax, color='k', y="depth")
(sub.u.sel(latitude=-2.5, method="nearest").differentiate("depth")).plot(
    ax=ax, color="k", y="depth"
)
mld_rib = pump.calc.get_kpp_mld(sub.sel(latitude=-2.5, method="nearest"))
dcpy.plots.liney(mld_rib, color="k")
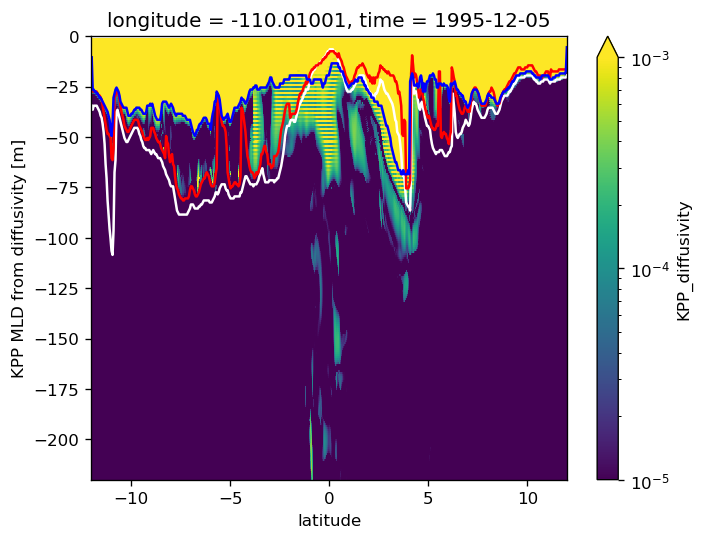
sub_diff.sel(depth=slice(0, -220)).plot(vmax=1e-3, norm=mpl.colors.LogNorm())

pump.calc.get_kpp_mld(sub).plot(color="w", label="KPP Ric depth")
pump.calc.get_mld(sub.dens).plot(color="r", label="Δρ depth")
pump.calc.kpp_diff_depth(sub_diff).plot(color="b", label="K depth")
[<matplotlib.lines.Line2D at 0x2ac37b9a27b8>]
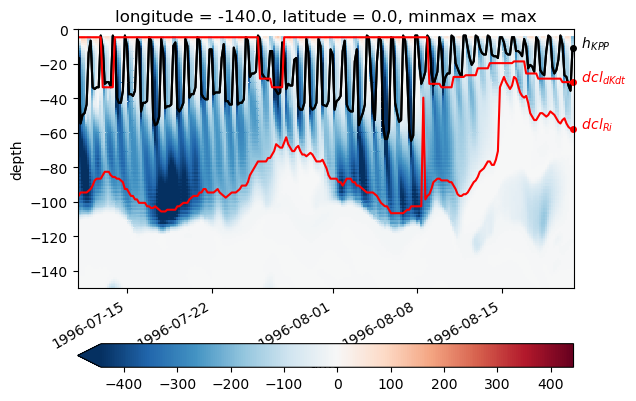
KPP mixing layer depth & deep cycle#
Looks like we do see the shear mixing scheme kick in on a daily timescale beneath a descending convecting layer.
%matplotlib inline


def plot_annotate(data, label, **kwargs):
    h = data.plot(**kwargs)
    dcpy.plots.annotate_end(h[0], label)


subset = gcm1.tao.sel(latitude=0, longitude=-140).sel(
    time=slice("1996-07-11", "1996-08-20")
)
K = subset.KPP_diffusivity.rolling(depth=4).mean()
dcl = pump.calc.get_dcl_base_dKdt(np.abs(K), threshold=0.25)
kpp_mld = pump.calc.kpp_diff_depth(subset.KPP_diffusivity)

subset.Jq.rolling(depth=4).mean().plot(
    y="depth",
    ylim=[-150, 0],
    robust=True,
    cmap=mpl.cm.RdBu_r,
    center=0,
    cbar_kwargs={"orientation": "horizontal"},
)
h = kpp_mld.plot(x="time", color="k")
plot_annotate(kpp_mld, "$h_{KPP}$", x="time", color="k")
plot_annotate(subset.dcl_base_Ri, "$dcl_{Ri}$", x="time", color="r")
plot_annotate(dcl, "$dcl_{dKdt}$", x="time", color="r")
K.sel(time=slice("1996-07-15", "1996-07-22")).time.dt.floor("D")
<xarray.DataArray 'floor' (time: 48)>
array(['1996-07-15T00:00:00.000000000', '1996-07-15T00:00:00.000000000',
       '1996-07-15T00:00:00.000000000', '1996-07-15T00:00:00.000000000',
       '1996-07-15T00:00:00.000000000', '1996-07-15T00:00:00.000000000',
       '1996-07-16T00:00:00.000000000', '1996-07-16T00:00:00.000000000',
       '1996-07-16T00:00:00.000000000', '1996-07-16T00:00:00.000000000',
       '1996-07-16T00:00:00.000000000', '1996-07-16T00:00:00.000000000',
       '1996-07-17T00:00:00.000000000', '1996-07-17T00:00:00.000000000',
       '1996-07-17T00:00:00.000000000', '1996-07-17T00:00:00.000000000',
       '1996-07-17T00:00:00.000000000', '1996-07-17T00:00:00.000000000',
       '1996-07-18T00:00:00.000000000', '1996-07-18T00:00:00.000000000',
       '1996-07-18T00:00:00.000000000', '1996-07-18T00:00:00.000000000',
       '1996-07-18T00:00:00.000000000', '1996-07-18T00:00:00.000000000',
       '1996-07-19T00:00:00.000000000', '1996-07-19T00:00:00.000000000',
       '1996-07-19T00:00:00.000000000', '1996-07-19T00:00:00.000000000',
       '1996-07-19T00:00:00.000000000', '1996-07-19T00:00:00.000000000',
       '1996-07-20T00:00:00.000000000', '1996-07-20T00:00:00.000000000',
       '1996-07-20T00:00:00.000000000', '1996-07-20T00:00:00.000000000',
       '1996-07-20T00:00:00.000000000', '1996-07-20T00:00:00.000000000',
       '1996-07-21T00:00:00.000000000', '1996-07-21T00:00:00.000000000',
       '1996-07-21T00:00:00.000000000', '1996-07-21T00:00:00.000000000',
       '1996-07-21T00:00:00.000000000', '1996-07-21T00:00:00.000000000',
       '1996-07-22T00:00:00.000000000', '1996-07-22T00:00:00.000000000',
       '1996-07-22T00:00:00.000000000', '1996-07-22T00:00:00.000000000',
       '1996-07-22T00:00:00.000000000', '1996-07-22T00:00:00.000000000'],
      dtype='datetime64[ns]')
Coordinates:
    latitude   float64 0.0
    longitude  float64 -140.0
  * time       (time) datetime64[ns] 1996-07-15 ... 1996-07-22T20:00:00
dcl = pump.calc.get_dcl_base_dKdt(
K.sel(time=slice("1996-07-15", "1996-07-22")), threshold=0.25, debug=True
)
subset.Ri.plot(x="time", norm=mpl.colors.LogNorm(0.25, 1), ylim=[-100, 0])
<matplotlib.collections.QuadMesh at 0x2b5f2af50518>
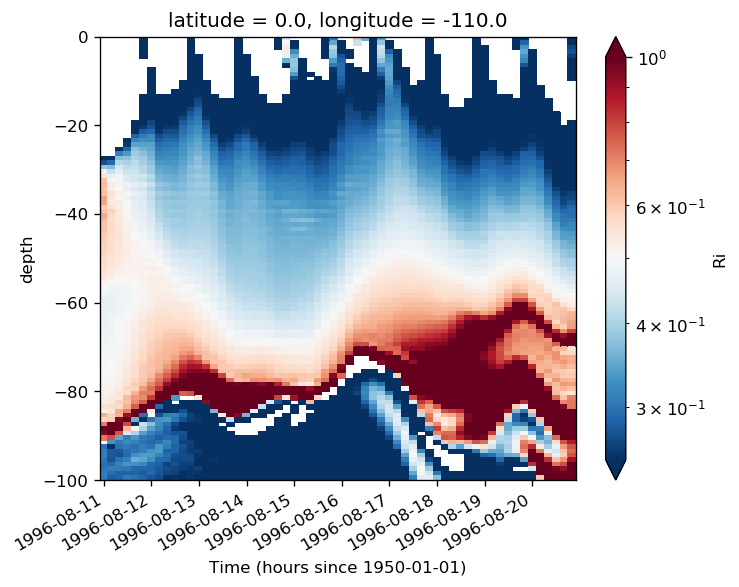
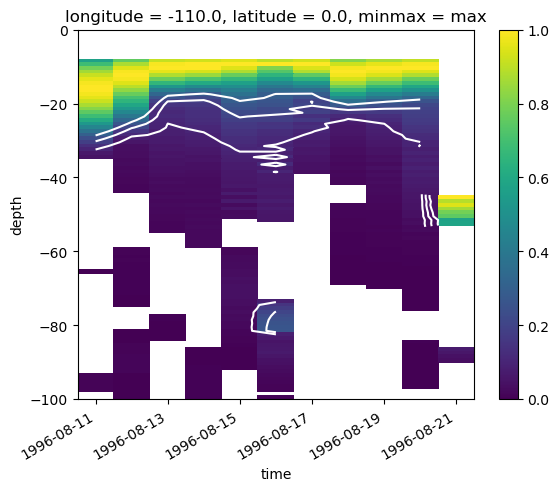
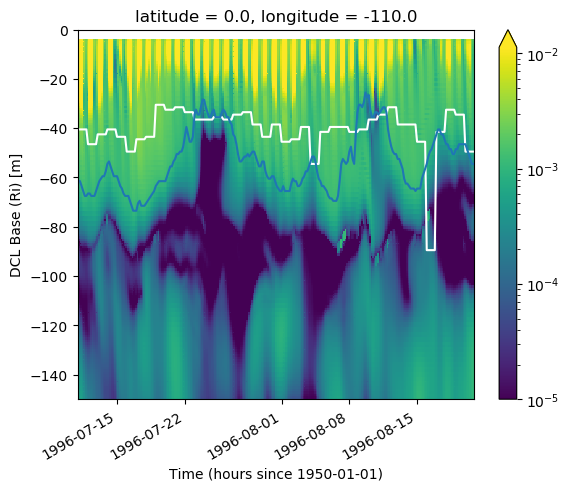
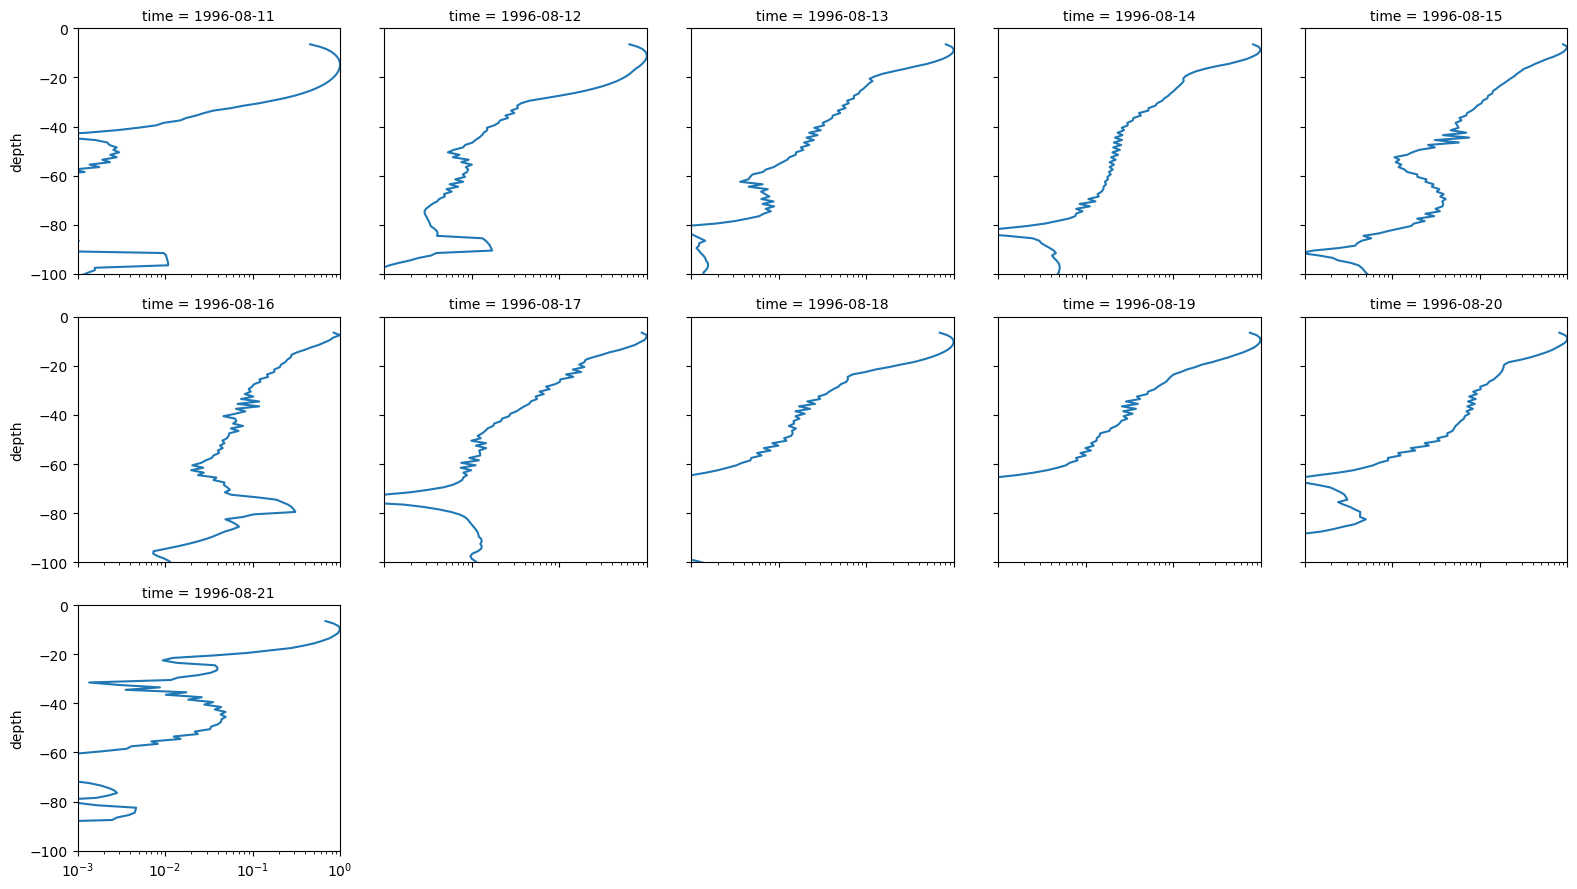
dK/dt based deep cycle depth#
Hmmm…. the Ri thing seems OK enough
(amp / amp.max("depth")).plot(y="depth", robust=True, ylim=(-100, 0), vmin=0, vmax=1)
(amp / amp.max("depth")).plot.contour(
    y="depth", colors="w", ylim=(-100, 0), levels=[0.1, 0.2, 0.3]
)
<matplotlib.contour.QuadContourSet at 0x2b5f80ebf160>
K = subset.KPP_diffusivity.rolling(depth=4).mean()
dcl = pump.calc.get_dcl_base_dKdt(K)
K.plot(x="time", robust=True, norm=mpl.colors.LogNorm())
dcl.plot(color="w")
subset.dcl_base_Ri.plot(ylim=(-150, 0))
[<matplotlib.lines.Line2D at 0x2b5f2f2daa90>]
/glade/u/home/dcherian/miniconda3/envs/dcpy/lib/python3.6/site-packages/matplotlib/colors.py:1110: RuntimeWarning: invalid value encountered in less_equal
  mask |= resdat <= 0
(amp_cleaned / amp_cleaned.max("depth")).plot(
    col="time", col_wrap=5, y="depth", ylim=[-100, 0], xscale="log", xlim=[1e-3, 1]
)
<xarray.plot.facetgrid.FacetGrid at 0x2b5eb168c0f0>
model = gcm1
longitude = -110

anomalize_fields = ["u", "v", "theta", "salt", "sst"]
anomalize_over = ["time"]  # and depth?

# def model_composite(model, longitude, periods):

# TODO: xfilter this
surf = (
    model.surface[["theta", "zeta"]]
    .sel(longitude=longitude, method="nearest")
    .rolling(time=12)
    .mean(allow_lazy=True)
).load()  # this is needed for y reference so might as well compute

surf["tiw_phase"], surf["period"] = pump.calc.get_tiw_phase_sst(surf.theta)
periods = [
    2,
    3,
    4,
    5,
    6,
]  # 17, 19, 23, 24
# surf["period"] = model.tao.period.sel(latitude=0, longitude=longitude).compute()
# surf["tiw_phase"] = model.tao.tiw_phase.sel(latitude=0, longitude=longitude).compute().interpolate_na("time")
surf = surf.set_coords(["period", "tiw_phase"])
yref = pump.composite.get_y_reference(surf.theta, periods=periods, debug=False)
surf = surf.assign_coords(yref=yref).drop("depth")
/gpfs/u/home/dcherian/python/xarray/xarray/core/nanops.py:140: RuntimeWarning: Mean of empty slice
  return np.nanmean(a, axis=axis, dtype=dtype)
tao = model.tao.sel(longitude=longitude, latitude=0)

full = model.full.sel(longitude=longitude, method="nearest").assign_coords(
    longitude=longitude,
    yref=surf.yref.compute(),
    period=surf.period.compute(),
    tiw_phase=surf.tiw_phase.compute(),
)

if model.budget is not None:
    full["Jq"] = model.budget.Jq.sel(
        longitude=longitude, method="nearest"
    ).assign_coords({"longitude": longitude})


subset_fields = ["Jq", "theta", "dens", "u", "v", "w", "KPP_diffusivity"]
# needed for apply_ufunc later
full = full[subset_fields]

full["sst"] = surf.theta
full["ssvor"] = surf.zeta
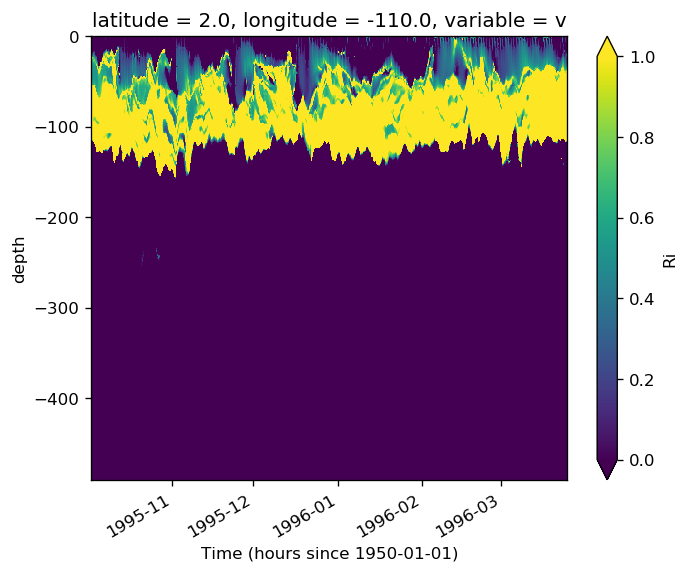
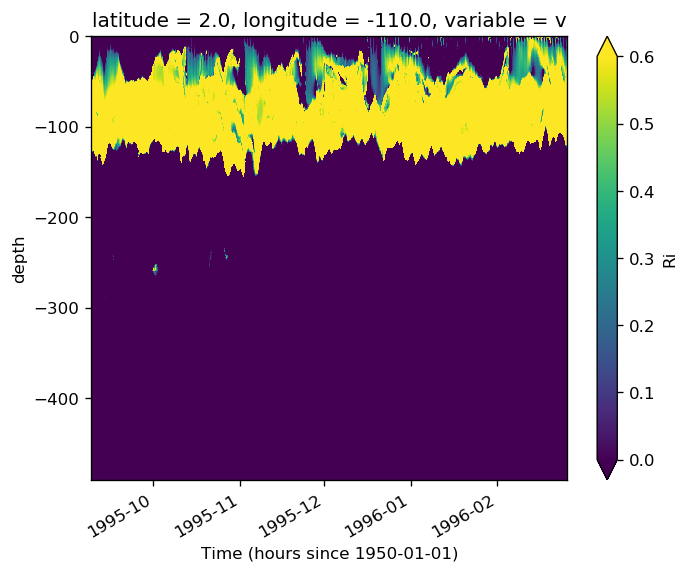
Lessons:
Δρ MLD depth might not be so bad as an upper bound
EUC_max at equator (duh) makes sense as a good deep bound
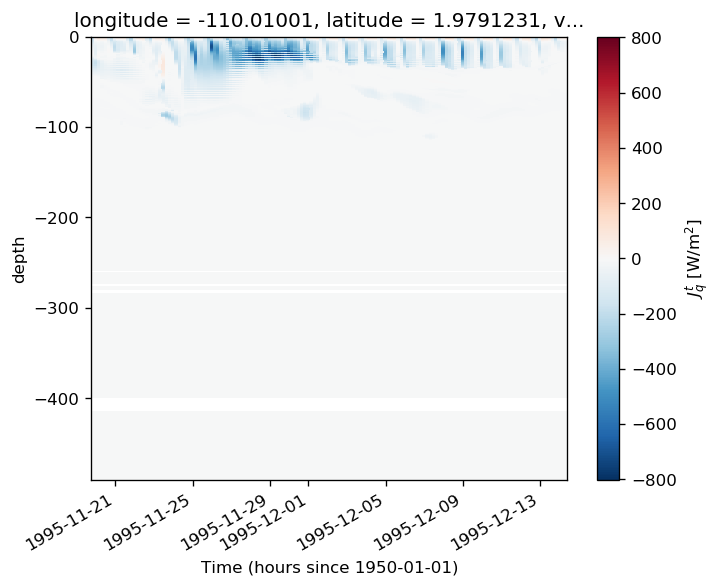
Mixing at 2N is elevated when the cold front arrives.
subset.sel(**region).Ri.plot(x="time", robust=True, vmax=1, vmin=0)
<matplotlib.collections.QuadMesh at 0x2b8baf1342e8>
subset.Ri.sel(**region).plot(x="time", vmin=0, vmax=0.6)
<matplotlib.collections.QuadMesh at 0x2ba4606ec828>
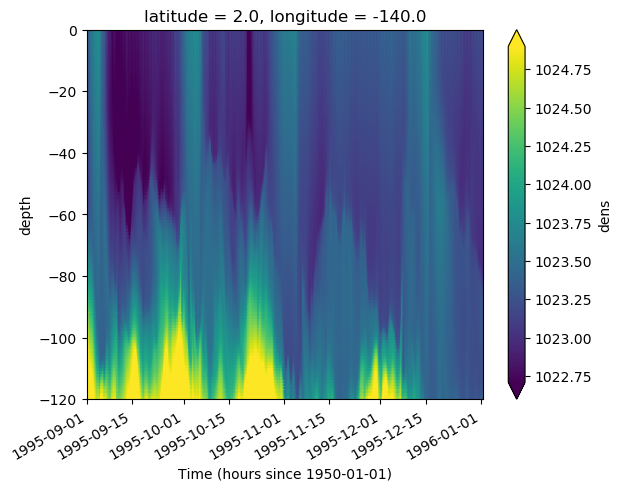
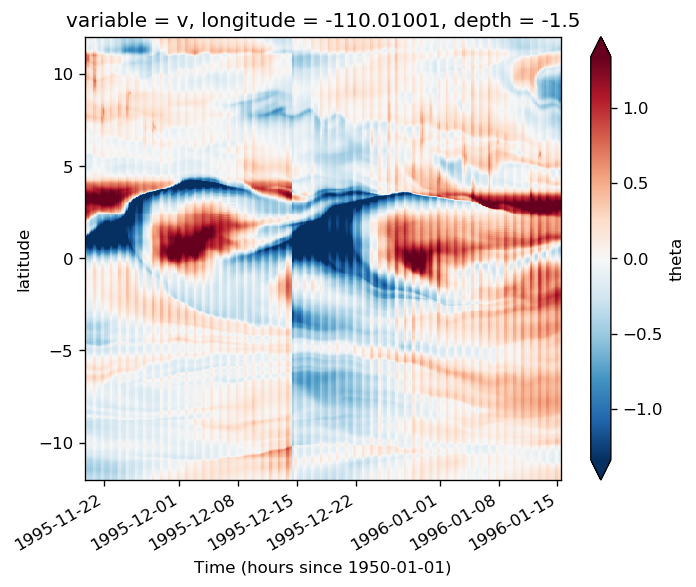
gcm1.tao.dens.sel(
    depth=slice(0, -120), time=slice(None, "1996-01-01"), latitude=2, longitude=-140
).plot(x="time", robust=True)
<matplotlib.collections.QuadMesh at 0x2b5f285372e8>
%matplotlib inline
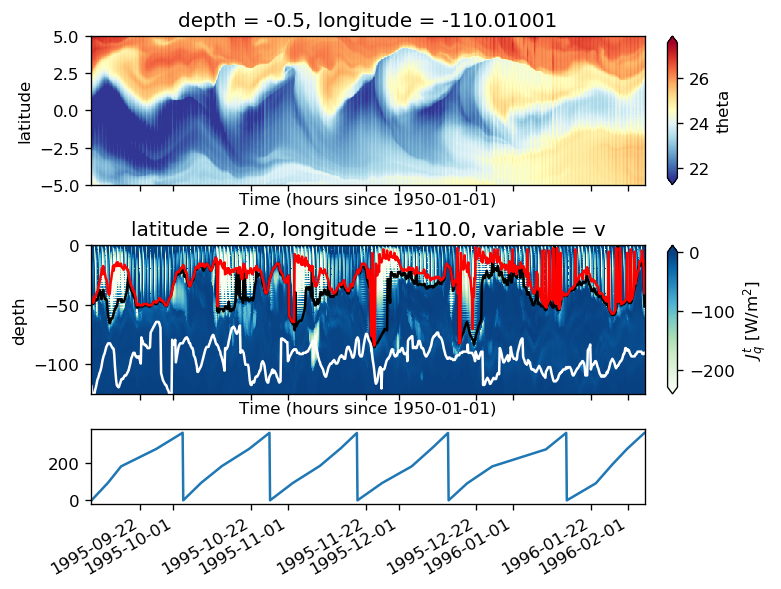
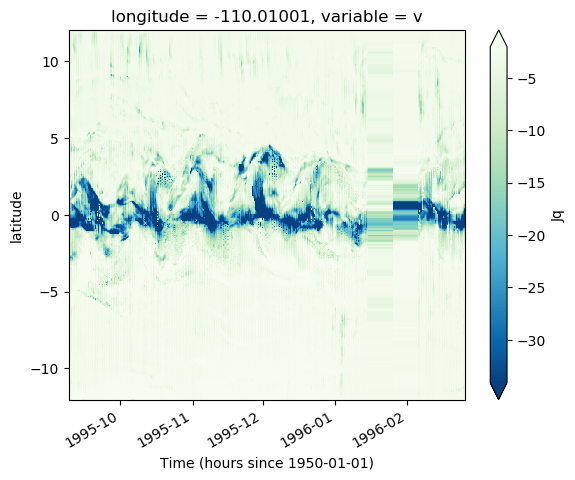
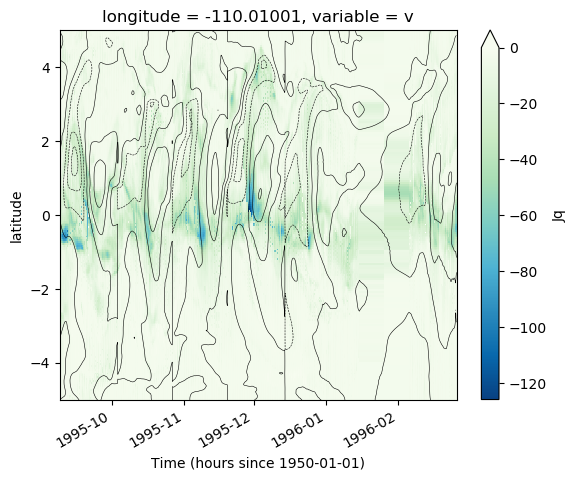
pump.plot.plot_jq_sst(gcm1, lon=-110, periods=range(2, 8), lat=3)
f.savefig("../images/tiw-110-mixing-periods-2345.png")
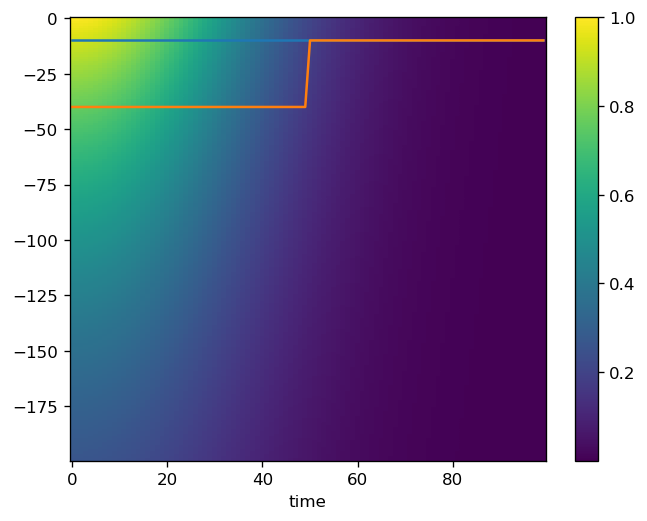
t = xr.DataArray(np.arange(100), dims=["time"])
z = xr.DataArray(-1 * np.arange(0, 200.0), dims=["z"])
field = np.exp(-((t / 40) ** 2) + z / 150).assign_coords(z=z, time=t)
mld = -10 * xr.ones_like(t)
dcl = -40 * xr.ones_like(t)
dcl[50:] = -10
field.plot(x="time", zorder=-10)
mld.plot()
dcl.plot()
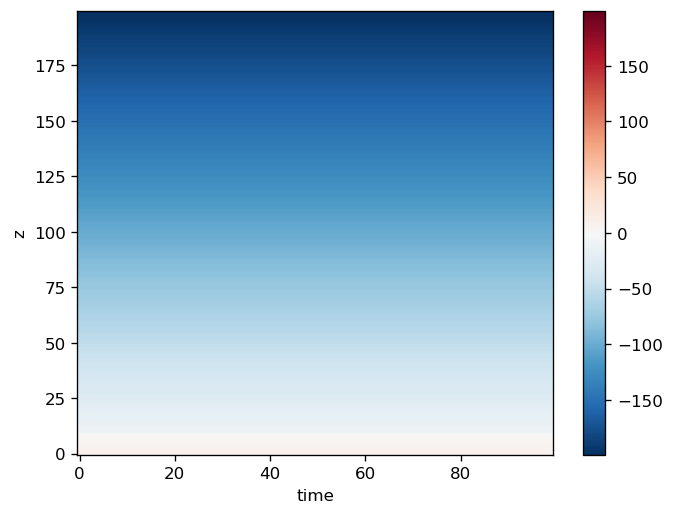
znew = xr.full_like(z, fill_value=np.nan)
znew = xr.where(z > mld, z - mld, z)
plt.figure()
znew.plot()
<matplotlib.collections.QuadMesh at 0x2b3b12ef2668>
T = subset.pipe(lambda x: x - x.mean("time")).sel(depth=slice(-10)).mean("depth")

T.plot(x="time", robust=True)
---------------------------------------------------------------------------
ValueError                                Traceback (most recent call last)
<ipython-input-169-56a04cf57d25> in <module>
----> 1 T = subset.pipe(lambda x: x - x.mean("time")).sel(depth=slice(-10)).mean("depth")
      2
      3 T.plot(x="time", robust=True)

/gpfs/u/home/dcherian/python/xarray/xarray/core/dataarray.py in sel(self, indexers, method, tolerance, drop, **indexers_kwargs)
   1046             method=method,
   1047             tolerance=tolerance,
-> 1048             **indexers_kwargs,
   1049         )
   1050         return self._from_temp_dataset(ds)

/gpfs/u/home/dcherian/python/xarray/xarray/core/dataset.py in sel(self, indexers, method, tolerance, drop, **indexers_kwargs)
   2002         indexers = either_dict_or_kwargs(indexers, indexers_kwargs, "sel")
   2003         pos_indexers, new_indexes = remap_label_indexers(
-> 2004             self, indexers=indexers, method=method, tolerance=tolerance
   2005         )
   2006         result = self.isel(indexers=pos_indexers, drop=drop)

/gpfs/u/home/dcherian/python/xarray/xarray/core/coordinates.py in remap_label_indexers(obj, indexers, method, tolerance, **indexers_kwargs)
    390
    391     pos_indexers, new_indexes = indexing.remap_label_indexers(
--> 392         obj, v_indexers, method=method, tolerance=tolerance
    393     )
    394     # attach indexer's coordinate to pos_indexers

/gpfs/u/home/dcherian/python/xarray/xarray/core/indexing.py in remap_label_indexers(data_obj, indexers, method, tolerance)
    242     new_indexes = {}
    243
--> 244     dim_indexers = get_dim_indexers(data_obj, indexers)
    245     for dim, label in dim_indexers.items():
    246         try:

/gpfs/u/home/dcherian/python/xarray/xarray/core/indexing.py in get_dim_indexers(data_obj, indexers)
    208     ]
    209     if invalid:
--> 210         raise ValueError(f"dimensions or multi-index levels {invalid!r} do not exist")
    211
    212     level_indexers = defaultdict(dict)

ValueError: dimensions or multi-index levels ['depth'] do not exist
explore vertical reference frame#
full = full.set_coords("mld")
subset = (
    full.Jq.where(full.period.isin([2, 3]), drop=True)
    .sel(latitude=0, method="nearest")
    .load()
)
---------------------------------------------------------------------------
ValueError                                Traceback (most recent call last)
<ipython-input-28-9eb3951cab7a> in <module>
----> 1 subset = full.Jq.where(full.period.isin([2, 3]), drop=True).sel(latitude=0, method="nearest").load()

/gpfs/u/home/dcherian/python/xarray/xarray/core/dataarray.py in load(self, **kwargs)
    825         dask.array.compute
    826         """
--> 827         ds = self._to_temp_dataset().load(**kwargs)
    828         new = self._from_temp_dataset(ds)
    829         self._variable = new._variable

/gpfs/u/home/dcherian/python/xarray/xarray/core/dataset.py in load(self, **kwargs)
    654
    655             # evaluate all the dask arrays simultaneously
--> 656             evaluated_data = da.compute(*lazy_data.values(), **kwargs)
    657
    658             for k, data in zip(lazy_data, evaluated_data):

~/miniconda3/envs/dcpy/lib/python3.6/site-packages/dask/base.py in compute(*args, **kwargs)
    434     keys = [x.__dask_keys__() for x in collections]
    435     postcomputes = [x.__dask_postcompute__() for x in collections]
--> 436     results = schedule(dsk, keys, **kwargs)
    437     return repack([f(r, *a) for r, (f, a) in zip(results, postcomputes)])
    438

~/miniconda3/envs/dcpy/lib/python3.6/site-packages/distributed/client.py in get(self, dsk, keys, restrictions, loose_restrictions, resources, sync, asynchronous, direct, retries, priority, fifo_timeout, actors, **kwargs)
   2543                     should_rejoin = False
   2544             try:
-> 2545                 results = self.gather(packed, asynchronous=asynchronous, direct=direct)
   2546             finally:
   2547                 for f in futures.values():

~/miniconda3/envs/dcpy/lib/python3.6/site-packages/distributed/client.py in gather(self, futures, errors, direct, asynchronous)
   1843                 direct=direct,
   1844                 local_worker=local_worker,
-> 1845                 asynchronous=asynchronous,
   1846             )
   1847

~/miniconda3/envs/dcpy/lib/python3.6/site-packages/distributed/client.py in sync(self, func, asynchronous, callback_timeout, *args, **kwargs)
    760         else:
    761             return sync(
--> 762                 self.loop, func, *args, callback_timeout=callback_timeout, **kwargs
    763             )
    764

~/miniconda3/envs/dcpy/lib/python3.6/site-packages/distributed/utils.py in sync(loop, func, callback_timeout, *args, **kwargs)
    331     if error[0]:
    332         typ, exc, tb = error[0]
--> 333         raise exc.with_traceback(tb)
    334     else:
    335         return result[0]

~/miniconda3/envs/dcpy/lib/python3.6/site-packages/distributed/utils.py in f()
    315             if callback_timeout is not None:
    316                 future = gen.with_timeout(timedelta(seconds=callback_timeout), future)
--> 317             result[0] = yield future
    318         except Exception as exc:
    319             error[0] = sys.exc_info()

~/miniconda3/envs/dcpy/lib/python3.6/site-packages/tornado/gen.py in run(self)
    733
    734                     try:
--> 735                         value = future.result()
    736                     except Exception:
    737                         exc_info = sys.exc_info()

~/miniconda3/envs/dcpy/lib/python3.6/site-packages/distributed/client.py in _gather(self, futures, errors, direct, local_worker)
   1699                             exc = CancelledError(key)
   1700                         else:
-> 1701                             raise exception.with_traceback(traceback)
   1702                         raise exc
   1703                     if errors == "skip":

ValueError: Could not find dependent ('concatenate-1b799f6ffc8d416a5e1ec6ca81f5f186', 220, 0, 1, 2).  Check worker logs
mld_subset = mld.where(mld.period.isin([2, 3])).sel(latitude=0, method="nearest")
subset.sel(depth=slice(0, -200)).plot(x="time")
<matplotlib.collections.QuadMesh at 0x2b3a4f8fb278>
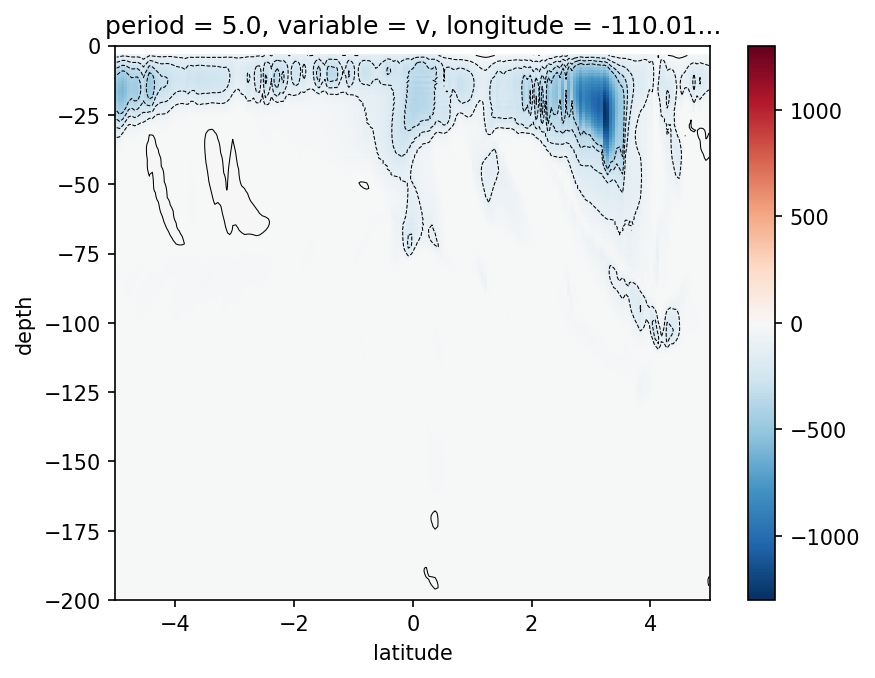
pump.composite.test_composite_algorithm(full, tao, period=5, debug=False)
/gpfs/u/home/dcherian/python/xarray/xarray/core/common.py:664: FutureWarning: This DataArray contains multi-dimensional coordinates. In the future, the dimension order of these coordinates will be restored as well unless you specify restore_coord_dims=False.
  self, group, squeeze=squeeze, restore_coord_dims=restore_coord_dims
/glade/u/home/dcherian/python/xfilter/xfilter/xfilter.py:175: UserWarning: The 'gappy' kwarg is now deprecated.
  warnings.warn("The 'gappy' kwarg is now deprecated.")
further compositing#
full = full.sel(depth=slice(0, -250)).chunk(
    {"depth": None, "latitude": "auto", "time": 48}
)
# calculate MLD before daily filter
mld = pump.calc.get_mld(full.dens)
kpp_mld = pump.calc.get_kpp_mld(full)
kpp_diff_depth = pump.calc.kpp_diff_depth(full.KPP_diffusivity)
full = full.assign(mld=mld, kpp_mld=kpp_mld, kpp_diff_depth=kpp_diff_depth)
# filtered = full.copy(deep=True)
# .chunk({"time": None, "latitude": None, "depth": 5}).pipe(
#    pump.utils.lowpass, "time", freq=0.5, cycles_per="D"
# )

# subset to periods
full_subset = full.where(full.period.isin(periods), drop=True)

anomalize_fields = ["u", "v", "w", "theta", "salt", "sst"]
to_anomalize = []
for var in full_subset.data_vars:
    if var in anomalize_fields:
        to_anomalize.append(var)

full_subset["uz"] = full_subset.u.differentiate("depth")
full_subset["vz"] = full_subset.v.differentiate("depth")

if len(to_anomalize) > 0:
    means = full_subset[to_anomalize].groupby("period").mean(anomalize_over[0])
    anomalies = full_subset.groupby("period") - means
    full_subset = full_subset.assign(anomalies)

full_subset["wT"] = full_subset.w * full_subset.theta
# depth masking

# NOTE: these depths are negative
# full_subset["mld_depth"] = kpp_diff_depth
full_subset["mld_depth"] = mld
full_subset = full_subset.assign_coords(euc_max=tao.euc_max.reset_coords(drop=True))
masked = full_subset.copy()
depth_mask = (
    (masked.depth < masked.mld_depth) & (masked.depth > full_subset.euc_max)
).sel(depth=slice(0, -250))

for var in subset_fields:
    masked[var] = (
        full_subset[var].sel(depth=slice(0, -250)).where(depth_mask).mean("depth")
    )

# composite = model_composite(gcm1, -110, [5, 6])
dask.config.set(fuse_ave_width=10)
<dask.config.set at 0x2ba39a778f28>
single period images#
p = full.where(full.period == 5, drop=True)
p["uz"] = p.u.differentiate("depth")
p["vz"] = p.v.differentiate("depth")
masked.Jq.load()
JobQueueCluster.scale_down was called with a number of worker greater than what is already running or pending.
JobQueueCluster.scale_down was called with a number of worker greater than what is already running or pending.
<xarray.DataArray 'Jq' (time: 895, latitude: 480)>
array([[-1.82363449, -1.79802843, -1.5902785 , ..., -2.93373322,
        -2.91159303,         nan],
       [-1.94964   , -1.80525469, -1.05023166, ..., -2.9250608 ,
        -2.91538393, -2.8971814 ],
       [-2.06606231, -1.62287225, -0.62342455, ..., -2.93574442,
        -3.05707785, -2.89194324],
       ...,
       [-2.23249162, -2.89254245, -2.82554901, ..., -2.85028037,
        -2.81443659, -2.83772281],
       [-2.24564543, -2.85735422, -2.82522369, ..., -2.84632142,
        -2.82359037, -2.88193586],
       [-2.39699863, -2.87838157, -2.89696535, ..., -2.88710673,
        -2.8675533 , -2.88754213]])
Coordinates:
    longitude  float32 -110.01001
  * latitude   (latitude) float32 -12.0 -11.949896 -11.899791 ... 11.949896 12.0
    variable   <U1 'v'
    yref       (time, latitude) float32 -4.4166665 -4.4 ... 6.517241 6.551724
    tiw_phase  (time) float64 0.0 3.462 6.923 10.38 ... 346.7 350.0 353.3 356.7
    period     (time) float64 2.0 2.0 2.0 2.0 2.0 2.0 ... 8.0 8.0 8.0 8.0 8.0
* time (time) datetime64[ns] 1995-09-08T20:00:00 ... 1996-02-26masked.KPP_diffusivity.load()
ERROR:dask_jobqueue.core:Unknown job_id: 3744660 for worker tcp://10.12.205.22:41210
ERROR:dask_jobqueue.core:Unknown job_id: 3744661 for worker tcp://10.12.205.19:38321
ERROR:dask_jobqueue.core:Unknown job_id: 3744663 for worker tcp://10.12.205.20:46438
ERROR:dask_jobqueue.core:Unknown job_id: 3744662 for worker tcp://10.12.205.20:43655
<xarray.DataArray 'KPP_diffusivity' (time: 895, latitude: 480)>
array([[2.16934641e-05, 2.61296118e-05, 2.82781384e-05, ...,
        1.00861098e-05, 1.00000025e-05,            nan],
       [1.48696772e-05, 1.85600911e-05, 2.78046755e-05, ...,
        1.00070320e-05, 1.00000025e-05, 1.00000025e-05],
       [1.13437463e-05, 1.74175802e-05, 3.36634293e-05, ...,
        1.00000016e-05, 1.16432275e-05, 1.00000025e-05],
       ...,
       [6.87011983e-04, 7.26291182e-05, 2.74807735e-05, ...,
        1.00413317e-05, 1.01499318e-05, 4.15229733e-05],
       [7.19422009e-04, 7.32370318e-05, 1.49488033e-05, ...,
        1.32856512e-05, 1.35556911e-05, 6.10679344e-05],
       [6.43753272e-04, 1.12700991e-05, 1.30987291e-05, ...,
        1.08987988e-05, 1.04452229e-05, 6.66509441e-05]], dtype=float32)
Coordinates:
    longitude  float32 -110.01001
  * latitude   (latitude) float32 -12.0 -11.949896 -11.899791 ... 11.949896 12.0
    variable   <U1 'v'
    yref       (time, latitude) float32 -4.4166665 -4.4 ... 6.517241 6.551724
    tiw_phase  (time) float64 0.0 3.462 6.923 10.38 ... 346.7 350.0 353.3 356.7
    period     (time) float64 2.0 2.0 2.0 2.0 2.0 2.0 ... 8.0 8.0 8.0 8.0 8.0
* time (time) datetime64[ns] 1995-09-08T20:00:00 ... 1996-02-26masked.Jq.plot(x="time", robust=True, cmap=mpl.cm.GnBu_r)
<matplotlib.collections.QuadMesh at 0x2adb05e96f60>
masked.Jq.plot(x="time", robust=False, vmax=0, cmap=mpl.cm.GnBu_r)
masked.sst.plot.contour(colors="k", x="time", levels=10, linewidths=0.4, ylim=[-5, 5])
<matplotlib.contour.QuadContourSet at 0x2adacf131358>
# subset = gcm1.full[["KPP_diffusivity"]].where(full.period == 5, drop=True)
kpp_mld = pump.calc.kpp_diff_depth(gcm1.tao.KPP_diffusivity)
min_mld = xr.where(gcm1.tao.mld > kpp_mld, gcm1.tao.mld, kpp_mld)
gcm1.tao.KPP_diffusivity.sel(longitude=-110, latitude=2).where(
    full.period == 5, drop=True
).plot(x="time", norm=mpl.colors.LogNorm(), robust=True)
kpp_mld.sel(longitude=-110, latitude=2).where(full.period == 5, drop=True).plot(
    color="w"
)
min_mld.sel(longitude=-110, latitude=2).where(full.period == 5, drop=True).plot(
    color="r"
)
[<matplotlib.lines.Line2D at 0x2b3c994c3668>]
/glade/u/home/dcherian/miniconda3/envs/dcpy/lib/python3.6/site-packages/matplotlib/colors.py:1110: RuntimeWarning: invalid value encountered in less_equal
  mask |= resdat <= 0
def phi_s(zeta, zetas, a, c):
    if zeta >= 0:  # unstable
        phi = 1.0 + 5 * zeta
    else:
        if zeta > zetas:
            phi = (1.0 - 16 * zeta) ** (-1 / 2)
        else:
            phi = (a - c * zeta) ** (-1 / 3)

    return phi


ustar = sqrt(sqrt(WVSURF ^ 2 + WUSURF ^ 2))
# similarity profile constants
zetas = -1.0
zetam = -0.2
cs = 24.0 * (1.0 - 16.0 * zetas) ** (0.50)
cm = 12.0 * (1.0 - 16.0 * zetam) ** (-0.25)

κ = 0.4  # von karman
ε = 0.1  # nondim extent of surface layer
Ric = 0.3  # critical bulk Ri
βT = -0.2  # from Bill Smyth
Cv = 1.5  # from Bill Smyth
a_s = cs * zetas + (1.0 - 16.0 * zetas) ** (1.50)
am = cm * zetam + (1.0 - 16.0 * zetam) ** (0.75)

w_s = κ * ustar / phi_s(zeta, zeta_s, a_s, cs)

Vt2 = Cv * np.sqrt(-βT) / Ric / κ**2 * 1 / np.sqrt(cs * ε) * d * N * ws

# Vtc = Cv*sqrt(-betaT)/(sqrt(cs*epsilon)*Ric*vonKar*vonKar);
---------------------------------------------------------------------------
NameError                                 Traceback (most recent call last)
<ipython-input-98-37cc670fdd5c> in <module>
     26 am = cm * zetam + (1.0 - 16.0 * zetam) ** (0.75)
     27
---> 28 w_s = κ * ustar / phi_s(zeta, zeta_s, a_s, cs)
     29
     30 Vt2 = Cv * np.sqrt(-βT) / Ric / κ ** 2 * 1 / np.sqrt(cs * ε) * d * N * ws

NameError: name 'ustar' is not defined
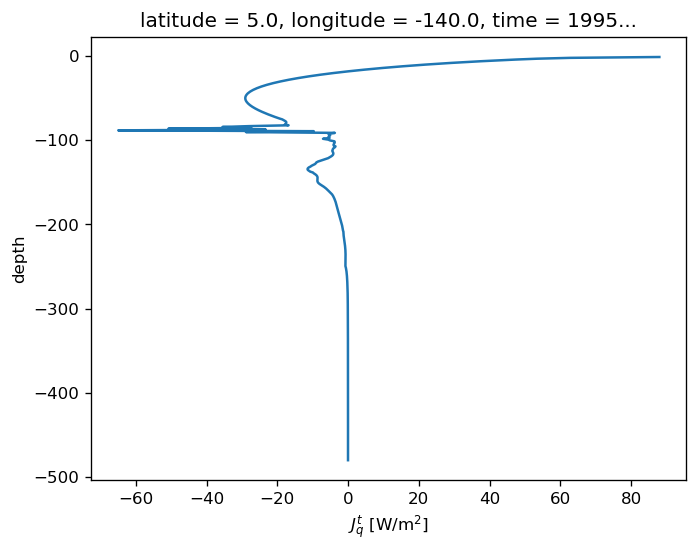
subset = gcm1.tao.sel(latitude=5, longitude=-140, time="1995-11-16 16:00")

pump.calc.kpp_diff_depth(subset.KPP_diffusivity, debug=True)
dcpy.plots.liney(subset.mld)
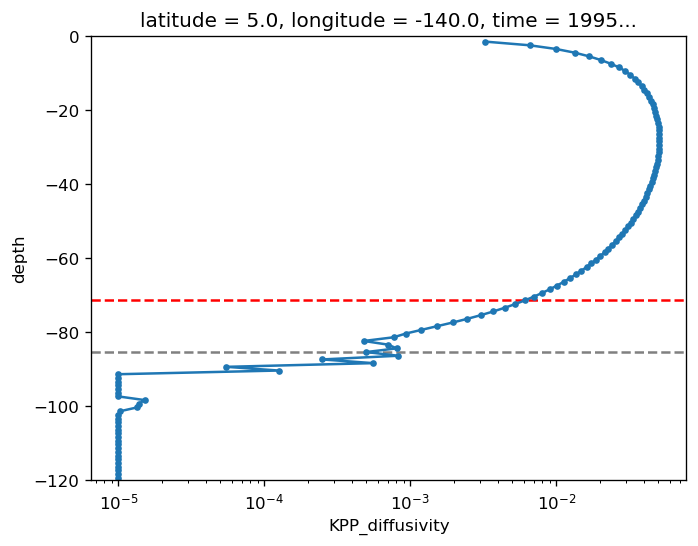
subset.Jq.plot(y="depth")
[<matplotlib.lines.Line2D at 0x2b3c8a109c88>]
JobQueueCluster.scale_down was called with a number of worker greater than what is already running or pending.
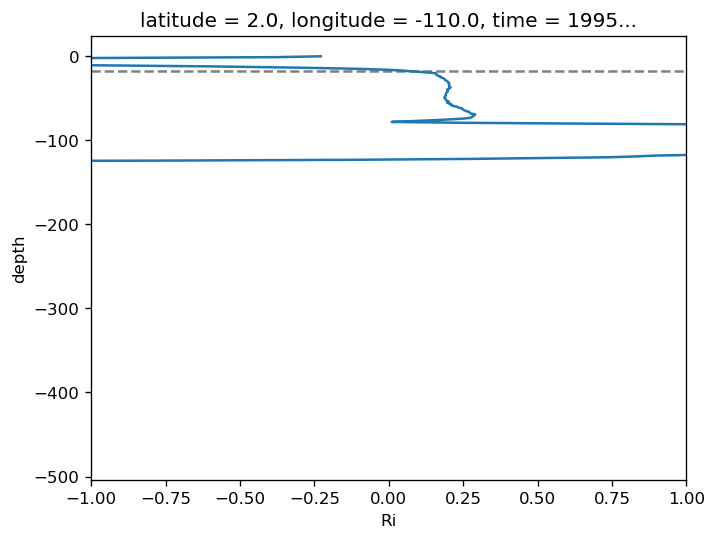
subset.Ri.plot(y="depth", xlim=[-1, 1])
.sel(latitude=2, method="nearest").plot(x="time")
JobQueueCluster.scale_down was called with a number of worker greater than what is already running or pending.
JobQueueCluster.scale_down was called with a number of worker greater than what is already running or pending.
JobQueueCluster.scale_down was called with a number of worker greater than what is already running or pending.
Unknown job_id: 3744589 for worker tcp://10.12.205.18:43702
<matplotlib.collections.QuadMesh at 0x2adada1d5898>
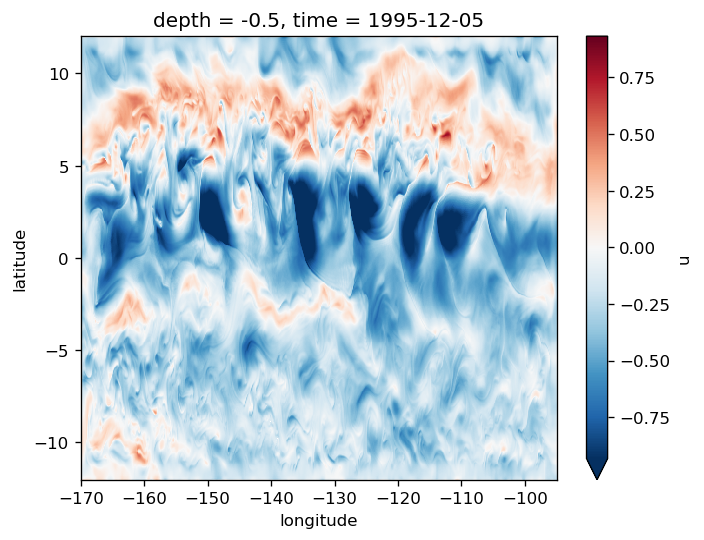
gcm1.surface.u.sel(time="1995-12-05 00:00", method="nearest").plot(robust=True)
<matplotlib.collections.QuadMesh at 0x2ae737bfac50>
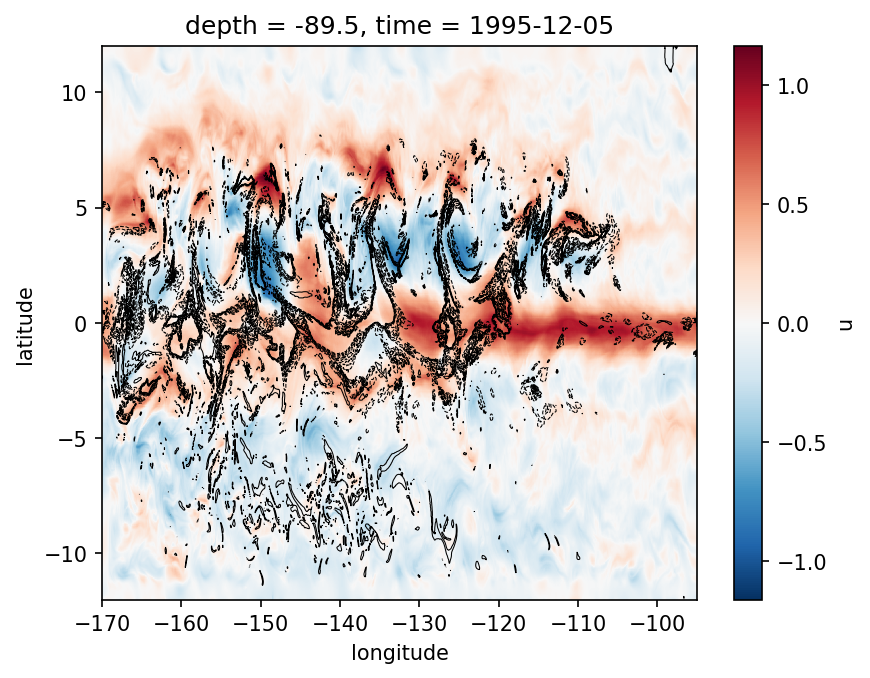
gcm1.full.u.sel(**region).sel(depth=-90, method="nearest").plot()
gcm1.budget.Jq.sel(**region).sel(depth=-90, method="nearest").plot.contour(
    levels=12, robust=True, linewidths=0.5, colors="k"
)
JobQueueCluster.scale_down was called with a number of worker greater than what is already running or pending.
JobQueueCluster.scale_down was called with a number of worker greater than what is already running or pending.
<matplotlib.contour.QuadContourSet at 0x2ad70a2ee898>
JobQueueCluster.scale_down was called with a number of worker greater than what is already running or pending.
p.kpp_diff_depth
---------------------------------------------------------------------------
AttributeError                            Traceback (most recent call last)
<ipython-input-195-907c4699e4a3> in <module>
----> 1 p.kpp_diff_depth

/gpfs/u/home/dcherian/python/xarray/xarray/core/common.py in __getattr__(self, name)
    226                     return source[name]
    227         raise AttributeError(
--> 228             "{!r} object has no attribute {!r}".format(type(self).__name__, name)
    229         )
    230

AttributeError: 'Dataset' object has no attribute 'kpp_diff_depth'
p.u.load()
p.Jq.load()
p.mld.load();
region = dict(time="1995-12-05 00:00", method="nearest")

(
    p.Jq.sel(**region).plot(
        y="depth", ylim=[-500, 0], xlim=[-6, 6], robust=True, cmap=mpl.cm.GnBu
    )
)
(p.mld.sel(**region).plot(color="r", x="latitude"))
(p.kpp_diff_depth.sel(**region).plot(color="g", x="latitude"))
(p.u.sel(**region).plot.contour(levels=20, colors="k"))
# (p.dens.sel(**region).plot.contour(levels=24, ylim=[-500, 0], colors='w', y="depth"))
JobQueueCluster.scale_down was called with a number of worker greater than what is already running or pending.
JobQueueCluster.scale_down was called with a number of worker greater than what is already running or pending.
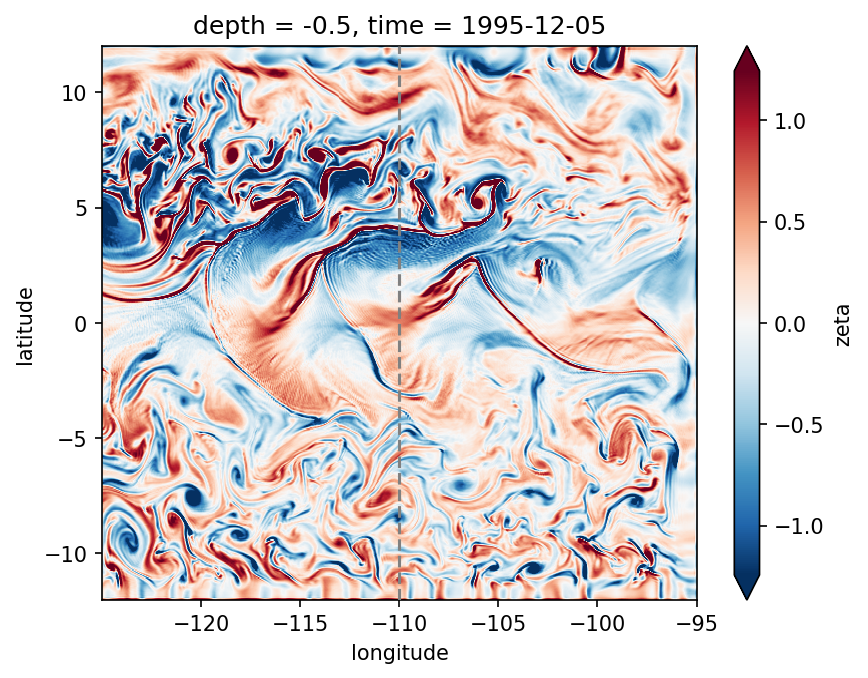
gcm1.surface.zeta.sel(**region).sel(longitude=slice(-125, -95)).plot(robust=True)
dcpy.plots.linex(-110, zorder=10)
J = (
    p.Jq.sel(**region)
    .sel(depth=slice(0, -200), latitude=slice(-5, 5))
    .rolling(depth=4, center=True)
    .mean()
)
J.plot(y="depth")
J.plot.contour(colors="k", levels=5, linewidths=0.5, robust=True)
<matplotlib.contour.QuadContourSet at 0x2ad716165198>
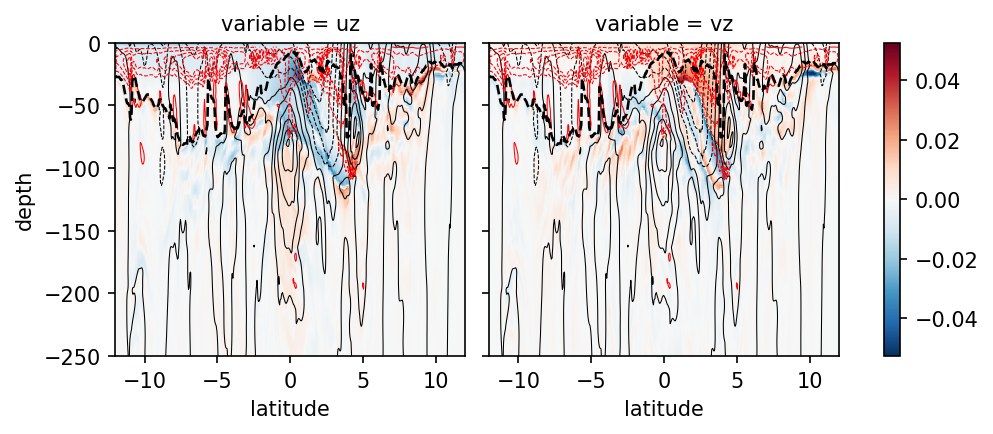
shears#
mpl.rcParams["figure.dpi"] = 150
# p.uz.sel(**region).plot(robust=True, ylim=[-500, 0])
fg = p[["uz", "vz"]].to_array().sel(**region).plot(col="variable", ylim=[-500, 0])
J = p.Jq.sel(**region).sel(depth=slice(0, -200)).rolling(depth=4, center=True).mean()

for ax in fg.axes.flat:
    p.u.sel(**region).plot.contour(
        ax=ax, levels=12, colors="k", linewidths=0.5, add_labels=False
    )
    J.plot.contour(
        colors="r", levels=5, linewidths=0.5, robust=True, ax=ax, add_labels=False
    )
    p.mld.sel(**region).plot(ls="--", lw=1.25, color="k", ax=ax, _labels=False)

ax.set_ylim([-250, 0])
# p.Jq.sel(**region).rolling(depth=4).mean().plot.contour(levels=20, robust=True, colors='k')
(-250, 0)
(
    p.Jq.mean("depth")
    .rolling(time=12, center=True)
    .mean()
    .dropna("time")
    .plot(x="time", robust=True, cmap=mpl.cm.GnBu, vmax=0)
)
<matplotlib.collections.QuadMesh at 0x2ad72abb9358>
cluster.close()
distributed.client - ERROR - Failed to reconnect to scheduler after 10.00 seconds, closing client
distributed.utils - ERROR -
Traceback (most recent call last):
  File "/glade/u/home/dcherian/miniconda3/envs/dcpy/lib/python3.6/site-packages/distributed/utils.py", line 662, in log_errors
    yield
  File "/glade/u/home/dcherian/miniconda3/envs/dcpy/lib/python3.6/site-packages/distributed/client.py", line 1290, in _close
    await gen.with_timeout(timedelta(seconds=2), list(coroutines))
concurrent.futures._base.CancelledError
distributed.utils - ERROR -
Traceback (most recent call last):
  File "/glade/u/home/dcherian/miniconda3/envs/dcpy/lib/python3.6/site-packages/distributed/utils.py", line 662, in log_errors
    yield
  File "/glade/u/home/dcherian/miniconda3/envs/dcpy/lib/python3.6/site-packages/distributed/client.py", line 1019, in _reconnect
    await self._close()
  File "/glade/u/home/dcherian/miniconda3/envs/dcpy/lib/python3.6/site-packages/distributed/client.py", line 1290, in _close
    await gen.with_timeout(timedelta(seconds=2), list(coroutines))
concurrent.futures._base.CancelledError
full.theta.groupby("period").plot(col="period", col_wrap=4, x="time")
<xarray.plot.facetgrid.FacetGrid at 0x2ad71b117780>
actually composite#
masked.yref.load()
<xarray.DataArray 'yref' (time: 749, latitude: 480)>
array([[-3.056818 , -3.0454545, -3.0340908, ...,  7.4285703,  7.4642854,
         7.4999995],
       [-3.056818 , -3.0454545, -3.0340908, ...,  7.4285703,  7.4642854,
         7.4999995],
       [-3.056818 , -3.0454545, -3.0340908, ...,  7.4285703,  7.4642854,
         7.4999995],
       ...,
       [-3.8333335, -3.818182 , -3.8030303, ...,  5.209302 ,  5.232558 ,
         5.2558136],
       [-3.8333335, -3.818182 , -3.8030303, ...,  5.209302 ,  5.232558 ,
         5.2558136],
       [-3.8333335, -3.818182 , -3.8030303, ...,  5.209302 ,  5.232558 ,
         5.2558136]], dtype=float32)
Coordinates:
  * time       (time) datetime64[ns] 1995-10-02T12:00:00 ... 1996-02-04T04:00:00
    tiw_phase  (time) float64 0.0 1.875 3.75 5.625 ... 343.6 347.7 351.8 355.9
    yref       (time, latitude) float32 -3.056818 -3.0454545 ... 5.2558136
  * latitude   (latitude) float32 -12.0 -11.949896 -11.899791 ... 11.949896 12.0
    period     (time) float64 2.0 2.0 2.0 2.0 2.0 2.0 ... 6.0 6.0 6.0 6.0 6.0
    longitude  float32 -110.01001
    euc_max    (time) float64 -84.5 -83.5 -82.5 -82.5 ... -89.5 -89.5 -89.5
mld_comp2 = pump.composite.make_composite(masked.chunk({"latitude": None}))
/gpfs/u/home/dcherian/python/xarray/xarray/core/common.py:664: FutureWarning: This DataArray contains multi-dimensional coordinates. In the future, the dimension order of these coordinates will be restored as well unless you specify restore_coord_dims=False.
  self, group, squeeze=squeeze, restore_coord_dims=restore_coord_dims
distributed.scheduler - ERROR - Workers don't have promised key: ['tcp://10.12.205.11:38892'], ('xarray-period-bed0002bc7abd172ef39cab33b6b6526', 0)
NoneType: None
distributed.scheduler - ERROR - Workers don't have promised key: ['tcp://10.12.205.11:38892'], ('xarray-period-bed0002bc7abd172ef39cab33b6b6526', 0)
NoneType: None
distributed.scheduler - ERROR - Workers don't have promised key: ['tcp://10.12.205.11:38892'], ('xarray-period-bed0002bc7abd172ef39cab33b6b6526', 0)
NoneType: None
distributed.scheduler - ERROR - Workers don't have promised key: ['tcp://10.12.205.11:38892'], ('xarray-period-bed0002bc7abd172ef39cab33b6b6526', 0)
NoneType: None
distributed.scheduler - ERROR - Workers don't have promised key: ['tcp://10.12.205.11:38892'], ('xarray-period-bed0002bc7abd172ef39cab33b6b6526', 0)
NoneType: None
distributed.scheduler - ERROR - Workers don't have promised key: ['tcp://10.12.205.11:38892'], ('xarray-period-bed0002bc7abd172ef39cab33b6b6526', 0)
NoneType: None
distributed.scheduler - ERROR - Workers don't have promised key: ['tcp://10.12.205.11:38892'], ('xarray-period-bed0002bc7abd172ef39cab33b6b6526', 0)
NoneType: None
mld_comp2.Jq.load()
<xarray.Dataset>
Dimensions: (period: 5, tiw_phase_bins: 71, yref: 800)
Coordinates:
* tiw_phase_bins (tiw_phase_bins) object (0, 5] (5, 10] ... (350, 355]
longitude float32 -110.01001
* yref (yref) float64 -4.0 -3.99 -3.98 -3.97 ... 3.97 3.98 3.99
* period (period) float64 2.0 3.0 4.0 5.0 6.0
mean_lat (yref) float64 -12.0 -12.0 -12.0 -12.0 ... 7.275 7.29 7.305
Data variables:
avg_full (tiw_phase_bins, yref) float64 -0.7301 -0.6899 ... -9.999
dev (tiw_phase_bins, yref) float64 0.01982 0.01669 ... 5.923
err (tiw_phase_bins, yref) float64 0.008864 0.007466 ... 2.649
avg (tiw_phase_bins, yref) float64 -0.7301 -0.6899 ... -9.999
Attributes:
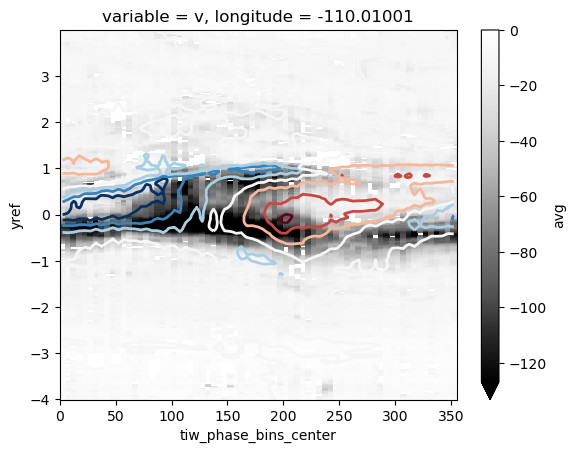
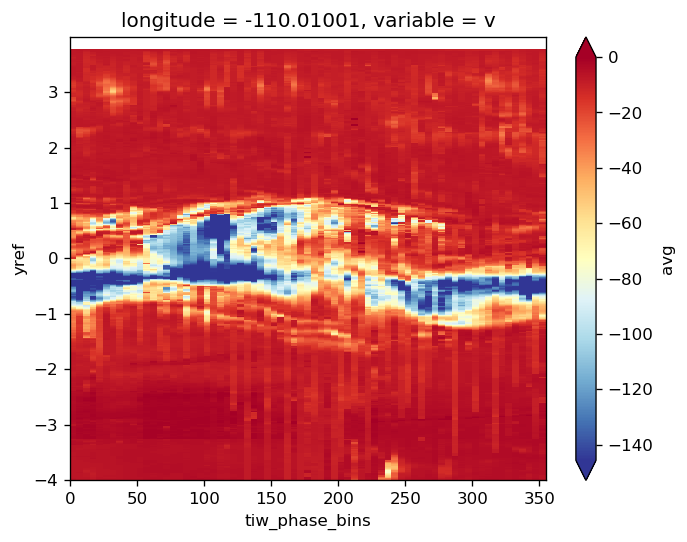
name: Jqmld_comp2.plot("Jq", filter=True, cmap=mpl.cm.GnBu_r, vmax=0)
<matplotlib.collections.QuadMesh at 0x2b8bf710d898>
kpp_comp = pump.composite.make_composite(masked.chunk({"latitude": None}))
/gpfs/u/home/dcherian/python/xarray/xarray/core/common.py:665: FutureWarning: This DataArray contains multi-dimensional coordinates. In the future, the dimension order of these coordinates will be restored as well unless you specify restore_coord_dims=False.
  self, group, squeeze=squeeze, restore_coord_dims=restore_coord_dims
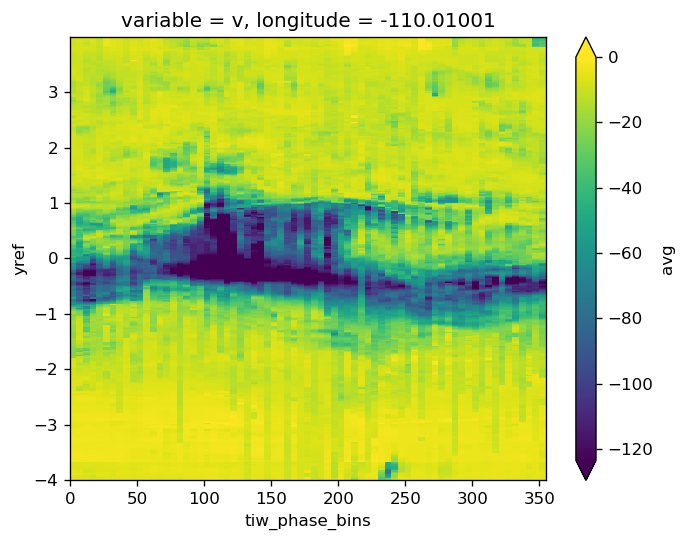
kpp_comp.plot("Jq", filter=True, cmap=mpl.cm.GnBu_r, vmax=0)
<matplotlib.collections.QuadMesh at 0x2ba475728d68>
mld_comp = comp
masked["mld_depth"] = masked.mld_depth.persist()
cluster.adapt(maximum=64)
<distributed.deploy.adaptive.Adaptive at 0x2ba3991f2e48>
comp.load(["sst", "ssvor", "Jq"])
Difference between KPP MLD and Δρ MLD is small [O(10 W/m²)]
(mld_comp.data["Jq"].avg - kpp_comp.data["Jq"].avg).plot(
    x="tiw_phase_bins", y="mean_lat", robust=True
)
<matplotlib.collections.QuadMesh at 0x2ba4744da588>
comp.plot("Jq", filter=True, cmap=mpl.cm.GnBu_r, vmax=0)

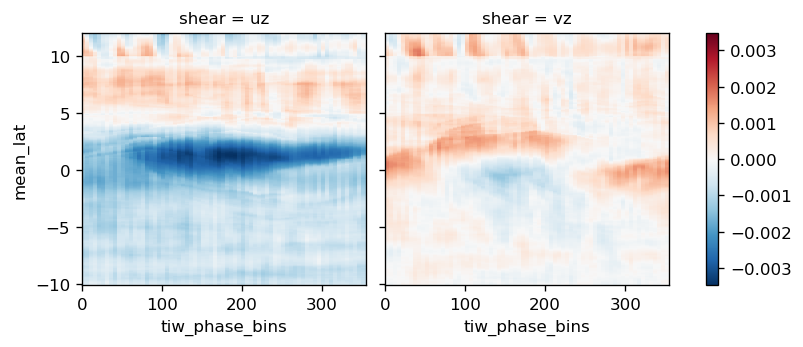
ds = xr.Dataset()
ds["uz"] = comp.uz.avg_full
ds["vz"] = comp.vz.avg_full
ds.to_array("shear").mean("depth").plot(
    col="shear", x="tiw_phase_bins", y="mean_lat", robust=False
)
<xarray.plot.facetgrid.FacetGrid at 0x2b3c860aa278>
sub = gcm1.tao.v.sel(
    longitude=-110, depth=slice(-10, -80), time=slice(None, "1996-03-01")
).mean("depth")
dcpy.ts.PlotSpectrum(sub, coord="time")
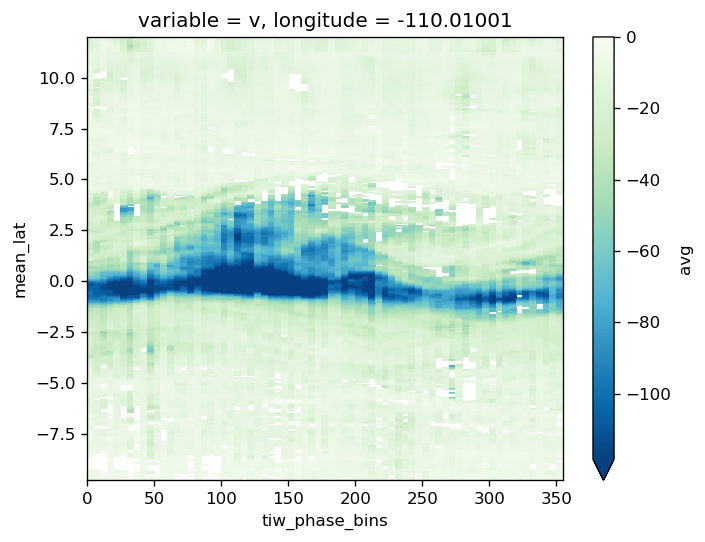
(comp.Jq.avg - comp.Jq.avg.mean("tiw_phase_bins")).plot(
    y="mean_lat", x="tiw_phase_bins", robust=True
)
<matplotlib.collections.QuadMesh at 0x2ba45b7ee588>
comp.load("mld")
comp.plot("Jq", filter=True, vmax=0, cmap=mpl.cm.GnBu_r)
comp.overlay_contours("sst")
plt.ylim([-7, 7])
f.savefig("images/tiw-composite-Jq-110.png")
%matplotlib inline

kwargs = dict(x="tiw_phase_bins", y="mean_lat", ylim=[-6, 6])
comp.Jq.avg.plot(robust=True, vmax=0, cmap=mpl.cm.GnBu_r, **kwargs)
comp.sst.avg_full.plot.contour(**kwargs, linewidths=1.5, robust=True)
<matplotlib.contour.QuadContourSet at 0x2ba465b72e48>
JobQueueCluster.scale_down was called with a number of worker greater than what is already running or pending.
(comp.vz.avg**2)..mean("depth").plot(x="tiw_phase_bins", robust=True, y="mean_lat")
<matplotlib.collections.QuadMesh at 0x2ba4116df6a0>
(comp.uz**2).mean("depth").avg.plot(x="tiw_phase_bins", robust=True, y="mean_lat")
<matplotlib.collections.QuadMesh at 0x2ba35f3d63c8>
comp.load(["uz", "vz", "u", "v"])
JobQueueCluster.scale_down was called with a number of worker greater than what is already running or pending.
JobQueueCluster.scale_down was called with a number of worker greater than what is already running or pending.
cluster.adapt(minimum=2, maximum=64, wait_count=300)
<distributed.deploy.adaptive.Adaptive at 0x2aea48a790b8>
composite_backup = composite
This next figure is back from when I was using a Δρ MLD criterion. Note the large numbers!
composite["Jq"].avg.plot(y="yref", robust=True, vmax=0, cmap=mpl.cm.Greys_r)
composite["sst"].avg_full.plot.contour(y="yref", linewidths=2, robust=True)
<matplotlib.contour.QuadContourSet at 0x2aebb9445518>
composite_backup["Jq"].mean("depth").avg.plot(y="yref", robust=True, vmax=0)
<matplotlib.collections.QuadMesh at 0x2aebd41f7e80>
tanom = full_subset.theta.groupby("period") - means.theta
tanom
/gpfs/u/home/dcherian/python/xarray/xarray/core/common.py:674: FutureWarning: This DataArray contains multi-dimensional coordinates. In the future, the dimension order of these coordinates will be restored as well unless you specify restore_coord_dims=False.
  self, group, squeeze=squeeze, restore_coord_dims=restore_coord_dims
<xarray.DataArray 'theta' (time: 340, depth: 345, latitude: 480)>
dask.array<transpose, shape=(340, 345, 480), dtype=float32, chunksize=(1, 322, 480)>
Coordinates:
    variable   <U1 'v'
    longitude  float32 -110.01001
  * depth      (depth) float64 -0.5 -1.5 -2.5 ... -5.666e+03 -5.766e+03
  * latitude   (latitude) float32 -12.0 -11.949896 -11.899791 ... 11.949896 12.0
  * time       (time) datetime64[ns] 1995-11-19T20:00:00 ... 1996-01-15T08:00:00
    tiw_phase  (time) float32 0.0 2.3076923 4.6153846 ... 354.70587 357.35294
    period     (time) float32 5.0 5.0 5.0 5.0 5.0 5.0 ... 6.0 6.0 6.0 6.0 6.0
    yref       (time, latitude) float32 dask.array<chunksize=(148, 480), meta=np.ndarray>
full.yref.where(full.period.isin([5, 6])).mean("time").compute()
<xarray.DataArray 'yref' (latitude: 480)>
array([-5.07444763e+00, -5.05424070e+00, -5.03398991e+00, -5.01376867e+00,
       -4.99351597e+00, -4.97330904e+00, -4.95305824e+00, -4.93281269e+00,
       -4.91259956e+00, -4.89234066e+00, -4.87212706e+00, -4.85187674e+00,
       -4.83163261e+00, -4.81141853e+00, -4.79117393e+00, -4.77094555e+00,
       -4.75070000e+00, -4.73048496e+00, -4.71024084e+00, -4.68999243e+00,
       -4.66978216e+00, -4.64953375e+00, -4.62930393e+00, -4.60906029e+00,
       -4.58884478e+00, -4.56860161e+00, -4.54835320e+00, -4.52814102e+00,
       -4.50787783e+00, -4.48766708e+00, -4.46741867e+00, -4.44717693e+00,
       -4.42696095e+00, -4.40671301e+00, -4.38648558e+00, -4.36623907e+00,
       -4.34602594e+00, -4.32577991e+00, -4.30553913e+00, -4.28531837e+00,
       -4.26507807e+00, -4.24484396e+00, -4.22460127e+00, -4.20438385e+00,
       -4.18414402e+00, -4.16389751e+00, -4.14367962e+00, -4.12342262e+00,
       -4.10320377e+00, -4.08296251e+00, -4.06271696e+00, -4.04250288e+00,
       -4.02225780e+00, -4.00202465e+00, -3.98178172e+00, -3.96156430e+00,
       -3.94132185e+00, -3.92107964e+00, -3.90086174e+00, -3.88061953e+00,
       -3.86038470e+00, -3.84014106e+00, -3.81992221e+00, -3.79968071e+00,
       -3.77944183e+00, -3.75922036e+00, -3.73896456e+00, -3.71874309e+00,
       -3.69850039e+00, -3.67826462e+00, -3.65804267e+00, -3.63780379e+00,
       -3.61756134e+00, -3.59732676e+00, -3.57709813e+00, -3.55686331e+00,
       -3.53662515e+00, -3.51640153e+00, -3.49616456e+00, -3.47591972e+00,
       -3.45568275e+00, -3.43545818e+00, -3.41522431e+00, -3.39498496e+00,
       -3.37476301e+00, -3.35450363e+00, -3.33428097e+00, -3.31404209e+00,
       -3.29380965e+00, -3.27358365e+00, -3.25334835e+00, -3.23309946e+00,
       -3.21286631e+00, -3.19263697e+00, -3.17240357e+00, -3.15217352e+00,
       -3.13194156e+00, -3.11170936e+00, -3.09145713e+00, -3.07122374e+00,
       -3.05099368e+00, -3.03076506e+00, -3.01053023e+00, -2.99030066e+00,
       -2.97004843e+00, -2.94981837e+00, -2.92958498e+00, -2.90935540e+00,
       -2.88912439e+00, -2.86888933e+00, -2.84863806e+00, -2.82840800e+00,
       -2.80817413e+00, -2.78794456e+00, -2.76771522e+00, -2.74748039e+00,
       -2.72725153e+00, -2.70700049e+00, -2.68676496e+00, -2.66653633e+00,
       -2.64630437e+00, -2.62606859e+00, -2.60583973e+00, -2.58558965e+00,
       -2.56536078e+00, -2.54512501e+00, -2.52489614e+00, -2.50466704e+00,
       -2.48443103e+00, -2.46418214e+00, -2.44395328e+00, -2.42371368e+00,
       -2.40348482e+00, -2.38325548e+00, -2.36301804e+00, -2.34278917e+00,
       -2.32254243e+00, -2.30230570e+00, -2.28207660e+00, -2.26184750e+00,
       -2.24160910e+00, -2.22137976e+00, -2.20113516e+00, -2.18090320e+00,
       -2.16066527e+00, -2.14043641e+00, -2.12020588e+00, -2.09996819e+00,
       -2.07972479e+00, -2.05949569e+00, -2.03925753e+00, -2.01902795e+00,
       -1.99879706e+00, -1.97855866e+00, -1.95832884e+00, -1.93808544e+00,
       -1.91784692e+00, -1.89761591e+00, -1.87738705e+00, -1.85714686e+00,
       -1.83691657e+00, -1.81667888e+00, -1.79644883e+00, -1.77620721e+00,
       -1.75597823e+00, -1.73574758e+00, -1.71550596e+00, -1.69526982e+00,
       -1.67503917e+00, -1.65479827e+00, -1.63456726e+00, -1.61433649e+00,
       -1.59409595e+00, -1.57386458e+00, -1.55363154e+00, -1.53338945e+00,
       -1.51315832e+00, -1.49292922e+00, -1.47268438e+00, -1.45245302e+00,
       -1.43222415e+00, -1.41199124e+00, -1.39174771e+00, -1.37151885e+00,
       -1.35128689e+00, -1.33104682e+00, -1.31081331e+00, -1.29058123e+00,
       -1.27034163e+00, -1.25010884e+00, -1.22987640e+00, -1.20963740e+00,
       -1.18940330e+00, -1.16917038e+00, -1.14893210e+00, -1.12869930e+00,
       -1.10847032e+00, -1.08822846e+00, -1.06799376e+00, -1.04776406e+00,
       -1.02753031e+00, -1.00728965e+00, -9.87060070e-01, -9.66825485e-01,
       -9.46589291e-01, -9.26354468e-01, -9.06119645e-01, -8.85885596e-01,
       -8.65650237e-01, -8.45414758e-01, -8.25180769e-01, -8.04944754e-01,
       -7.84708560e-01, -7.64478087e-01, -7.44240284e-01, -7.24009335e-01,
       -7.03772843e-01, -6.83536053e-01, -6.63304687e-01, -6.43068433e-01,
       -6.22831762e-01, -6.02600753e-01, -5.82363248e-01, -5.62131643e-01,
       -5.41896164e-01, -5.21660149e-01, -5.01426339e-01, -4.81191158e-01,
       -4.60955769e-01, -4.40720558e-01, -4.20486361e-01, -4.00251776e-01,
       -3.80018651e-01, -3.59781444e-01, -3.39547336e-01, -3.19313943e-01,
       -2.99080014e-01, -2.78843164e-01, -2.58609056e-01, -2.38375604e-01,
       -2.18140483e-01, -1.97906017e-01, -1.77670568e-01, -1.57437071e-01,
       -1.37201384e-01, -1.16967715e-01, -9.67318565e-02, -8.22502896e-02,
       -6.77671358e-02, -5.32851890e-02, -3.88034768e-02, -2.43212692e-02,
       -9.83892567e-03,  4.64318041e-03,  1.91251524e-02,  3.36075611e-02,
        4.80895564e-02,  6.25717789e-02,  7.70538375e-02,  9.15359110e-02,
        1.06018394e-01,  1.20500498e-01,  1.34982437e-01,  1.49464458e-01,
        1.63946673e-01,  1.80691332e-01,  1.97437018e-01,  2.14181513e-01,
        2.30926305e-01,  2.47670770e-01,  2.64416724e-01,  2.81161427e-01,
        2.97906458e-01,  3.14651072e-01,  3.31396520e-01,  3.48141134e-01,
        3.64885747e-01,  3.81630361e-01,  3.98374945e-01,  4.15119529e-01,
        4.31864440e-01,  4.48609382e-01,  4.65353876e-01,  4.82098430e-01,
        4.98842925e-01,  5.15589714e-01,  5.32334208e-01,  5.49078703e-01,
        5.65823197e-01,  5.82567692e-01,  5.99312186e-01,  6.16056740e-01,
        6.32801056e-01,  6.49551988e-01,  6.66296422e-01,  6.83041394e-01,
        6.99785769e-01,  7.16530859e-01,  7.33275056e-01,  7.50020206e-01,
        7.66764402e-01,  7.83509910e-01,  8.00254345e-01,  8.16998541e-01,
        8.33743572e-01,  8.50487232e-01,  8.67232621e-01,  8.83976042e-01,
        9.00722027e-01,  9.17469800e-01,  9.34211195e-01,  9.50959444e-01,
        9.67700303e-01,  9.84448969e-01,  1.00118947e+00,  1.01793838e+00,
        1.03467870e+00,  1.05142808e+00,  1.06816804e+00,  1.08491719e+00,
        1.10165691e+00,  1.11840701e+00,  1.13514805e+00,  1.15189707e+00,
        1.16864026e+00,  1.18538940e+00,  1.20212972e+00,  1.21887934e+00,
        1.23561788e+00,  1.25236785e+00,  1.26910758e+00,  1.28585792e+00,
        1.30259573e+00,  1.31934619e+00,  1.33608556e+00,  1.35283637e+00,
        1.36957347e+00,  1.38632464e+00,  1.40306365e+00,  1.41981494e+00,
        1.43656528e+00,  1.45330310e+00,  1.47005582e+00,  1.48679352e+00,
        1.50354385e+00,  1.52028179e+00,  1.53703451e+00,  1.55377197e+00,
        1.57052124e+00,  1.58726120e+00,  1.60401320e+00,  1.62075055e+00,
        1.63749897e+00,  1.65424109e+00,  1.67099214e+00,  1.68772960e+00,
        1.70447695e+00,  1.72122061e+00,  1.73797107e+00,  1.75470781e+00,
        1.77145422e+00,  1.78819978e+00,  1.80494940e+00,  1.82168603e+00,
        1.83843172e+00,  1.85517919e+00,  1.87192762e+00,  1.88866413e+00,
        1.90540910e+00,  1.92215824e+00,  1.93890619e+00,  1.95565331e+00,
        1.97240138e+00,  1.98914790e+00,  2.00588393e+00,  2.02262998e+00,
        2.03937960e+00,  2.05612588e+00,  2.07286310e+00,  2.08960938e+00,
        2.10636258e+00,  2.12310529e+00,  2.13984275e+00,  2.15658569e+00,
        2.17334056e+00,  2.19008327e+00,  2.20682001e+00,  2.22356462e+00,
        2.24032068e+00,  2.25706291e+00,  2.27379966e+00,  2.29054093e+00,
        2.30729818e+00,  2.32403970e+00,  2.34077668e+00,  2.35752034e+00,
        2.37427878e+00,  2.39101982e+00,  2.40775681e+00,  2.42449617e+00,
        2.44125605e+00,  2.45799661e+00,  2.47473884e+00,  2.49149966e+00,
        2.50824165e+00,  2.52497697e+00,  2.54171872e+00,  2.55847669e+00,
        2.57521820e+00,  2.59195352e+00,  2.60869455e+00,  2.62545753e+00,
        2.64219880e+00,  2.65893412e+00,  2.67567492e+00,  2.69243407e+00,
        2.70917487e+00,  2.72591019e+00,  2.74265075e+00,  2.75941515e+00,
        2.77615547e+00,  2.79289103e+00,  2.80963087e+00,  2.82639146e+00,
        2.84313130e+00,  2.85986686e+00,  2.87660646e+00,  2.89337277e+00,
        2.91011238e+00,  2.92684793e+00,  2.94358706e+00,  2.96034861e+00,
        2.97708821e+00,  2.99382567e+00,  3.01059294e+00,  3.02733183e+00,
        3.04407001e+00,  3.06080747e+00,  3.07757425e+00,  3.09431338e+00,
        3.11104512e+00,  3.12778187e+00,  3.14454818e+00,  3.16128612e+00,
        3.17802954e+00,  3.19476819e+00,  3.21153212e+00,  3.22827029e+00,
        3.24500203e+00,  3.26173949e+00,  3.27850294e+00,  3.29524040e+00,
        3.31198883e+00,  3.32872629e+00,  3.34548998e+00,  3.36222720e+00,
        3.37895823e+00,  3.39569569e+00,  3.41245842e+00,  3.42919493e+00,
        3.44594765e+00,  3.46268487e+00,  3.47944689e+00,  3.49618411e+00,
        3.51291513e+00,  3.52967739e+00,  3.54641318e+00,  3.56316876e+00,
        3.57990575e+00,  3.59666777e+00,  3.61340332e+00,  3.63014126e+00,
        3.64687181e+00,  3.66363311e+00,  3.68036795e+00,  3.69712853e+00,
        3.71386504e+00,  3.73062396e+00,  3.74736071e+00,  3.76409698e+00],
      dtype=float32)
Coordinates:
  * latitude   (latitude) float32 -12.0 -11.949896 -11.899791 ... 11.949896 12.0
    longitude  float32 -110.01001
    variable   <U1 'v'
tanom.isel(depth=1).plot(x="time", robust=True)
<matplotlib.collections.QuadMesh at 0x2aeacf2d54e0>
grouped = masked[["u", "v", "salt", "theta"]].groupby("period").mean("time")
composite = pump.composite.make_composite(masked)
> /glade/u/home/dcherian/pump/pump/composite.py(123)make_composite()
    121     import IPython; IPython.core.debugger.set_trace()
    122
--> 123     phase_grouped = interped.groupby_bins("tiw_phase", np.arange(0, 360, 5))
    124     data_vars = data.data_vars
    125     composite = {name: xr.Dataset(attrs={"name": name}) for name in data_vars}

ipdb> interped
<xarray.Dataset>
Dimensions:          (depth: 345, time: 340, yref: 800)
Coordinates:
  * time             (time) datetime64[ns] 1995-11-19T20:00:00 ... 1996-01-15T08:00:00
    longitude        float32 -110.01001
    variable         <U1 'v'
    tiw_phase        (time) float32 0.0 2.3076923 ... 354.70587 357.35294
    period           (time) float32 5.0 5.0 5.0 5.0 5.0 ... 6.0 6.0 6.0 6.0 6.0
  * depth            (depth) float64 -0.5 -1.5 -2.5 ... -5.666e+03 -5.766e+03
  * yref             (yref) float64 -4.0 -3.99 -3.98 -3.97 ... 3.97 3.98 3.99
Data variables:
    theta            (time, depth, yref) float64 dask.array<chunksize=(1, 322, 800), meta=np.ndarray>
    u                (time, depth, yref) float64 dask.array<chunksize=(1, 322, 800), meta=np.ndarray>
    v                (time, depth, yref) float64 dask.array<chunksize=(1, 322, 800), meta=np.ndarray>
    w                (time, depth, yref) float64 dask.array<chunksize=(1, 322, 800), meta=np.ndarray>
    salt             (time, depth, yref) float64 dask.array<chunksize=(1, 322, 800), meta=np.ndarray>
    KPP_diffusivity  (time, depth, yref) float64 dask.array<chunksize=(1, 322, 800), meta=np.ndarray>
    dens             (time, depth, yref) float64 dask.array<chunksize=(1, 322, 800), meta=np.ndarray>
    Jq               (time, depth, yref) float64 dask.array<chunksize=(1, 322, 800), meta=np.ndarray>
    mld              (time, depth, yref) float64 dask.array<chunksize=(1, 345, 800), meta=np.ndarray>
ipdb> q
---------------------------------------------------------------------------
BdbQuit                                   Traceback (most recent call last)
<ipython-input-15-d6b20eb79ed4> in <module>
----> 1 composite = pump.composite.make_composite(masked)

~/pump/pump/composite.py in make_composite(data)
    121     import IPython; IPython.core.debugger.set_trace()
    122
--> 123     phase_grouped = interped.groupby_bins("tiw_phase", np.arange(0, 360, 5))
    124     data_vars = data.data_vars
    125     composite = {name: xr.Dataset(attrs={"name": name}) for name in data_vars}

~/miniconda3/envs/dcpy/lib/python3.6/bdb.py in trace_dispatch(self, frame, event, arg)
     49             return # None
     50         if event == 'line':
---> 51             return self.dispatch_line(frame)
     52         if event == 'call':
     53             return self.dispatch_call(frame, arg)

~/miniconda3/envs/dcpy/lib/python3.6/bdb.py in dispatch_line(self, frame)
     68         if self.stop_here(frame) or self.break_here(frame):
     69             self.user_line(frame)
---> 70             if self.quitting: raise BdbQuit
     71         return self.trace_dispatch
     72

BdbQuit:
masked.theta.groupby("period").mean(["time"])
<xarray.DataArray 'theta' (period: 2, depth: 345, latitude: 480)>
dask.array<transpose, shape=(2, 345, 480), dtype=float32, chunksize=(1, 322, 480)>
Coordinates:
    longitude  float32 -110.01001
  * depth      (depth) float64 -0.5 -1.5 -2.5 ... -5.666e+03 -5.766e+03
  * latitude   (latitude) float32 -12.0 -11.949896 -11.899791 ... 11.949896 12.0
    variable   <U1 'v'
  * period     (period) float64 5.0 6.0
%prun -s cumulative composite = model_composite(gcm1, -110, [5, 6])
%matplotlib inline
period = gcm1.tao.period.sel(latitude=0, longitude=-110)
grouped = surf110.theta.groupby(period.where(period.isin([4, 5, 6])))
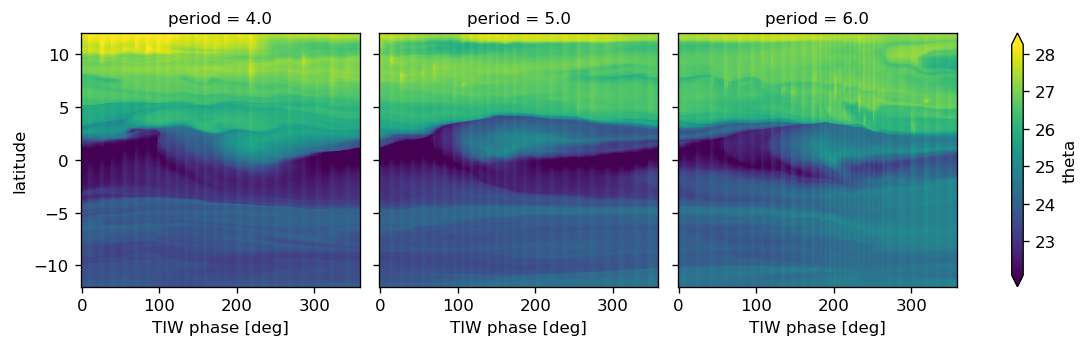
grouped.plot.pcolormesh(
col="period",
x="tiw_phase",
robust=True,
add_colorbar=True,
sharex=True,
sharey=True,
)
/gpfs/u/home/dcherian/python/xarray/xarray/core/common.py:674: FutureWarning: This DataArray contains multi-dimensional coordinates. In the future, the dimension order of these coordinates will be restored as well unless you specify restore_coord_dims=False.
  self, group, squeeze=squeeze, restore_coord_dims=restore_coord_dims
<xarray.plot.facetgrid.FacetGrid at 0x2af74eea3278>
%matplotlib inline
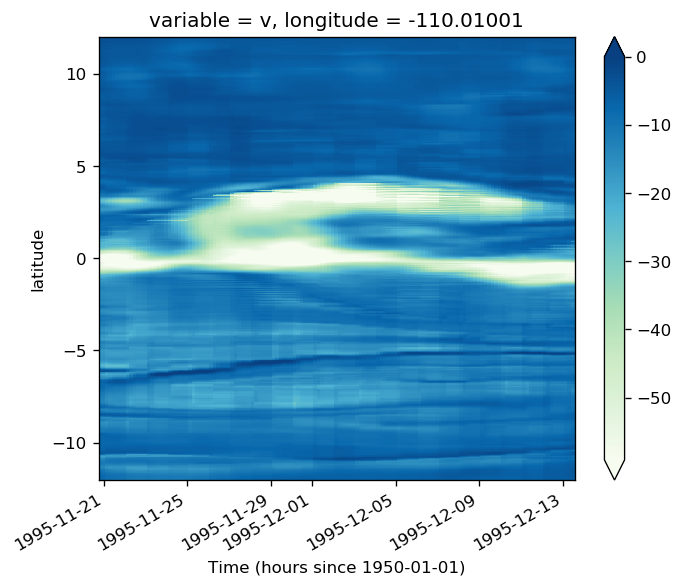
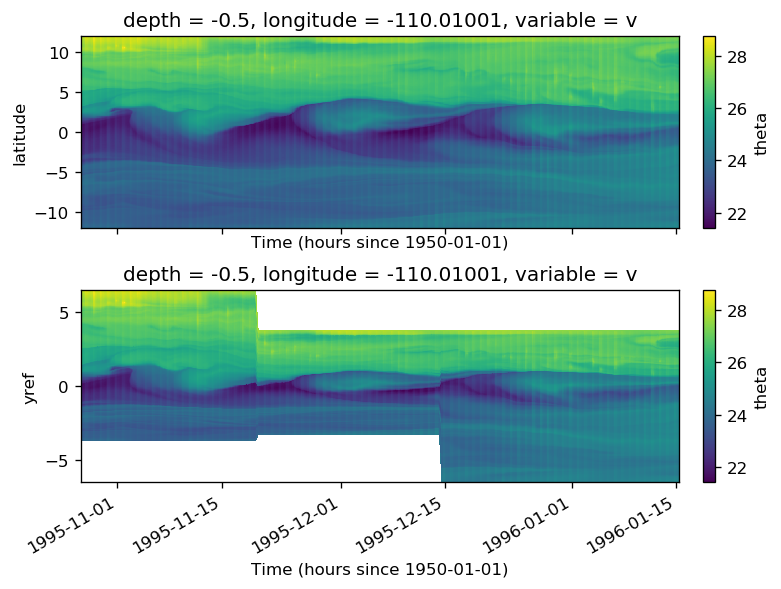
subset = surf110.copy()
subset = subset.assign_coords(tmat=surf110.time.broadcast_like(surf110.theta))
f, ax = plt.subplots(2, 1, sharex=True, constrained_layout=True)
subset.theta.where(subset.period.isin([4, 5, 6]), drop=True).plot(
x="time", y="latitude", ax=ax[0]
)
subset.theta.where(surf110.period.isin([4, 5, 6]), drop=True).plot(
x="tmat", y="yref", ax=ax[1]
)
<matplotlib.collections.QuadMesh at 0x2af6b99ef470>
composite["Jq"].avg.mean("depth").plot(
    y="yref", vmax=0, robust=True, cmap=mpl.cm.RdYlBu_r
)
<matplotlib.collections.QuadMesh at 0x2af697503400>
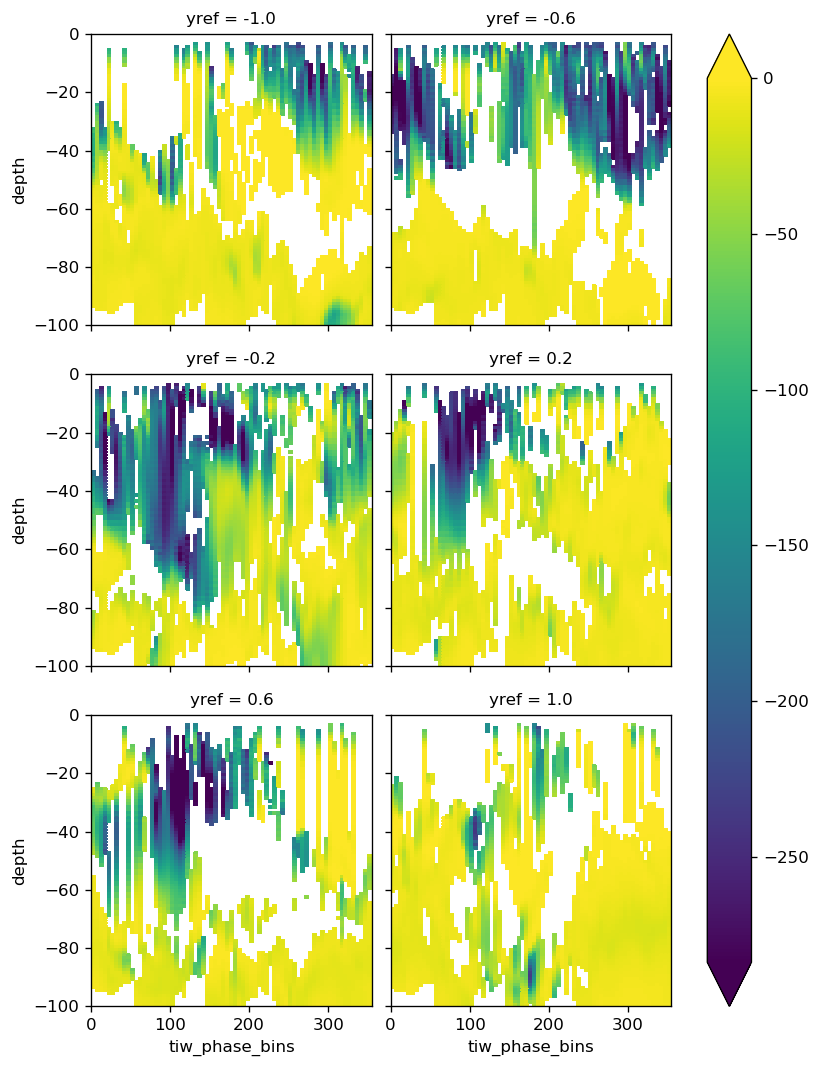
(
    composite["Jq"]
    .avg.rolling(depth=6, min_periods=4, center=True)
    .mean()
    .sel(yref=np.linspace(-1, 1, 6), method="nearest")
    .plot(col="yref", col_wrap=2, y="depth", vmax=0, robust=True)
)
<xarray.plot.facetgrid.FacetGrid at 0x2af7833825c0>
write longitude subset to file#
full.Jq.time.encoding
{'zlib': False,
 'shuffle': False,
 'complevel': 0,
 'fletcher32': False,
 'contiguous': True,
 'chunksizes': None,
 'source': '/glade/u/home/dcherian/pump/glade/TPOS_MITgcm_1_hb/HOLD/obs_subset/tao-budget-extract.nc',
 'original_shape': (2947,),
 'dtype': dtype('int64'),
 'units': 'hours since 1995-09-01',
 'calendar': 'proleptic_gregorian'}
dcpy.dask.batch_to_zarr(
    full.Jq.to_dataset().chunk({"longitude": 1}),
    dim="time",
    file="/glade/u/home/dcherian/pump/glade/gcm1-sections-retry-Jq-2.zarr",
    batch_size=250,
)
  0%|          | 0/12 [00:00<?, ?it/s]


  8%|▊         | 1/12 [02:08<23:31, 128.35s/it]


 17%|█▋        | 2/12 [04:25<21:48, 130.87s/it]


 25%|██▌       | 3/12 [06:44<19:59, 133.32s/it]


 33%|███▎      | 4/12 [09:01<17:56, 134.53s/it]


 42%|████▏     | 5/12 [11:15<15:40, 134.39s/it]


 50%|█████     | 6/12 [13:29<13:24, 134.16s/it]


 58%|█████▊    | 7/12 [15:50<11:21, 136.31s/it]


 67%|██████▋   | 8/12 [18:21<09:23, 140.83s/it]


 75%|███████▌  | 9/12 [20:35<06:56, 138.80s/it]


 83%|████████▎ | 10/12 [22:44<04:31, 135.57s/it]


 92%|█████████▏| 11/12 [25:10<02:18, 138.71s/it]
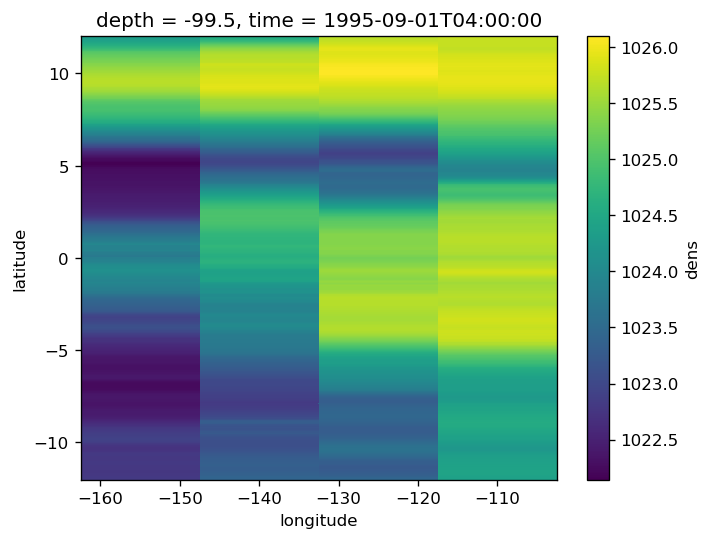
full1..sel(depth=-100, method="nearest").isel(time=1).plot()
<matplotlib.collections.QuadMesh at 0x2b049b4ce350>
model.read_budget()
del full.longitude.encoding["dtype"]
assert "Jq" in full

dcpy.dask.batch_to_zarr(
    full.chunk({"longitude": 1}),
    file="/glade/u/home/dcherian/pump/glade/gcm1-sections-retry.zarr",
    dim="time",
    batch_size=300,
)
  0%|          | 0/10 [00:00<?, ?it/s]/glade/u/home/dcherian/python/xarray/xarray/core/dataset.py:1635: SerializationWarning: saving variable None with floating point data as an integer dtype without any _FillValue to use for NaNs
  append_dim=append_dim,


 10%|█         | 1/10 [08:13<1:14:05, 493.98s/it]/glade/u/home/dcherian/python/xarray/xarray/core/dataset.py:1635: SerializationWarning: saving variable None with floating point data as an integer dtype without any _FillValue to use for NaNs
  append_dim=append_dim,


 20%|██        | 2/10 [15:49<1:04:19, 482.45s/it]/glade/u/home/dcherian/python/xarray/xarray/core/dataset.py:1635: SerializationWarning: saving variable None with floating point data as an integer dtype without any _FillValue to use for NaNs
  append_dim=append_dim,


 30%|███       | 3/10 [23:52<56:17, 482.50s/it]  /glade/u/home/dcherian/python/xarray/xarray/core/dataset.py:1635: SerializationWarning: saving variable None with floating point data as an integer dtype without any _FillValue to use for NaNs
  append_dim=append_dim,


 40%|████      | 4/10 [31:51<48:09, 481.51s/it]/glade/u/home/dcherian/python/xarray/xarray/core/dataset.py:1635: SerializationWarning: saving variable None with floating point data as an integer dtype without any _FillValue to use for NaNs
  append_dim=append_dim,


 50%|█████     | 5/10 [39:52<40:07, 481.41s/it]/glade/u/home/dcherian/python/xarray/xarray/core/dataset.py:1635: SerializationWarning: saving variable None with floating point data as an integer dtype without any _FillValue to use for NaNs
  append_dim=append_dim,


 60%|██████    | 6/10 [48:14<32:30, 487.56s/it]/glade/u/home/dcherian/python/xarray/xarray/core/dataset.py:1635: SerializationWarning: saving variable None with floating point data as an integer dtype without any _FillValue to use for NaNs
  append_dim=append_dim,


 70%|███████   | 7/10 [56:03<24:05, 481.88s/it]/glade/u/home/dcherian/python/xarray/xarray/core/dataset.py:1635: SerializationWarning: saving variable None with floating point data as an integer dtype without any _FillValue to use for NaNs
  append_dim=append_dim,


 80%|████████  | 8/10 [1:05:14<16:45, 502.74s/it]/glade/u/home/dcherian/python/xarray/xarray/core/dataset.py:1635: SerializationWarning: saving variable None with floating point data as an integer dtype without any _FillValue to use for NaNs
  append_dim=append_dim,


 90%|█████████ | 9/10 [1:13:44<08:24, 504.90s/it]/glade/u/home/dcherian/python/xarray/xarray/core/dataset.py:1635: SerializationWarning: saving variable None with floating point data as an integer dtype without any _FillValue to use for NaNs
  append_dim=append_dim,


100%|██████████| 10/10 [1:20:47<00:00, 484.73s/it]
consolidate compositing steps#
TODO:
Get rid of subset_fields?
model = gcm1
periods = np.arange(1, 9)
longitudes = [-110, -125]  # -140, -155]
tslice = slice(None, "1996-03-01")
subset_fields = [
    "Jq",
    "theta",
    "salt",
    "dens",
    "u",
    "v",
    "w",
    "KPP_diffusivity",
    "sst",
    "Ri",
]
anomalize_fields = ["u", "v", "w", "theta", "salt", "sst"]
anomalize_over = ["time"]
import xfilter

surf = (
    model.surface.sel(longitude=longitudes, method="nearest")
    .assign_coords(longitude=longitudes)
    .drop("depth")
)
tao = model.tao.sel(longitude=longitudes, latitude=0).chunk({"longitude": 1})
# tao["time"] = model.full.time

sst = surf.theta.sel(longitude=longitudes).chunk({"longitude": 1, "time": -1})
sstfilt = pump.calc.tiw_avg_filter_sst(sst, "bandpass")  # .persist()

# filter out daily cycle
subdaily_sst = xfilter.lowpass(
    surf.theta.chunk({"time": -1, "latitude": 10}),
    coord="time",
    freq=2,
    cycles_per="D",
).reindex(time=tao.time)
subdaily_sst.attrs["long_name"] = "2 day filtered SST"
subdaily_sst.attrs["units"] = "C"

# surf["theta"] = (
#    sst.pipe(xfilter.lowpass, coord="time", freq=1/7, cycles_per="D", num_discard=0, method="pad")
# )

Tx = model.surface.theta.differentiate("longitude")
Ty = model.surface.theta.differentiate("latitude")
gradT = (
    np.hypot(Tx, Ty)
    .sel(longitude=longitudes, method="nearest")
    .assign_coords(longitude=longitudes)
    .drop_vars("depth")
)

# with performance_report("profiles/phase-period.html"):
tiw_phase, period, tiw_ptp = dask.compute(
    pump.calc.get_tiw_phase_sst(
        sstfilt.chunk({"longitude": 1}), gradT.chunk({"longitude": 1, "time": -1})
    ),
)[0]
(
    surf,
    sst,
    sstfilt,
    gradT,
    tiw_phase,
    period,
    tiw_ptp,
) = model.get_quantities_for_composite(longitudes)
tao = model.tao.sel(longitude=longitudes, latitude=0).chunk({"longitude": 1})
from pump import composite

# with performance_report("profiles/y-reference.html"):
surf = surf.assign_coords(period=period, tiw_phase=tiw_phase, tiw_ptp=tiw_ptp)
yref, sst_ref = composite.get_y_reference(
    surf.theta.compute(), periods=periods, kind="warm", debug=False
)
surf = surf.assign_coords(yref=yref, sst_ref=sst_ref)
full = xr.open_zarr(
    "/glade/u/home/dcherian/pump/glade/gcm1-sections-retry.zarr", consolidated=True
)
jq = xr.open_zarr(
    "/glade/u/home/dcherian/pump/glade/gcm1-sections-retry-Jq-2.zarr", consolidated=True
)
dens = xr.open_zarr(
    "/glade/u/home/dcherian/pump/glade/gcm1-sections-dens.zarr", consolidated=True
)
full["time"] = gcm1.tao.time
full["Jq"] = jq.Jq
assert full.sizes["time"] == model.full.sizes["time"]
full["dens"] = dens.dens
# full
# jq = xr.open_zarr("/glade/u/home/dcherian/pump/glade/gcm1-sections-retry-Jq.zarr", consolidated=True)
# full = model.full.sel(longitude=longitudes, method="nearest")
# if model.budget is not None and "Jq" in model.budget:
#    full["Jq"] = model.budget.Jq.sel(longitude=longitudes, method="nearest")
# full = full.assign_coords(longitude=longitudes)
# needed for apply_ufunc later
valid_subset_fields = list(set(subset_fields).intersection(set(full.data_vars)))
full_subset = full[valid_subset_fields]
full_subset = (
    full_subset.sel(depth=slice(0, -200))
    .sel(longitude=longitudes)
    .sel(time=tslice)
    .chunk({"longitude": 1, "latitude": -1, "time": 36})
    .assign_coords(
        yref=yref,
        period=period,
        tiw_phase=tiw_phase,
    )
)
full_subset["uz"] = full_subset.u.differentiate("depth")
full_subset["vz"] = full_subset.v.differentiate("depth")
full_subset["S2"] = full_subset.uz**2 + full_subset.vz**2
full_subset["N2"] = -9.81 / 1025 * full_subset.dens.differentiate("depth")
full_subset["Ri"] = full_subset.N2 / full_subset.S2
full_subset["sst"] = surf.theta.sel(
    time=full_subset.time
)  # full_subset.theta.isel(depth=0)
# if "zeta" in surf:
#    full["ssvor"] = surf.zeta
euc_max = tao.euc_max.reset_coords(drop=True)
mld = pump.calc.get_mld(full_subset.dens)
dcl_base = pump.calc.get_dcl_base_Ri(full_subset, mld, euc_max)
# kpp_mld = pump.calc.get_kpp_mld(full)
# if "KPP_diffusivity" in full:
#    kpp_diff_depth = pump.calc.kpp_diff_depth(full.KPP_diffusivity)
# else:
#    kpp_diff_depth = np.nan

# filtered = full.copy(deep=True)
# .chunk({"time": None, "latitude": None, "depth": 5}).pipe(
#    pump.utils.lowpass, "time", freq=0.5, cycles_per="D"
# )


def anomalize_single_lon(ds, to_anomalize):
    print(ds)
    if np.sum(list(ds.sizes.values())) == 0:
        return ds

    if ds.sizes["longitude"] > 1:
        raise ValueError("anomalize_single_lon received more than 1 longitude.")
    ds = ds.squeeze()
    means = ds[to_anomalize].groupby("period").mean()
    anomalies = ds.groupby("period") - means
    ds = ds.assign(anomalies).expand_dims("longitude")
    return ds


def anomalize(data, to_anomalize):
    anom = []
    for lon in data.longitude.values:
        grouped = data[to_anomalize].sel(longitude=[lon]).groupby("period")
        anom.append(grouped - grouped.mean())

    return data.assign(xr.concat(anom, "longitude"))


# calculate anomalies w.r.t period mean
to_anomalize = list(set(anomalize_fields).intersection(set(full_subset.data_vars)))
if len(to_anomalize) > 0:
    anomalized = anomalize(full_subset, to_anomalize)
    # anomalized = (full_subset.unify_chunks()
    #              .map_blocks(anomalize_single_lon,
    #                          args=[to_anomalize]))

# avoid dasky copies of "period" and "tiw_phase"
anomalized = (
    anomalized.assign_coords(
        mld=mld, dcl_base=dcl_base, dcl=np.abs(mld - dcl_base), euc_max=euc_max
    )
    .chunk({"latitude": -1, "time": 36})  # TODO: why isn't w chunked earlier?
    .assign_coords(full_subset.coords)
)
anomalized["wpTp"] = anomalized.w * anomalized.theta

subset = anomalized  # [subset_fields]
depth = anomalized.depth
mld_mask = (depth >= mld) & (np.abs(mld) > 5)
dcl_mask = (depth < mld) & (depth >= dcl_base) & (np.abs(dcl_base - mld) > 5)
below_dcl_mask = (
    (depth < dcl_base) & (depth >= euc_max) & (np.abs(dcl_base - euc_max) > 5)
)

masks = {"mld": mld_mask, "dcl": dcl_mask, "below_dcl": below_dcl_mask}
comp = pump.composite.make_composite_multiple_masks(
    subset.reset_coords(["mld", "dcl", "dcl_base"]), masks
)
comp
/glade/u/home/dcherian/python/xarray/xarray/core/common.py:664: FutureWarning: This DataArray contains multi-dimensional coordinates. In the future, the dimension order of these coordinates will be restored as well unless you specify restore_coord_dims=False.
  self, group, squeeze=squeeze, restore_coord_dims=restore_coord_dims
/glade/u/home/dcherian/python/xarray/xarray/core/nanops.py:142: RuntimeWarning: Mean of empty slice
  return np.nanmean(a, axis=axis, dtype=dtype)
{'mld': <pump.composite.Composite at 0x2b2db3fc3690>,
 'dcl': <pump.composite.Composite at 0x2b2dc9765590>,
 'below_dcl': <pump.composite.Composite at 0x2b2dd7f13210>}
(
    full_subset["vz"]
    .where(masks["dcl"])
    .sel(longitude=-110)
    .mean("depth")
    .groupby("period")
    .plot(
        col="period",
        col_wrap=3,
    )
)
/glade/u/home/dcherian/python/xarray/xarray/core/common.py:664: FutureWarning: This DataArray contains multi-dimensional coordinates. In the future, the dimension order of these coordinates will be restored as well unless you specify restore_coord_dims=False.
  self, group, squeeze=squeeze, restore_coord_dims=restore_coord_dims
Exception ignored in: <function WeakSet.__init__.<locals>._remove at 0x2b2ca93d5830>
Traceback (most recent call last):
  File "/glade/u/home/dcherian/miniconda3/envs/dcpy_updated/lib/python3.7/_weakrefset.py", line 38, in _remove
    def _remove(item, selfref=ref(self)):
KeyboardInterrupt
distributed.utils_perf - WARNING - full garbage collections took 14% CPU time recently (threshold: 10%)
distributed.nanny - WARNING - Restarting worker
distributed.nanny - WARNING - Restarting worker
distributed.nanny - WARNING - Restarting worker
distributed.nanny - WARNING - Restarting worker
distributed.nanny - WARNING - Restarting worker
distributed.nanny - WARNING - Restarting worker
distributed.nanny - WARNING - Restarting worker
distributed.nanny - WARNING - Restarting worker
distributed.nanny - WARNING - Restarting worker
distributed.nanny - WARNING - Restarting worker
distributed.nanny - WARNING - Restarting worker
distributed.nanny - WARNING - Restarting worker
distributed.utils_perf - WARNING - full garbage collections took 15% CPU time recently (threshold: 10%)
distributed.utils_perf - WARNING - full garbage collections took 15% CPU time recently (threshold: 10%)
distributed.utils_perf - WARNING - full garbage collections took 14% CPU time recently (threshold: 10%)
<xarray.plot.facetgrid.FacetGrid at 0x2b2e246a4c10>
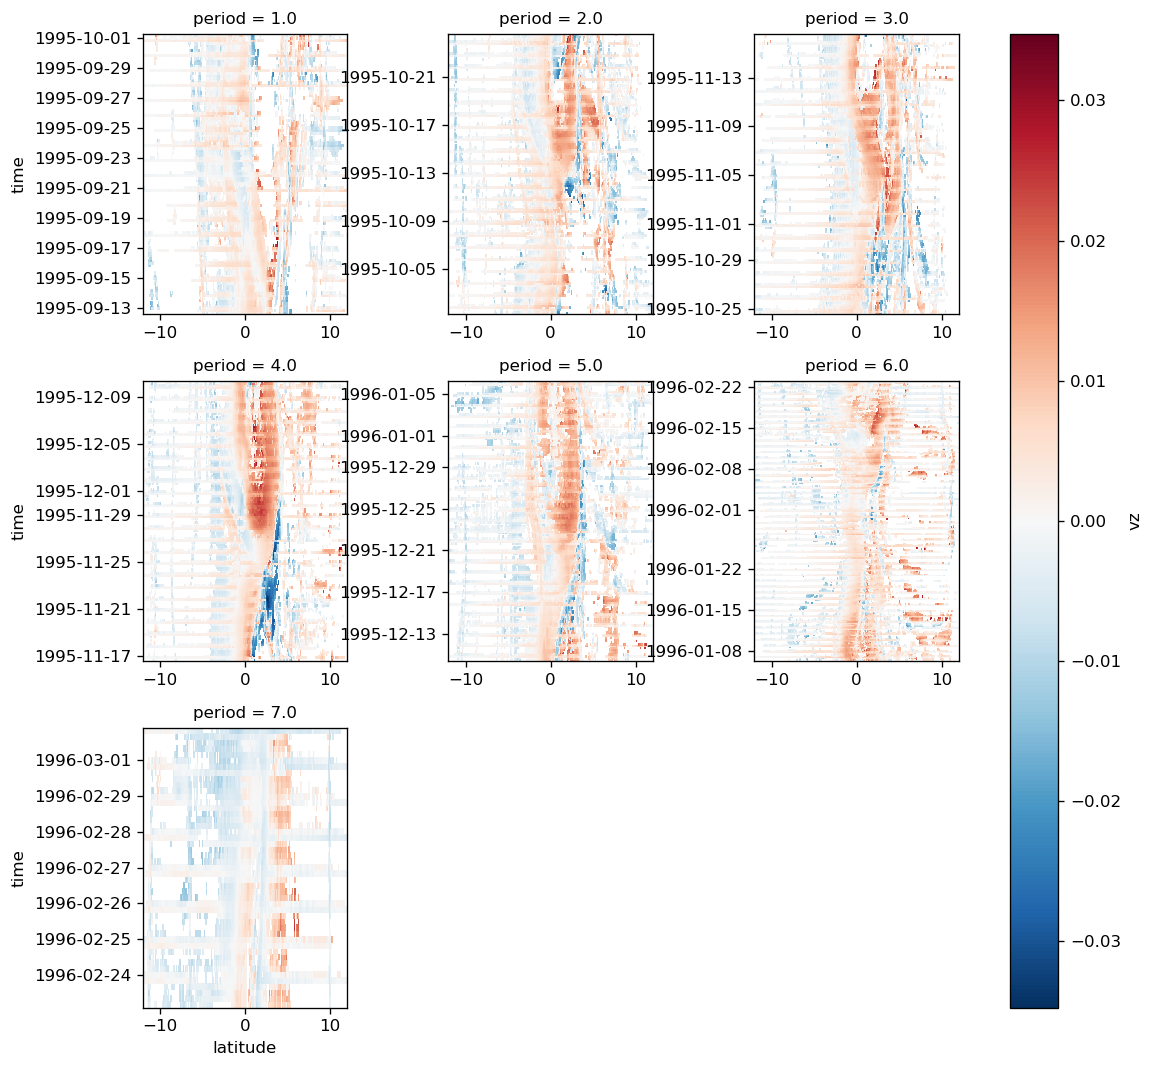
comp["dcl"].persist(["mld", "dcl"])
distributed.utils_perf - WARNING - full garbage collections took 11% CPU time recently (threshold: 10%)
distributed.utils - ERROR - "('zarr-getitem-6775cac93f4bd2e00f5fb3ba121cc3f7', 71, 0, 0, 0)"
Traceback (most recent call last):
  File "/glade/u/home/dcherian/miniconda3/envs/dcpy_updated/lib/python3.7/site-packages/distributed/utils.py", line 652, in log_errors
    yield
  File "/glade/u/home/dcherian/miniconda3/envs/dcpy_updated/lib/python3.7/site-packages/distributed/scheduler.py", line 1685, in add_worker
    typename=types[key],
KeyError: "('zarr-getitem-6775cac93f4bd2e00f5fb3ba121cc3f7', 71, 0, 0, 0)"
distributed.core - ERROR - "('zarr-getitem-6775cac93f4bd2e00f5fb3ba121cc3f7', 71, 0, 0, 0)"
Traceback (most recent call last):
  File "/glade/u/home/dcherian/miniconda3/envs/dcpy_updated/lib/python3.7/site-packages/distributed/core.py", line 412, in handle_comm
    result = await result
  File "/glade/u/home/dcherian/miniconda3/envs/dcpy_updated/lib/python3.7/site-packages/distributed/scheduler.py", line 1685, in add_worker
    typename=types[key],
KeyError: "('zarr-getitem-6775cac93f4bd2e00f5fb3ba121cc3f7', 71, 0, 0, 0)"
distributed.utils - ERROR - "('getitem-b0b59e07dc843796f59eca5dcdd634dd', 0, 2, 0, 0)"
Traceback (most recent call last):
  File "/glade/u/home/dcherian/miniconda3/envs/dcpy_updated/lib/python3.7/site-packages/distributed/utils.py", line 652, in log_errors
    yield
  File "/glade/u/home/dcherian/miniconda3/envs/dcpy_updated/lib/python3.7/site-packages/distributed/scheduler.py", line 1685, in add_worker
    typename=types[key],
KeyError: "('getitem-b0b59e07dc843796f59eca5dcdd634dd', 0, 2, 0, 0)"
distributed.utils - ERROR - "('getitem-6775cac93f4bd2e00f5fb3ba121cc3f7', 589, 0, 3, 0)"
Traceback (most recent call last):
  File "/glade/u/home/dcherian/miniconda3/envs/dcpy_updated/lib/python3.7/site-packages/distributed/utils.py", line 652, in log_errors
    yield
  File "/glade/u/home/dcherian/miniconda3/envs/dcpy_updated/lib/python3.7/site-packages/distributed/scheduler.py", line 1685, in add_worker
    typename=types[key],
KeyError: "('getitem-6775cac93f4bd2e00f5fb3ba121cc3f7', 589, 0, 3, 0)"
distributed.utils - ERROR - "('getitem-6775cac93f4bd2e00f5fb3ba121cc3f7', 964, 0, 1, 0)"
Traceback (most recent call last):
  File "/glade/u/home/dcherian/miniconda3/envs/dcpy_updated/lib/python3.7/site-packages/distributed/utils.py", line 652, in log_errors
    yield
  File "/glade/u/home/dcherian/miniconda3/envs/dcpy_updated/lib/python3.7/site-packages/distributed/scheduler.py", line 1685, in add_worker
    typename=types[key],
KeyError: "('getitem-6775cac93f4bd2e00f5fb3ba121cc3f7', 964, 0, 1, 0)"
distributed.utils - ERROR - "('getitem-6775cac93f4bd2e00f5fb3ba121cc3f7', 515, 0, 2, 0)"
Traceback (most recent call last):
  File "/glade/u/home/dcherian/miniconda3/envs/dcpy_updated/lib/python3.7/site-packages/distributed/utils.py", line 652, in log_errors
    yield
  File "/glade/u/home/dcherian/miniconda3/envs/dcpy_updated/lib/python3.7/site-packages/distributed/scheduler.py", line 1685, in add_worker
    typename=types[key],
KeyError: "('getitem-6775cac93f4bd2e00f5fb3ba121cc3f7', 515, 0, 2, 0)"
distributed.utils - ERROR - "('getitem-6775cac93f4bd2e00f5fb3ba121cc3f7', 1058, 0, 2, 1)"
Traceback (most recent call last):
  File "/glade/u/home/dcherian/miniconda3/envs/dcpy_updated/lib/python3.7/site-packages/distributed/utils.py", line 652, in log_errors
    yield
  File "/glade/u/home/dcherian/miniconda3/envs/dcpy_updated/lib/python3.7/site-packages/distributed/scheduler.py", line 1685, in add_worker
    typename=types[key],
KeyError: "('getitem-6775cac93f4bd2e00f5fb3ba121cc3f7', 1058, 0, 2, 1)"
distributed.utils - ERROR - "('getitem-6775cac93f4bd2e00f5fb3ba121cc3f7', 442, 0, 3, 1)"
Traceback (most recent call last):
  File "/glade/u/home/dcherian/miniconda3/envs/dcpy_updated/lib/python3.7/site-packages/distributed/utils.py", line 652, in log_errors
    yield
  File "/glade/u/home/dcherian/miniconda3/envs/dcpy_updated/lib/python3.7/site-packages/distributed/scheduler.py", line 1685, in add_worker
    typename=types[key],
KeyError: "('getitem-6775cac93f4bd2e00f5fb3ba121cc3f7', 442, 0, 3, 1)"
distributed.utils_perf - WARNING - full garbage collections took 11% CPU time recently (threshold: 10%)
distributed.core - ERROR - "('getitem-b0b59e07dc843796f59eca5dcdd634dd', 0, 2, 0, 0)"
Traceback (most recent call last):
  File "/glade/u/home/dcherian/miniconda3/envs/dcpy_updated/lib/python3.7/site-packages/distributed/core.py", line 412, in handle_comm
    result = await result
  File "/glade/u/home/dcherian/miniconda3/envs/dcpy_updated/lib/python3.7/site-packages/distributed/scheduler.py", line 1685, in add_worker
    typename=types[key],
KeyError: "('getitem-b0b59e07dc843796f59eca5dcdd634dd', 0, 2, 0, 0)"
distributed.core - ERROR - "('getitem-6775cac93f4bd2e00f5fb3ba121cc3f7', 589, 0, 3, 0)"
Traceback (most recent call last):
  File "/glade/u/home/dcherian/miniconda3/envs/dcpy_updated/lib/python3.7/site-packages/distributed/core.py", line 412, in handle_comm
    result = await result
  File "/glade/u/home/dcherian/miniconda3/envs/dcpy_updated/lib/python3.7/site-packages/distributed/scheduler.py", line 1685, in add_worker
    typename=types[key],
KeyError: "('getitem-6775cac93f4bd2e00f5fb3ba121cc3f7', 589, 0, 3, 0)"
distributed.core - ERROR - "('getitem-6775cac93f4bd2e00f5fb3ba121cc3f7', 964, 0, 1, 0)"
Traceback (most recent call last):
  File "/glade/u/home/dcherian/miniconda3/envs/dcpy_updated/lib/python3.7/site-packages/distributed/core.py", line 412, in handle_comm
    result = await result
  File "/glade/u/home/dcherian/miniconda3/envs/dcpy_updated/lib/python3.7/site-packages/distributed/scheduler.py", line 1685, in add_worker
    typename=types[key],
KeyError: "('getitem-6775cac93f4bd2e00f5fb3ba121cc3f7', 964, 0, 1, 0)"
distributed.core - ERROR - "('getitem-6775cac93f4bd2e00f5fb3ba121cc3f7', 515, 0, 2, 0)"
Traceback (most recent call last):
  File "/glade/u/home/dcherian/miniconda3/envs/dcpy_updated/lib/python3.7/site-packages/distributed/core.py", line 412, in handle_comm
    result = await result
  File "/glade/u/home/dcherian/miniconda3/envs/dcpy_updated/lib/python3.7/site-packages/distributed/scheduler.py", line 1685, in add_worker
    typename=types[key],
KeyError: "('getitem-6775cac93f4bd2e00f5fb3ba121cc3f7', 515, 0, 2, 0)"
distributed.core - ERROR - "('getitem-6775cac93f4bd2e00f5fb3ba121cc3f7', 1058, 0, 2, 1)"
Traceback (most recent call last):
  File "/glade/u/home/dcherian/miniconda3/envs/dcpy_updated/lib/python3.7/site-packages/distributed/core.py", line 412, in handle_comm
    result = await result
  File "/glade/u/home/dcherian/miniconda3/envs/dcpy_updated/lib/python3.7/site-packages/distributed/scheduler.py", line 1685, in add_worker
    typename=types[key],
KeyError: "('getitem-6775cac93f4bd2e00f5fb3ba121cc3f7', 1058, 0, 2, 1)"
distributed.core - ERROR - "('getitem-6775cac93f4bd2e00f5fb3ba121cc3f7', 442, 0, 3, 1)"
Traceback (most recent call last):
  File "/glade/u/home/dcherian/miniconda3/envs/dcpy_updated/lib/python3.7/site-packages/distributed/core.py", line 412, in handle_comm
    result = await result
  File "/glade/u/home/dcherian/miniconda3/envs/dcpy_updated/lib/python3.7/site-packages/distributed/scheduler.py", line 1685, in add_worker
    typename=types[key],
KeyError: "('getitem-6775cac93f4bd2e00f5fb3ba121cc3f7', 442, 0, 3, 1)"
comp["dcl"].data["dcl"].avg_full.sortby("longitude").plot(
    col="longitude", x="tiw_phase_bins", y="mean_lat", robust=True
)
<xarray.plot.facetgrid.FacetGrid at 0x2b11b873a350>
anomalize(
    full_subset[["sst"]].sel(longitude=[-110], latitude=0, method="nearest"), ["sst"]
).sst.squeeze().plot()
/glade/u/home/dcherian/miniconda3/envs/dcpy_updated/lib/python3.7/site-packages/pandas/plotting/_matplotlib/converter.py:103: FutureWarning: Using an implicitly registered datetime converter for a matplotlib plotting method. The converter was registered by pandas on import. Future versions of pandas will require you to explicitly register matplotlib converters.

To register the converters:
	>>> from pandas.plotting import register_matplotlib_converters
	>>> register_matplotlib_converters()
  warnings.warn(msg, FutureWarning)
[<matplotlib.lines.Line2D at 0x2ab45a585e90>]
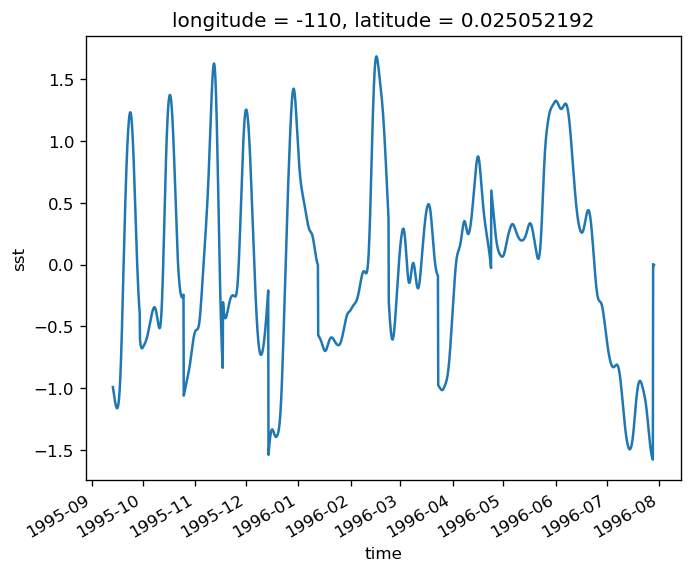
def batch_load(composites: dict, keys: list):
    tasks = []
    for name, comp in composites:
        tasks.append([comp.data[key] for key in keys])

    all_results = dask.compute(*tasks)
    for (_, comp), results in zip(composites, all_results):
        comp.update(dict(zip(keys, results)))


batch_load(comp, ["sst", "Jq"])
{'mld': <pump.composite.Composite at 0x2b45eab07390>,
 'dcl': <pump.composite.Composite at 0x2b45d740e650>,
 'below_dcl': <pump.composite.Composite at 0x2b45ebd61d10>}
with performance_report("composite-sst.html"):
    comp["dcl"].load(["sst", "Jq", "uz", "vz"])
comp["dcl"].data["Jq"]
<xarray.Dataset>
Dimensions:         (longitude: 4, period: 287, tiw_phase_bins: 71, yref: 800)
Coordinates:
  * tiw_phase_bins  (tiw_phase_bins) object (0, 5] (5, 10] ... (350, 355]
  * yref            (yref) float64 -4.0 -3.99 -3.98 -3.97 ... 3.97 3.98 3.99
  * longitude       (longitude) int64 -110 -125 -140 -155
  * period          (period) float64 1.0 2.0 3.0 4.0 5.0 ... nan nan nan nan nan
    mean_lat        (longitude, yref) float64 -10.22 -10.19 -10.16 ... 12.0 12.0
Data variables:
    avg_full        (longitude, tiw_phase_bins, yref) float64 -5.193 ... -11.37
    dev             (longitude, tiw_phase_bins, yref) float64 1.943 ... 21.99
    err             (longitude, tiw_phase_bins, yref) float64 0.1147 ... 1.298
    avg             (longitude, tiw_phase_bins, yref) float64 -5.193 ... -11.37
Attributes:
    name:     Jq
kwargs = dict(
x="tiw_phase_bins",
y="mean_lat",
ylim=[-5, 8],
xlim=[0, 360],
xticks=[0, 90, 180, 270, 360],
yticks=[-8, -5, -2, 0, 2, 5, 8],
)
kwargs2 = dict(
col="longitude",
aspect=0.9,
cbar_kwargs={"orientation": "horizontal", "pad": 0.3, "aspect": 40, "shrink": 0.5},
)
comp["dcl"].Jq.avg.attrs["long_name"] = "$J_q$ [W/m²]"
fg = (
comp["dcl"]
.Jq.sortby("longitude")
.avg.plot(
**kwargs2,
cmap=mpl.cm.GnBu_r,
vmax=0,
vmin=-200,
**kwargs,
)
)
# for loc, ax in zip(fg.name_dicts.flat, fg.axes.flat):
# comp["dcl"].sst.avg.sel(loc).plot.contour(
# ax=ax, cmap=mpl.cm.RdGy_r, levels=9, robust=True, linewidths=0.5, **kwargs, add_colorbar=False, add_labels=False
# )
plt.gcf().savefig("images/comp-all-lon-jq.png", bbox_inches="tight", dpi=300)
comp["dcl"].sst.avg.attrs["long_name"] = "SST [°C]"
comp["dcl"].sst.sortby("longitude").avg.plot(robust=True, **kwargs2, **kwargs)
plt.gcf().savefig("images/comp-all-lon-sst.png", bbox_inches="tight", dpi=300)
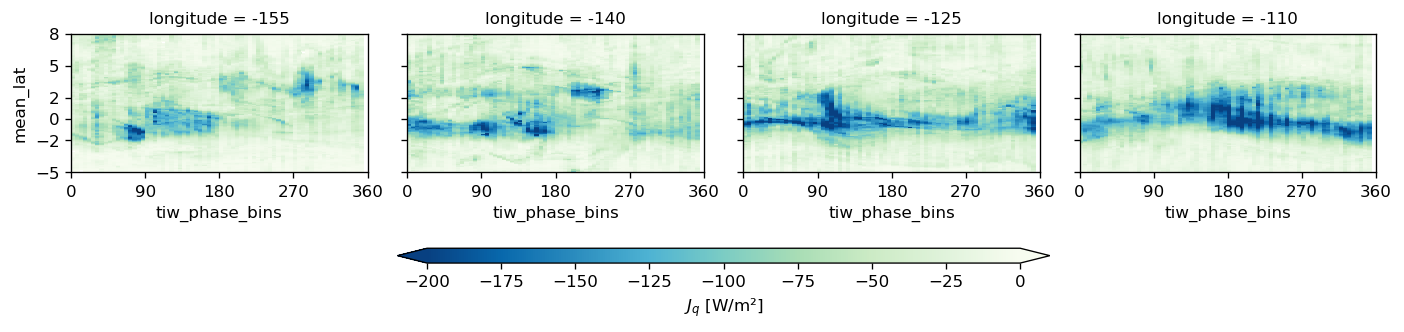
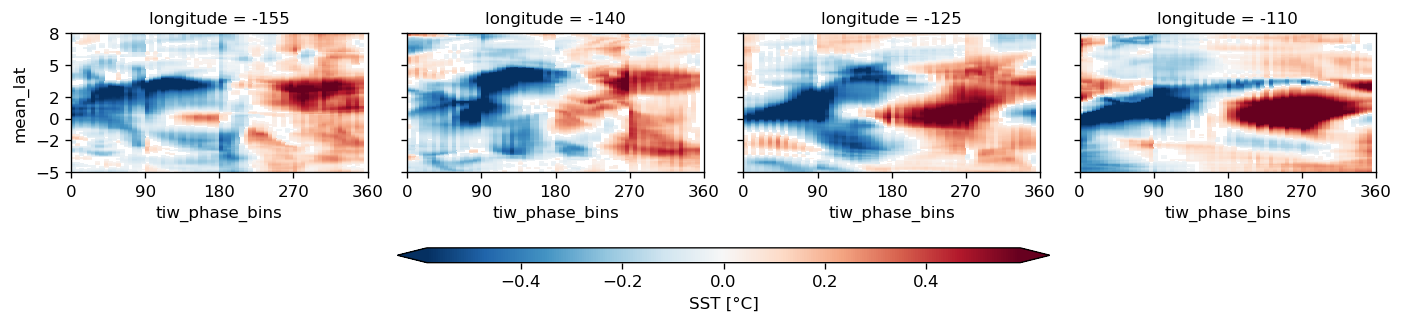
mld, dcl_base = dask.compute(mld, dcl_base)
dcl_base.name = "DCL base"
mld.name = "MLD"
dcl = mld - dcl_base
dcl.name = "DCL"
daily_dcl = (
    dcl_base.groupby(dcl_base.time.dt.round("D")).mean().rename({"round": "time"})
)
daily_dcl["period"] = dcl_base.period.reindex(time=daily_dcl.time)
daily_dcl
<xarray.DataArray 'DCL base' (time: 184, latitude: 480, longitude: 2)>
array([[[-26.      , -68.25    ],
        [-31.75    , -69.75    ],
        [-32.5     , -70.25    ],
        ...,
        [ -9.25    ,  -8.5     ],
        [-11.75    ,  -7.75    ],
        [ -6.5     ,  -1.5     ]],

       [[-19.1     , -58.7     ],
        [-29.3     , -60.7     ],
        [-28.5     , -61.9     ],
        ...,
        [-10.1     ,  -8.7     ],
        [-13.1     ,  -8.3     ],
        [ -6.9     ,  -1.5     ]],

       [[-33.785713, -49.357143],
        [-39.07143 , -52.642857],
        [-39.92857 , -56.07143 ],
        ...,
        [-12.785714,  -6.642857],
        [-14.214286,  -8.357142],
        [ -4.357143,  -1.5     ]],

       ...,

       [[-31.9     , -40.1     ],
        [-34.1     , -45.7     ],
        [-34.9     , -47.7     ],
        ...,
        [-29.3     , -29.9     ],
        [-28.3     , -29.1     ],
        [-28.1     , -22.1     ]],

       [[-22.642857, -40.07143 ],
        [-32.214287, -47.07143 ],
        [-34.5     , -47.92857 ],
        ...,
        [-28.214285, -29.214285],
        [-27.214285, -28.785715],
        [-26.5     , -20.071428]],

       [[ -3.      , -38.5     ],
        [-26.5     , -42.5     ],
        [-26.5     , -48.5     ],
        ...,
        [-18.      , -28.      ],
        [-17.      , -27.      ],
        [-15.      , -23.      ]]], dtype=float32)
Coordinates:
  * longitude  (longitude) int64 -110 -125
  * latitude   (latitude) float32 -12.0 -11.949896 -11.899791 ... 11.949896 12.0
  * time       (time) datetime64[ns] 1995-09-01 1995-09-02 ... 1996-03-02
    tiw_phase  (longitude, time) float64 nan nan nan nan ... 291.0 297.0 nan
    period     (longitude, time) float64 nan nan nan nan nan ... 6.0 6.0 6.0 nan
(
full_subset.sst.sel(longitude=-125)
.groupby("period")
.plot(
robust=True, cmap=mpl.cm.Blues, col="period", col_wrap=4, x="time", sharey=True
)
)
/glade/u/home/dcherian/python/xarray/xarray/core/common.py:664: FutureWarning: This DataArray contains multi-dimensional coordinates. In the future, the dimension order of these coordinates will be restored as well unless you specify restore_coord_dims=False.
  self, group, squeeze=squeeze, restore_coord_dims=restore_coord_dims
<xarray.plot.facetgrid.FacetGrid at 0x2b4977153050>
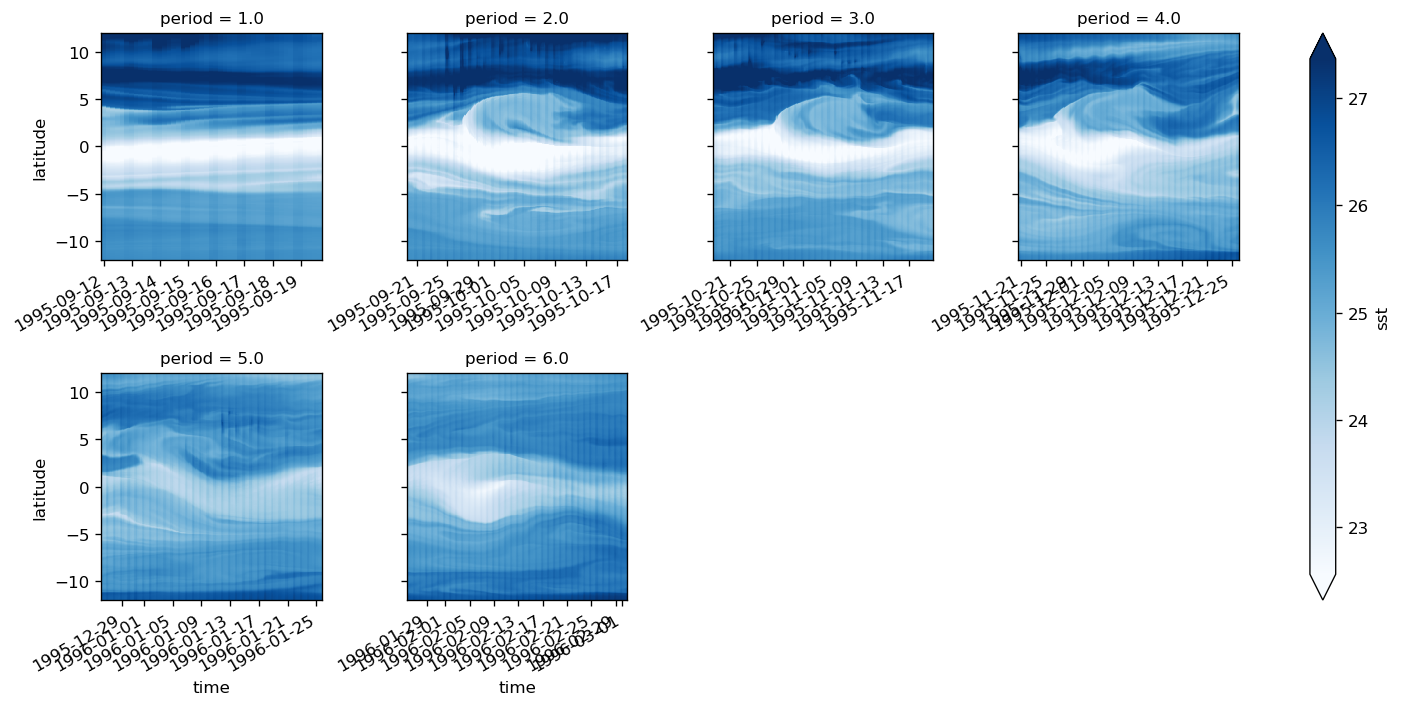
some v expts#
vfilt = xfilter.bandpass(surf.v.sel(latitude=slice(-2, 5))
                         .mean("latitude")
                         .chunk({"time": -1}),
                 coord="time",
                 freq=[1/10, 1/50],
                 orde r=2,
                 cycles_per="D").compute()

vfilt.plot.line(x="time")
[<matplotlib.lines.Line2D at 0x2b16c37e5828>,
 <matplotlib.lines.Line2D at 0x2b16e39d8438>,
 <matplotlib.lines.Line2D at 0x2b16e39d8198>]
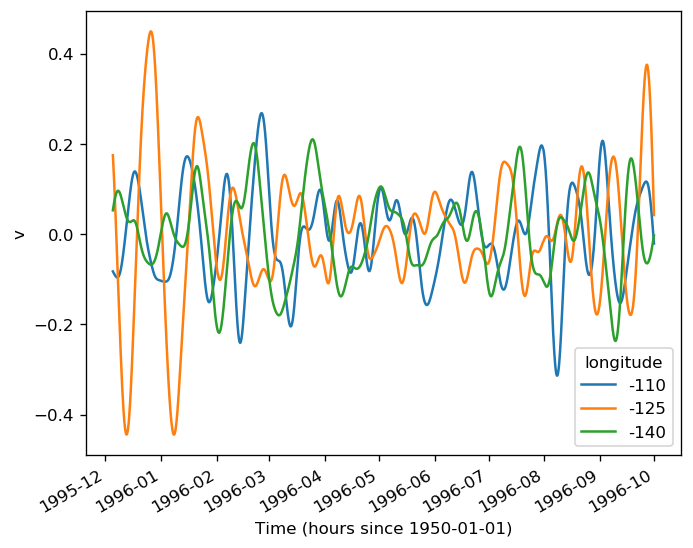
vfilt.rolling(time=np.int(3 * 20)).reduce(dcpy.util.ms).plot.line(x="time")
[<matplotlib.lines.Line2D at 0x2b16e02a8588>,
 <matplotlib.lines.Line2D at 0x2b16e584d1d0>,
 <matplotlib.lines.Line2D at 0x2b16e584d358>]
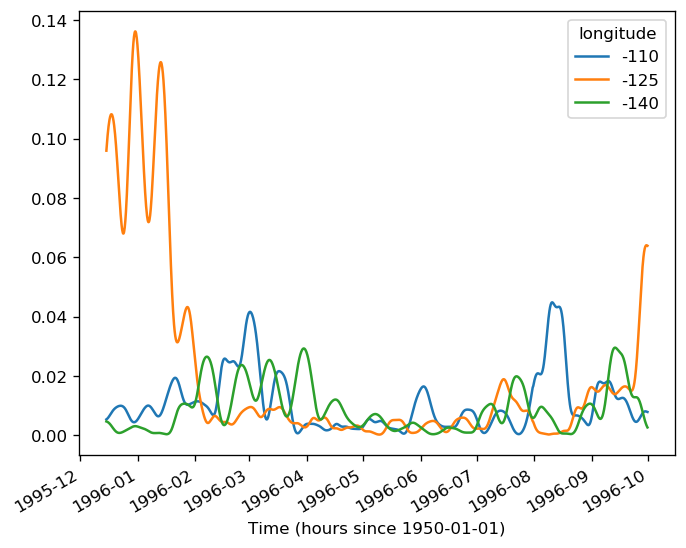
single TIW period analysis#
euc_max = tao.euc_max.reset_coords(drop=True)
# mld = pump.calc.get_mld(full_subset.dens)
# dcl_base = pump.calc.get_dcl_base_Ri(full_subset, mld, euc_max)

# dcl = (mld - dcl_base)
# dcl.attrs["long_name"] = "low Ri layer depth"
# dcl.attrs["units"] = "m"

full_subset = full_subset.assign_coords(mld=mld, dcl_base=dcl_base, eucmax=tao.euc_max)
off equatorial deep cycle mixing#
%matplotlib inline

subset = full_subset[["u", "v"]].sel(longitude=-110, depth=0, method="nearest")
dcpy.plots.quiver(
    subset.sel(time=(subset.period == 4))
    .sel(latitude=slice(-6, 6))
    .isel(latitude=slice(None, None, 5), time=slice(None, None, 6))
    .reset_coords(drop=True),
    x="time",
    y="latitude",
    u="u",
    v="v",
)
%matplotlib inline

subset = full_subset[["u", "v"]].sel(longitude=-110, depth=-80, method="nearest")
dcpy.plots.quiver(
    subset.sel(time=(subset.period == 4))
    .sel(latitude=slice(-6, 6))
    .isel(latitude=slice(None, None, 5), time=slice(None, None, 6))
    .reset_coords(drop=True),
    x="time",
    y="latitude",
    u="u",
    v="v",
)
<matplotlib.quiver.Quiver at 0x2ba1bfa09810>
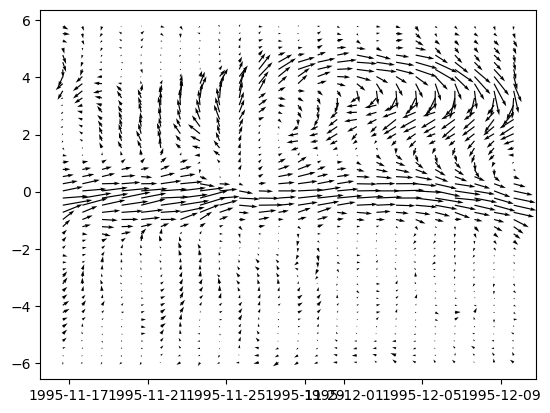
%matplotlib inline


def plot_time_instant(tsub, ax, add_colorbar):
    kwargs = dict(
        # vmin=-0.02,
        # vmax=0.02,
        norm=mpl.colors.DivergingNorm(vcenter=-5e-7, vmin=-5e-4, vmax=1e-4),
        cmap=mpl.cm.RdBu_r,
        add_colorbar=False,
    )

    Ric = 0.4
    (tsub.uz**2 - 1 / Ric / 2 * tsub.N2).plot(ax=ax["u"], **kwargs)
    (tsub.vz**2 - 1 / Ric / 2 * tsub.N2).plot(ax=ax["v"], **kwargs)
    # tsub.v.plot.contour(ax=ax["v"], colors="k", linewidths=1, levels=7)

    hdl = (tsub.uz**2 + tsub.vz**2 - 1 / Ric * tsub.N2).plot(ax=ax["Ri"], **kwargs)

    if add_colorbar:
        plt.gcf().colorbar(
            hdl,
            ax=[ax["u"], ax["v"], ax["Ri"]],
            orientation="horizontal",
            shrink=0.8,
            extend="both",
        )

    # tsub.u.plot.contour(ax=ax["Ri"], colors="k", linewidths=2, levels=5)
    # tsub.v.plot.contour(ax=ax["Ri"], colors="k", linewidths=1, levels=7)

    # tsub.Ri.plot(
    #    ax=ax["Ri"],
    #    cmap=mpl.cm.PuBu,
    #    vmin=0.1,
    #    vmax=0.5,
    # norm=mpl.colors.LogNorm(0.1, 0.5),
    #    add_colorbar=add_colorbar,
    #    cbar_kwargs={"orientation": "horizontal"} if add_colorbar else None,
    # )

    tsub.Jq.rolling(depth=7, center=True).mean().plot(
        ax=ax["Jq"],
        cmap=mpl.cm.Blues_r,
        vmin=-250,
        vmax=0,
        add_colorbar=add_colorbar,
        cbar_kwargs={"orientation": "horizontal", "ax": [ax["Jq"]]}
        if add_colorbar
        else None,
    )

    def annotate(tsub, ax):
        tsub.dcl_base.plot(ax=ax, color="w", lw=3, _labels=False)
        tsub.dcl_base.plot(ax=ax, color="k", lw=1.25, _labels=False)
        tsub.mld.plot(ax=ax, color="w", lw=3, _labels=False)
        tsub.mld.plot(ax=ax, color="orange", lw=1.25, _labels=False)
        # dcpy.plots.liney(tsub.eucmax, ax=ax, zorder=10, color="k")

    axx = list(ax.values())
    [
        aa.set_title(tt)
        for aa, tt in zip(
            axx,
            [
                "KPP heat flux",
                "$u_z^2 + v_z^2- N²/Ri_c$",
                "$u_z^2 - N²/2/Ri_c$",
                "$v_z^2 - N²/2/Ri_c$",
            ],
        )
    ]
    [aa.set_ylabel("") for aa in axx[1:]]
    [aa.set_xticks(np.arange(-5, 6, 1)) for aa in axx]
    [
        aa.tick_params(
            top=True,
        )
        for aa in axx
    ]
    [aa.tick_params(labelbottom=False) for aa in axx]
    [annotate(tsub, aa) for aa in axx]


def plot_tiw_period_snapshots(full_subset, lon, period, times):
    subset = full_subset.sel(longitude=lon)
    subset = subset.where(subset.period == period, drop=True)

    # times = subset.time.where(subset.tiw_phase.isin(np.arange(45, 290, 45)), drop=True)

    nextra = 2

    plt.rcParams["font.size"] = 14
    f = plt.figure(constrained_layout=True)
    f.set_size_inches((16, 8))
    gsparent = f.add_gridspec(1, 2, width_ratios=[1, 2])
    left = gsparent[0].subgridspec(2, 1)
    ax = dict()
    ax["sst"] = f.add_subplot(left[0])
    ax["dcl"] = f.add_subplot(left[1], sharex=ax["sst"], sharey=ax["sst"])

    from mpl_toolkits.axes_grid1.inset_locator import inset_axes

    inset_kwargs = dict(
        width="50%",  # width = 50% of parent_bbox width
        height="5%",  # height : 5%
        loc="lower left",
        bbox_to_anchor=[0, 0.075, 1, 1],
    )

    cax_sst = inset_axes(ax["sst"], **inset_kwargs, bbox_transform=ax["sst"].transAxes)
    cax_dcl = inset_axes(ax["dcl"], **inset_kwargs, bbox_transform=ax["dcl"].transAxes)

    right = gsparent[1].subgridspec(len(times), 4)
    axx = np.empty((len(times), 4), dtype=np.object)
    for icol in range(4):
        for irow in range(len(times)):
            axx[irow, icol] = f.add_subplot(right[irow, icol])

    # Surface fields
    cbar_kwargs = dict(aspect=40, label="", orientation="horizontal", extend="both")
    surf_kwargs = dict(
        add_colorbar=False,
        x="time",
        robust=True,
        ylim=[-5, 5],
    )

    hdl = subset.sst.plot(
        ax=ax["sst"],
        **surf_kwargs,
        cmap=mpl.cm.RdYlBu_r,
    )
    f.colorbar(hdl, cax=cax_sst, **cbar_kwargs)

    hdl = (
        (subset.mld - subset.dcl_base)
        .resample(time="D")
        .mean()
        .plot(
            ax=ax["dcl"],
            **surf_kwargs,
            cmap=mpl.cm.GnBu,
            vmin=5,
        )
    )
    f.colorbar(hdl, cax=cax_dcl, **cbar_kwargs)

    dcpy.plots.linex(times, color="k", zorder=2, ax=[ax["sst"], ax["dcl"]])

    # row snapshots
    sub = (
        subset[["u", "v", "uz", "vz", "N2", "Ri", "Jq"]]
        .sel(latitude=slice(-5, 5), depth=slice(-100))
        .compute()
    )
    for idx, (axrow, time) in enumerate(zip(axx, times)):
        tsub = sub.sel(time=time, method="nearest")

        add_colorbar = True if idx == (len(times) - 1) else False
        plot_time_instant(
            tsub, ax=dict(zip(["Jq", "Ri", "u", "v"], axrow)), add_colorbar=add_colorbar
        )
        axrow[0].text(
            x=0.05,
            y=0.05,
            s=tsub.time.dt.strftime("%Y-%m-%d %H:%M").values,
            va="center",
            ha="left",
            transform=axrow[0].transAxes,
        )
        if idx == len(times) - 1:
            [aa.tick_params(labelbottom=True) for aa in axrow]
        # axrow[-1].text(
        #    x=1.05,
        #    y=0.5,
        #    s=tsub.time.dt.strftime("%Y-%m-%d %H").values,
        #    va="center",
        #    rotation=90,
        #    transform=axrow[-1].transAxes,
        # )
        if idx != (len(times) - 1):
            [aa.set_xlabel("") for aa in axrow]
        if idx != 0:
            [aa.set_title("") for aa in axrow]

    ax["sst"].set_xticklabels([])
    ax["sst"].set_xlabel("")
    ax["sst"].set_title("SST [°C]")
    ax["dcl"].set_title("Low Ri layer width [m]")
    ax["dcl"].set_xlabel("")
    dcpy.plots.concise_date_formatter(ax["dcl"], minticks=6)
    # dcpy.plots.concise_date_formatter(ax["sst"], minticks=6)

    [aa.set_yticks([-100, -60, -30, 0]) for aa in axx.flat]
    [aa.set_yticklabels([str(num) for num in [-100, -60, -30, 0]]) for aa in axx[:, 0]]
    [aa.set_yticklabels([]) for aa in axx[:, 1:].flat]
    # [tt.set_visible(True) for tt in aa.get_yticklabels() for aa in axx[:, 0]]

    return axx


plot_tiw_period_snapshots(
    full_subset,
    lon=-110,
    period=4,
    times=[
        "1995-11-18 00:00",
        # "1995-11-24 18:00",
        "1995-11-26 06:00",
        "1995-12-03 18:00",
        # "1995-12-09 18:00",
    ],
)

plt.gcf().savefig("images/sst-dcl-shred2.png", dpi=150)
/glade/u/home/dcherian/python/xarray/xarray/core/resample.py:176: FutureWarning: This DataArray contains multi-dimensional coordinates. In the future, the dimension order of these coordinates will be restored as well unless you specify restore_coord_dims=False.
  super().__init__(*args, **kwargs)
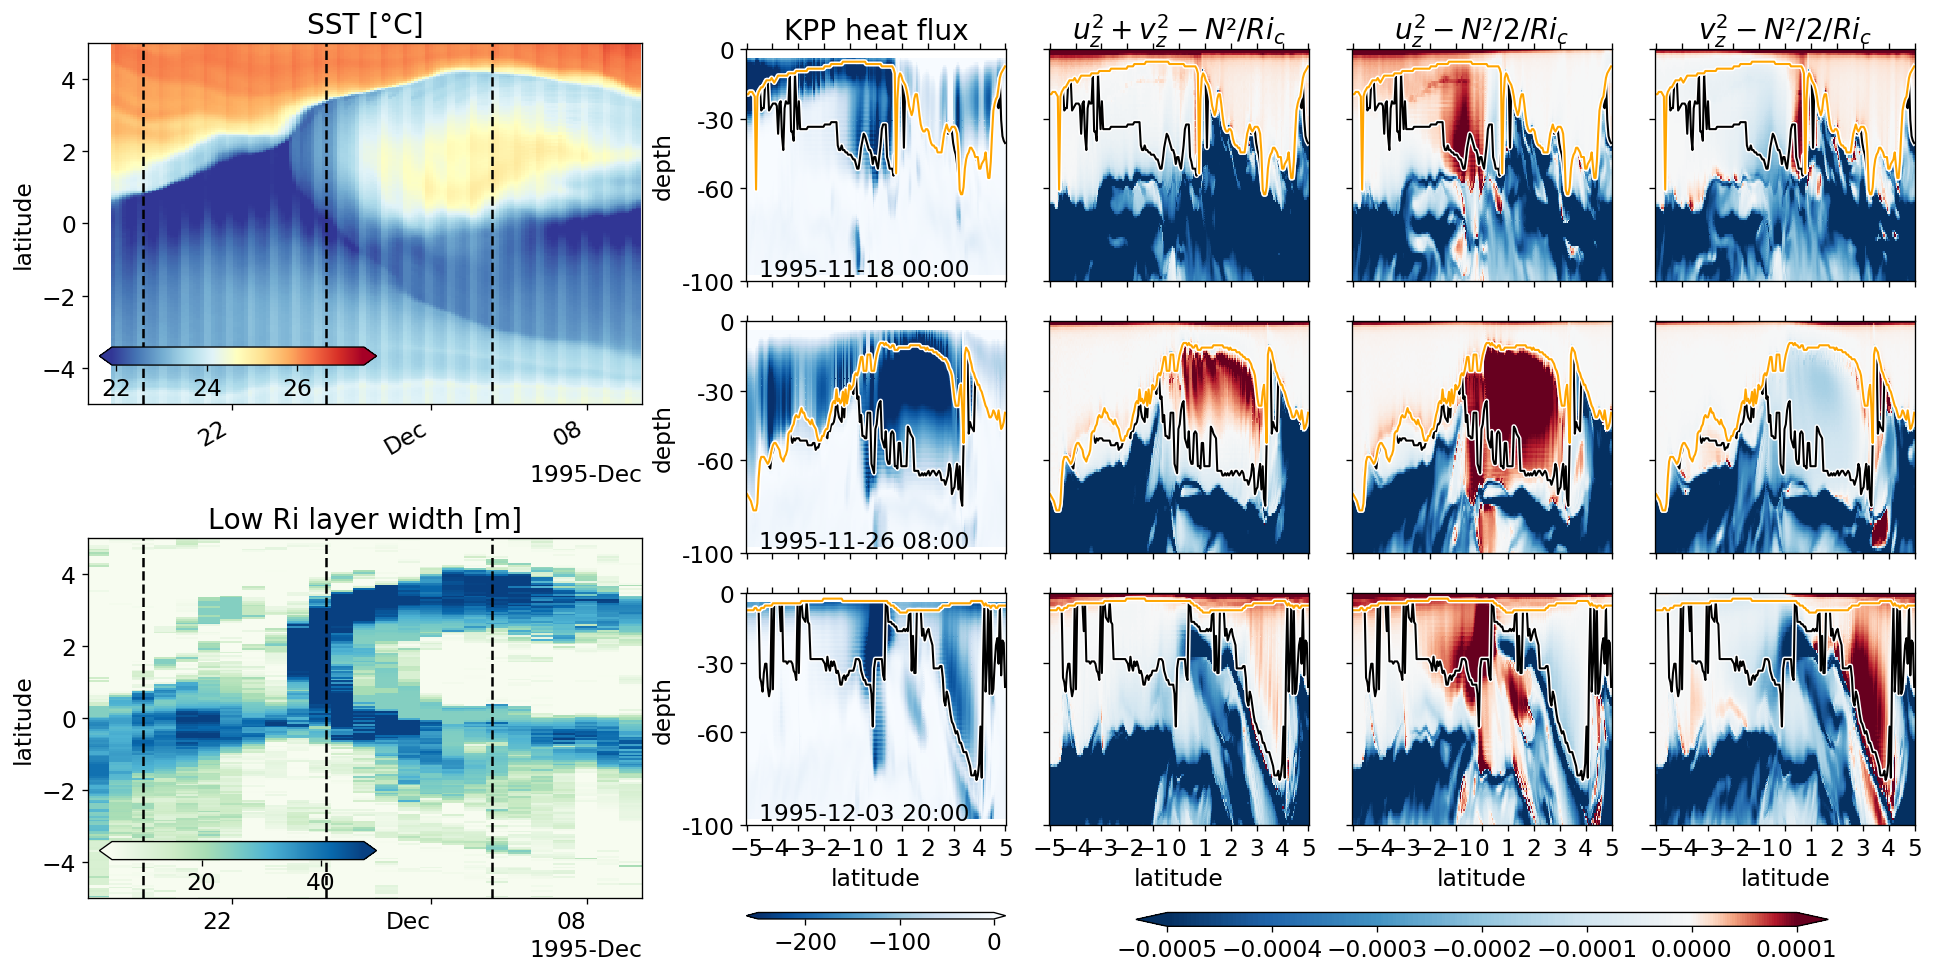
shred2 = (
    (full_subset.uz**2 + full_subset.vz**2 - 1 / 0.4 * full_subset.N2).sel(
        time="1995-12-03 20:00", longitude=-110
    )
).compute()
(shred2.where(shred2 > 0).plot());
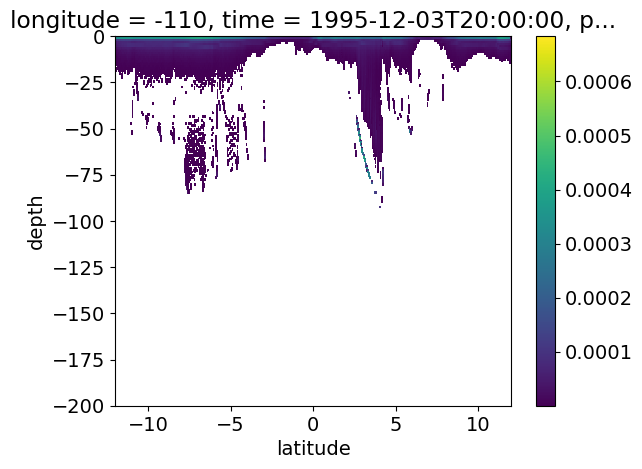
client.close()
cluster.close()
are we seeing a deep cycle off the equator? Yes!#
sub = full_subset.sel(longitude=-110, latitude=3.5, method="nearest").sel(
    time=slice("1995-11-29", "1995-12-05")
)

sub.Jq.rolling(depth=3, center=True).mean().plot(
    y="depth",
    cmap=mpl.cm.Blues_r,
    vmax=0,
    vmin=-400,
)
sub.mld.plot(color="orange", x="time")
sub.dcl_base.plot(color="k", x="time")
[<matplotlib.lines.Line2D at 0x2b2de2fc2a50>]
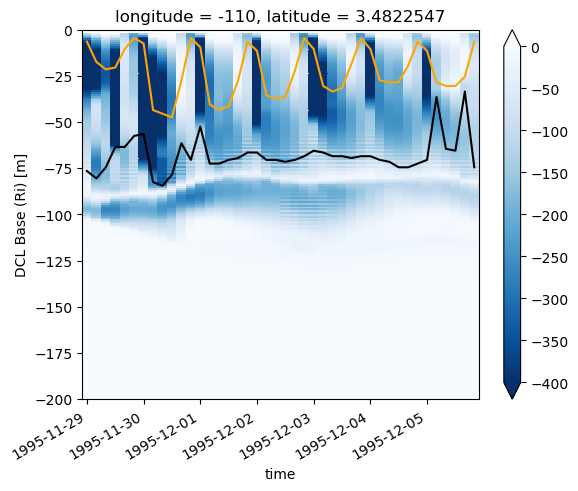
aiyo further debugging#
model = gcm1
longitudes = [-110, -125, -140, -155]
subset_fields = ["Jq", "theta", "dens", "u", "v", "w", "KPP_diffusivity"]

surf = (
    model.surface.sel(longitude=longitudes, method="nearest")
    .assign_coords(longitude=longitudes)
    .drop("depth")
)
tao = model.tao.sel(longitude=longitudes, latitude=0).chunk({"longitude": 1})
# tao["time"] = model.full.time
sst = surf.theta.sel(longitude=longitudes).chunk({"longitude": 1, "time": -1})
sstfilt = pump.calc.tiw_avg_filter_sst(sst, "bandpass")  # .persist()

# surf["theta"] = (
#    sst.pipe(xfilter.lowpass, coord="time", freq=1/7, cycles_per="D", num_discard=0, method="pad")
# )

Tx = model.surface.theta.differentiate("longitude")
Ty = model.surface.theta.differentiate("latitude")
gradT = (
    np.hypot(Tx, Ty)
    .sel(longitude=longitudes, method="nearest")
    .assign_coords(longitude=longitudes)
)
# with performance_report("profiles/phase-period.html"):
tiw_phase, period, tiw_ptp = dask.compute(
    pump.calc.get_tiw_phase_sst(
        sstfilt.chunk({"longitude": 1}), gradT.chunk({"longitude": 1, "time": -1})
    ),
)[0]
test diffusive flux reconstruction#
# CV = gcm1.metrics.cellvol
# dz = np.abs(gcm1.metrics.dRF)
# Jq = 1035 * 3999 * dz * gcm1.budget.DFrI_TH / CV

fri = full.KPP_diffusivity * (
    full.theta.diff("depth", label="upper") / full.depth.diff("depth")
).reindex(depth=full.depth)
def read_metrics(dirname, longitude, latitude):
    import xmitgcm

    h = dict()
    for ff in ["hFacC", "RAC", "RF", "DXC", "DYC"]:
        try:
            h[ff] = xmitgcm.utils.read_mds(dirname + ff)[ff]
        except FileNotFoundError:
            print(f"metrics files not available. {dirname + ff}")
            metrics = None
            return xr.Dataset()

    hFacC = h["hFacC"].copy().squeeze().astype("float32")
    RAC = h["RAC"].copy().squeeze().astype("float32")
    RF = h["RF"].copy().squeeze().astype("float32")
    DXC = h["DXC"].copy().squeeze().astype("float32")
    DYC = h["DYC"].copy().squeeze().astype("float32")

    del h

    RAC = xr.DataArray(
        RAC,
        dims=["latitude", "longitude"],
        coords={"longitude": longitude, "latitude": latitude},
        name="RAC",
    )
    DXC = xr.DataArray(
        DXC,
        dims=["latitude", "longitude"],
        coords={"longitude": longitude, "latitude": latitude},
        name="DXC",
    )
    DYC = xr.DataArray(
        DYC,
        dims=["latitude", "longitude"],
        coords={"longitude": longitude, "latitude": latitude},
        name="DYC",
    )

    depth = xr.DataArray(
        (RF[1:] + RF[:-1]) / 2,
        dims=["depth"],
        name="depth",
        attrs={"long_name": "depth", "units": "m"},
    )

    RF = xr.DataArray(RF.squeeze(), dims=["depth_left"], name="depth_left")

    hFacC = xr.DataArray(
        hFacC,
        dims=["depth", "latitude", "longitude"],
        coords={
            "depth": depth,
            "latitude": latitude,
            "longitude": longitude,
        },
        name="hFacC",
    )

    metrics = xr.merge([hFacC, RAC, DXC, DYC])

    metrics["RF"] = RF

    metrics["rAw"] = xr.DataArray(
        xmitgcm.utils.read_mds(dirname + "/RAW")["RAW"].astype("float32"),
        dims=["latitude", "longitude"],
    )
    metrics["hFacW"] = xr.DataArray(
        xmitgcm.utils.read_mds(dirname + "/hFacW")["hFacW"].astype("float32"),
        dims=["depth", "latitude", "longitude"],
    )

    metrics["dRF"] = xr.DataArray(
        xmitgcm.utils.read_mds(dirname + "/DRF")["DRF"].squeeze().astype("float32"),
        dims=["depth"],
    )

    metrics["dRC"] = xr.DataArray(
        xmitgcm.utils.read_mds(dirname + "/DRC")["DRC"].squeeze().astype("float32"),
        dims=["depth_left"],
    )

    metrics["cellvol"] = np.abs(metrics.RAC * metrics.dRF * metrics.hFacC)

    metrics["cellvol"] = metrics.cellvol.where(metrics.cellvol > 0)

    return metrics


metrics = read_metrics(
    gcm1.dirname + "../", gcm1.metrics.longitude, gcm1.metrics.latitude
)
metrics
<xarray.Dataset>
Dimensions:    (depth: 345, depth_left: 346, latitude: 480, longitude: 1500)
Coordinates:
  * depth      (depth) float64 -0.5 -1.5 -2.5 ... -5.666e+03 -5.766e+03
  * latitude   (latitude) float64 -12.0 -11.95 -11.9 -11.85 ... 11.9 11.95 12.0
  * longitude  (longitude) float64 -170.0 -169.9 -169.9 ... -95.1 -95.05 -95.0
Dimensions without coordinates: depth_left
Data variables:
    hFacC      (depth, latitude, longitude) float32 dask.array<chunksize=(345, 480, 1500), meta=np.ndarray>
    RAC        (latitude, longitude) float32 dask.array<chunksize=(480, 1500), meta=np.ndarray>
    DXC        (latitude, longitude) float32 dask.array<chunksize=(480, 1500), meta=np.ndarray>
    DYC        (latitude, longitude) float32 dask.array<chunksize=(480, 1500), meta=np.ndarray>
    RF         (depth_left) float32 dask.array<chunksize=(346,), meta=np.ndarray>
    rAw        (latitude, longitude) float32 dask.array<chunksize=(480, 1500), meta=np.ndarray>
    hFacW      (depth, latitude, longitude) float32 dask.array<chunksize=(345, 480, 1500), meta=np.ndarray>
    dRF        (depth) float32 dask.array<chunksize=(345,), meta=np.ndarray>
    dRC        (depth_left) float32 dask.array<chunksize=(346,), meta=np.ndarray>
cellvol (latitude, longitude, depth) float32 dask.array<chunksize=(480, 1500, 345), meta=np.ndarray>metrics.load()
<xarray.Dataset>
Dimensions:    (depth: 345, depth_left: 346, latitude: 480, longitude: 1500)
Coordinates:
  * depth      (depth) float64 -0.5 -1.5 -2.5 ... -5.666e+03 -5.766e+03
  * latitude   (latitude) float64 -12.0 -11.95 -11.9 -11.85 ... 11.9 11.95 12.0
  * longitude  (longitude) float64 -170.0 -169.9 -169.9 ... -95.1 -95.05 -95.0
Dimensions without coordinates: depth_left
Data variables:
    hFacC      (depth, latitude, longitude) float32 1.0 1.0 1.0 ... 0.0 0.0 0.0
    RAC        (latitude, longitude) float32 30228614.0 ... 30228614.0
    DXC        (latitude, longitude) float32 5437.903 5437.903 ... 5437.903
    DYC        (latitude, longitude) float32 5558.8735 5558.8735 ... 5558.8735
    RF         (depth_left) float32 0.0 -1.0 -2.0 ... -5715.922 -5815.922
    rAw        (latitude, longitude) float32 30228614.0 ... 30228614.0
    hFacW      (depth, latitude, longitude) float32 1.0 1.0 1.0 ... 0.0 0.0 0.0
    dRF        (depth) float32 1.0 1.0 1.0 1.0 1.0 ... 100.0 100.0 100.0 100.0
    dRC        (depth_left) float32 0.5 1.0 1.0 1.0 ... 100.0 100.0 100.0 50.0
    cellvol    (latitude, longitude, depth) float32 30228614.0 ... nan
# region.pop("time")
dz = submetrics.dRF
(CV / A / dz).isel(region).plot()
[<matplotlib.lines.Line2D at 0x2acaaf72ead0>]
gcm1.full.KPP_diffusivity.sel(longitude=full.longitude, method="nearest")
<xarray.DataArray 'KPP_diffusivity' (time: 2947, depth: 345, latitude: 480, longitude: 4)>
dask.array<getitem, shape=(2947, 345, 480, 4), dtype=float32, chunksize=(1, 345, 138, 2), chunktype=numpy.ndarray>
Coordinates:
  * latitude   (latitude) float32 -12.0 -11.949896 -11.899791 ... 11.949896 12.0
  * longitude  (longitude) float32 -110.01001 -125.02001 -139.97998 -154.98999
  * depth      (depth) float32 -0.5 -1.5 -2.5 ... -5565.922 -5665.922 -5765.922
  * time       (time) datetime64[ns] 1995-09-01 ... 1997-01-04T12:00:00
dfrith / A.isel()
<xarray.DataArray 'DFrI_TH' (depth: 345)>
array([            nan, -9.84640869e+02, -1.06775061e+03, -8.92413025e+02,
       -7.10939514e+02, -5.65853516e+02, -4.58421387e+02, -3.83281128e+02,
       -3.34394684e+02, -3.06540833e+02, -2.95508820e+02, -2.98155762e+02,
       -3.10614716e+02, -3.32025696e+02, -3.60765747e+02, -3.95465576e+02,
       -4.35004974e+02, -4.78826935e+02, -5.26109741e+02, -5.76375305e+02,
       -6.29281677e+02, -6.84362183e+02, -7.41226685e+02, -7.99443359e+02,
       -8.66984131e+02, -9.36014832e+02, -1.00630701e+03, -1.07773914e+03,
       -1.15021619e+03, -1.22355042e+03, -1.29759924e+03, -1.37214648e+03,
       -1.44691406e+03, -1.52174573e+03, -1.59629163e+03, -1.67014771e+03,
       -1.74293042e+03, -1.81425244e+03, -1.88378223e+03, -1.95131934e+03,
       -2.01647046e+03, -2.07842212e+03, -2.12958789e+03, -2.17602612e+03,
       -2.21851440e+03, -2.25459351e+03, -2.28871509e+03, -2.31227686e+03,
       -2.34022803e+03, -2.34663525e+03, -2.37501025e+03, -2.35317529e+03,
       -2.39943359e+03, -2.32019238e+03, -2.43209131e+03, -2.21714502e+03,
       -2.50988184e+03, -1.99075464e+03, -2.66711987e+03, -1.61633960e+03,
       -2.87673340e+03, -1.15387781e+03, -3.01910889e+03, -7.51535583e+02,
       -2.91097241e+03, -6.12609375e+02, -2.34943042e+03, -8.25676514e+02,
       -1.46861096e+03, -7.17710754e+02, -3.45319489e+02, -3.29282150e+01,
       -1.56359043e+01, -1.83019161e+01, -1.95279846e+01, -2.14446812e+01,
       -2.31714802e+01, -2.53912659e+01, -2.81721210e+01, -3.21689224e+01,
       -3.73722992e+01, -4.37606812e+01, -5.09668961e+01, -5.80741158e+01,
       -6.36207962e+01, -6.61839752e+01, -6.54514008e+01, -6.27203178e+01,
       -6.02733574e+01, -5.98188171e+01, -6.07617264e+01, -6.00670128e+01,
       -5.44340477e+01, -4.33324394e+01, -3.00823364e+01, -1.94023209e+01,
       -1.24608316e+01, -8.05901432e+00, -6.18843889e+00, -4.64766884e+00,
       -5.42471027e+00, -7.29998302e+00, -5.95052767e+00, -4.99892473e+00,
       -4.04294825e+00, -4.12073088e+00, -4.51009607e+00, -4.99179840e+00,
       -5.44489288e+00, -5.82171869e+00, -6.47219563e+00, -8.49984646e+00,
       -1.71369171e+01, -6.62071762e+01, -9.32546539e+01, -1.06937912e+02,
       -1.00669403e+02, -9.22931290e+01, -9.75379791e+01, -9.59267502e+01,
       -8.63247147e+01, -8.01445084e+01, -8.53068085e+01, -9.35369873e+01,
       -6.96072083e+01, -3.46711845e+01, -7.35902357e+00, -4.77784634e+00,
       -2.37863159e+00, -1.30548060e+00, -1.17674935e+00, -1.03233266e+00,
       -3.92799258e-01, -6.63164675e-01, -2.45445061e+00, -6.47563028e+00,
       -1.05928469e+01, -7.11079407e+01, -1.17762115e+02, -1.32642410e+02,
       -1.90446320e+02, -1.54128067e+02, -2.75537384e+02, -1.46966812e+02,
       -3.73572876e+02, -1.29266602e+02, -4.63988739e+02, -1.16902222e+02,
       -5.36056030e+02, -1.13203728e+02, -5.90389404e+02, -1.15067810e+02,
       -6.29040405e+02, -1.19666237e+02, -6.54039673e+02, -1.24748627e+02,
       -6.66721008e+02, -1.28887375e+02, -6.67558289e+02, -1.31692123e+02,
       -6.56304504e+02, -1.33689178e+02, -6.32199707e+02, -1.36666306e+02,
       -5.93815552e+02, -1.43737976e+02, -5.39520203e+02, -1.58421082e+02,
       -4.68603027e+02, -1.80833725e+02, -3.86418457e+02, -2.01913452e+02,
       -3.04188660e+02, -2.06629410e+02, -2.36235931e+02, -1.90954361e+02,
       -1.90146790e+02, -1.63997559e+02, -1.46952759e+02, -1.16640526e+02,
       -8.78911743e+01, -5.48782082e+01, -3.88912849e+01, -3.64054642e+01,
       -3.94825974e+01, -4.52120285e+01, -5.22396126e+01, -5.74253883e+01,
       -5.95910721e+01, -6.24456024e+01, -6.47752457e+01, -6.64396744e+01,
       -6.76228638e+01, -6.88572693e+01, -7.07819290e+01, -7.30026779e+01,
       -7.48184509e+01, -7.60984344e+01, -7.65201721e+01, -7.62321320e+01,
       -7.56689987e+01, -7.44238815e+01, -7.13286743e+01, -6.31676712e+01,
       -4.78859177e+01, -2.55000858e+01, -8.91213512e+00, -6.69313622e+00,
       -7.49182892e+00, -7.77553177e+00, -5.95756483e+00, -4.07660446e+01,
       -3.39215064e+00, -3.20611858e+00, -2.80658746e+00, -3.76255274e+00,
       -3.28823900e+00, -3.56558752e+00, -3.61519289e+00, -3.65670705e+00,
       -3.69335079e+00, -3.75100517e+00, -3.80976868e+00, -3.86859274e+00,
       -3.92691731e+00, -3.98528218e+00, -4.04493189e+00, -4.12037754e+00,
       -4.23934221e+00, -4.46965265e+00, -4.86222506e+00, -5.45884609e+00,
       -6.36676455e+00, -7.64070988e+00, -8.42901039e+00, -1.02713814e+01,
       -1.17138824e+01, -1.32172060e+01, -1.51669121e+01, -1.63782806e+01,
       -1.71085663e+01, -1.72246361e+01, -1.68282394e+01, -1.59340067e+01,
       -1.46620646e+01, -1.31751919e+01, -1.18127279e+01, -1.05238180e+01,
       -9.44720078e+00, -8.70117283e+00, -8.02464008e+00, -8.25844955e+00,
       -8.08924580e+00, -8.58809853e+00, -1.07655649e+01, -1.23484564e+01,
       -1.17173996e+01, -1.69791241e+01, -3.73175049e+01, -3.78082047e+01,
       -1.29854136e+01, -8.59187222e+00, -5.51039791e+00, -4.49425173e+00,
       -2.11484361e+00, -5.39659381e-01, -3.05729151e-01, -1.02887619e+00,
       -2.39948511e+00, -4.17811203e+00, -6.03633499e+00, -8.78879166e+00,
       -1.05267792e+01, -1.04803600e+01, -7.72599506e+00, -6.28757811e+00,
       -5.56222486e+00, -5.94350004e+00, -6.62787819e+00, -6.35691738e+00,
       -6.40364695e+00, -6.59416723e+00, -5.65964174e+00, -4.55607796e+00,
       -3.59123397e+00, -2.60733819e+00, -2.00870919e+00, -1.57690525e+00,
       -1.81723070e+00, -4.53784347e-01, -4.18651462e-01, -1.32488930e+00,
       -1.62047303e+00, -1.07867146e+00, -1.59382331e+00, -1.12594151e+00,
       -4.80221540e-01, -1.78841710e+00, -2.15751052e+00, -1.31634295e+00,
       -9.05474961e-01, -9.67128873e-01, -7.26600647e-01, -6.54373467e-01,
       -5.70992827e-01, -4.78263080e-01, -4.95572448e-01, -4.15244937e-01,
       -2.99986154e-01, -2.37761542e-01, -2.41634145e-01, -1.84509277e-01,
       -1.11052684e-01, -9.55172777e-02, -9.38483328e-02, -7.12531209e-02,
       -1.04240499e-01, -1.66024074e-01, -2.48048440e-01, -2.39981160e-01,
       -2.31038570e-01, -1.33141562e-01, -7.78507963e-02, -6.81829527e-02,
       -7.06944242e-02,             nan,             nan,             nan,
                   nan,             nan,             nan,             nan,
                   nan,             nan,             nan,             nan,
                   nan,             nan,             nan,             nan,
                   nan,             nan,             nan,             nan,
                   nan], dtype=float32)
Coordinates:
  * depth      (depth) float64 -0.5 -1.5 -2.5 ... -5.666e+03 -5.766e+03
    latitude   float32 0.025052192
    longitude  float32 -110.01001
    time       datetime64[ns] 1995-09-17T16:00:00
dfrith = (
gcm1.budget.DFrI_TH.sel(longitude=full.longitude, method="nearest")
.isel(**region, time=100)
.load()
)
expected = dfrith

expected.plot(y="depth")
(full.Jq / 1035 / 3999 * CV).isel(**region, time=100).plot(y="depth")
[<matplotlib.lines.Line2D at 0x2acaf7a95410>]
metrics
<xarray.Dataset>
Dimensions:    (depth: 345, depth_left: 346, latitude: 480, longitude: 1500)
Coordinates:
  * depth      (depth) float64 -0.5 -1.5 -2.5 ... -5.666e+03 -5.766e+03
  * latitude   (latitude) float64 -12.0 -11.95 -11.9 -11.85 ... 11.9 11.95 12.0
  * longitude  (longitude) float64 -170.0 -169.9 -169.9 ... -95.1 -95.05 -95.0
Dimensions without coordinates: depth_left
Data variables:
    hFacC      (depth, latitude, longitude) float32 dask.array<chunksize=(345, 480, 1500), meta=np.ndarray>
    RAC        (latitude, longitude) float32 dask.array<chunksize=(480, 1500), meta=np.ndarray>
    DXC        (latitude, longitude) float32 dask.array<chunksize=(480, 1500), meta=np.ndarray>
    DYC        (latitude, longitude) float32 dask.array<chunksize=(480, 1500), meta=np.ndarray>
    RF         (depth_left) float32 dask.array<chunksize=(346,), meta=np.ndarray>
    rAw        (latitude, longitude) float32 dask.array<chunksize=(480, 1500), meta=np.ndarray>
    hFacW      (depth, latitude, longitude) float32 dask.array<chunksize=(345, 480, 1500), meta=np.ndarray>
    dRF        (depth) float32 dask.array<chunksize=(345,), meta=np.ndarray>
    dRC        (depth_left) float32 dask.array<chunksize=(346,), meta=np.ndarray>
cellvol (latitude, longitude, depth) float32 dask.array<chunksize=(480, 1500, 345), meta=np.ndarray>%matplotlib qt
rhoFacF = 346
deepFac2F = 1
submetrics = metrics.sel(longitude=full.longitude, method="nearest").assign_coords(
longitude=full.longitude
)
dz = submetrics.dRF
# dz = submetrics.dRC[:-1].rename({"depth_left": "depth"}).assign_coords(depth=submetrics.depth)
A = submetrics.RAC
CV = submetrics.cellvol
region = dict(longitude=0, latitude=240, time=100)
recon = (
full.KPP_diffusivity * full.theta.diff("depth").reindex(depth=full.depth) * A / dz
).isel(**region)
expected = (full.Jq / 1035 / 3999 * CV).isel(**region)
(recon).plot(y="depth")
(expected).plot(y="depth")
work on dcl, mld detection#
mld = pump.calc.get_mld(full_subset.dens)
dcl_base = pump.calc.get_dcl_base_Ri(full_subset, mld, euc_max)

region = dict(longitude=-110, latitude=-4, method="nearest")
tslice = slice("1995-12-01", "1996-12-05")
# tslice=slice("1995-12-21", "1996-01-21")

rho, r, m, d = dask.compute(
    full_subset.dens.sel(**region).sel(time=tslice),
    full_subset.Ri.sel(**region).sel(time=tslice),
    mld.sel(**region).sel(time=tslice),
    dcl_base.sel(**region).sel(time=tslice),
)
dd = d.diff("time", label="lower")  # .plot(color='k')
d = d.where(np.abs(dd) < 45).ffill("time")
(d - m).resample(time="D").median().plot()
[<matplotlib.lines.Line2D at 0x2ba1b3356490>]

%matplotlib inline
tt = "1996-01-15 20:00"
r.sel(time=tt).plot(y="depth", xscale="log")
dcpy.plots.linex(0.5)
dcpy.plots.liney(m.sel(time=tt))
dcpy.plots.liney(d.sel(time=tt), color="r")
plt.gca().text(
    0.8, 0.8, f"DCL={(m-d).sel(time=tt).values}m", transform=plt.gca().transAxes
)
Text(0.8, 0.8, 'DCL=43.0m')
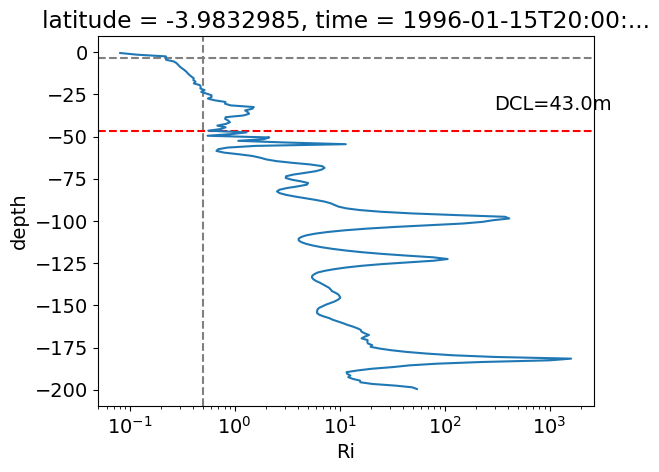
r.where((r.depth < m) & (r.depth > d)).median("depth").plot()
[<matplotlib.lines.Line2D at 0x2ba1a5d8b8d0>]
%matplotlib qt

f, ax = plt.subplots(2, 1, sharex=True, sharey=True)
r.plot(
    ax=ax[0],
    # robust=True,
    # vmin=-1,
    # vmax=1,
    # center=0,
    # cmap=mpl.cm.RdBu_r,
    norm=mpl.colors.LogNorm(0.25, 1),
    x="time",
    ylim=(-150, 0),
)
m.plot.line(ax=ax[0], x="time", color="k")
d.plot.line(ax=ax[0], x="time", color="r")
d.resample(time="D").mean().plot(ax=ax[0], x="time", color="b")

cum_Ri = r.where((r > 0) & (r.depth < m)).cumsum("depth") / r.depth.copy(
    data=np.arange(1, r.sizes["depth"] + 1)
)
cum_Ri.plot(
    ax=ax[1],
    # robust=True,
    # vmin=-1,
    # vmax=1,
    # center=0,
    cmap=mpl.cm.RdBu_r,
    norm=mpl.colors.LogNorm(0.25, 1),
    x="time",
    ylim=(-150, 0),
)
m.plot.line(ax=ax[1], x="time", color="k")
d.plot.line(ax=ax[1], x="time", color="r")
[<matplotlib.lines.Line2D at 0x2ba1b2f74f50>]
plt.figure()
(
    (rho.differentiate("depth") * -9.81 / 1025)
    # .sel(time=slice("1995-11-26", "1995-11-30"), depth=slice(0, -50))
    .plot(y="depth", robust=True)
)
%matplotlib qt

lon = -110

good_mask = dcl_base.period.sel(longitude=lon).isin(pump.composite.good_periods[lon])

fg = (
    np.abs(dcl_base - mld)
    .sel(longitude=lon)
    .where(good_mask, drop=True)
    .groupby("period")
    .plot(
        col="period", col_wrap=4, x="time", robust=True, cmap=mpl.cm.Blues, sharey=True
    )
)

sst_mask = sst.sel(longitude=-110).where(good_mask, drop=True).load()

for loc, ax in zip(fg.name_dicts.flat, fg.axes.flat):
    if loc is not None:
        (
            sst_mask.where(sst_mask.period == loc["period"], drop=True)
            .pipe(lambda x: x - x.mean("time"))
            .plot.contour(
                cmap=mpl.cm.RdGy_r,
                levels=5,
                linewidths=1,
                ax=ax,
                robust=True,
                x="time",
                add_labels=False,
            )
        )
/glade/u/home/dcherian/python/xarray/xarray/core/common.py:664: FutureWarning: This DataArray contains multi-dimensional coordinates. In the future, the dimension order of these coordinates will be restored as well unless you specify restore_coord_dims=False.
  self, group, squeeze=squeeze, restore_coord_dims=restore_coord_dims
distributed.utils_perf - WARNING - full garbage collections took 11% CPU time recently (threshold: 10%)
distributed.utils_perf - WARNING - full garbage collections took 14% CPU time recently (threshold: 10%)
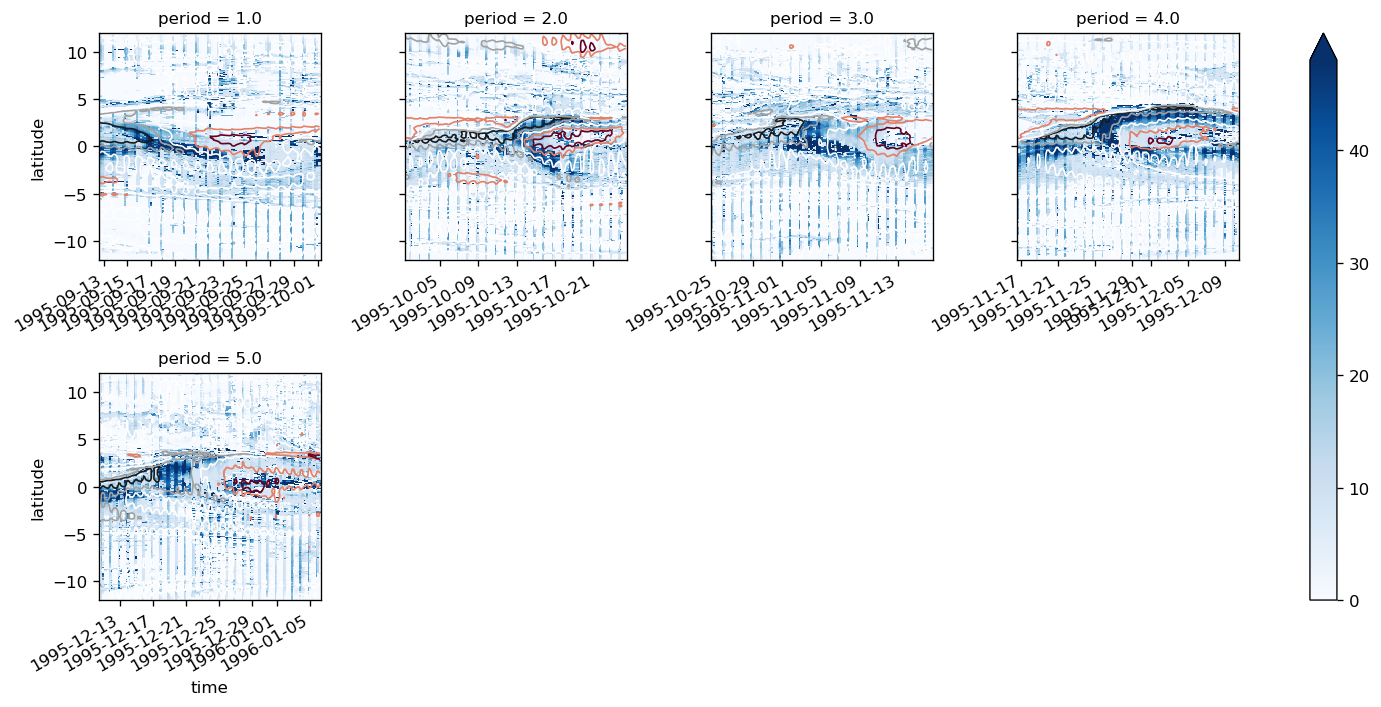
Test out new phase detection#
With -110 as a special case for bandpass window and prominence
lon = -110

sst_anom = sst.assign_coords(period=period, tiw_ptp=tiw_ptp, tiw_phase=tiw_phase).sel(
    longitude=lon
)
sst_anom = sst_anom.groupby("period") - sst_anom.groupby("period").mean("time")
sst_anom.load()

good_periods = pump.composite.good_periods[lon]

fg = sst_anom.groupby("period").plot(
    col="period",
    col_wrap=4,
    robust=True,
    sharey=True,
    x="time",
    add_colorbar=False,
)

fg.fig.suptitle(f"longitude={lon}")

for loc, ax in zip(fg.name_dicts.flat, fg.axes.flat):
    if loc is not None:
        newtitle = (
            ax.get_title()
            + f" | ptp={np.round(fg.data.get_group(loc['period']).tiw_ptp.values[0], 1)}"
        )
        ax.set_title(newtitle)

        if loc["period"] not in good_periods:
            ax.add_patch(
                mpl.patches.Rectangle(
                    (0, 0),
                    1,
                    1,
                    transform=ax.transAxes,
                    color="w",
                    alpha=0.7,
                )
            )
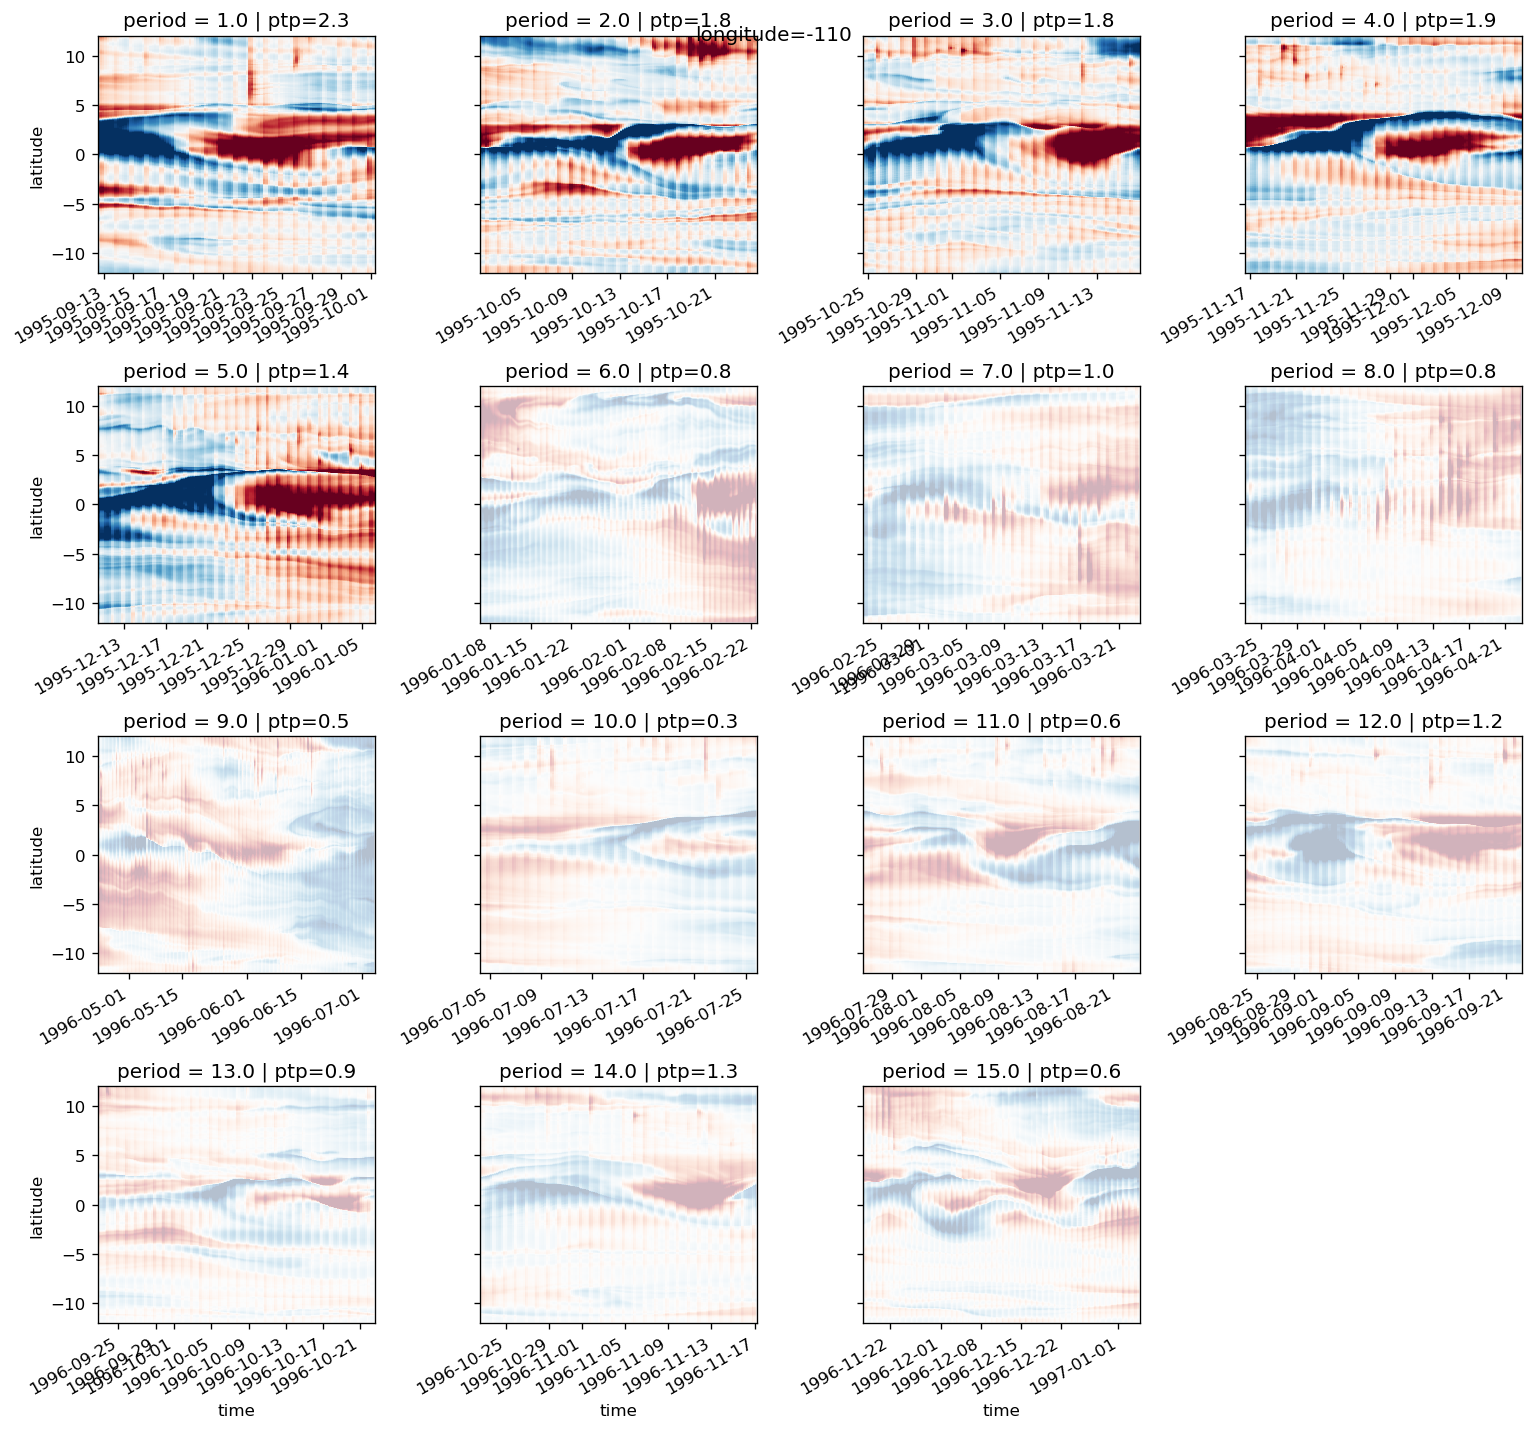
ds = xr.Dataset()
ds["sst"] = sstfilt
ds["grad"] = gradT

a = pump.calc._find_phase_single_lon(
    ds.sel(longitude=[-110], time=slice(None, "1996-03-01")).compute(), debug=True
)
[764 856 878]
<xarray.DataArray 'tiw_phase' (period: 6)>
array([172.7027027 , 170.        , 145.58823529, 123.42857143,
        55.38461538, 210.        ])
Coordinates:
    time       (period) datetime64[ns] 1995-09-18T08:00:00 ... 1996-02-12T04:00:00
    longitude  int64 -110
  * period     (period) float64 1.0 2.0 3.0 4.0 5.0 6.0
/glade/u/home/dcherian/pump/pump/calc.py:578: UserWarning: Found periods where SST front is before phase=90: [5.]
  #  IPython; IPython.core.debugger.set_trace()
5.0
[0.64294219 0.78497016]
<xarray.DataArray 'time' (time: 2)>
array(['1995-12-14T12:00:00.000000000', '1995-12-17T16:00:00.000000000'],
      dtype='datetime64[ns]')
Coordinates:
  * time       (time) datetime64[ns] 1995-12-14T12:00:00 1995-12-17T16:00:00
    longitude  int64 -110
    tiw_phase  (time) float64 55.38 99.0
    period     (time) float64 5.0 5.0
Attributes:
    long_name:            Time (hours since 1950-01-01)
    standard_name:        time
    axis:                 T
    _CoordinateAxisType:  Time
1995-12-17T16:00:00.000000000
99.0
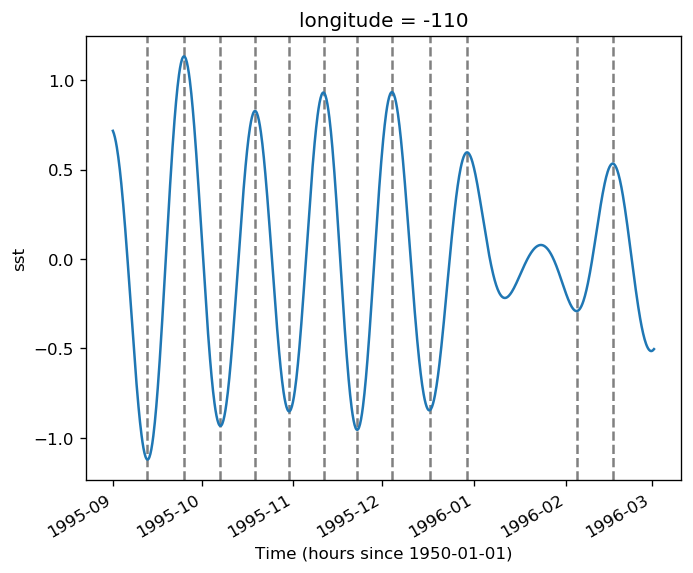
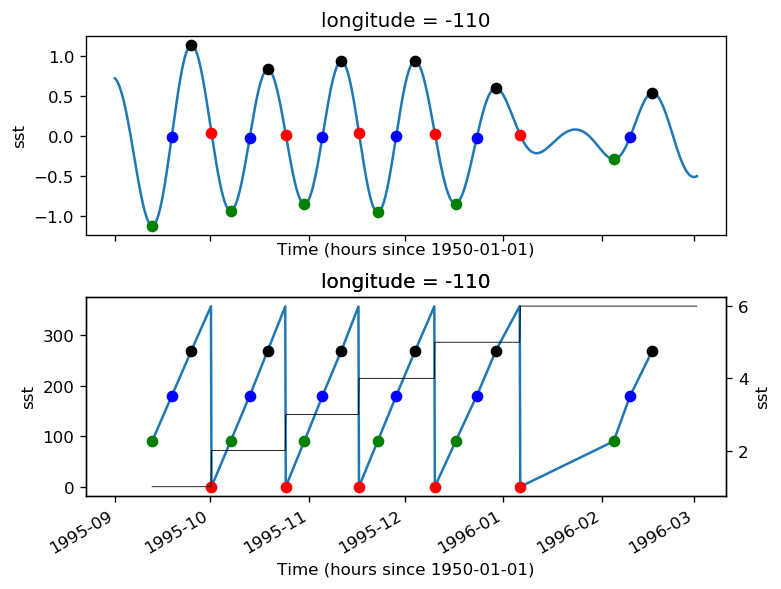
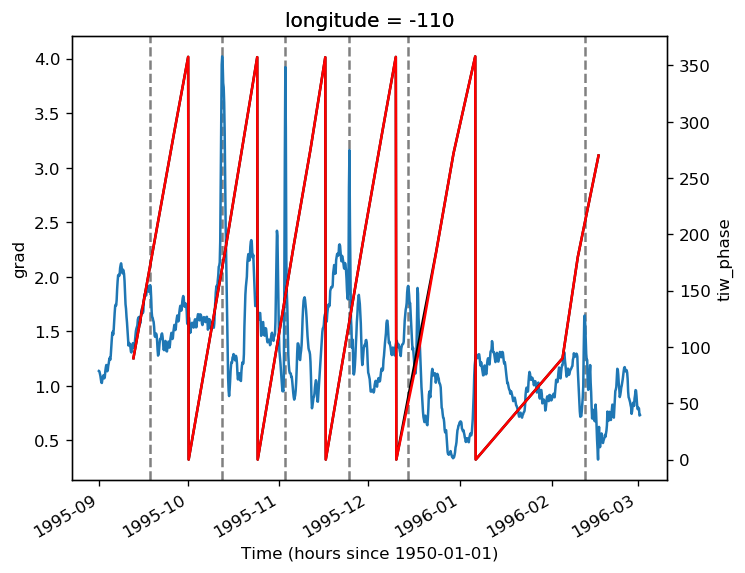
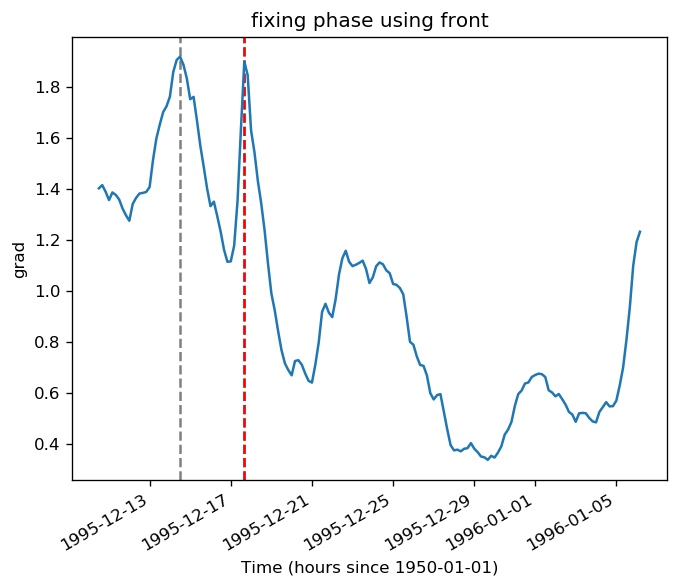
tiw_ptp.sortby("longitude").squeeze().plot(col="longitude")
<xarray.plot.facetgrid.FacetGrid at 0x2b616bc41850>
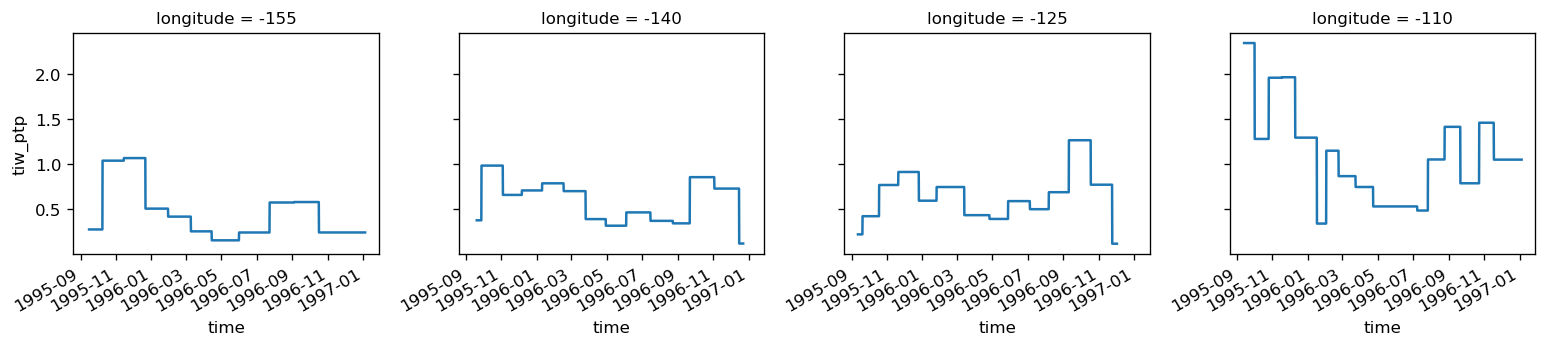
SST gradient front detection#
grad = gradT_subset.sel(latitude=slice(0, 3)).mean("latitude")

grad.groupby(grad.period).plot(
    col="period",
    col_wrap=4,
    x="tiw_phase",
    xticks=[0, 90, 180, 270, 360],
)
<xarray.plot.facetgrid.FacetGrid at 0x2b4946430050>
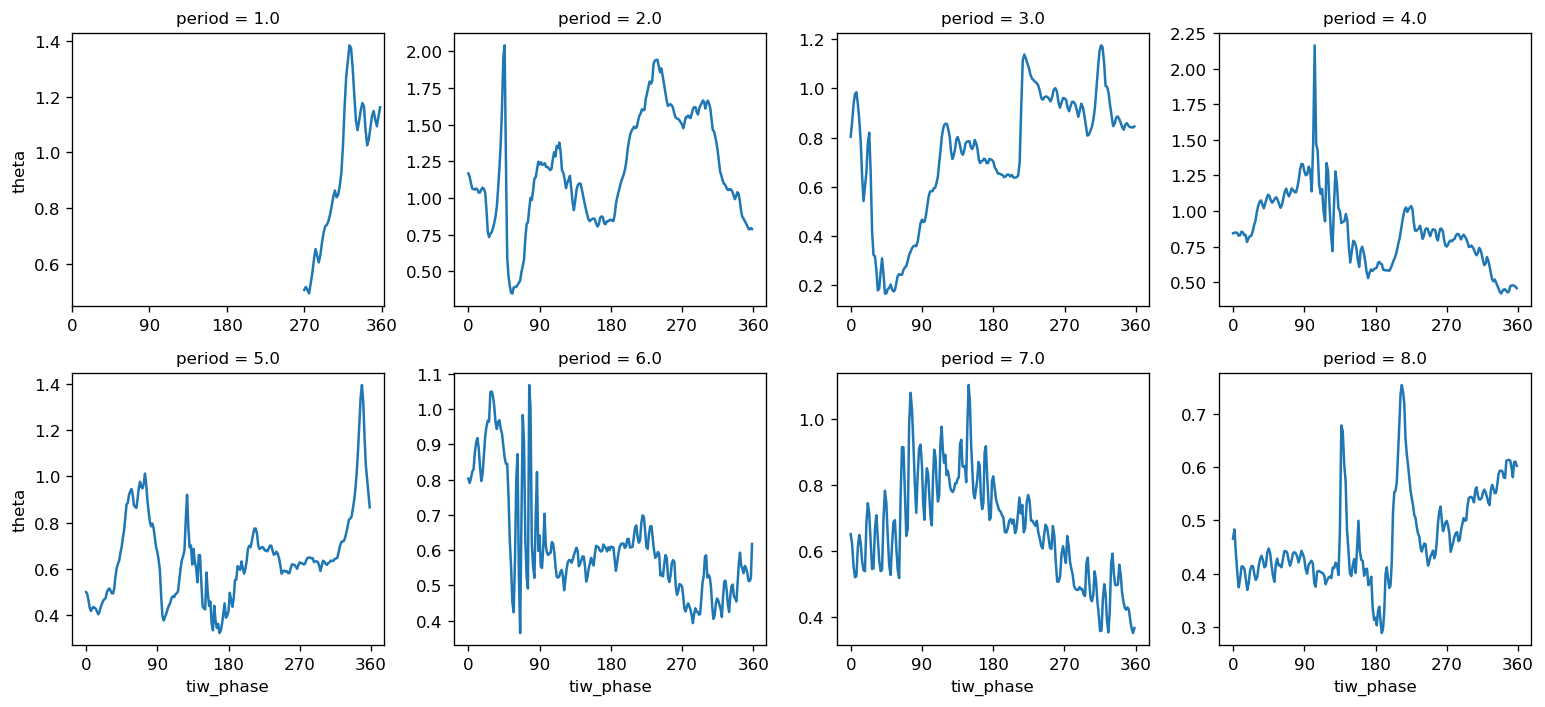
SST = sstfilt.sel(longitude=-110)
dSSTdt = np.abs(SST.differentiate("time"))

thresh = dSSTdt.quantile(q=0.2, dim="time")

for_zeros = SST.where(
    ~((np.abs(SST) < np.abs(SST).quantile(q=0.1, dim="time")) & (dSSTdt < thresh))
).fillna(0)

(for_zeros.plot())
ax2 = plt.gca().twinx()
dSSTdt.plot(ax=ax2, color="k")
dcpy.plots.liney(thresh, ax=ax2)
zeros = pump.calc.crossings_nonzero_all(for_zeros.values)
dcpy.plots.linex(SST.time[zeros[30:]], lw=0.5)
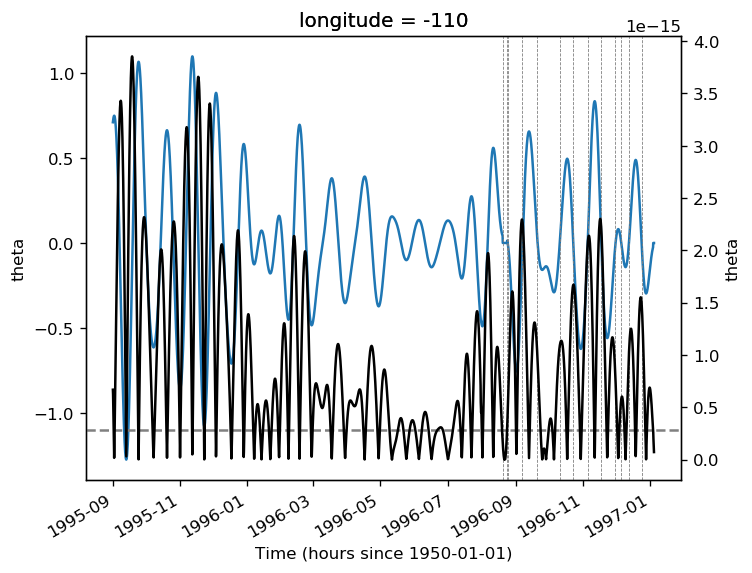
%matplotlib inline

ds = xr.Dataset()
ds["sst"] = sstfilt
ds["grad"] = gradT

a = pump.calc._find_phase_single_lon(ds.sel(longitude=[-110]).compute(), debug=True)
fixing -110
<xarray.DataArray 'tiw_phase' (period: 15)>
array([172.7027027 , 160.        , 145.58823529, 123.42857143,
        55.38461538, 210.        ,  33.75      , 264.375     ,
       162.96529968, 174.54545455, 225.        , 110.25      ,
       146.73913043, 324.47368421,  33.42857143])
Coordinates:
    time       (period) datetime64[ns] 1995-09-18T08:00:00 ... 1996-11-19T12:00:00
    longitude  int64 -110
  * period     (period) float64 1.0 2.0 3.0 4.0 5.0 ... 11.0 12.0 13.0 14.0 15.0
/glade/u/home/dcherian/pump/pump/calc.py:586: UserWarning: Found periods where SST front is before phase=90: [ 5. 7. 15.]
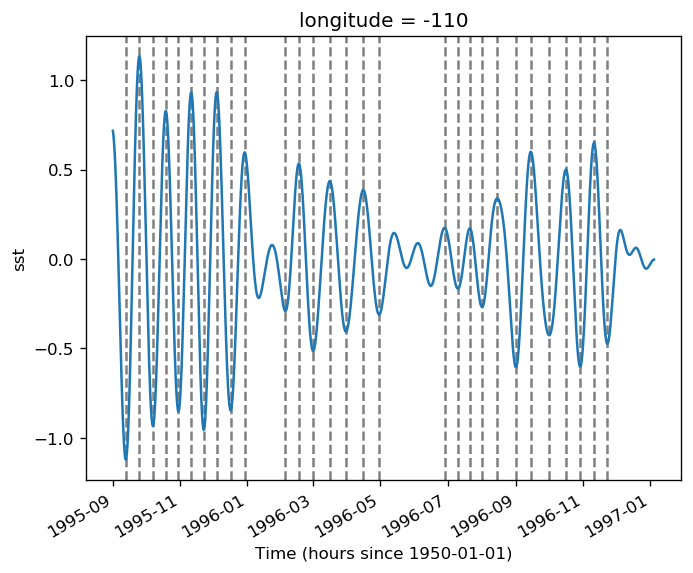
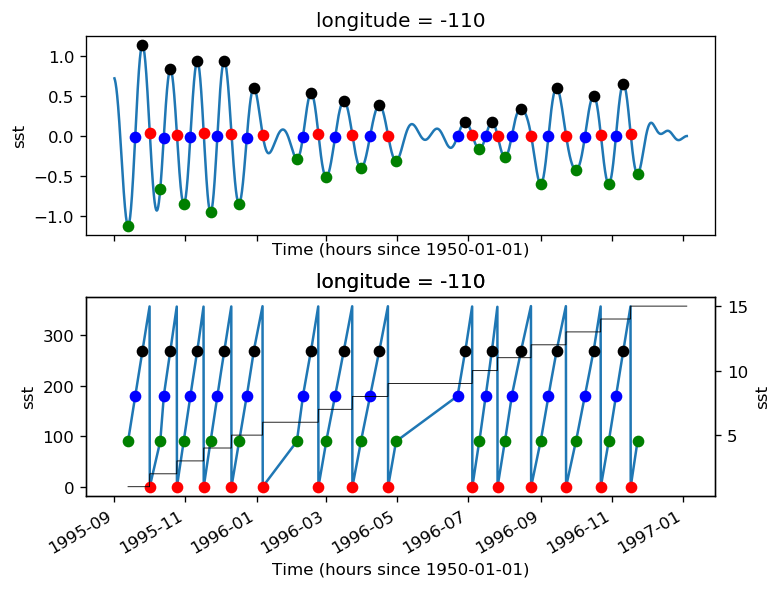
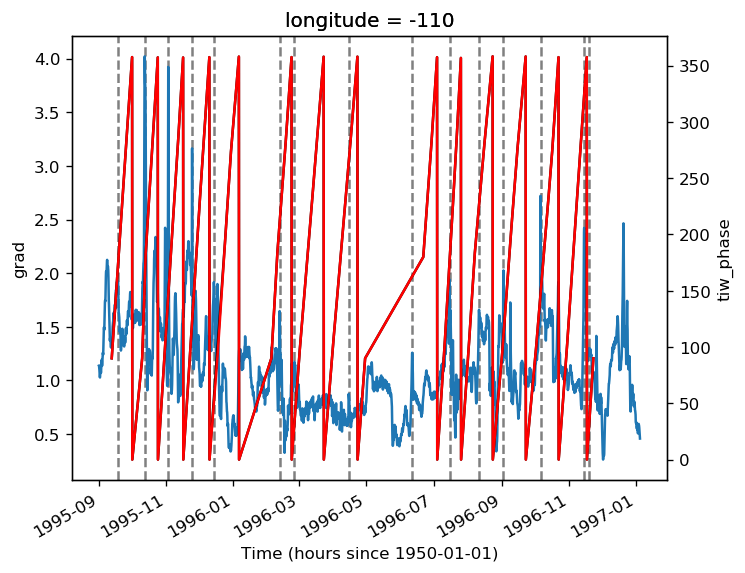
pump.plot.plot_debug_sst_front(model, -110, np.arange(1, 7))
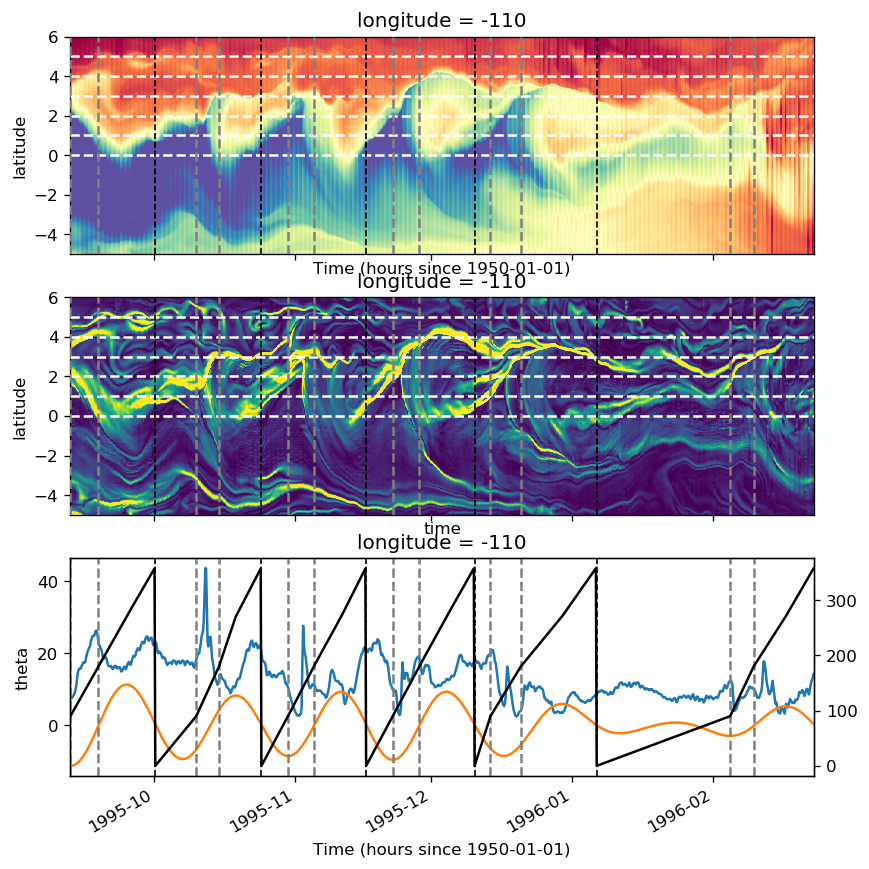
pump.plot.plot_debug_sst_front(model, -125, np.arange(1, 8))
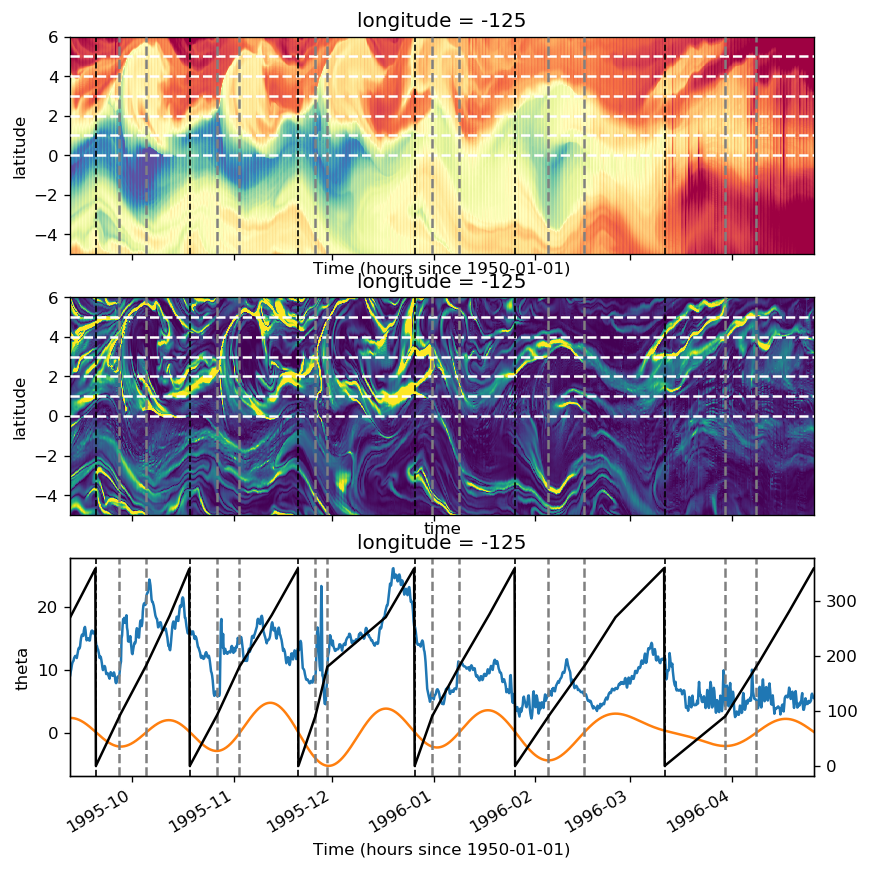
plot_debug_sst_front(-140, np.arange(1, 8))
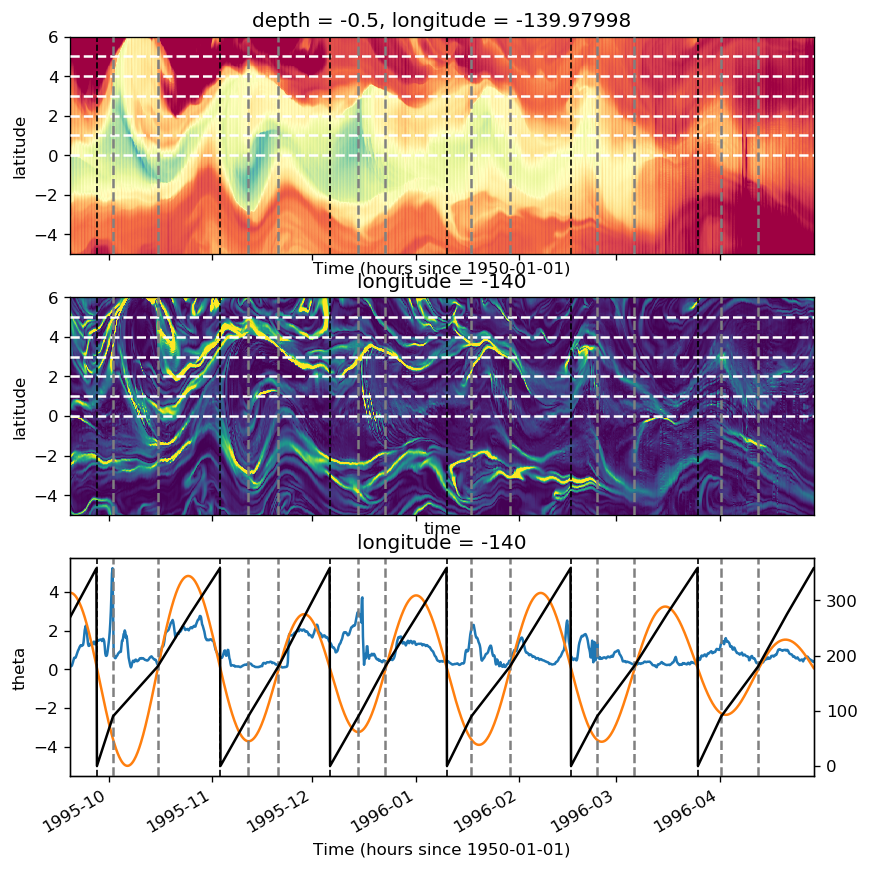
sst.sel(longitude=-110, time=year1).mean("time").plot(y="latitude")
sst.sel(longitude=-110, time=year2).mean("time").plot(y="latitude")
[<matplotlib.lines.Line2D at 0x2b496e1a63d0>]
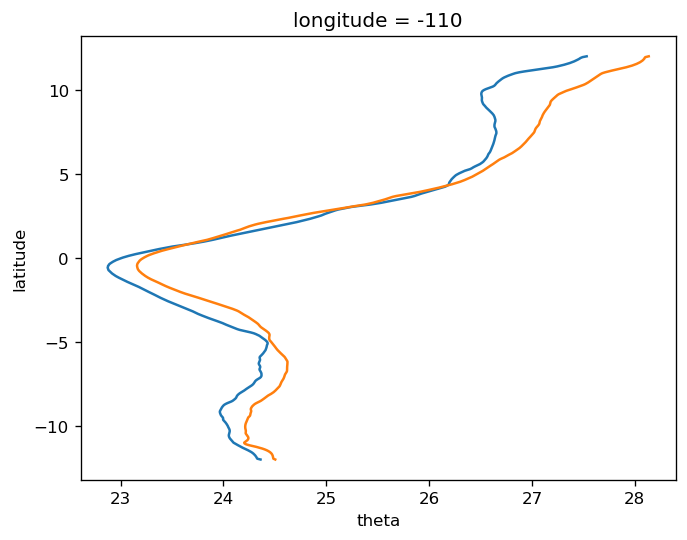
SST = sst.sel(longitude=-110, latitude=slice(-1, 4)).mean("latitude")

year1 = slice(None, "1996-03-01")
year2 = slice("1996-07-01", None)
yr1 = SST.sel(time=year1).compute()
yr2 = SST.sel(time=year2).compute()

dcpy.ts.PlotSpectrum(yr1, preserve_area=True)
dcpy.ts.PlotSpectrum(yr2, ax=plt.gca(), preserve_area=True)
([<matplotlib.lines.Line2D at 0x2b4971bc2ad0>],
 <matplotlib.axes._subplots.AxesSubplot at 0x2b496de55c10>)
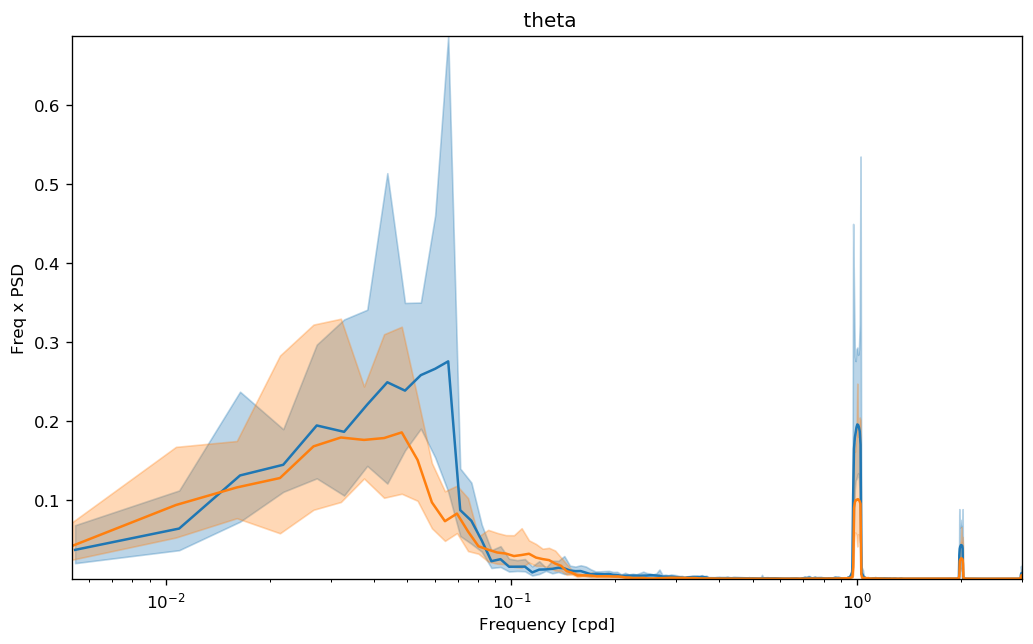
import scipy as sp

grad = gradT_subset.sel(latitude=slice(2, 3)).mean("latitude")

maxs = sp.signal.find_peaks(grad, prominence=0.3, distance=24)[0]
mins = sp.signal.find_peaks(-grad, prominence=0.1, distance=24)[0]

grad.plot()
grad[np.concatenate([maxs, mins])].plot(marker=".", linestyle="none")
[<matplotlib.lines.Line2D at 0x2b496f664710>]
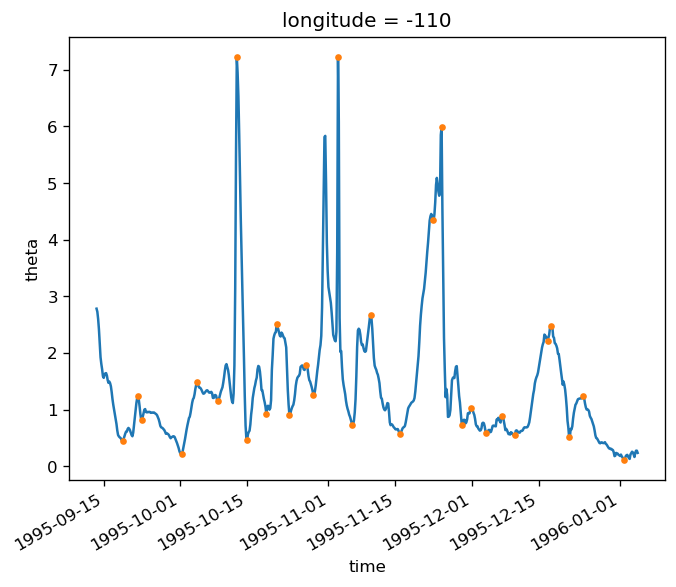
skimage feature detection experiments#
Not really getting anywhere. The medial_axis stuff was most promising but still too complex.
def skapply(data, func, *args, **kwargs):
    return data.copy(data=func(data.values, *args, **kwargs))


gradT = skapply(
    sst.sel(longitude=-110).isel(time=slice(None, None, 6)), skimage.filters.scharr
)
medial_axis#
(
    skapply(
        gradT_subset.where(gradT_subset > gradT_subset.quantile(q=0.9, dim=...), 0)
        .sel(latitude=slice(-5, 5))
        .clip(max=1),
        skimage.morphology.medial_axis,
    )
    .groupby("period")
    .plot(col="period", col_wrap=4, robust=True, vmin=0, x="time", cmap=mpl.cm.Greys_r)
)
<xarray.plot.facetgrid.FacetGrid at 0x2ae829ee2b90>
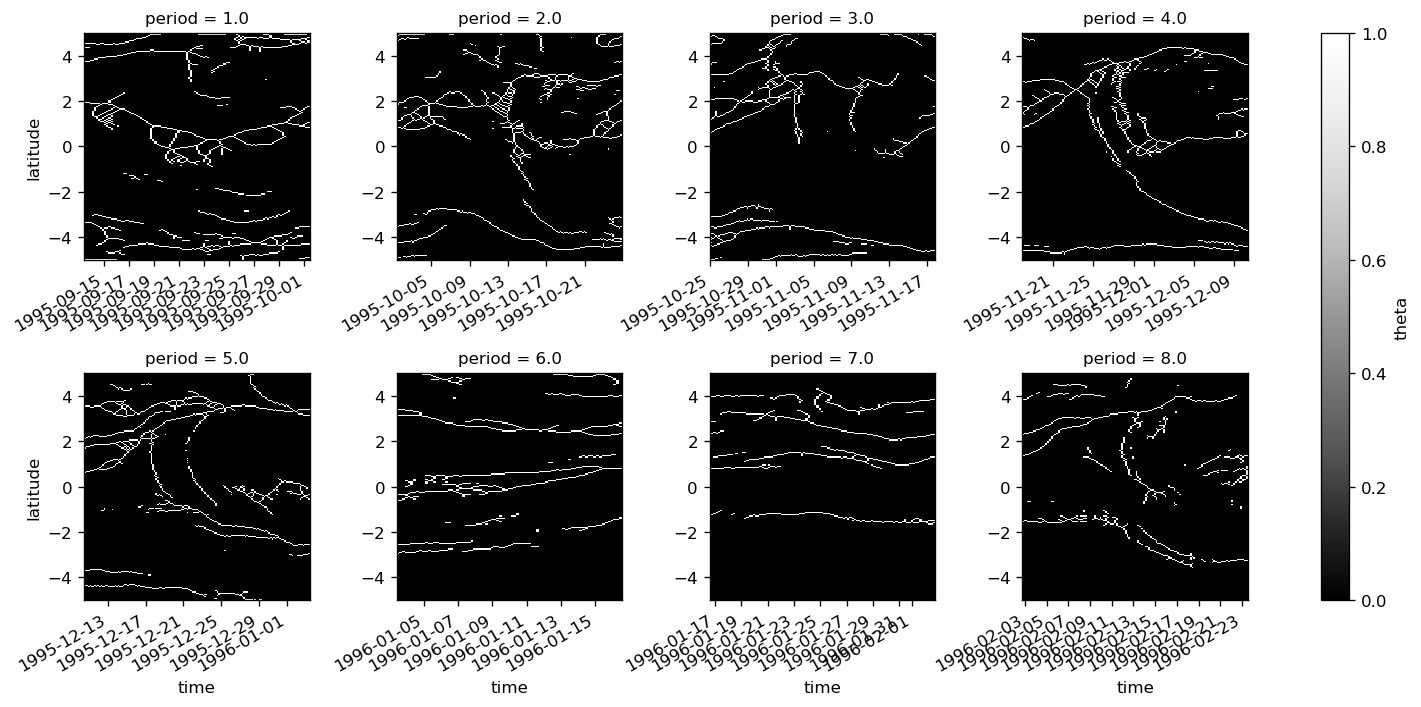
skeleton#
import skimage

mask = gradT_subset > gradT_subset.quantile(q=0.9, dim=...)

eq = gradT_subset.copy(data=skimage.exposure.equalize_hist(gradT_subset.values))

filt = gradT_subset.copy(data=skimage.filters.sato(eq, black_ridges=False))

skel = eq.copy(data=skimage.morphology.skeletonize(mask.values))

skel.groupby("period").plot(
    col="period", col_wrap=4, x="time", cmap=mpl.cm.Greys_r, robust=True
)
<xarray.plot.facetgrid.FacetGrid at 0x2ae82aa041d0>
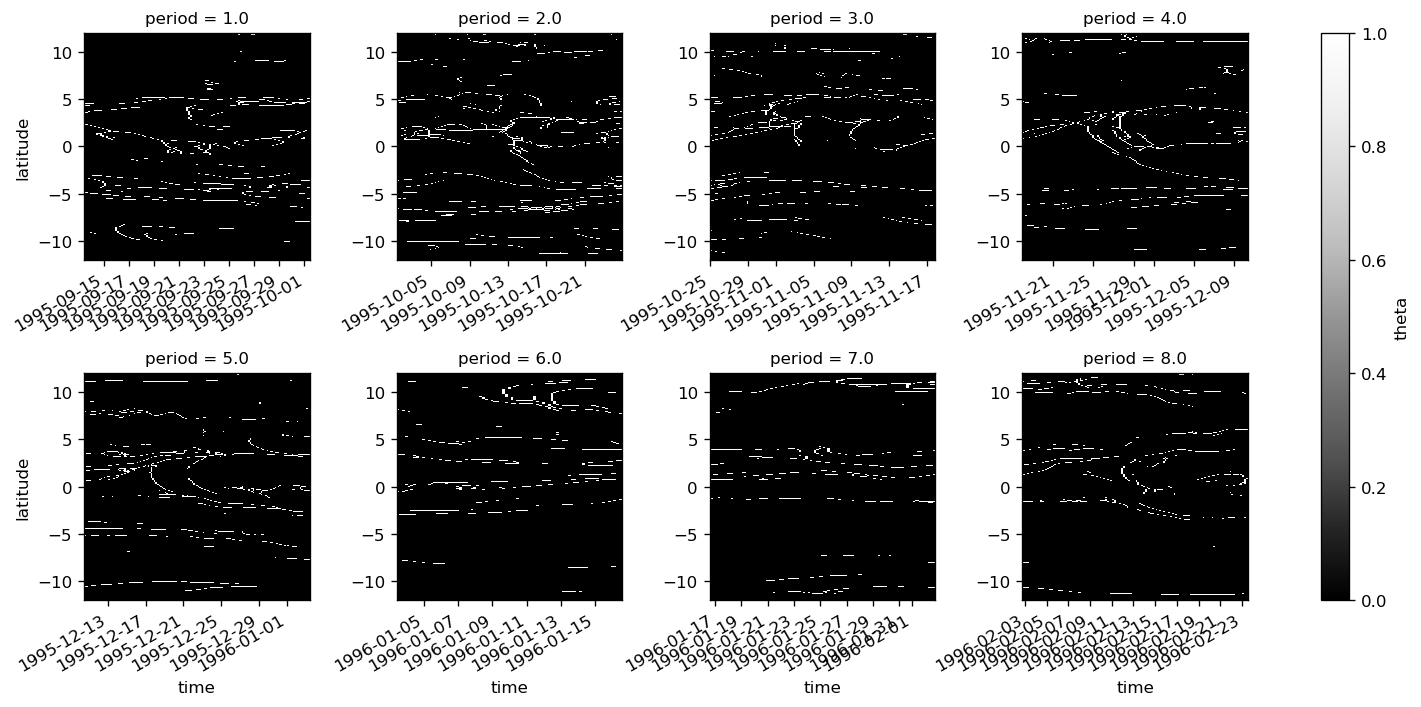
from skimage import feature

large = gradT_subset.where(gradT_subset > gradT_subset.quantile(q=0.5, dim=...), 0)

fronts = gradT_subset.copy(data=feature.canny(large.values, sigma=1))
# gradT_subset.plot(x="time")
plt.imshow(fronts.values, cmap=mpl.cm.Greys_r)
<matplotlib.image.AxesImage at 0x2ae7c815b5d0>
Am I filtering in the right band?#
On Jan 27, I switched to different bands for -110 and the rest
for lon in sst.longitude.values:
    dcpy.ts.PlotSpectrum(
        model.surface.theta.sel(longitude=lon, method="nearest")
        .sel(latitude=slice(-1, 3))
        .mean("latitude"),
        ax=plt.gca(),
        label=str(lon),
        preserve_area=True,
    )

dcpy.plots.linex([1 / 60, 1 / 15])
plt.legend()
<matplotlib.legend.Legend at 0x2b4ce9b89c90>
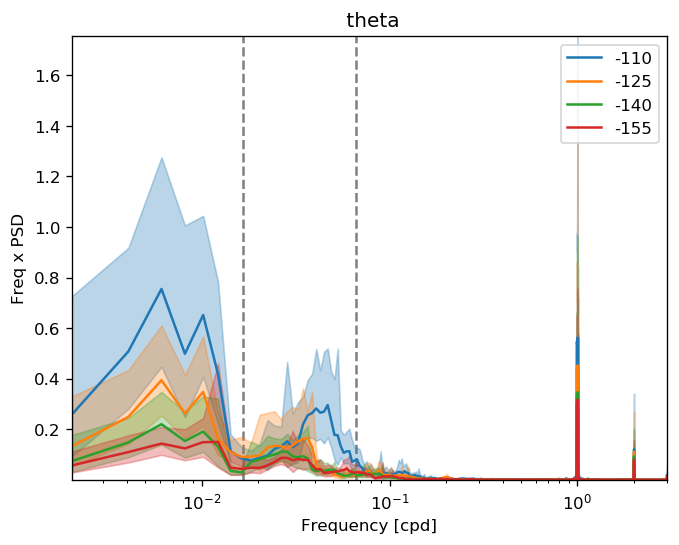
lowpass vs bandpass SST for phase calculation#
Am I filtering in the right band?#
for lon in sst.longitude.values:
    dcpy.ts.PlotSpectrum(
        model.surface.theta.sel(longitude=lon, method="nearest")
        .sel(latitude=slice(-1, 3))
        .mean("latitude"),
        ax=plt.gca(),
        label=str(lon),
        preserve_area=True,
    )

dcpy.plots.linex([1 / 60, 1 / 15])
plt.legend()
<matplotlib.legend.Legend at 0x2b4ce9b89c90>
sstfilt = xfilter.lowpass(
    sst.sel(longitude=[-110], latitude=slice(-1, 5)).mean("latitude"),
    coord="time",
    freq=1 / 15,
    cycles_per="D",
    num_discard=0,
    method="pad",
).load()
# sstfilt.plot()
tiw_phase_l, period_l = pump.calc.get_tiw_phase_sst(sstfilt, filt=False, debug=True)
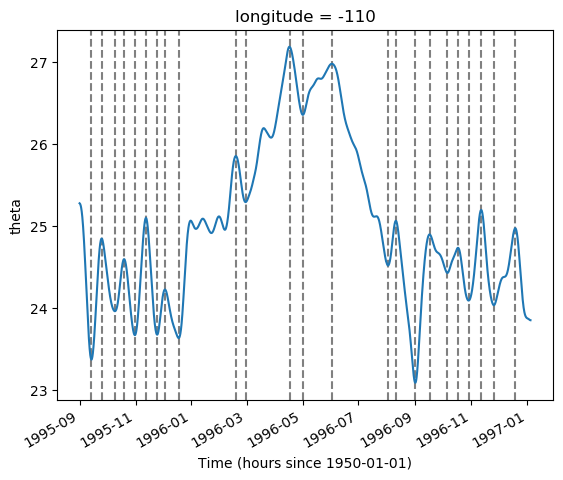
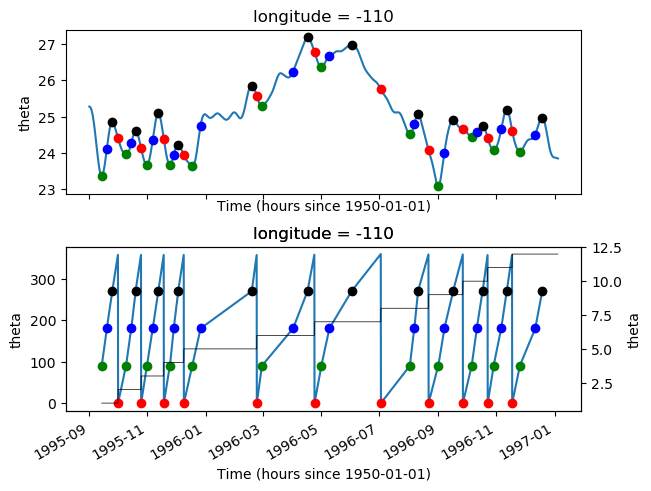
sstfilt = xfilter.bandpass(
    sst.sel(longitude=[-140], latitude=slice(-1, 5)).mean("latitude"),
    coord="time",
    freq=[1 / 40, 1 / 10],
    cycles_per="D",
    num_discard=0,
    method="pad",
).load()
# sstfilt.plot()
tiw_phase_b, period_b = pump.calc.get_tiw_phase_sst(sstfilt, filt=False, debug=True)
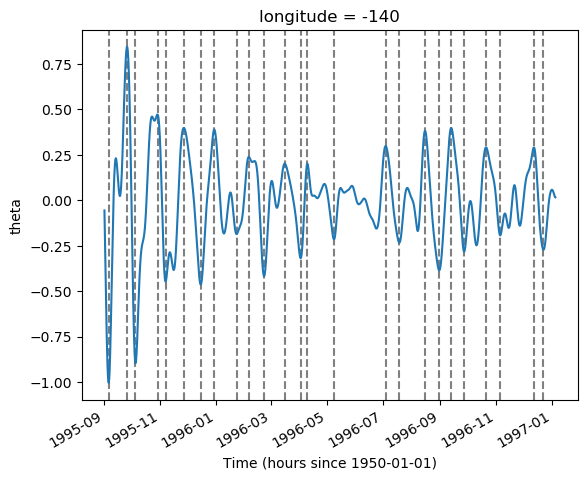
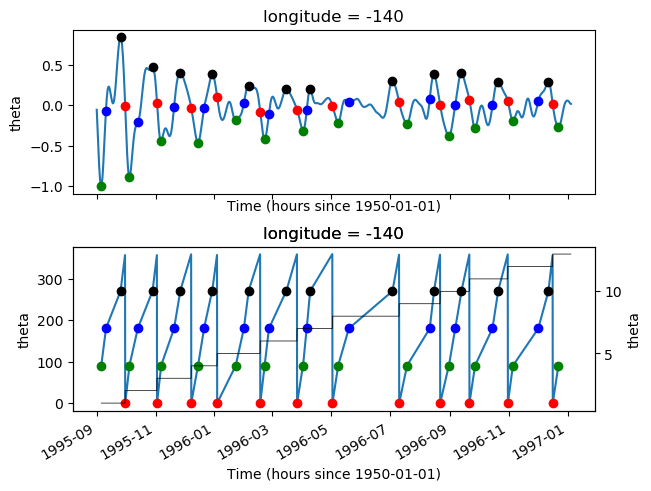
actually test#
import xfilter

theta = surf.theta.sel(longitude=longitudes).chunk({"longitude": 1})
periods = np.arange(1, 9)

# subset = theta.where(theta.period.isin(periods),drop=True)
sst = theta
sstfilt = xfilter.bandpass(
    sst.sel(latitude=slice(-1, 5)).mean("latitude"),
    coord="time",
    freq=[1 / 40, 1 / 10],
    cycles_per="D",
    num_discard=0,
    method="pad",
)

tiw_phase, period = dask.compute(
    pump.calc.get_tiw_phase_sst(sstfilt, filt=False, debug=False)
)[0]


def calc_ptp(obj, dim="time"):
    obj = obj.unstack()
    obj -= obj.mean()
    return obj.max(dim) - obj.min(dim)


tiw_ptp = sstfilt.groupby(period).map(calc_ptp).load()

plt.figure()
tiw_ptp.plot.line(x="period")

tiw_ptp = (
    tiw_ptp.sel(period=period.dropna("time"), longitude=period.longitude)
    .reindex(time=period.time)
    .drop("period")
)

sst_sub = (
    sst.pipe(
        xfilter.lowpass,
        coord="time",
        freq=1 / 7,
        cycles_per="D",
        num_discard=0,
        method="pad",
    )
    .assign_coords(period=period, tiw_phase=tiw_phase, tiw_ptp=tiw_ptp)
    .where(period.isin(periods), drop=True)
    .squeeze()
).load()
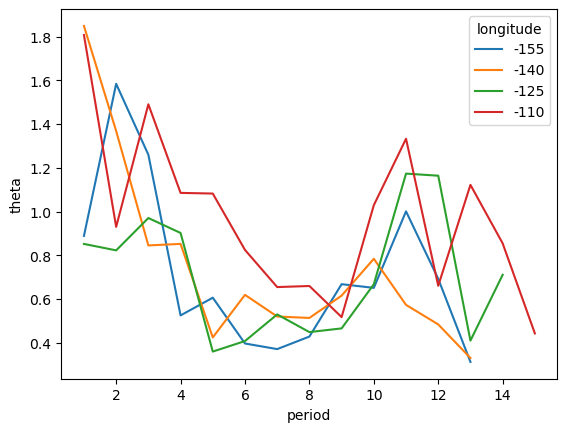
testing peak-to-peak filtering of TIW periods#
def detrend_period(obj):
    obj = obj.unstack()
    obj = pump.composite.detrend(obj.dropna("time", how="all"), "time")
    return obj


def calc_ptp(obj, dim="time"):
    obj = obj.unstack()
    obj = detrend(obj.dropna(dim, how="all"), dim)
    return obj.max(dim) - obj.min(dim)


tiw_ptp = sstfilt.groupby(period).map(calc_ptp).load()

plt.figure()
tiw_ptp.plot.line(x="period")


(
    sstfilt.assign_coords(tiw_phase=tiw_phase, period=period)
    .sel(longitude=-110)
    .groupby("period")
    .apply(detrend_period)
    .groupby("period")
    .plot(col="period", x="tiw_phase", col_wrap=4)
)
<xarray.plot.facetgrid.FacetGrid at 0x2b593af1a198>
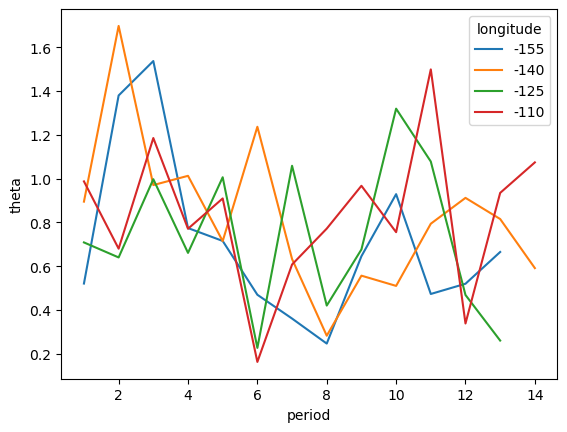
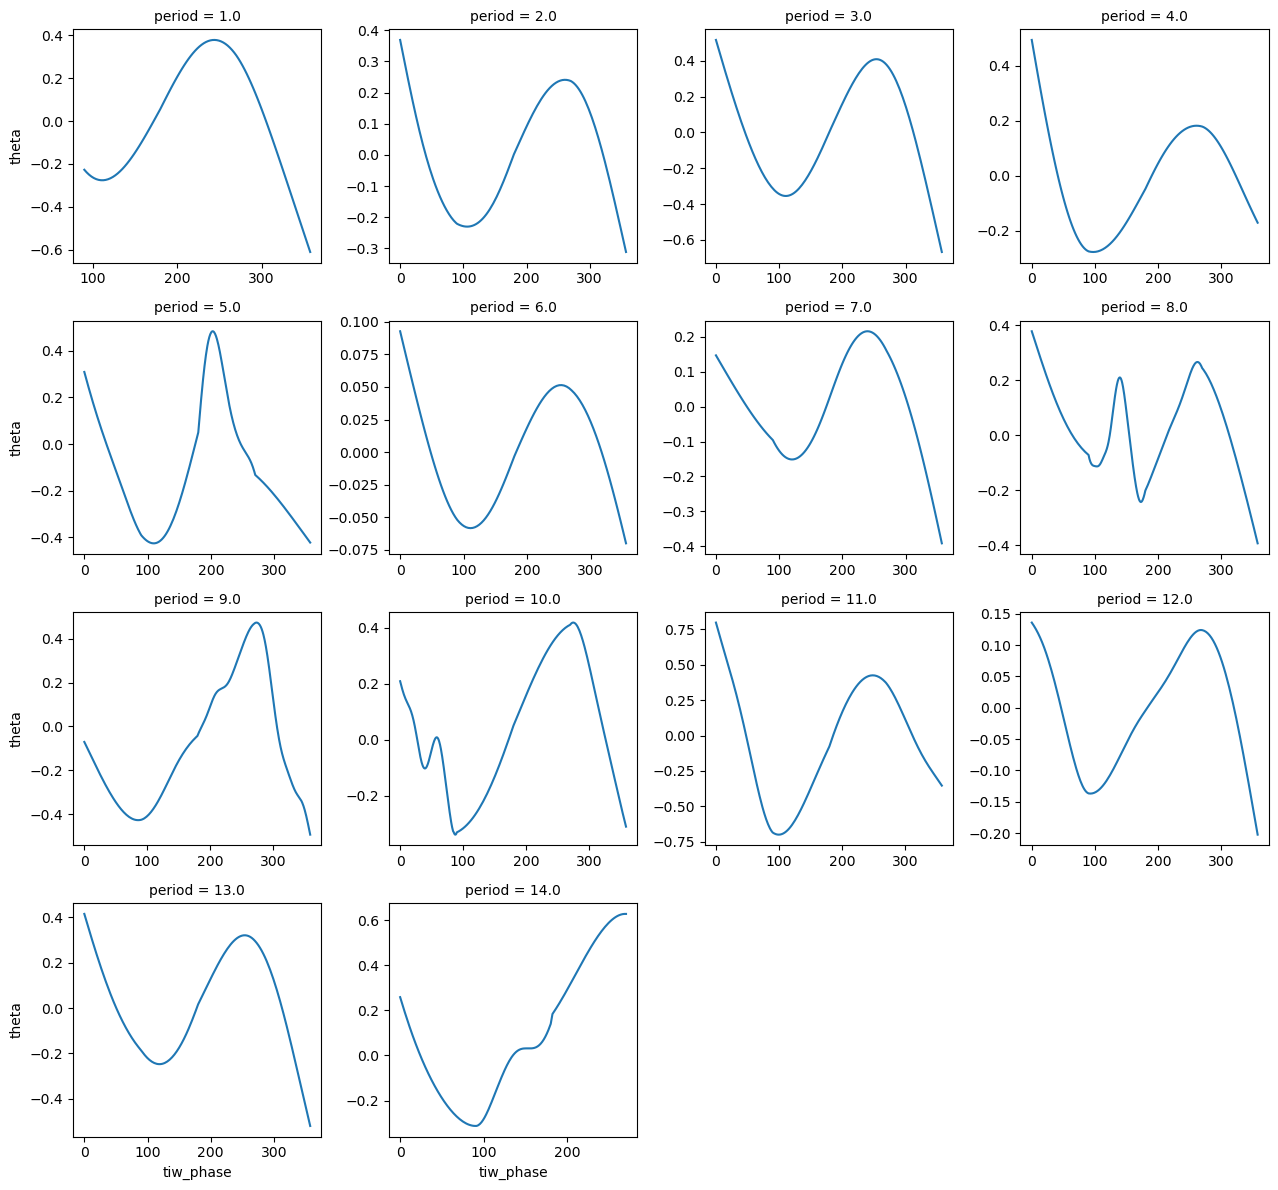
debugging y reference#
tiw_phase, period = pump.calc.get_tiw_phase_sst(
    sstfilt.sel(longitude=[-140]).load(), filt=False, debug=True
)
# anom = (sst_sub.groupby("period") - sst_sub.groupby("period").apply(lambda x: x.unstack().mean("time"))) #.expand_dims("longitude")
def plot_median(da, x, y, ax, **kwargs):
    med = da.quantile(q=0.5, dim=...).values
    da.plot.contour(ax=ax, levels=[med])


for lon in sst_sub.longitude:
    anom = sst_sub.sel(longitude=lon)
    anom = anom.groupby("period") - anom.groupby("period").mean("time")
    fg = anom.groupby("period").plot(
        col="period",
        col_wrap=4,
        x="time",
        robust=True,
        sharey=True,
        cmap=mpl.cm.RdYlBu_r,
    )
    # fg.map_dataarray(plot_median, x="time", y="latitude", add_colorbar=False)
    fg.fig.suptitle(f"longitude = {lon.values}", y=1.01)
/gpfs/u/home/dcherian/python/xarray/xarray/core/nanops.py:142: RuntimeWarning: Mean of empty slice
  return np.nanmean(a, axis=axis, dtype=dtype)
/gpfs/u/home/dcherian/python/xarray/xarray/core/nanops.py:142: RuntimeWarning: Mean of empty slice
  return np.nanmean(a, axis=axis, dtype=dtype)
/gpfs/u/home/dcherian/python/xarray/xarray/core/nanops.py:142: RuntimeWarning: Mean of empty slice
  return np.nanmean(a, axis=axis, dtype=dtype)
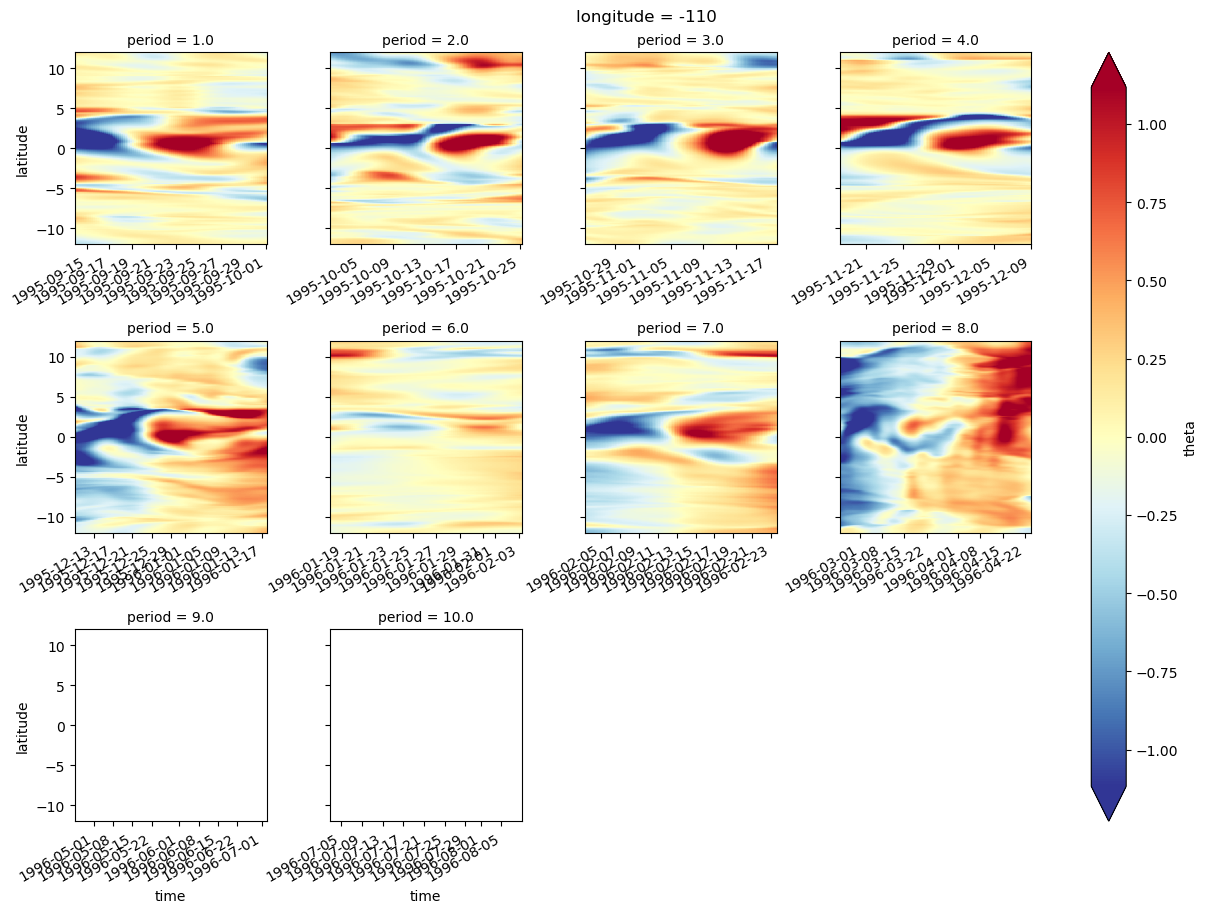
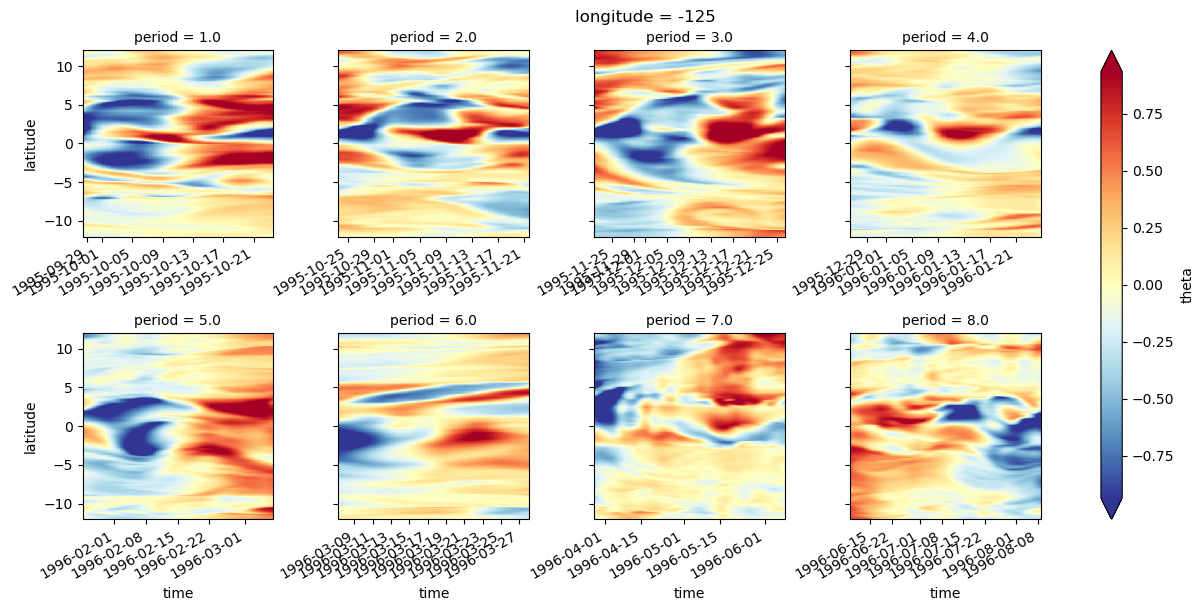
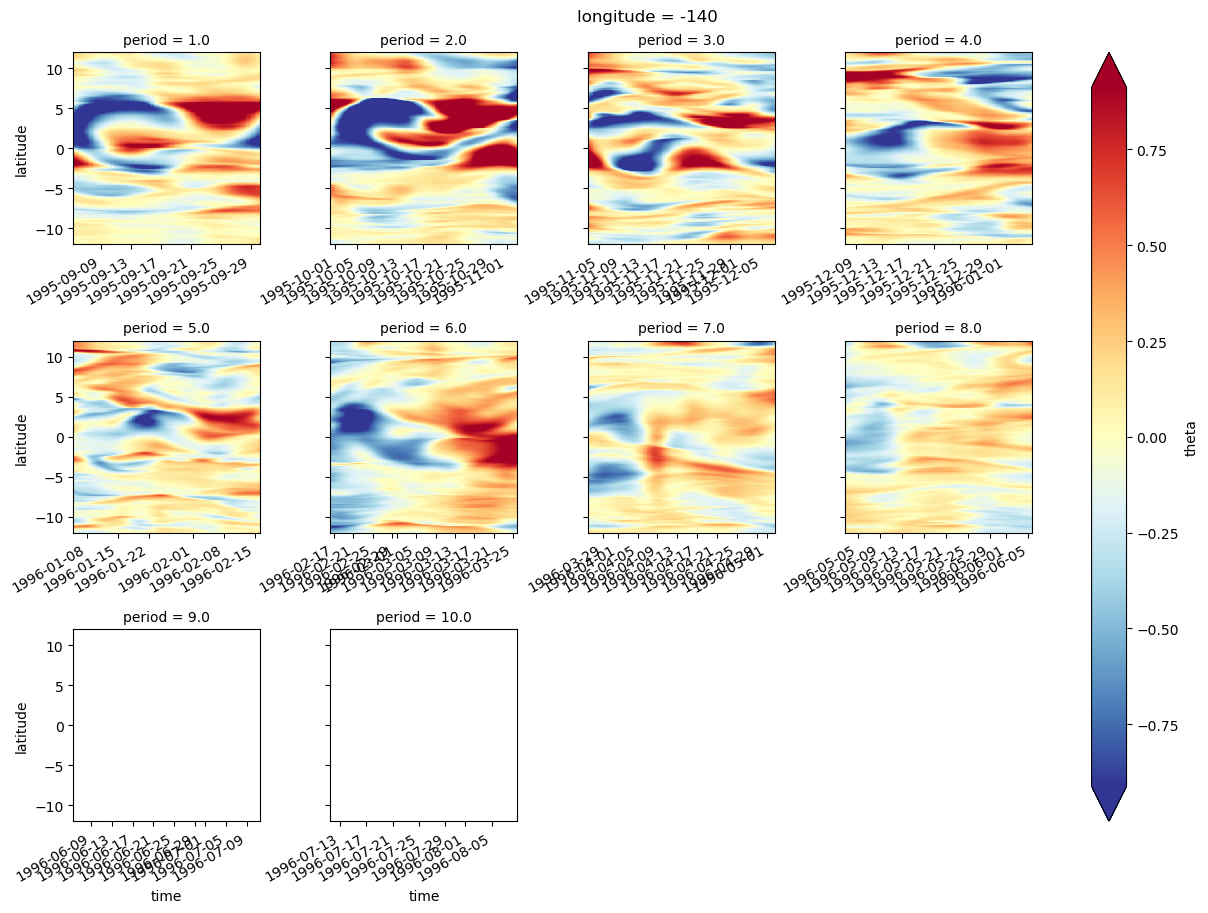
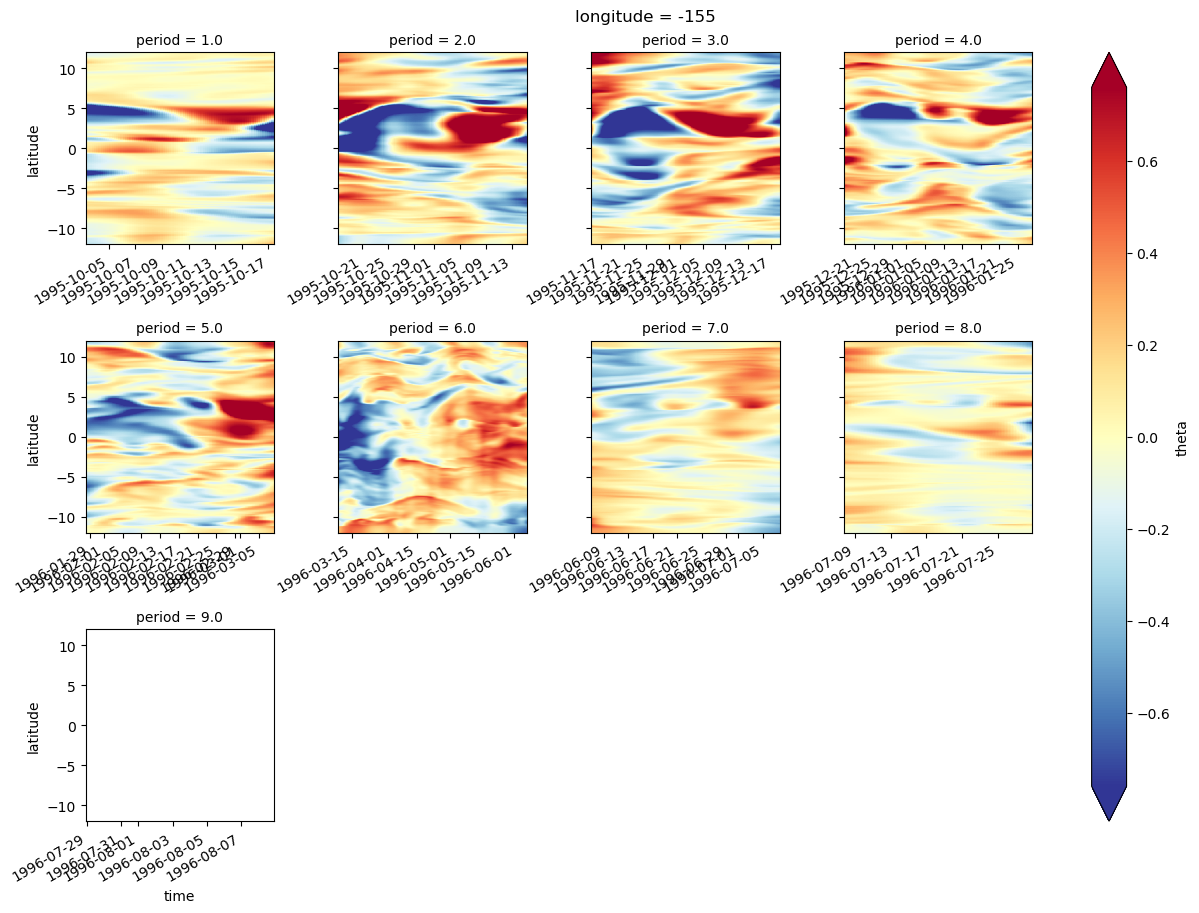
sub = sst_sub.sel(longitude=-110)
anom = sub.groupby("period") - sub.groupby("period").mean()
pos = anom.where(anom > 0).groupby("period").mean("time")
neg = anom.where(anom < 0).groupby("period").mean("time")

(
    pos.rolling(latitude=31, min_periods=1, center=True)
    .mean()
    .groupby("period")
    .plot.line(col="period", col_wrap=4, y="latitude")
)
/gpfs/u/home/dcherian/python/xarray/xarray/core/nanops.py:140: RuntimeWarning: Mean of empty slice
  return np.nanmean(a, axis=axis, dtype=dtype)
/gpfs/u/home/dcherian/python/xarray/xarray/core/nanops.py:140: RuntimeWarning: Mean of empty slice
  return np.nanmean(a, axis=axis, dtype=dtype)
<xarray.plot.facetgrid.FacetGrid at 0x2af3e4ea9f98>
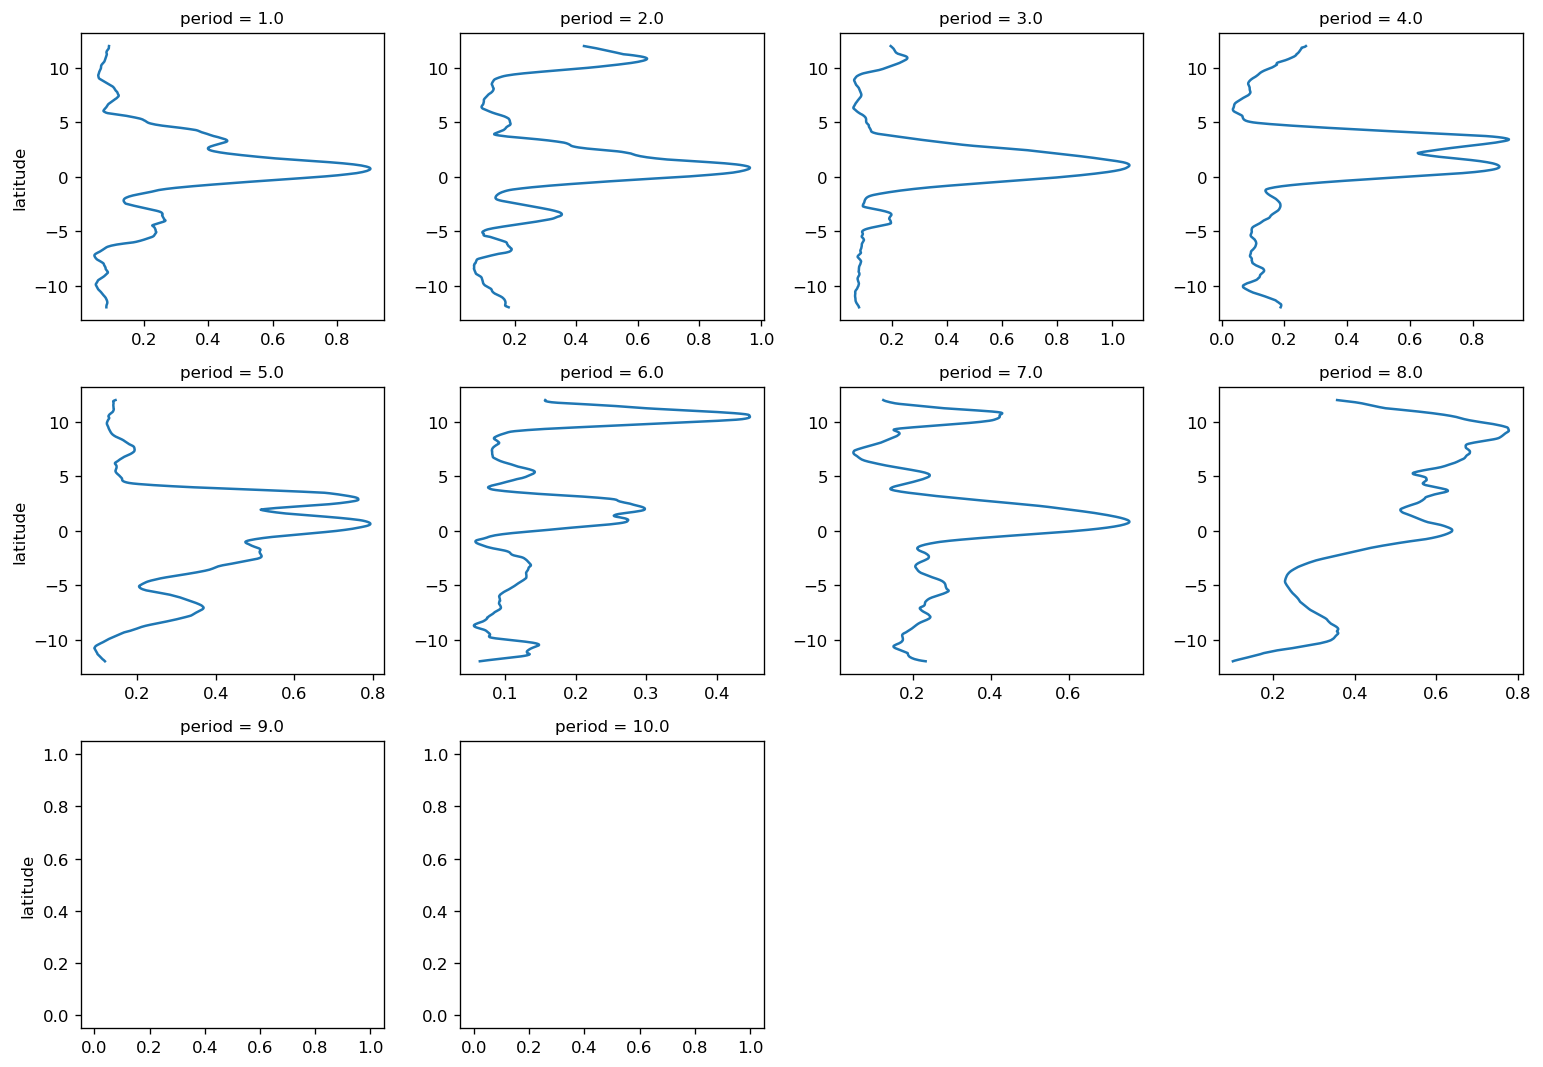
yref, reference = pump.composite.get_y_reference(
sst_sub.sel(longitude=[-155]),
periods=periods,
kind="warm",
debug=True,
# savefig=True,
)
[129 260]
[ 86 126 252]
[ 39 93 127 245]
iterating south
iterating south
iterating south
iterating south
iterating south
iterating south
iterating south
iterating south
iterating south
iterating south
iterating south
iterating south
iterating south
iterating south
iterating south
iterating south
iterating south
[ 30 257]
[140 238]
[ 87 164]
[ 93 216]
iterating south
iterating south
iterating south
iterating south
iterating south
iterating south
[146 246]
/gpfs/u/home/dcherian/python/xarray/xarray/plot/plot.py:88: FutureWarning: This DataArray contains multi-dimensional coordinates. In the future, these coordinates will be transposed as well unless you specify transpose_coords=False.
yplt = darray.transpose(xdim, huedim)
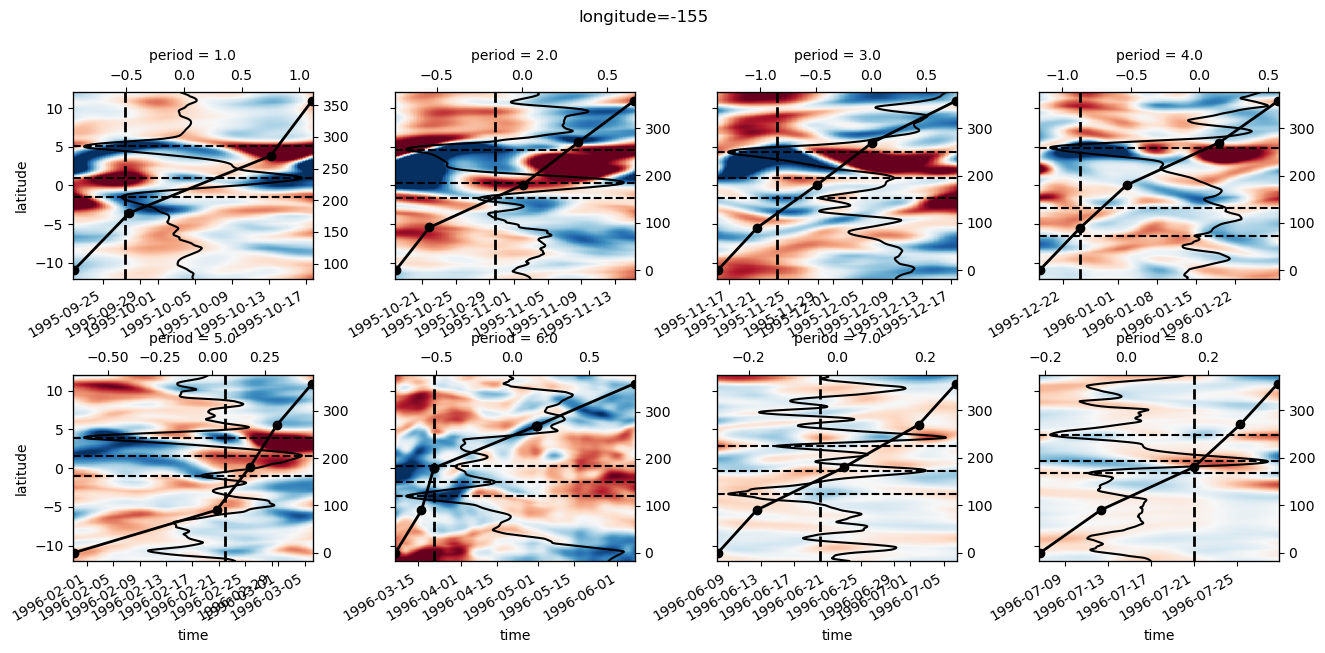
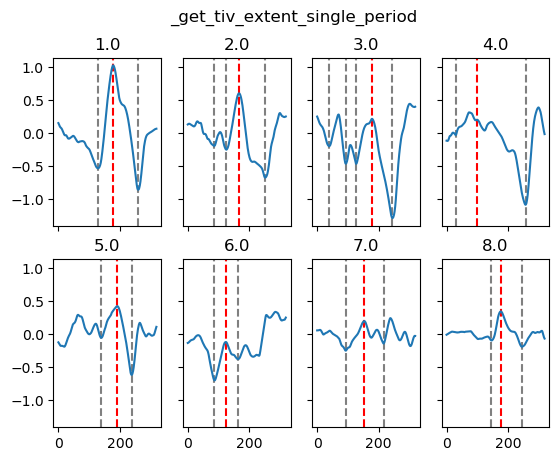
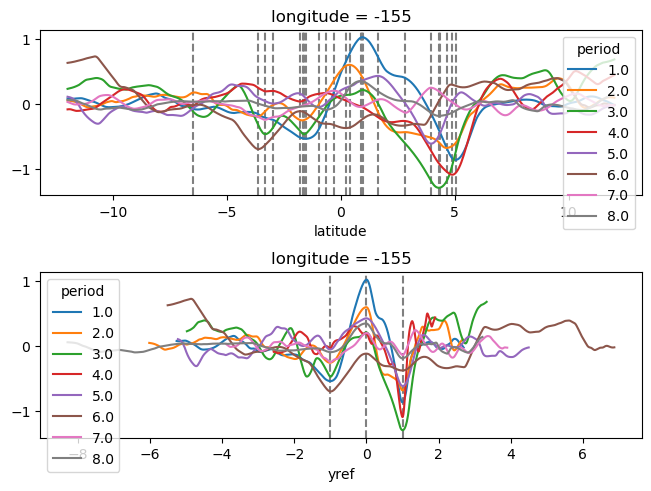
save y reference debugging plots.#
With some manual tweaking this looks OK.
import xfilter
sst_sub = (
sst.pipe(
xfilter.lowpass,
coord="time",
freq=1 / 7,
cycles_per="D",
num_discard=0,
method="pad",
)
.assign_coords(period=period, tiw_phase=tiw_phase, tiw_ptp=tiw_ptp)
.squeeze()
).load()
Commit: 1365139 Date: 30 Jan 2020#
for longitude in sst_sub.longitude:
yref, reference = pump.composite.get_y_reference(
sst_sub.sel(longitude=[longitude]),
periods=None,
kind="warm",
debug=True,
savefig=False,
)
[ 47 89 128 252]
[ 43 89 213]
[ 30 90 205 270]
[ 42 119 236]
[ 70 127 230]
/glade/u/home/dcherian/python/xarray/xarray/plot/plot.py:86: FutureWarning: This DataArray contains multi-dimensional coordinates. In the future, these coordinates will be transposed as well unless you specify transpose_coords=False.
yplt = darray.transpose(xdim, huedim)
[ 35 117 267]
[ 59 126 254]
[ 35 127 254]
/glade/u/home/dcherian/python/xarray/xarray/plot/plot.py:86: FutureWarning: This DataArray contains multi-dimensional coordinates. In the future, these coordinates will be transposed as well unless you specify transpose_coords=False.
yplt = darray.transpose(xdim, huedim)
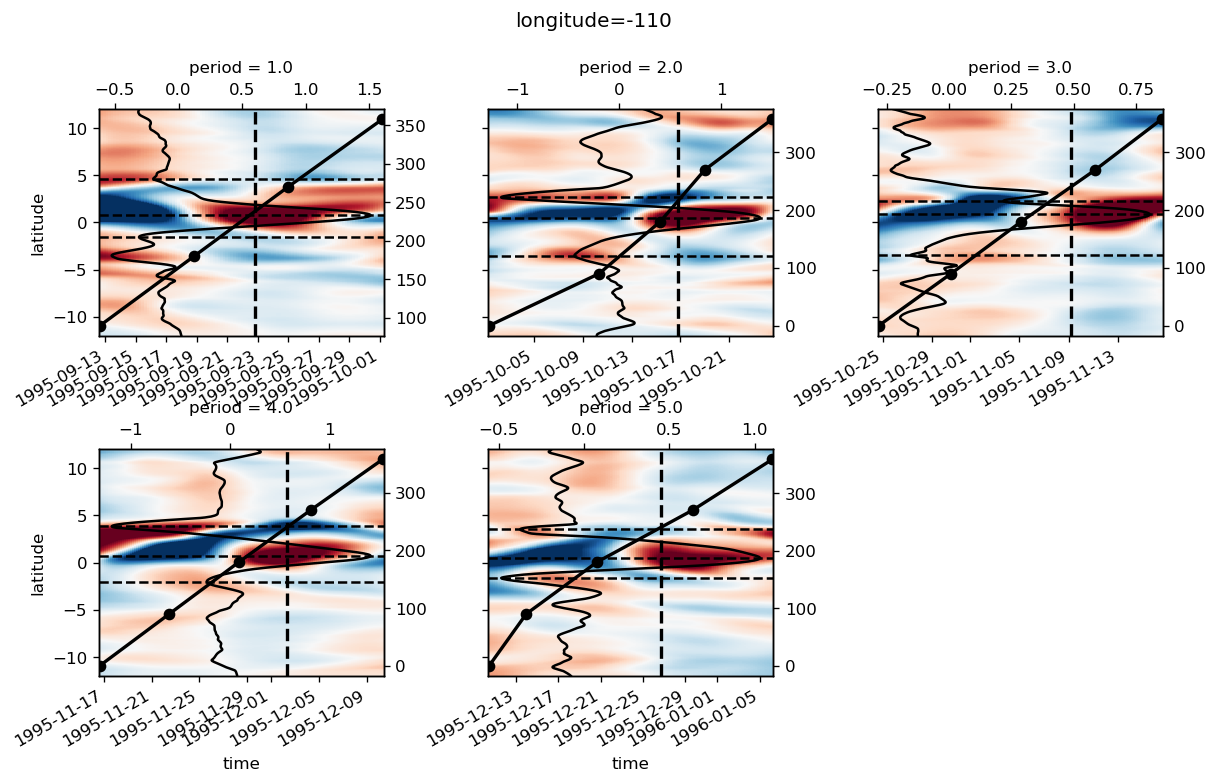
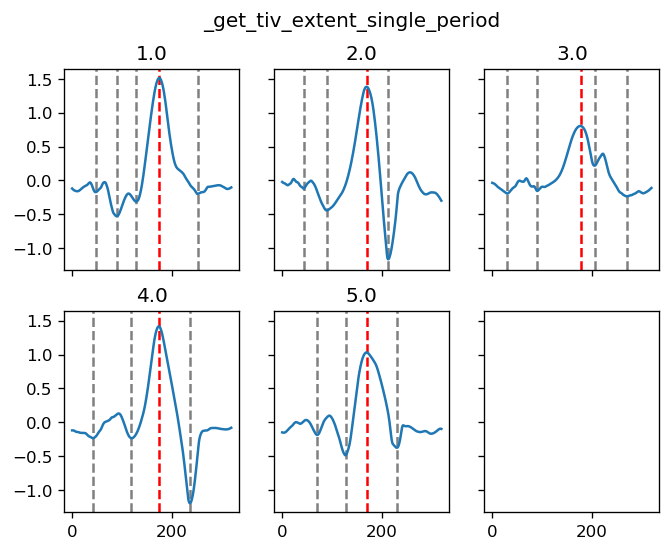
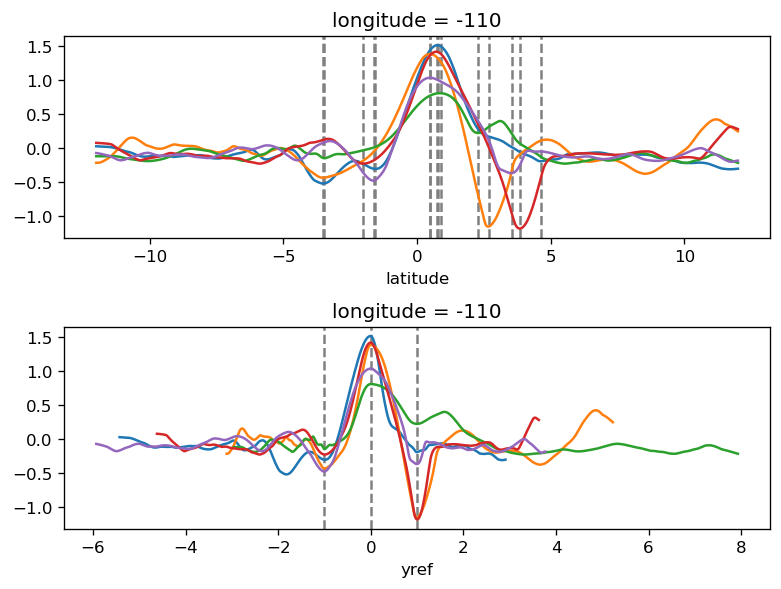
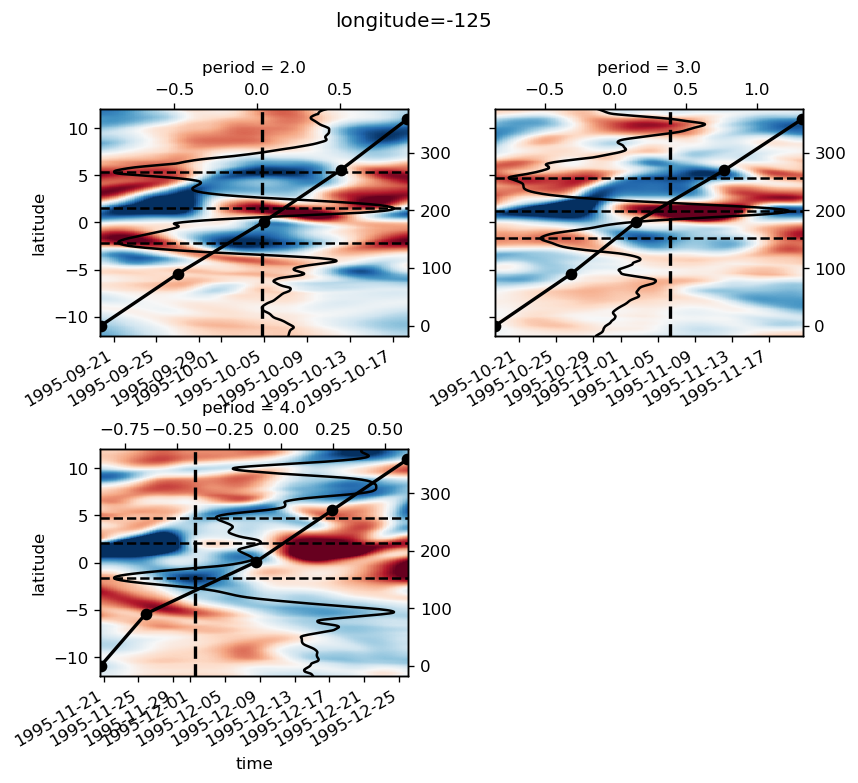
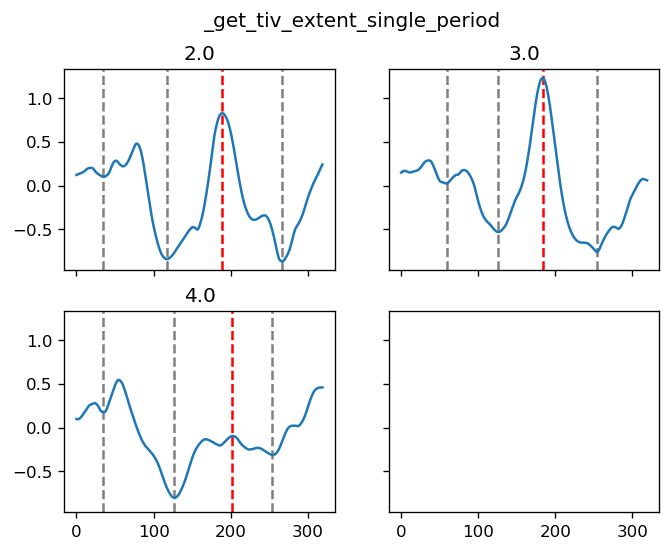
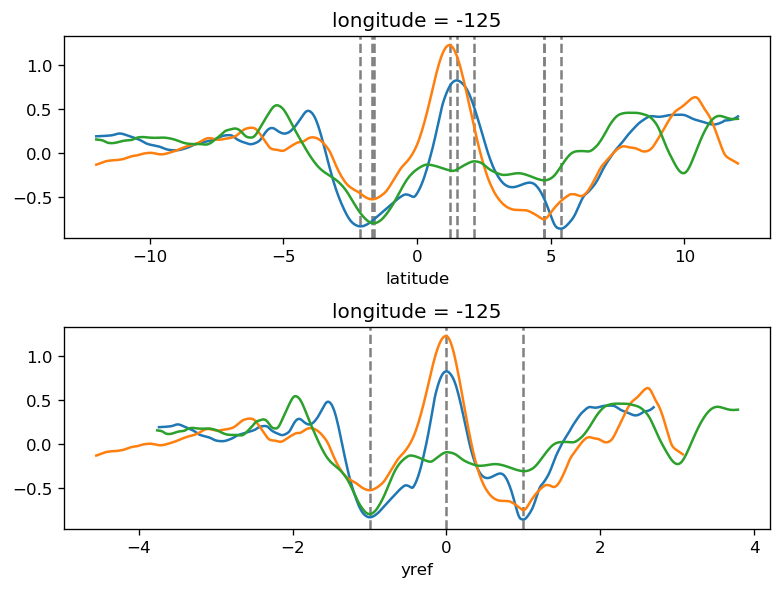
Commit: 8a3ec4e Date: 27 Jan 2019#
for longitude in sst_sub.longitude:
yref, reference = pump.composite.get_y_reference(
sst_sub.sel(longitude=[longitude]),
periods=None,
kind="warm",
debug=True,
savefig=True,
)
[ 93 134 235]
[ 43 89 212]
[142 209]
[125 233]
[ 73 127 222 273]
[121 222 253]
[132 227]
[ 67 130 255]
[ 57 232]
[ 43 96 202 261]
[146 227]
/glade/u/home/dcherian/python/xarray/xarray/plot/plot.py:86: FutureWarning: This DataArray contains multi-dimensional coordinates. In the future, these coordinates will be transposed as well unless you specify transpose_coords=False.
yplt = darray.transpose(xdim, huedim)
[ 35 117 267]
[ 59 126 254]
[ 63 252]
[ 78 206]
[102 162 223]
[130 242]
[ 76 167 245]
[116 224]
/glade/u/home/dcherian/python/xarray/xarray/plot/plot.py:86: FutureWarning: This DataArray contains multi-dimensional coordinates. In the future, these coordinates will be transposed as well unless you specify transpose_coords=False.
yplt = darray.transpose(xdim, huedim)
[141 267]
[ 14 116 240]
[108 216]
[ 61 125 291]
[ 29 98 147 297]
[ 28 112 182 295]
[110 247]
[124 235]
[145 230]
/glade/u/home/dcherian/python/xarray/xarray/plot/plot.py:86: FutureWarning: This DataArray contains multi-dimensional coordinates. In the future, these coordinates will be transposed as well unless you specify transpose_coords=False.
yplt = darray.transpose(xdim, huedim)
[126 263]
[ 88 128 252]
[ 96 295]
[115 231]
/glade/u/home/dcherian/python/xarray/xarray/plot/plot.py:86: FutureWarning: This DataArray contains multi-dimensional coordinates. In the future, these coordinates will be transposed as well unless you specify transpose_coords=False.
yplt = darray.transpose(xdim, huedim)
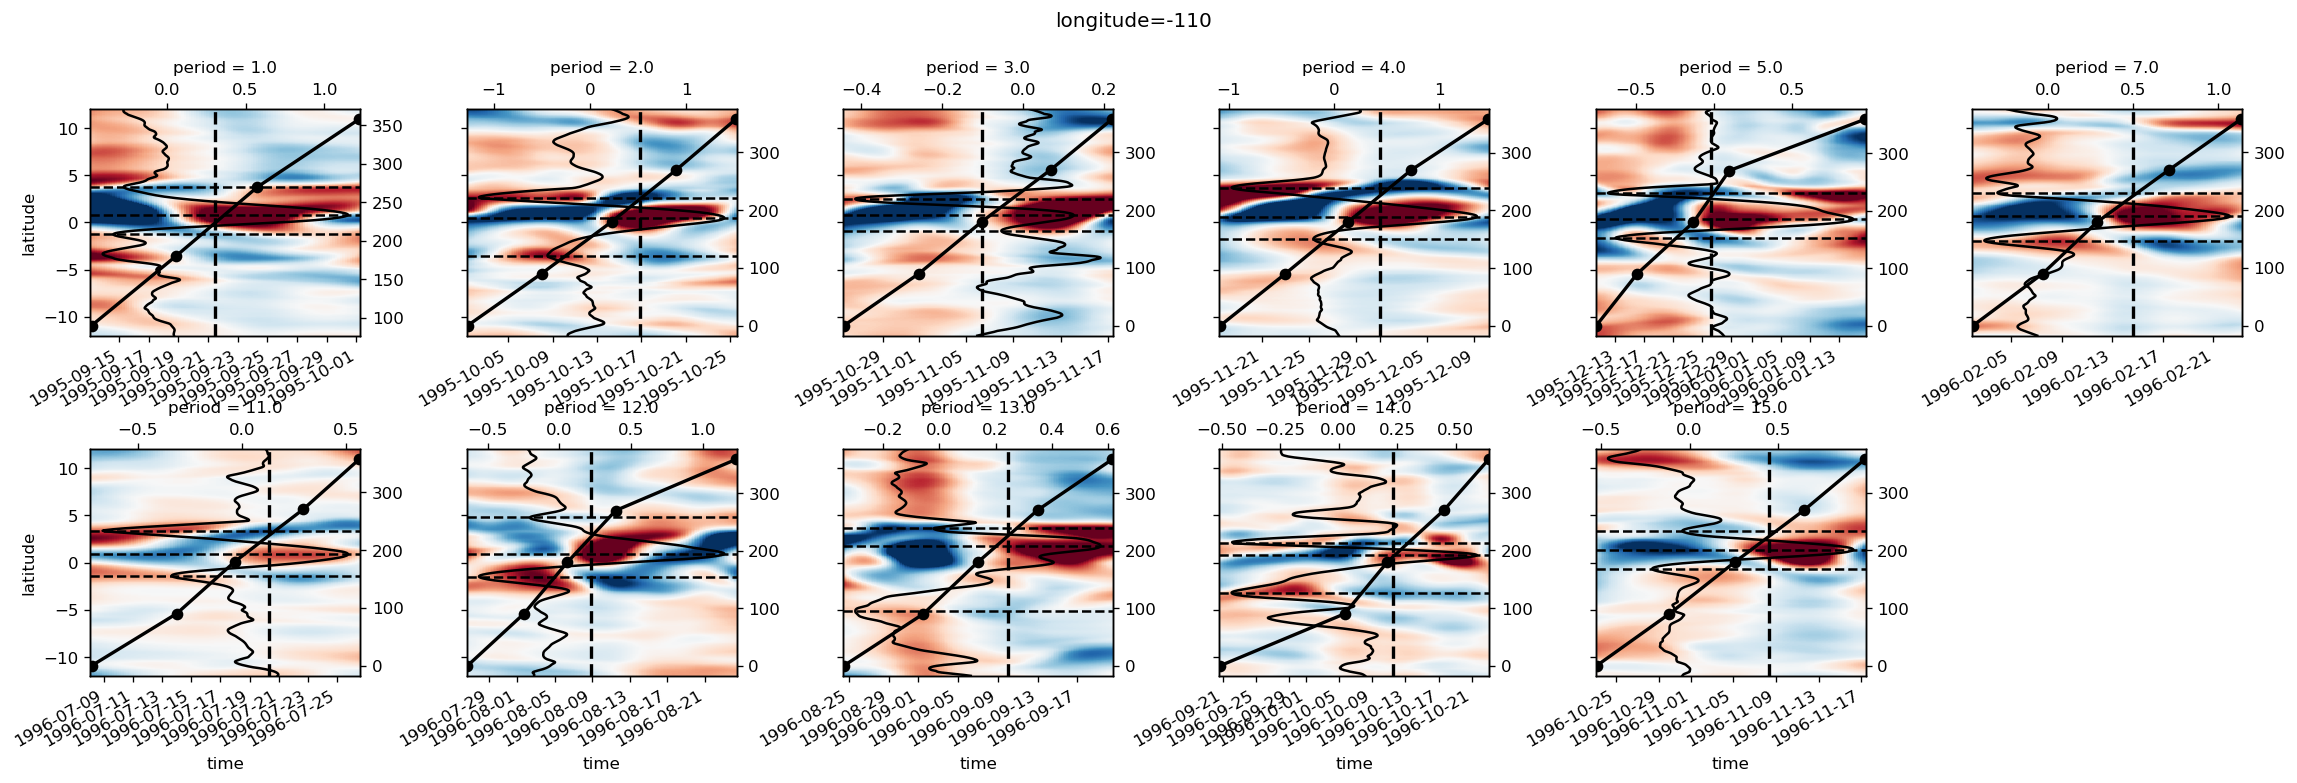
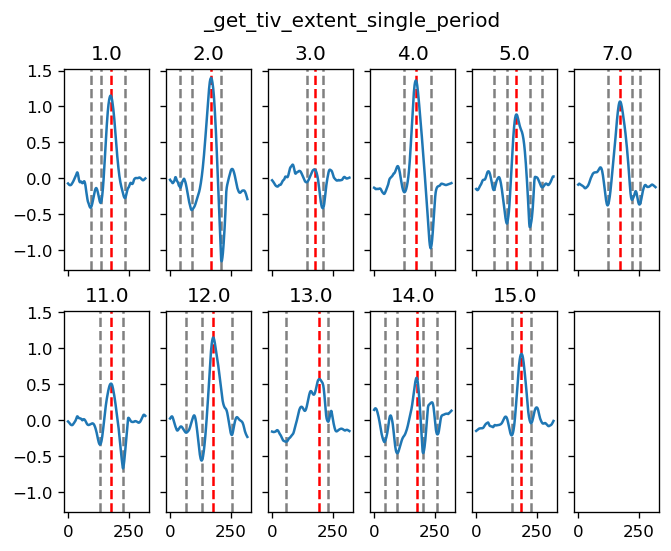
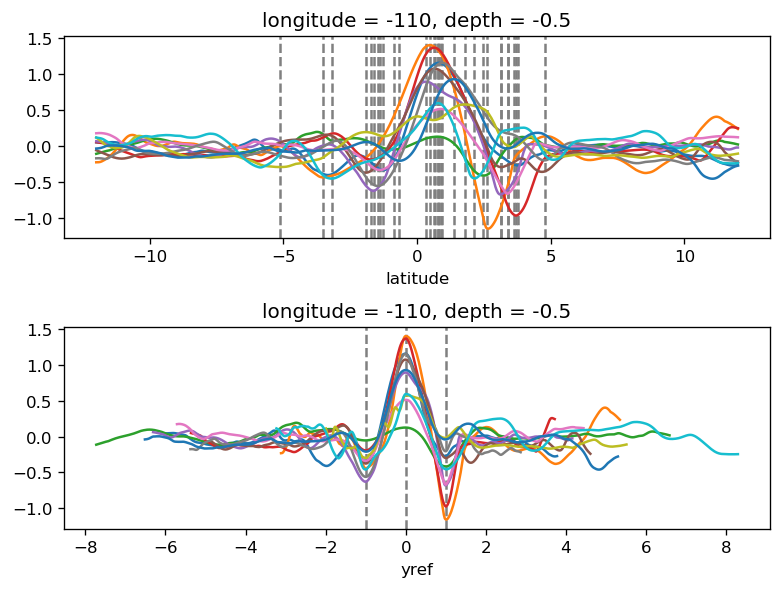
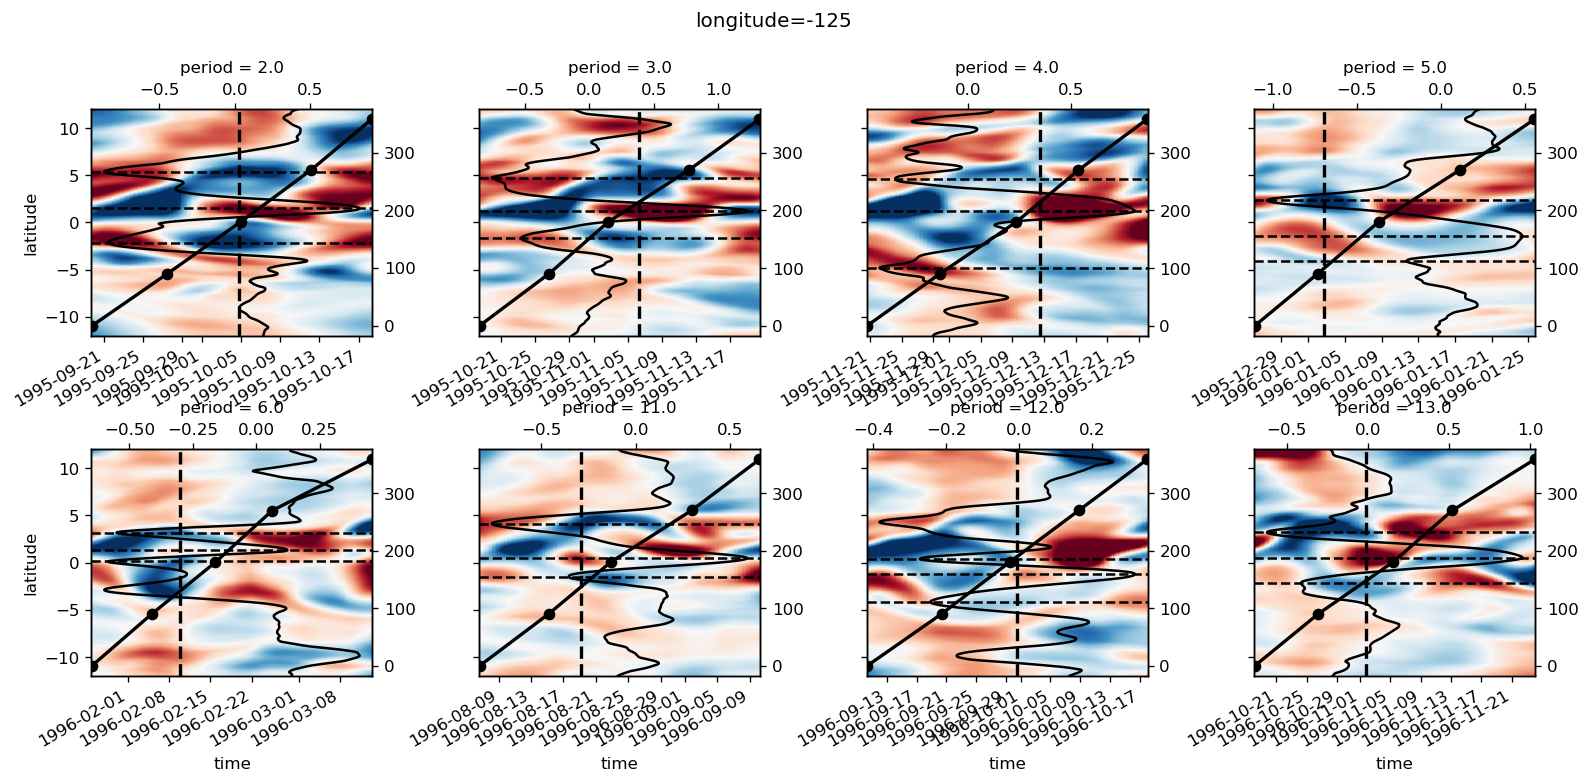
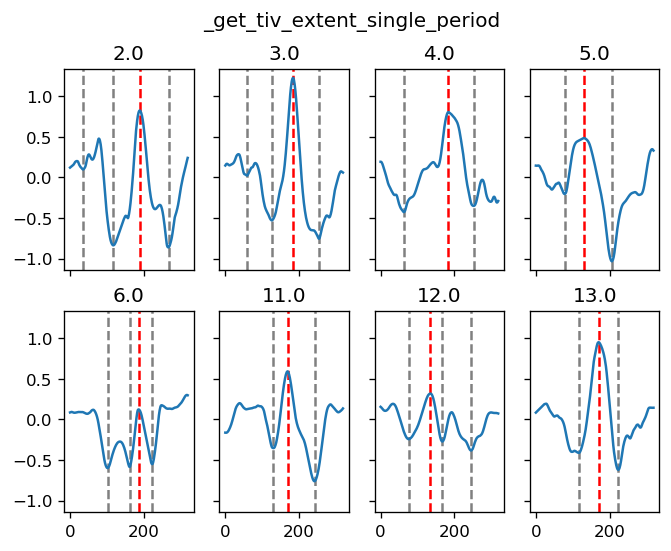
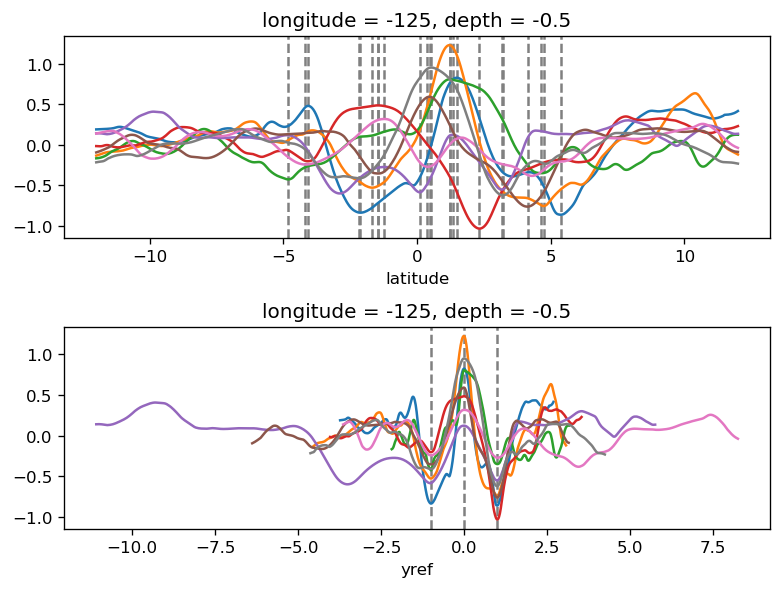
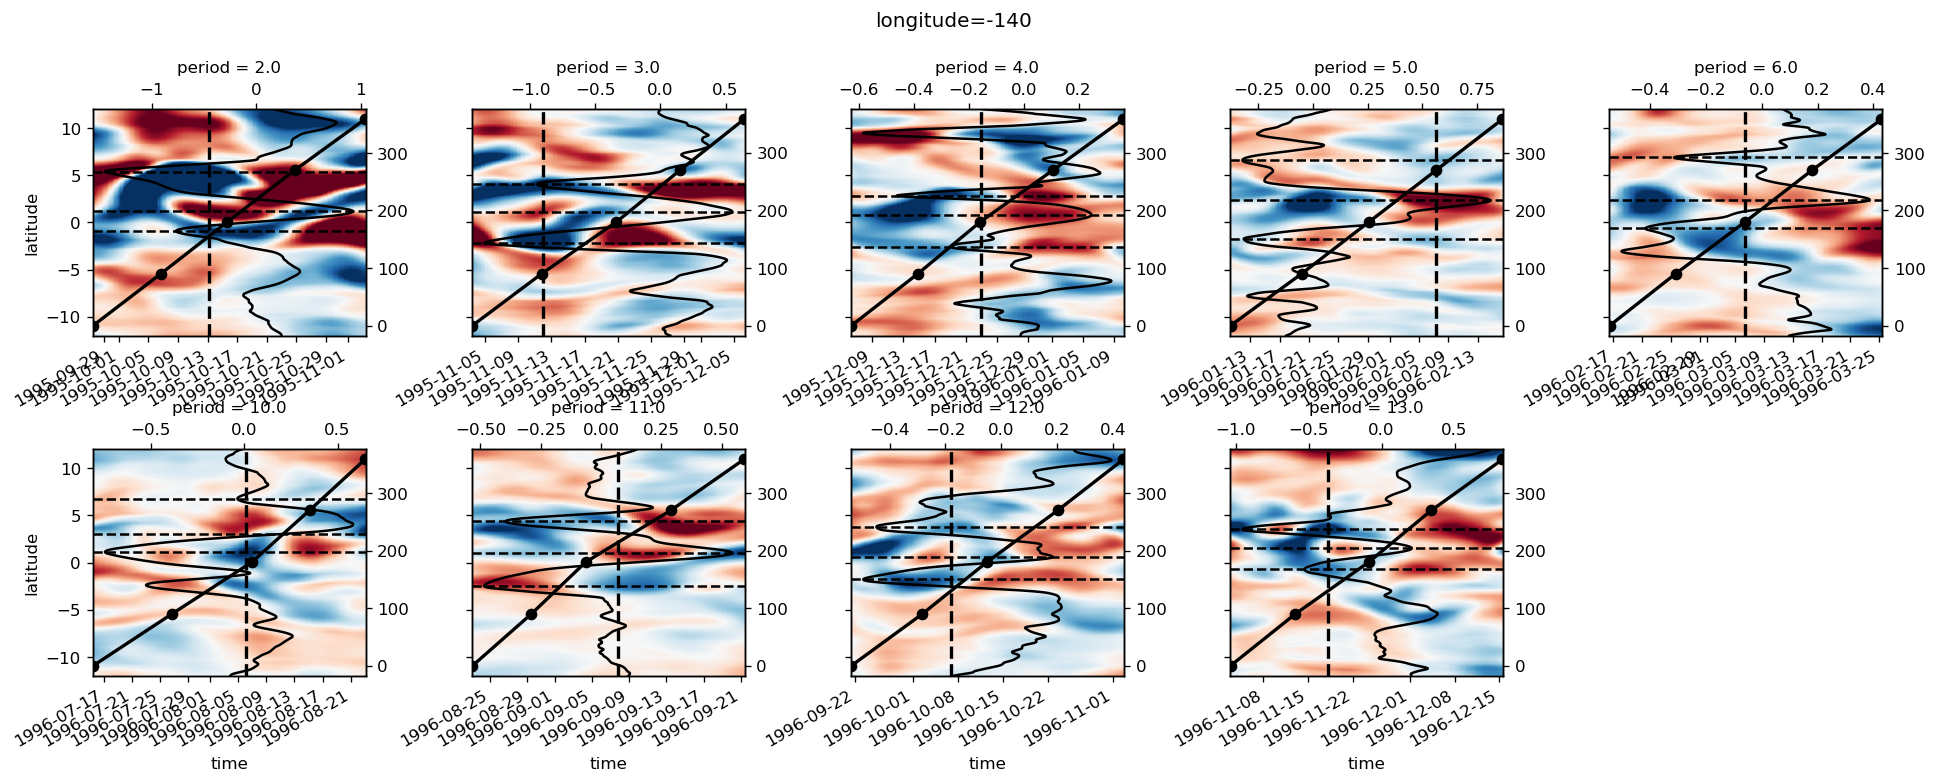
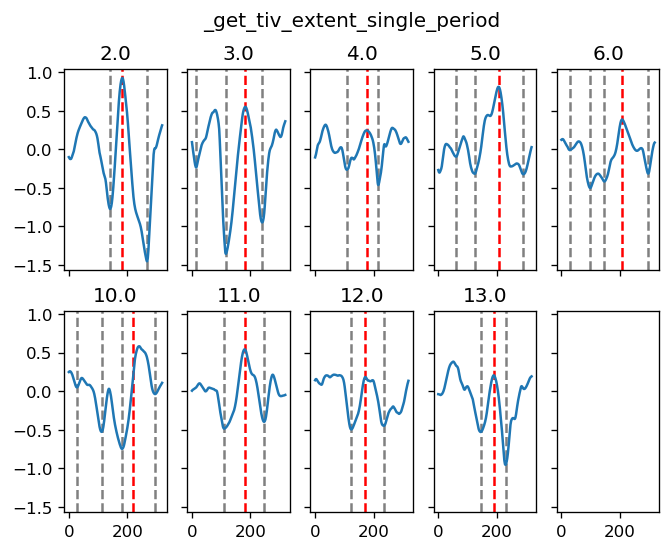
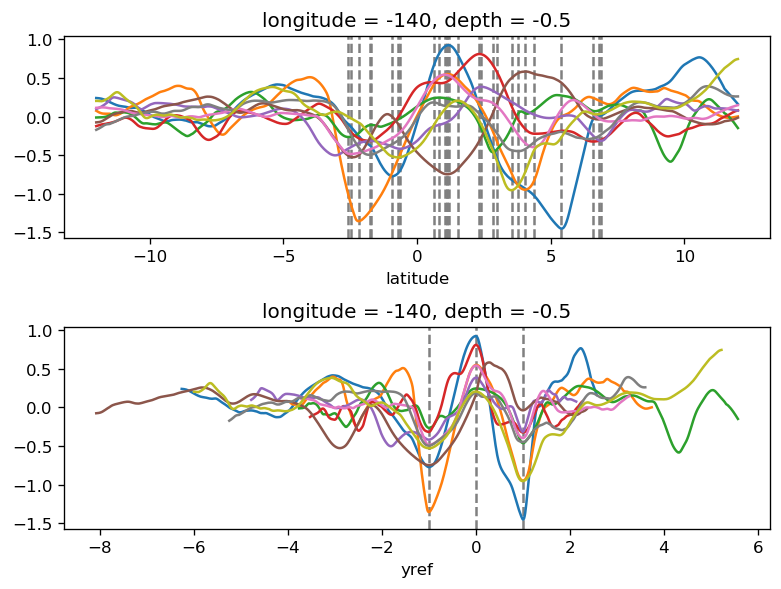
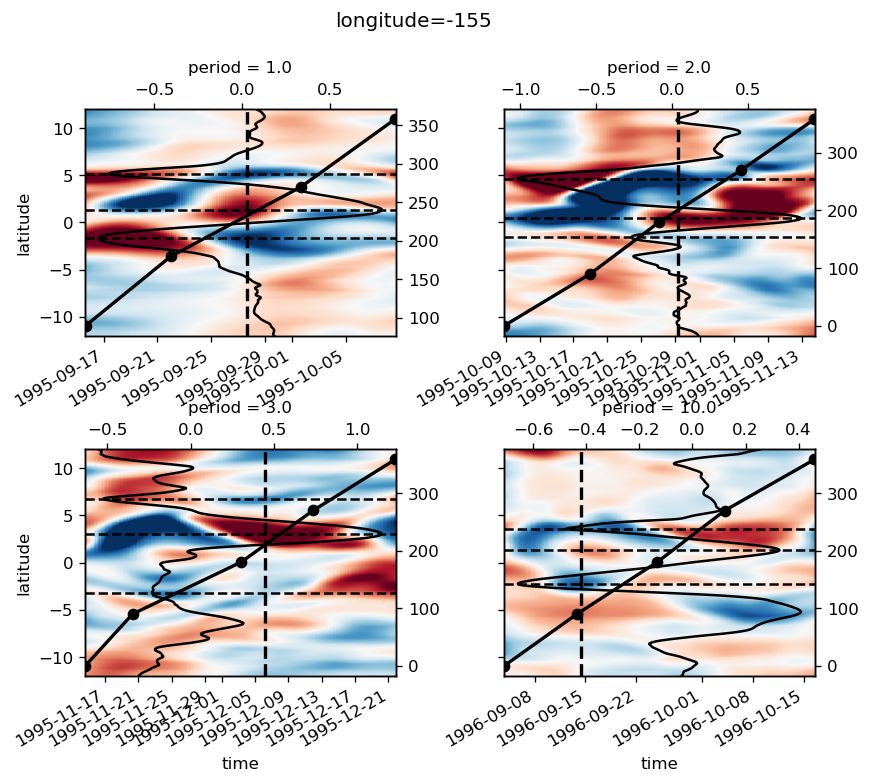
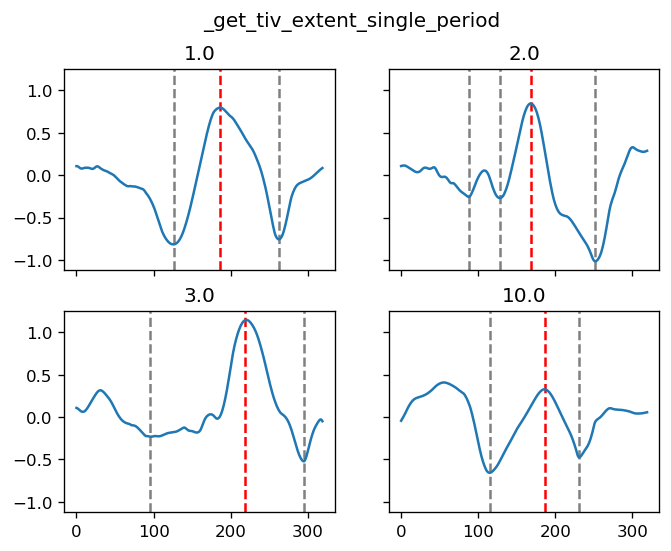
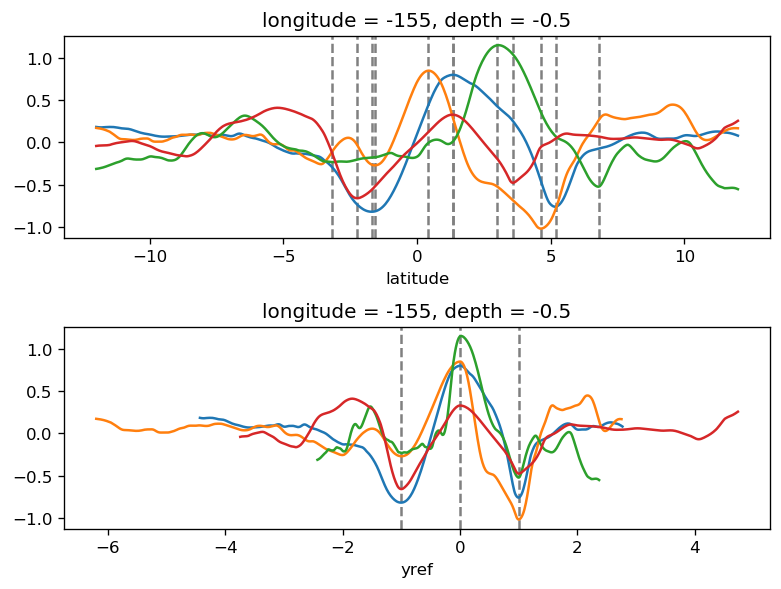
Commit: 93f50d9 Date: 14 Jan 2019#
This used bandpassed 10-40day SST to estimate phase
for longitude in sst_sub.longitude.values:
yref, reference = pump.composite.get_y_reference(
sst_sub.sel(longitude=[longitude]),
periods=periods,
kind="warm",
debug=True,
savefig=True,
)
Commit: 0251fb5 Date: 14 Jan 2019#
This used lowpass 15day SST to estimate phase
for longitude in sst_sub.longitude.values:
yref, reference = pump.composite.get_y_reference(
sst_sub.sel(longitude=[longitude]),
periods=periods,
kind="warm",
debug=True,
savefig=True,
)
[ 91 236]
[ 89 212]
iterating south
[ 30 90 206]
[126 233]
[ 68 123 221]
iterating south
iterating south
iterating south
iterating south
[138 263]
[119 255]
iterating south
iterating south
iterating south
[ 70 193 248]
/gpfs/u/home/dcherian/python/xarray/xarray/plot/plot.py:88: FutureWarning: This DataArray contains multi-dimensional coordinates. In the future, these coordinates will be transposed as well unless you specify transpose_coords=False.
yplt = darray.transpose(xdim, huedim)
[117 264]
[ 16 122 264]
[127 260]
[127 233]
[ 98 223]
iterating south
iterating south
iterating south
iterating south
iterating south
iterating south
iterating south
iterating south
iterating south
iterating south
[ 81 201 256]
[ 74 180 249]
iterating south
iterating south
iterating south
[ 25 190]
/gpfs/u/home/dcherian/python/xarray/xarray/plot/plot.py:88: FutureWarning: This DataArray contains multi-dimensional coordinates. In the future, these coordinates will be transposed as well unless you specify transpose_coords=False.
yplt = darray.transpose(xdim, huedim)
[ 56 111 266]
[141 268]
[ 14 116 240]
[108 216]
[ 61 124 293]
[113 294]
iterating south
iterating south
iterating south
iterating south
iterating south
iterating south
iterating south
iterating south
iterating south
iterating south
iterating south
iterating south
iterating south
iterating south
iterating south
iterating south
[ 65 267]
iterating south
iterating south
iterating south
iterating south
iterating south
iterating south
iterating south
iterating south
iterating south
iterating south
iterating south
iterating south
iterating south
[ 35 218]
/gpfs/u/home/dcherian/python/xarray/xarray/plot/plot.py:88: FutureWarning: This DataArray contains multi-dimensional coordinates. In the future, these coordinates will be transposed as well unless you specify transpose_coords=False.
yplt = darray.transpose(xdim, huedim)
[158 281]
[ 31 115 282]
[ 90 295]
[ 34 129 304]
[ 43 114 278]
iterating south
iterating south
iterating south
iterating south
iterating south
iterating south
iterating south
iterating south
iterating south
iterating south
iterating south
iterating south
iterating south
iterating south
iterating south
iterating south
iterating south
[ 40 193 285]
[136 282]
iterating south
iterating south
iterating south
iterating south
[ 91 255]
/gpfs/u/home/dcherian/python/xarray/xarray/plot/plot.py:88: FutureWarning: This DataArray contains multi-dimensional coordinates. In the future, these coordinates will be transposed as well unless you specify transpose_coords=False.
yplt = darray.transpose(xdim, huedim)
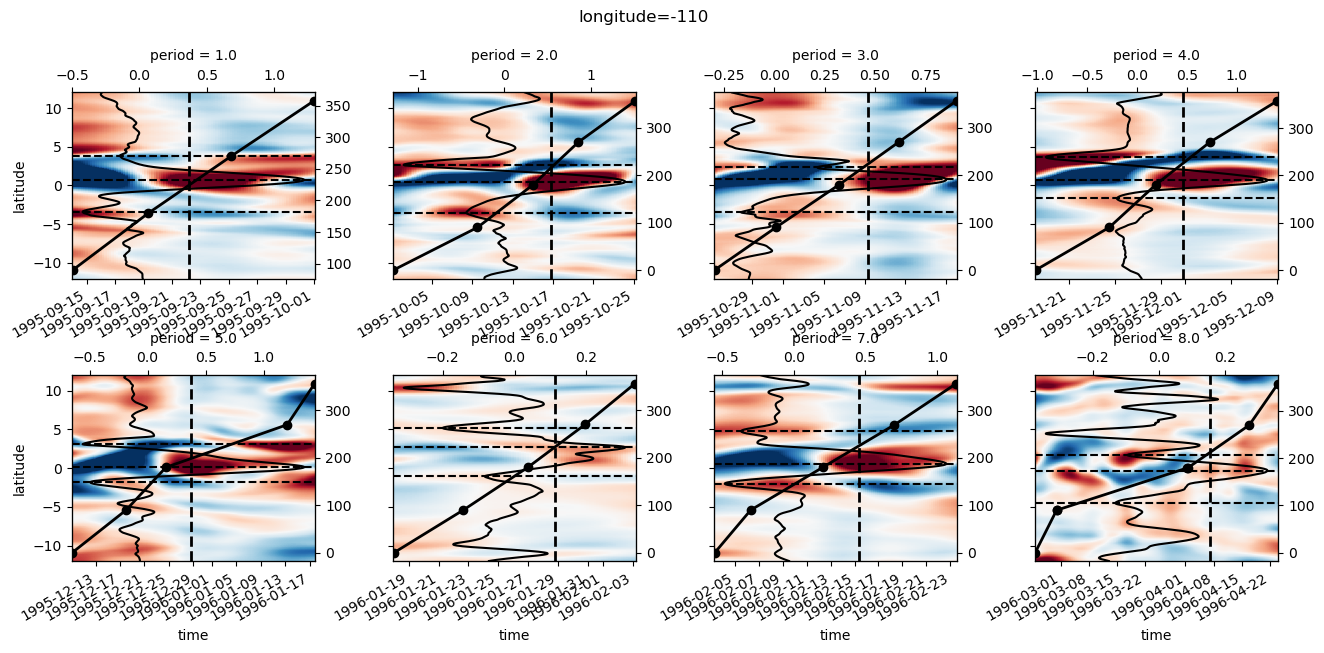
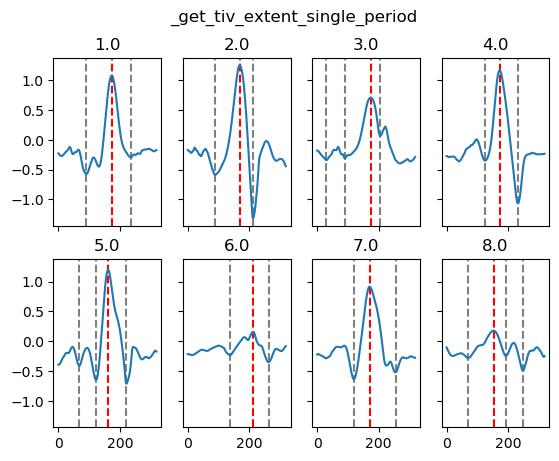
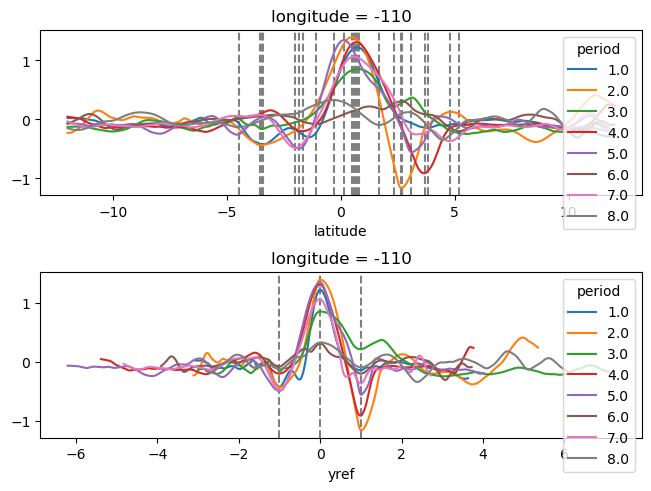
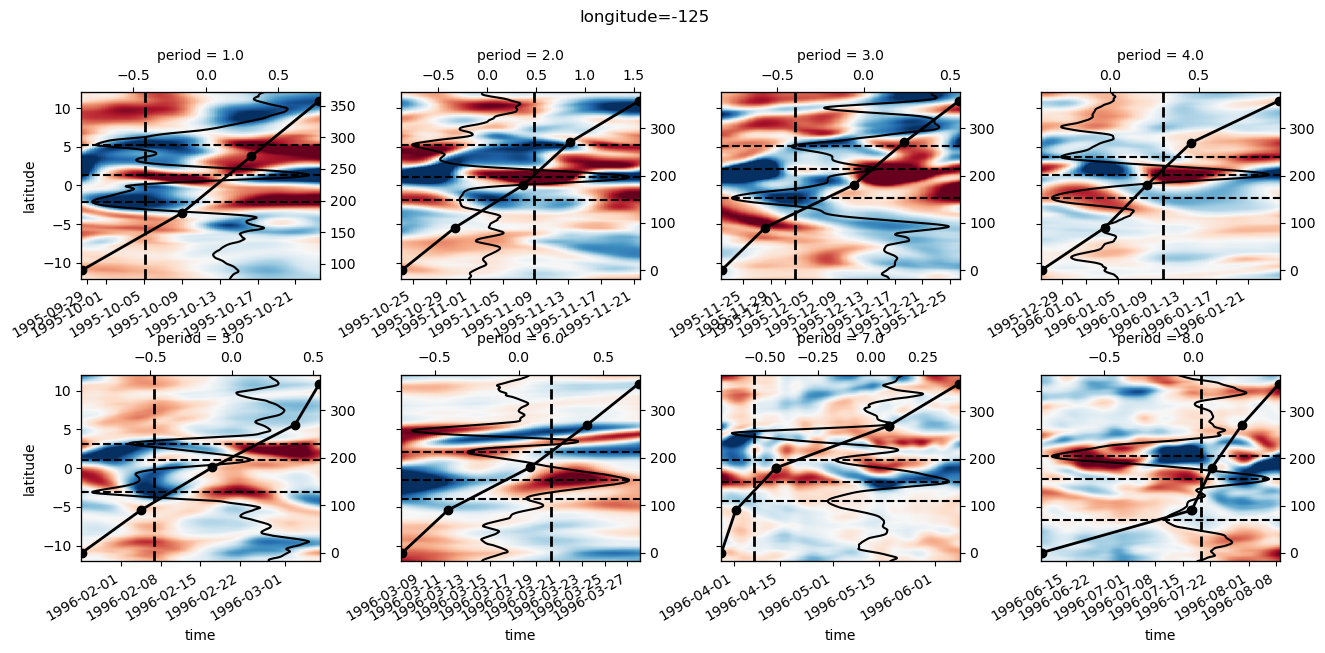
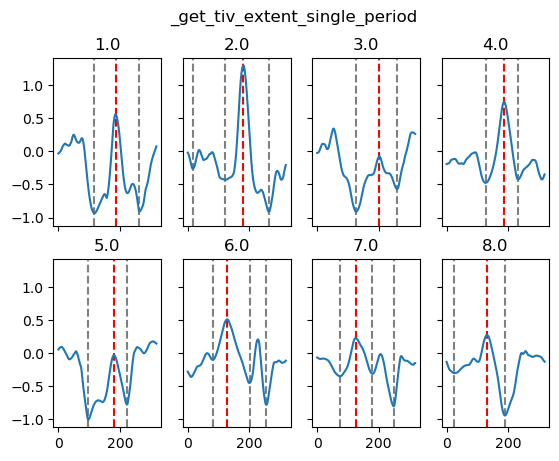
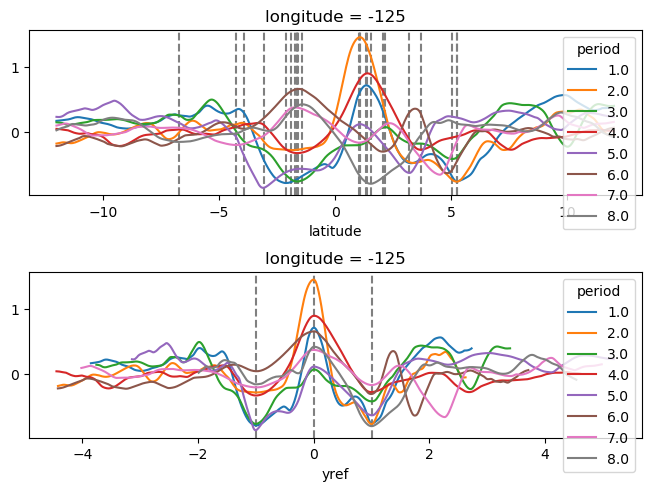
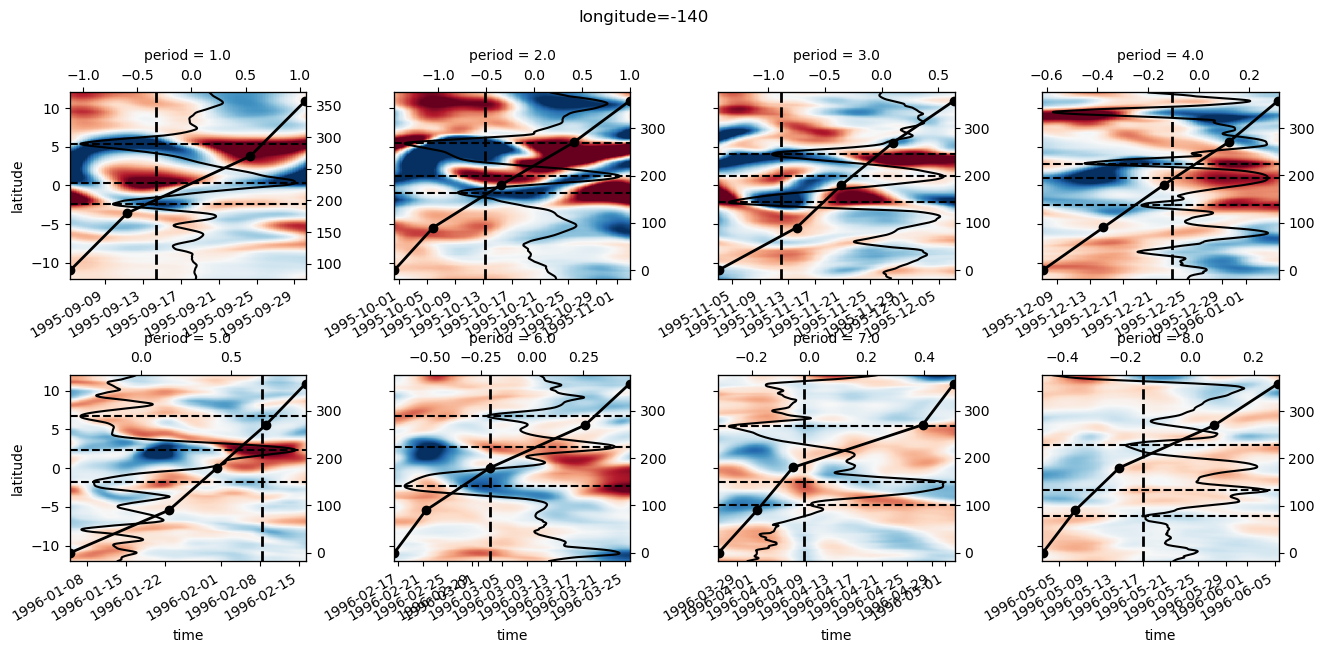
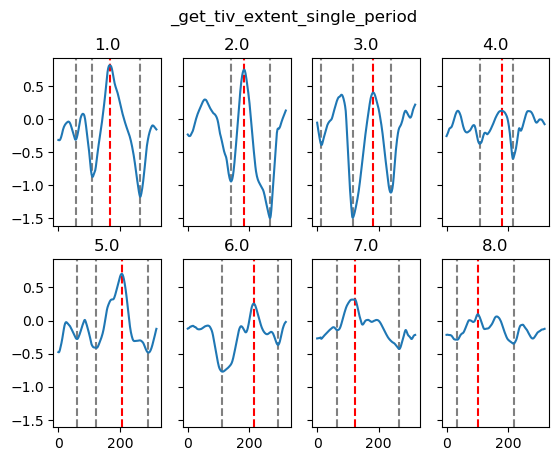
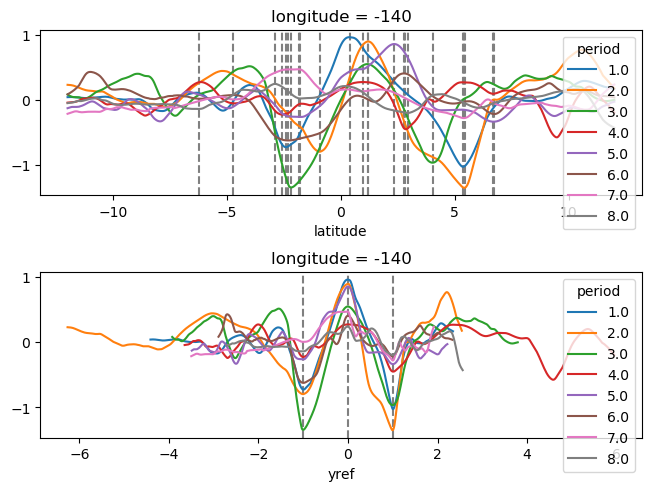
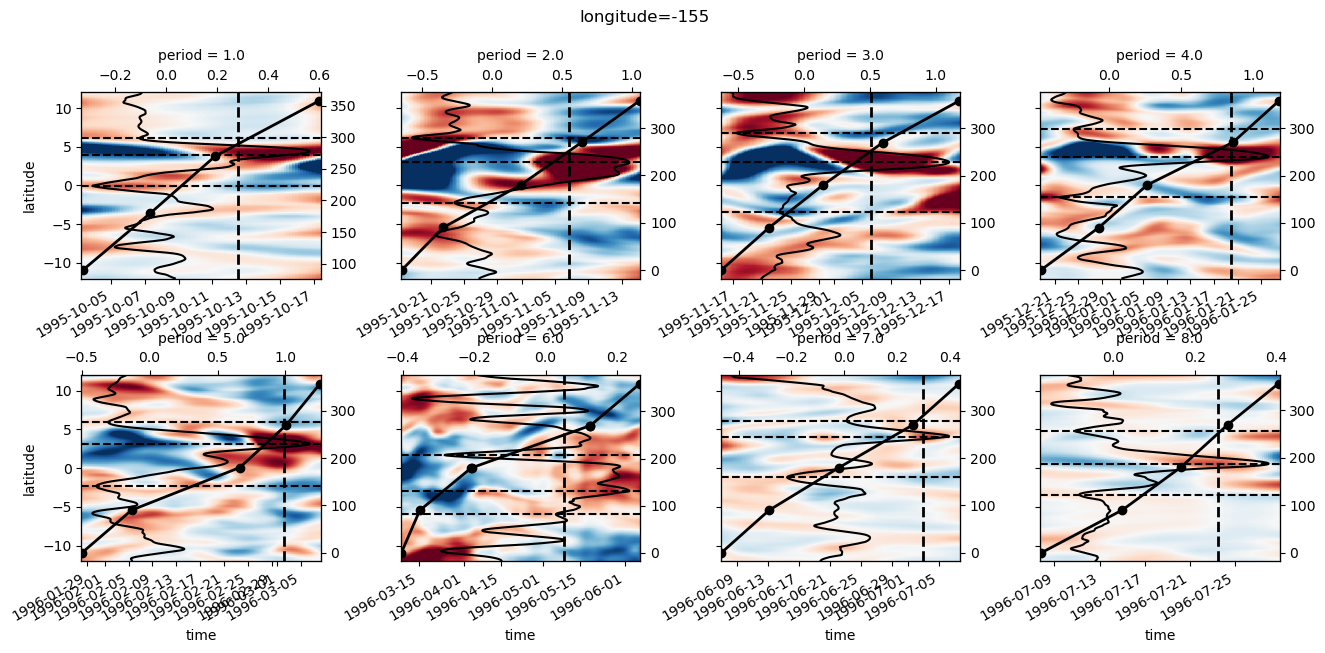
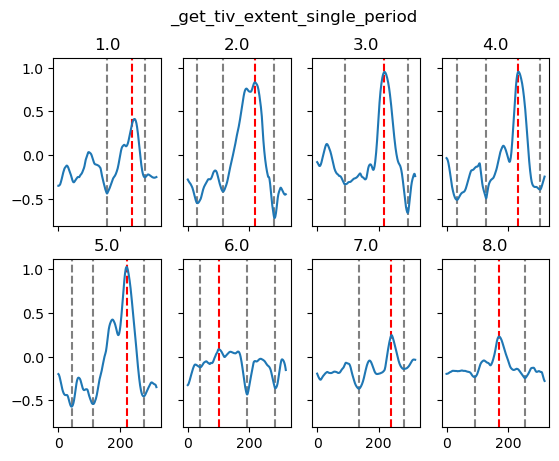
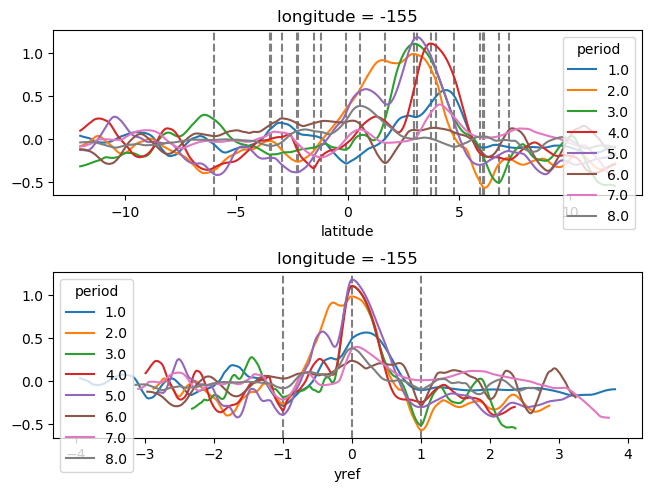
(
sst_sub.sel(longitude=-140)
.groupby("period")
.get_group(3.0)
.plot(x="time", robust=True, cmap=mpl.cm.RdYlBu_r)
)
<matplotlib.collections.QuadMesh at 0x2b592b9256d8>
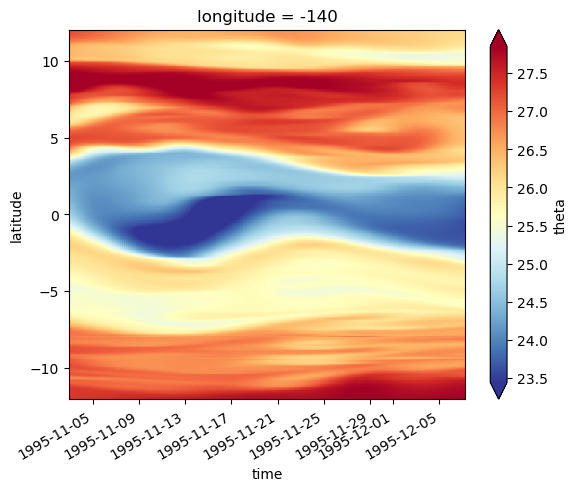
OSM2020 figures#
DCL snapshot#
(sst).plot(robust=True)
<matplotlib.collections.QuadMesh at 0x2ba20f9a3a10>
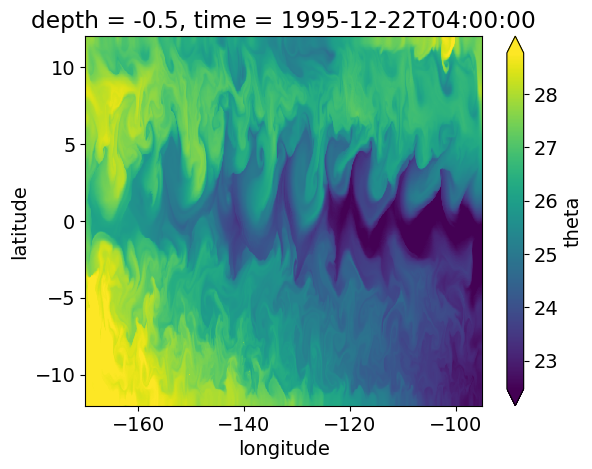
full = gcm1.full.sel(time="1995-09-05")[["u", "v", "dens"]].compute()
full["S2"] = full.u.differentiate("depth") ** 2 + full.v.differentiate("depth") ** 2
full["N2"] = -9.81 / 1025 * full.dens.differentiate("depth")
full["Ri"] = full.N2.where(full.N2 > 1e-6) / full.S2
mld_full = pump.calc.get_mld(full.dens)
dcl_full = pump.calc.get_dcl_base_Ri(full, mld_full)
sst = gcm1.surface.theta.sel(time=full.time.values)
def clean_axis(ax):
ax.tick_params(
axis="both",
direction="in",
color="k",
top=True,
right=True,
length=7.5,
width=1,
)
ax.set_yticks([-10, -5, 0, 5, 10])
ylabels = []
for tt in ax.get_yticks():
if tt < 0:
add = "S"
elif tt > 0:
add = "N"
else:
add = ""
ylabels.append(str(tt) + "°" + add)
ax.set_yticklabels(ylabels)
ax.set_xticks([-95, -110, -125, -140, -155, -170])
ax.set_xticklabels([str(tt)[1:] + "°W" for tt in ax.get_xticks()])
for spine in ax.spines:
ax.spines[spine].set_color("k")
f, ax = plt.subplots(1, 1, constrained_layout=True)
plt.rcParams["font.size"] = 18
cont = (sst.mean("time")).plot.contour(
levels=[24, 26],
colors="w",
linewidths=2.5,
add_labels=False,
ax=ax,
)
cont = (sst.mean("time")).plot.contour(
levels=[24, 26],
colors="k",
linewidths=1,
add_labels=False,
ax=ax,
)
# dcpy.plots.contour_label_spines(cont)
dcpy.plots
(
(mld_full.median("time") - dcl_full.median("time"))
# .coarsen(longitude=3, latitude=3).mean()
.plot(
robust=True,
vmin=10,
cmap=mpl.cm.GnBu,
cbar_kwargs={
"orientation": "horizontal",
"aspect": 30,
"shrink": 0.8,
"label": "Low Ri layer width [m]",
},
ylim=[-10, 10],
add_labels=False,
ax=ax,
)
)
plt.gcf().set_size_inches(16 / 9 * 6.5, 6.5)
clean_axis(ax)
ax.text(-168, 8.5, f"{sst.time[0].dt.strftime('%Y-%m-%d').values}")
# ax.text(-105, 1.65, "SST=24°C", fontstyle="italic")
# ax.text(-105, 0.65, "SST=26°C", fontstyle="italic")
f.savefig("images/dcl-sst-snapshot.png", dpi=150)
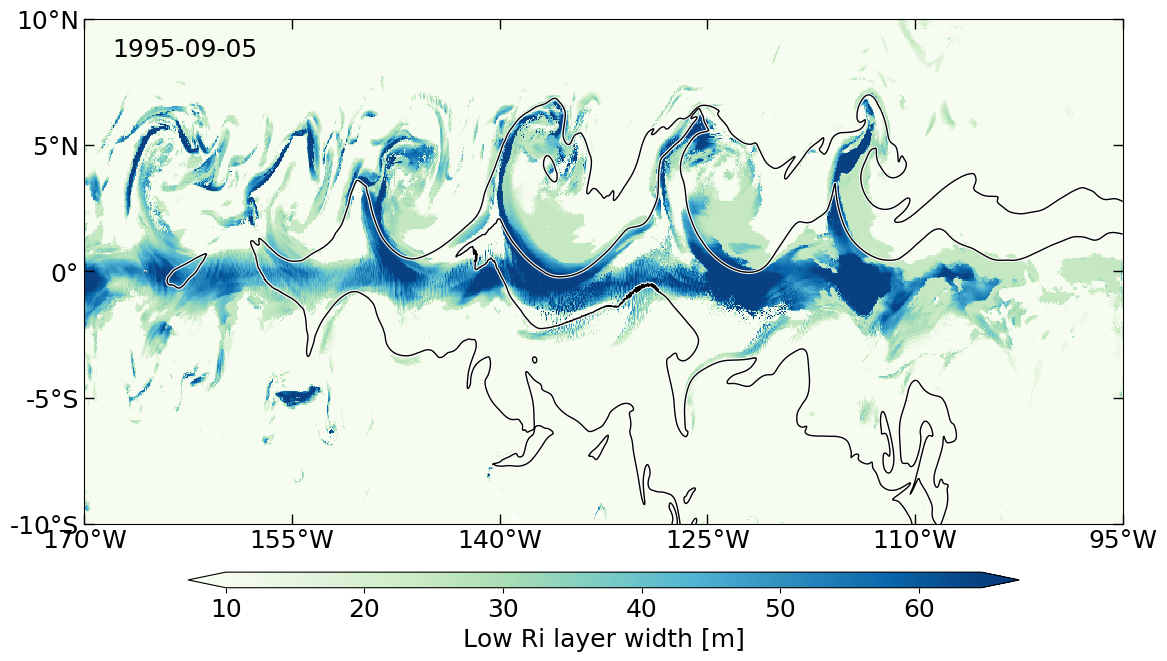
deep cycle in time at 3°N, 110W, period 4#
jq, sst many periods#
where is the EUC. use that to select latitudes
jq contours?
(
full_subset.u.sel(time=slice("1995-10-08", "1995-12-08"), longitude=-110)
.mean("time")
.plot.contourf(levels=21, y="depth", vmax=1)
)
<matplotlib.contour.QuadContourSet at 0x2baace3b8850>
(
full_subset.S2.sel(time=slice("1995-11-22", "1995-12-08"), longitude=-110).sel(
latitude=0, method="nearest"
)
).plot(cmap=mpl.cm.Spectral_r, x="time", robust=True)
<matplotlib.collections.QuadMesh at 0x2baab64f0a10>
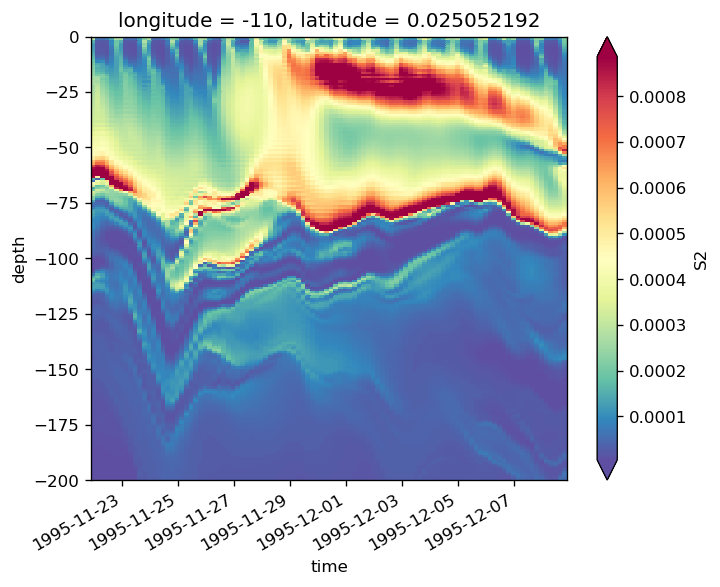
(
(full_subset.S2 - 4 * full_subset.N2)
.sel(time=slice("1995-11-22", "1995-12-08"), longitude=-110)
.sel(latitude=3, method="nearest")
).plot(x="time", robust=True)
<matplotlib.collections.QuadMesh at 0x2baab376df10>
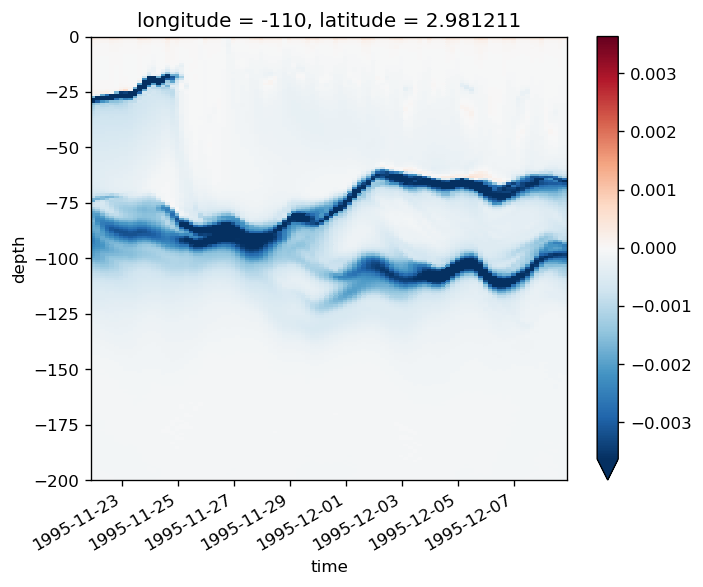
(
full_subset.Ri.sel(time=slice("1995-11-11", "1995-12-08"), longitude=-110).sel(
latitude=3, method="nearest"
)
).plot(norm=mpl.colors.LogNorm(0.25, 1), cmap=mpl.cm.RdBu_r, x="time")
<matplotlib.collections.QuadMesh at 0x2ba126454990>
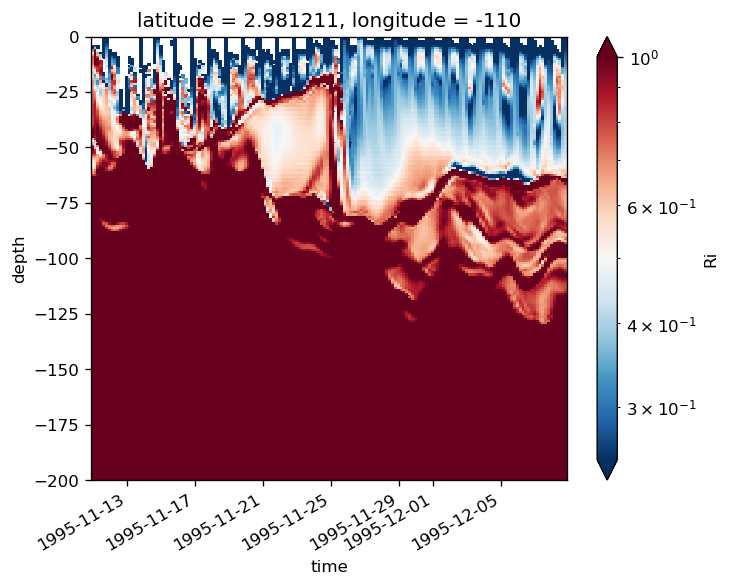
jq = full_subset.Jq.sel(time=slice("1995-11-10", "1995-12-15"), longitude=-110).sel(
latitude=3, method="nearest"
)
jq.rolling(depth=2).mean().plot.contourf(
x="time",
levels=np.sort([-600, -450, -300, -200, -150, -100, -75, -50, -25, 0]),
cmap=mpl.cm.Blues_r,
)
<matplotlib.contour.QuadContourSet at 0x2b03e9dcf510>
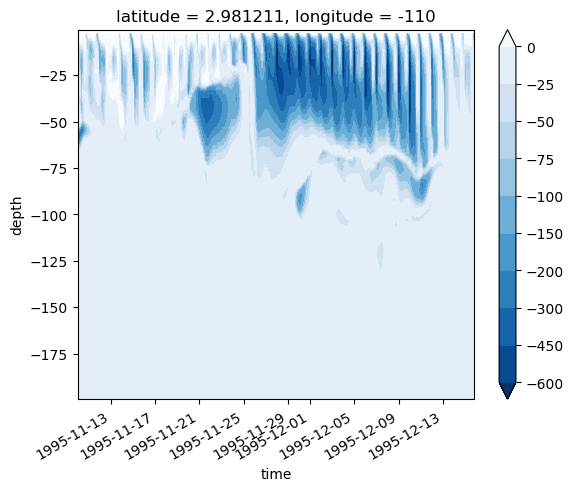
full_subset.Jq
<xarray.DataArray 'Jq' (time: 1098, depth: 200, latitude: 480, longitude: 2)>
dask.array<rechunk-merge, shape=(1098, 200, 480, 2), dtype=float64, chunksize=(36, 200, 480, 1), chunktype=numpy.ndarray>
Coordinates:
* depth (depth) float32 -0.5 -1.5 -2.5 -3.5 ... -197.5 -198.5 -199.5
* time (time) datetime64[ns] 1995-09-01 ... 1996-03-01T20:00:00
* latitude (latitude) float32 -12.0 -11.949896 -11.899791 ... 11.949896 12.0
* longitude (longitude) int64 -110 -125
yref (time, longitude, latitude) float32 nan nan nan ... nan nan nan
period (longitude, time) float64 nan nan nan nan nan ... 6.0 6.0 6.0 6.0
tiw_phase (longitude, time) float64 nan nan nan nan ... 300.0 301.0 302.0
Attributes:
long_name: $J_q^t$
units: W/m$^2$ax
array([[<matplotlib.axes._subplots.AxesSubplot object at 0x2ab70b7c82d0>,
<matplotlib.axes._subplots.AxesSubplot object at 0x2ab6ae148550>],
[<matplotlib.axes._subplots.AxesSubplot object at 0x2ab7049a9a10>,
<matplotlib.axes._subplots.AxesSubplot object at 0x2ab7173528d0>],
[<matplotlib.axes._subplots.AxesSubplot object at 0x2ab7104165d0>,
<matplotlib.axes._subplots.AxesSubplot object at 0x2ab71bf71d10>]],
dtype=object)
plt.rcParams["font.size"] = 14
f, ax = pump.plot.plot_jq_sst(
gcm1,
lon=-110,
periods=slice("1995-11-29", "1995-12-09"),
lat=[0, 3.5],
period=period.sel(longitude=-110),
full=full_subset.assign_coords(euc_max=euc_max),
eucmax=euc_max,
time_Ri={
0: slice("1995-11-17", "1995-11-29"),
3.5: slice("1995-11-28", "1995-12-09"),
},
)
f.savefig("images/sst-deep-cycle-3N-zoomin.png", dpi=150)
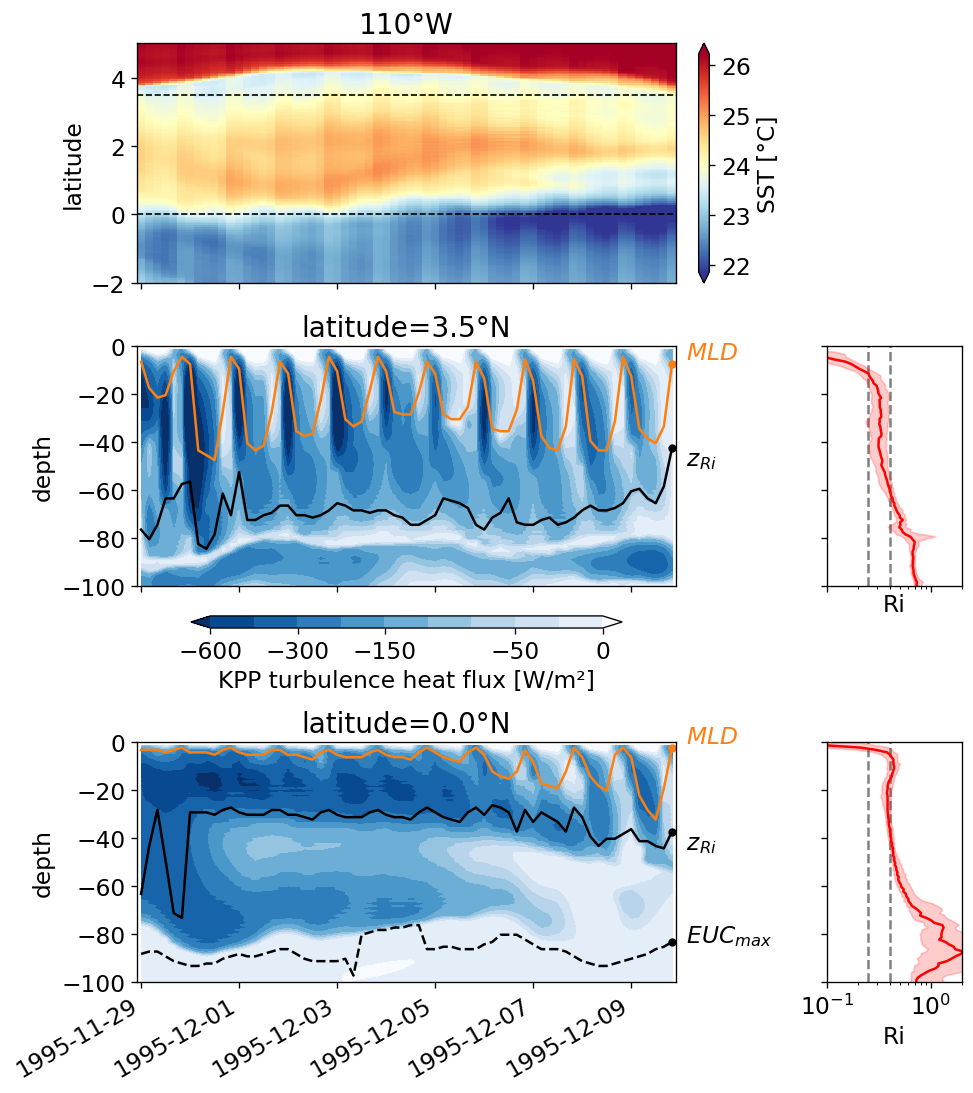
plt.rcParams["font.size"] = 14
f, ax = pump.plot.plot_jq_sst(
gcm1,
lon=-110,
periods=slice("1995-11-10", "1995-12-15"),
lat=[0, 3.5],
period=period.sel(longitude=-110),
full=full_subset.assign_coords(euc_max=euc_max),
eucmax=euc_max,
time_Ri={
0: slice("1995-11-17", "1995-11-29"),
3.5: slice("1995-11-28", "1995-12-09"),
},
)
f.savefig("images/sst-deep-cycle-3N.png", dpi=150)
# ax[0,0].set_xlim("1995-11-29", "1995-12-09")
# f.savefig("images/sst-deep-cycle-3N-zoomin.png", dpi=150)
# f.set_size_inches((9))
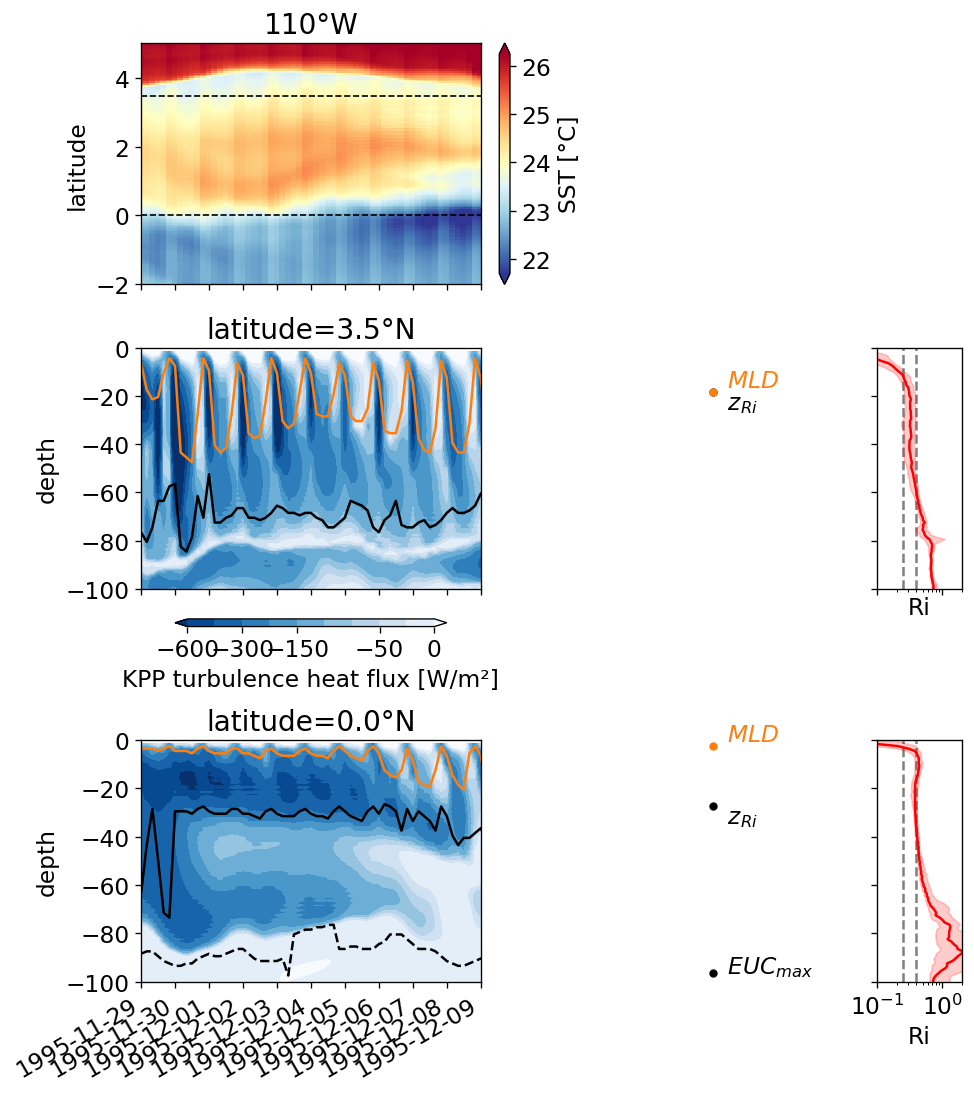
stuff#
saving density to file#
ds = dcpy.eos.pden(full.salt, full.theta, full.depth).to_dataset(name="dens")
dcpy.dask.batch_to_zarr(
ds,
dim="time",
file="/glade/u/home/dcherian/pump/glade/gcm1-sections-dens.zarr",
batch_size=500,
)
# dens = xr.open_zarr("/glade/u/home/dcherian/pump/glade/gcm1-sections-dens.zarr", consolidated=True)
other#
gcm1.budget = gcm1.budget.chunk({"time": 1, "depth": 10})
jq110 = gcm1.budget.Jq.sel(longitude=-110, method="nearest").sel(depth=slice(0, -500))
sections_jq = gcm1.budget.Jq.sel(longitude=gcm1.tao.longitude, method="nearest")
len(sections_jq.__dask_graph__())
389886
gcm1.read_budget()
/glade/u/home/dcherian/pump/pump/model/model.py:251: FutureWarning: In xarray version 0.14 the default behaviour of `open_mfdataset`
will change. To retain the existing behavior, pass
combine='nested'. To use future default behavior, pass
combine='by_coords'. See
http://xarray.pydata.org/en/stable/combining.html#combining-multi
files, drop_variables=["DFxE_TH", "DFyE_TH", "DFrE_TH"], **kwargs
/gpfs/u/home/dcherian/python/xarray/xarray/backends/api.py:931: FutureWarning: The datasets supplied have global dimension coordinates. You may want
to use the new `combine_by_coords` function (or the
`combine='by_coords'` option to `open_mfdataset`) to order the datasets
before concatenation. Alternatively, to continue concatenating based
on the order the datasets are supplied in future, please use the new
`combine_nested` function (or the `combine='nested'` option to
open_mfdataset).
from_openmfds=True,
/glade/u/home/dcherian/pump/pump/model/model.py:253: FutureWarning: In xarray version 0.14 the default behaviour of `open_mfdataset`
will change. To retain the existing behavior, pass
combine='nested'. To use future default behavior, pass
combine='by_coords'. See
http://xarray.pydata.org/en/stable/combining.html#combining-multi
xr.open_mfdataset(self.dirname + "Day_*_sf.nc", **kwargs),
/gpfs/u/home/dcherian/python/xarray/xarray/backends/api.py:931: FutureWarning: The datasets supplied have global dimension coordinates. You may want
to use the new `combine_by_coords` function (or the
`combine='by_coords'` option to `open_mfdataset`) to order the datasets
before concatenation. Alternatively, to continue concatenating based
on the order the datasets are supplied in future, please use the new
`combine_nested` function (or the `combine='nested'` option to
open_mfdataset).
from_openmfds=True,
reference by SST warm anomaly#
Define t=180 as time of warmest anomaly SST
gcm1.surface = gcm1.surface.chunk({"longitude": 10, "latitude": -1, "time": -1})
lon = -110
sst = gcm1.surface.sel(longitude=lon, method="nearest").theta.load()
# assign_coords(
# tiw_phase=tiw_phase, period=period
# )
tiw_phase, period = pump.calc.get_tiw_phase_sst(sst, debug=True)
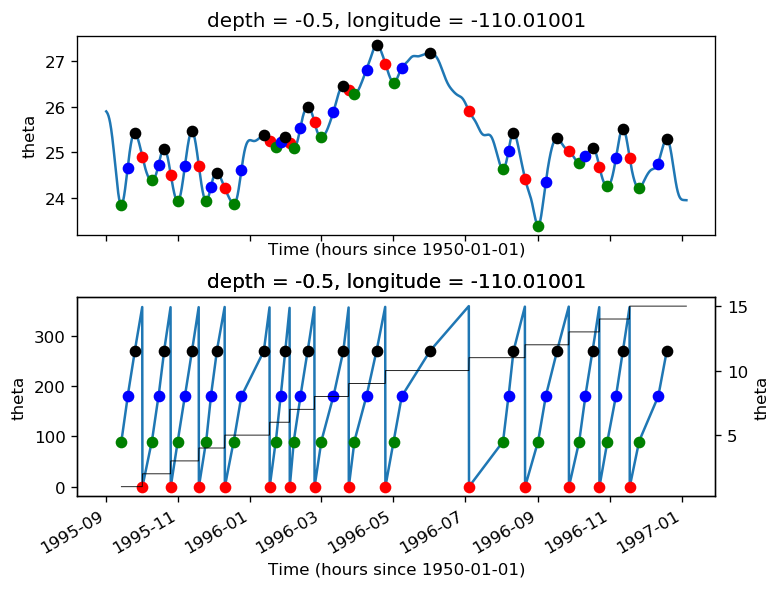
(
sst.assign_coords(tiw_phase=phase, period=period)
.where(phase.notnull(), drop=True)
.groupby("period")
.plot(
col="period",
col_wrap=5,
x="tiw_phase",
robust=True,
sharex=True,
sahery=True,
cmap=mpl.cm.Spectral_r,
xlim=[0, 360],
)
)
<xarray.plot.facetgrid.FacetGrid at 0x2b8bcef8e0b8>
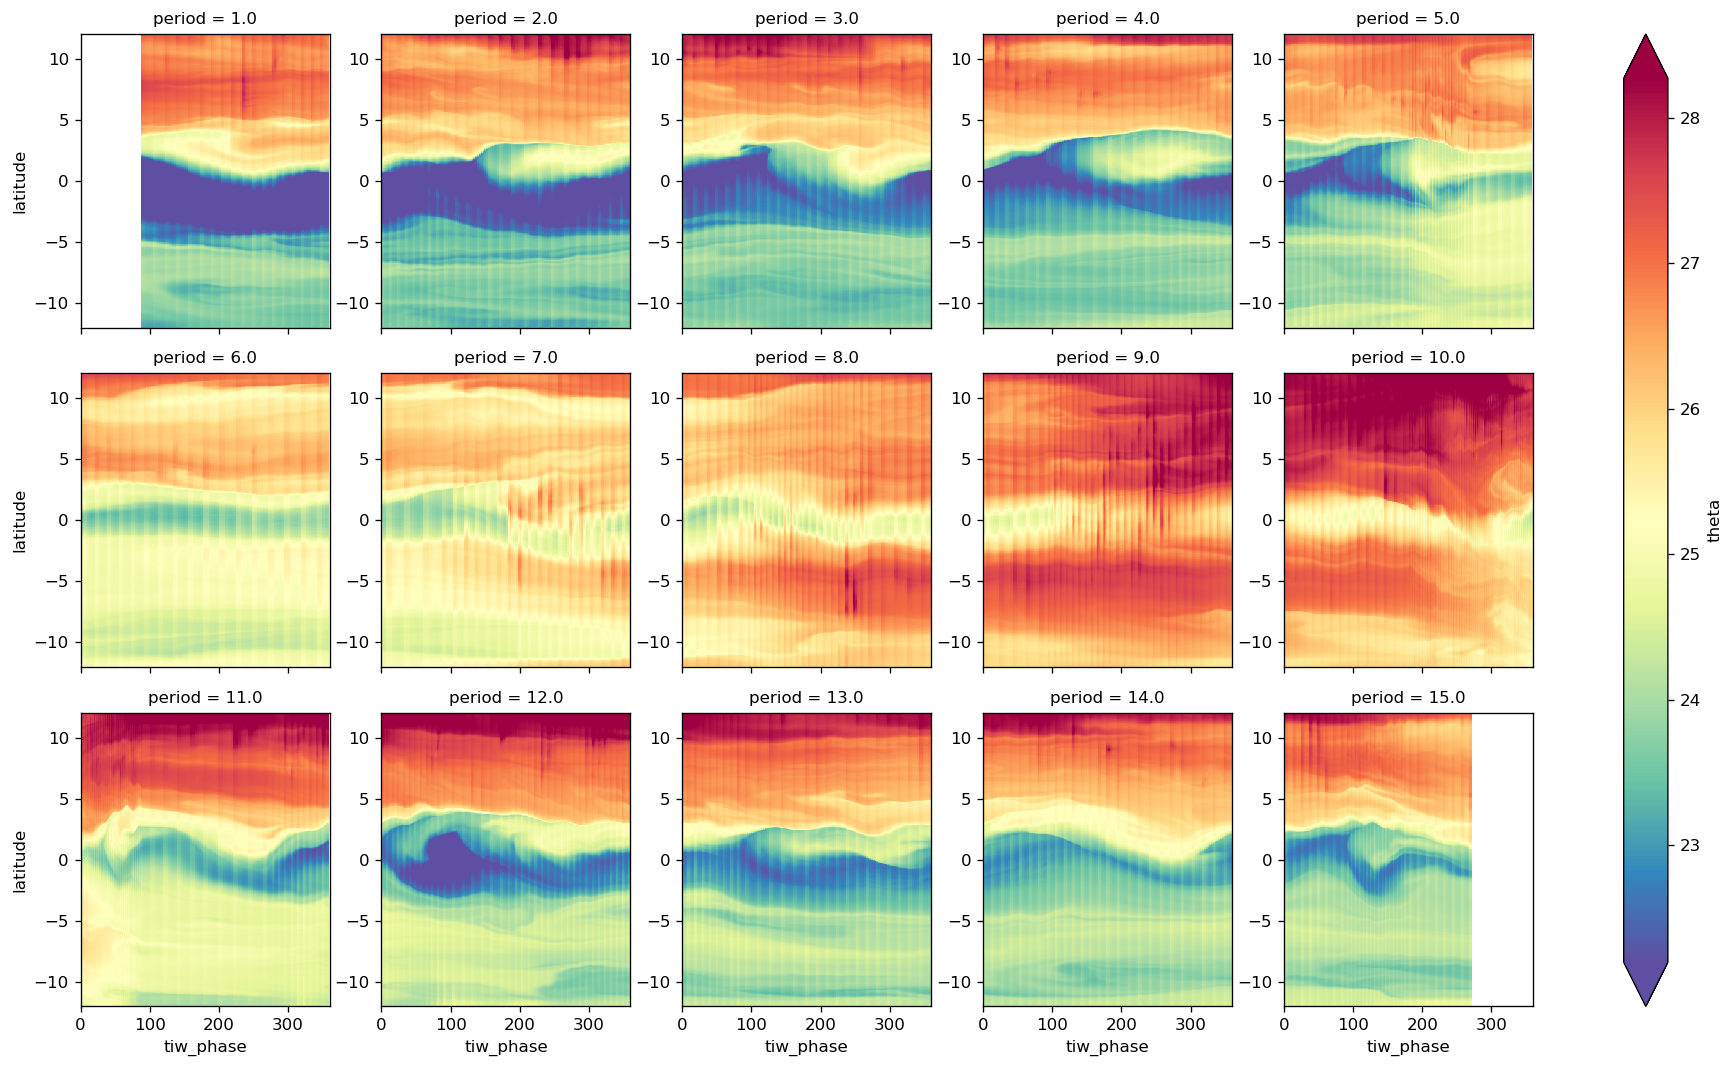
import xfilter
import scipy as sp
sstfilt = xfilter.lowpass(
sst.sel(latitude=slice(0, 5)).mean("latitude"),
coord="time",
freq=1 / 15,
cycles_per="D",
num_discard=0,
)
if sstfilt.ndim > 1:
raise NotImplementedError("tiw phase estimation for SST not vectorized yet")
sig = sstfilt.compute()
phase, period = pump.calc.merge_phase_label_period(
sig,
phase_0,
phase_90,
phase_180,
phase_270,
debug=True,
)
sst.load().groupby("period").plot(
col="period",
col_wrap=5,
x="tiw_phase",
sharex=True,
sharey=True,
robust=True,
cmap=mpl.cm.Spectral_r,
)
/gpfs/u/home/dcherian/python/xarray/xarray/plot/utils.py:650: RuntimeWarning: invalid value encountered in greater_equal
np.arange(0, n - 1), axis=axis
/gpfs/u/home/dcherian/python/xarray/xarray/plot/utils.py:653: RuntimeWarning: invalid value encountered in less_equal
np.arange(0, n - 1), axis=axis
---------------------------------------------------------------------------
ValueError Traceback (most recent call last)
<ipython-input-39-cd8ea6fded6a> in <module>
1 sst.load().groupby("period").plot(
----> 2 col="period", col_wrap=5, x="tiw_phase", sharex=True, sharey=True, robust=True, cmap=mpl.cm.Spectral_r,
3 )
/gpfs/u/home/dcherian/python/xarray/xarray/plot/plot.py in __call__(self, **kwargs)
498
499 def __call__(self, **kwargs):
--> 500 return plot(self._da, **kwargs)
501
502 @functools.wraps(hist)
/gpfs/u/home/dcherian/python/xarray/xarray/plot/plot.py in plot(darray, row, col, col_wrap, ax, hue, rtol, subplot_kws, **kwargs)
208 kwargs["ax"] = ax
209
--> 210 return plotfunc(darray, **kwargs)
211
212
/gpfs/u/home/dcherian/python/xarray/xarray/plot/plot.py in newplotfunc(darray, x, y, figsize, size, aspect, ax, row, col, col_wrap, xincrease, yincrease, add_colorbar, add_labels, vmin, vmax, cmap, center, robust, extend, levels, infer_intervals, colors, subplot_kws, cbar_ax, cbar_kwargs, xscale, yscale, xticks, yticks, xlim, ylim, norm, **kwargs)
691 else:
692 _sanity_check_groupby_row_col(darray, row, col)
--> 693 return _easy_facetgrid(darray, kind="groupby", **allargs)
694
695 plt = import_matplotlib_pyplot()
/gpfs/u/home/dcherian/python/xarray/xarray/plot/facetgrid.py in _easy_facetgrid(data, plotfunc, kind, x, y, row, col, col_wrap, sharex, sharey, aspect, size, subplot_kws, ax, figsize, **kwargs)
731
732 if kind == "groupby":
--> 733 return g.map_groupby(plotfunc, x, y, **kwargs)
734
735 if kind == "groupby_line":
/gpfs/u/home/dcherian/python/xarray/xarray/plot/facetgrid.py in map_groupby(self, func, x, y, hue, hue_style, add_guide, **kwargs)
414
415 for (_, subset), ax in zip(self.data, self.axes.flat):
--> 416 mappable = func(subset, x=x, y=y, ax=ax, **func_kwargs)
417 self._mappables.append(mappable)
418
/gpfs/u/home/dcherian/python/xarray/xarray/plot/plot.py in newplotfunc(darray, x, y, figsize, size, aspect, ax, row, col, col_wrap, xincrease, yincrease, add_colorbar, add_labels, vmin, vmax, cmap, center, robust, extend, levels, infer_intervals, colors, subplot_kws, cbar_ax, cbar_kwargs, xscale, yscale, xticks, yticks, xlim, ylim, norm, **kwargs)
787 vmax=cmap_params["vmax"],
788 norm=cmap_params["norm"],
--> 789 **kwargs,
790 )
791
/gpfs/u/home/dcherian/python/xarray/xarray/plot/plot.py in pcolormesh(x, y, z, ax, infer_intervals, **kwargs)
1003 ):
1004 if len(x.shape) == 1:
-> 1005 x = _infer_interval_breaks(x, check_monotonic=True)
1006 else:
1007 # we have to infer the intervals on both axes
/gpfs/u/home/dcherian/python/xarray/xarray/plot/utils.py in _infer_interval_breaks(coord, axis, check_monotonic)
673 "the input DataArray. To plot data with categorical "
674 "axes, consider using the `heatmap` function from "
--> 675 "the `seaborn` statistical plotting library." % axis
676 )
677
ValueError: The input coordinate is not sorted in increasing order along axis 0. This can lead to unexpected results. Consider calling the `sortby` method on the input DataArray. To plot data with categorical axes, consider using the `heatmap` function from the `seaborn` statistical plotting library.
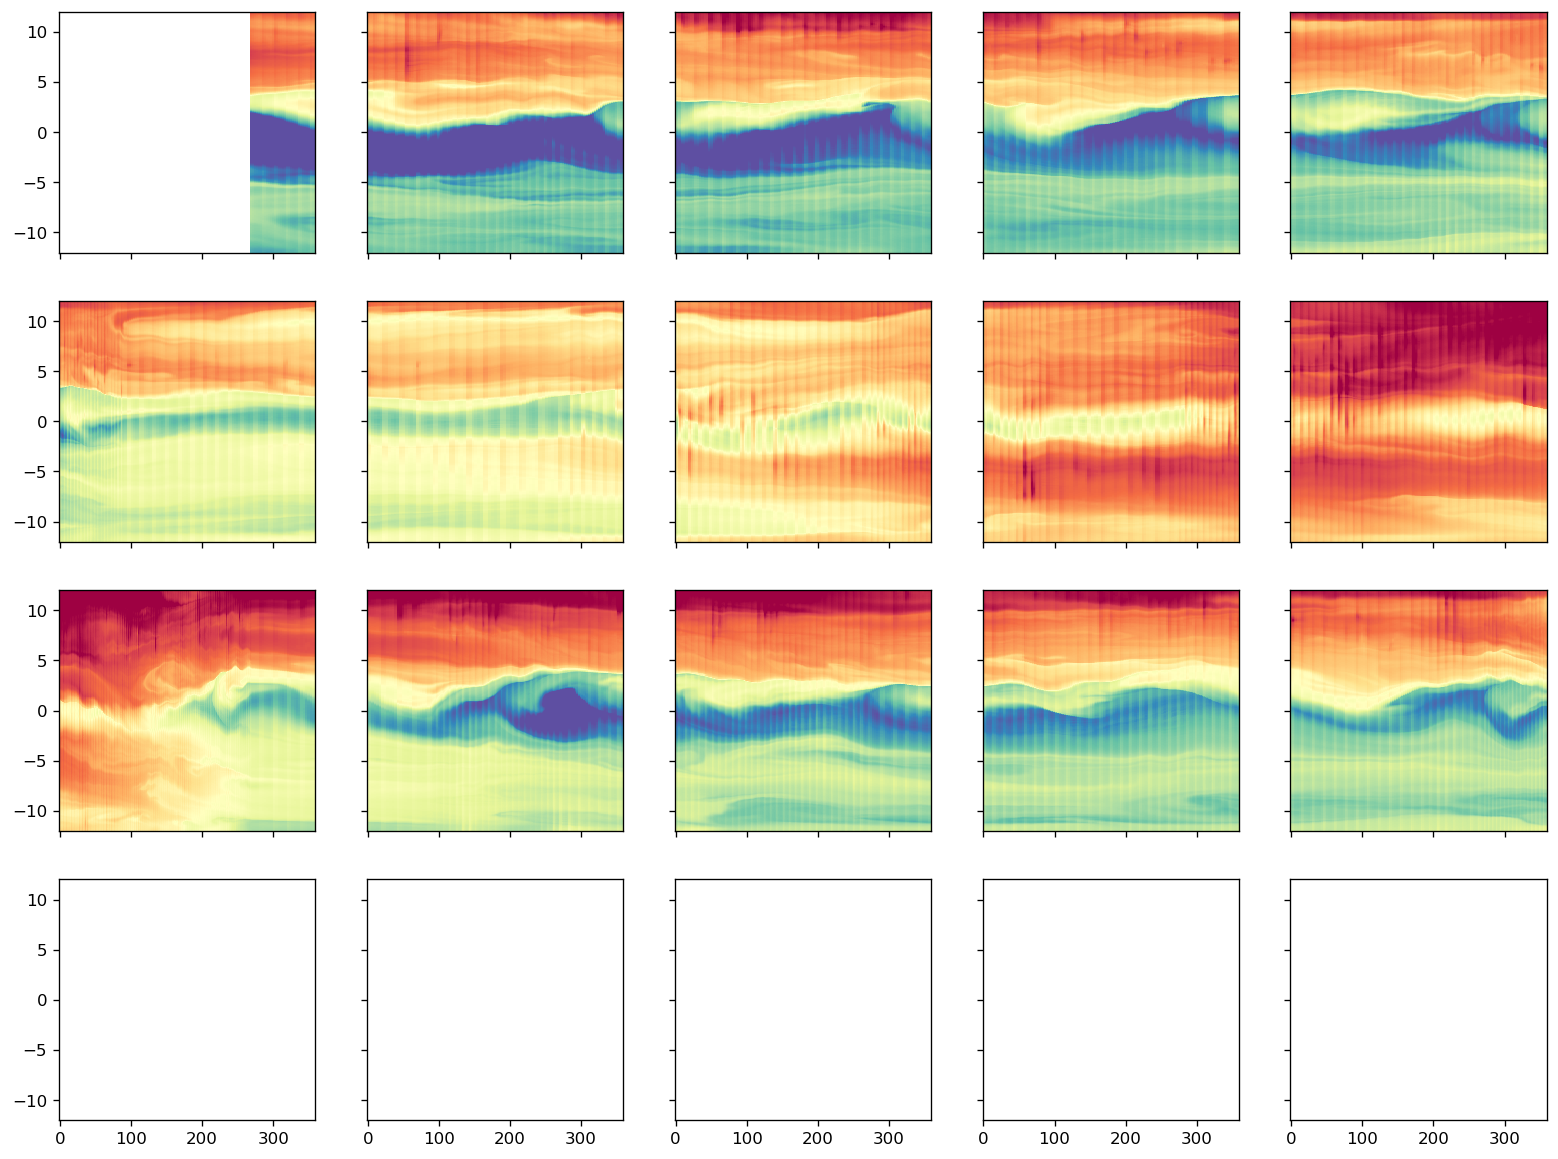
sst.sel(time="1995").plot(x="time", robust=True)
<matplotlib.collections.QuadMesh at 0x2b30edc67748>
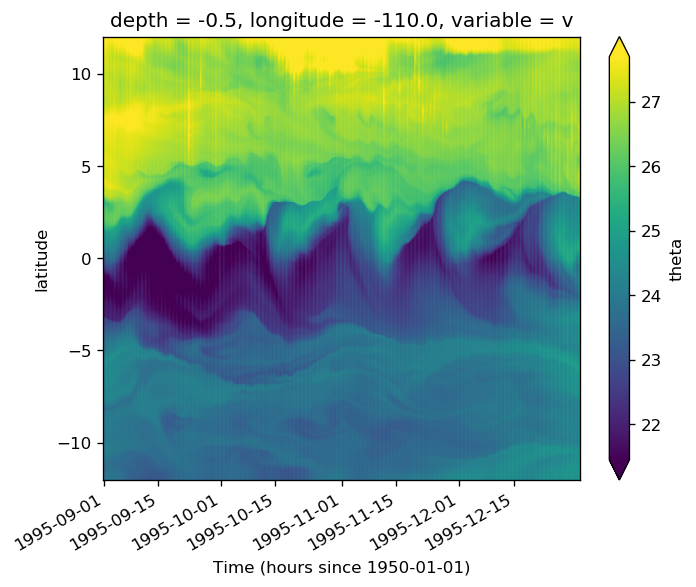
(
composite.where((np.abs(composite) - error) / np.abs(composite) > 0.2).theta.plot(
y="yref", robust=True, cmap=mpl.cm.RdYlBu_r
)
)
<matplotlib.collections.QuadMesh at 0x2ac52ee9ba90>
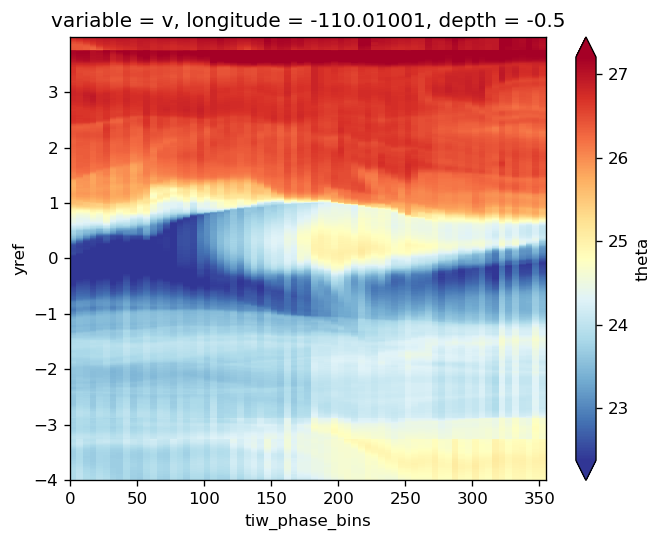
composite.zeta.plot(x="tiw_phase_bins", robust=True)
<matplotlib.collections.QuadMesh at 0x2ac5261f89b0>
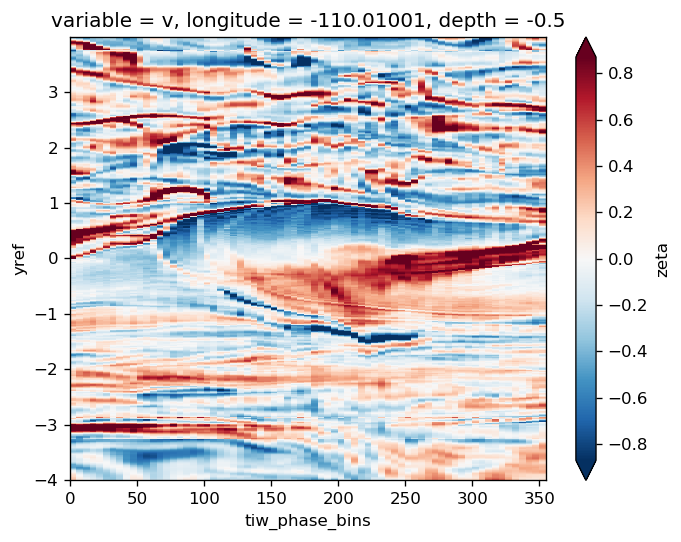
(
.mean("time")
.zeta
.plot(y="yref", robust=True, cmap=mpl.cm.RdYlBu_r)
)
<matplotlib.collections.QuadMesh at 0x2ac513917198>
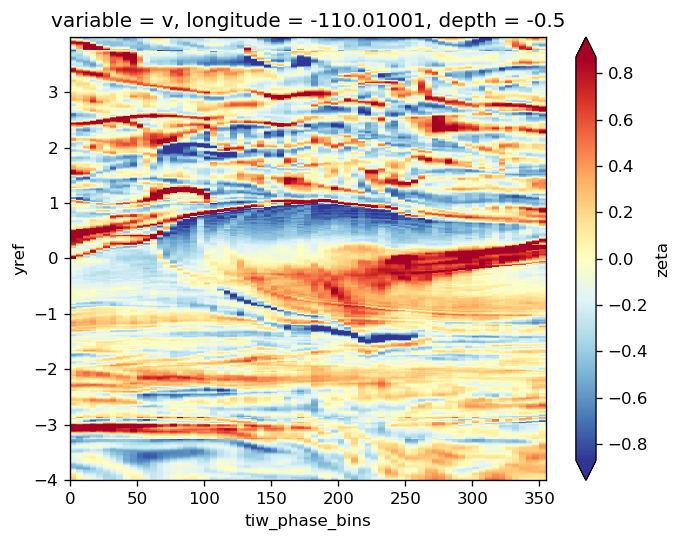
subset = surf110.theta.where(surf110.period.isin([4, 5, 6]), drop=True)
subset.groupby_bins("tiw_phase", np.arange(0, 360, 5)).mean("time")
<xarray.DataArray 'theta' (tiw_phase_bins: 71, latitude: 480)>
array([[24.02839 , 23.976442, 23.973637, ..., 27.767008, 27.778406,
27.87533 ],
[24.0917 , 24.11233 , 24.111015, ..., 27.784744, 27.815428,
27.835466],
[24.08908 , 24.072989, 24.073553, ..., 27.795588, 27.813833,
27.848253],
...,
[24.438179, 24.39509 , 24.387403, ..., 27.408218, 27.423044,
27.477694],
[24.544092, 24.578922, 24.572287, ..., 27.395113, 27.4082 ,
27.446953],
[24.442354, 24.41639 , 24.418417, ..., 27.413233, 27.42465 ,
27.491432]], dtype=float32)
Coordinates:
* tiw_phase_bins (tiw_phase_bins) object (0, 5] (5, 10] ... (350, 355]
* latitude (latitude) float32 -12.0 -11.949896 ... 11.949896 12.0
depth float32 -0.5
longitude float32 -110.01001
variable <U1 'v'
(
data.theta.groupby("period")
.apply(lambda x: x - x.mean("time"))
.groupby("period")
.plot.pcolormesh(
row="period", x="time", y="yref", robust=True, add_colorbar=False, ylim=[-3, 3]
)
)
/gpfs/u/home/dcherian/python/xarray/xarray/core/common.py:674: FutureWarning: This DataArray contains multi-dimensional coordinates. In the future, the dimension order of these coordinates will be restored as well unless you specify restore_coord_dims=False.
self, group, squeeze=squeeze, restore_coord_dims=restore_coord_dims
---------------------------------------------------------------------------
ValueError Traceback (most recent call last)
<ipython-input-30-34c385f866bd> in <module>
3 .apply(lambda x: x - x.mean("time"))
4 .groupby("period")
----> 5 .plot.pcolormesh(row="period", x="time", y="yref", robust=True, add_colorbar=False, ylim=[-3, 3]))
/gpfs/u/home/dcherian/python/xarray/xarray/plot/plot.py in plotmethod(_PlotMethods_obj, x, y, figsize, size, aspect, ax, row, col, col_wrap, xincrease, yincrease, add_colorbar, add_labels, vmin, vmax, cmap, colors, center, robust, extend, levels, infer_intervals, subplot_kws, cbar_ax, cbar_kwargs, xscale, yscale, xticks, yticks, xlim, ylim, norm, **kwargs)
847 for arg in ["_PlotMethods_obj", "newplotfunc", "kwargs"]:
848 del allargs[arg]
--> 849 return newplotfunc(**allargs)
850
851 # Add to class _PlotMethods
/gpfs/u/home/dcherian/python/xarray/xarray/plot/plot.py in newplotfunc(darray, x, y, figsize, size, aspect, ax, row, col, col_wrap, xincrease, yincrease, add_colorbar, add_labels, vmin, vmax, cmap, center, robust, extend, levels, infer_intervals, colors, subplot_kws, cbar_ax, cbar_kwargs, xscale, yscale, xticks, yticks, xlim, ylim, norm, **kwargs)
675 else:
676 _sanity_check_groupby_row_col(darray, row, col)
--> 677 return _easy_facetgrid(darray, kind="groupby", **allargs)
678
679 plt = import_matplotlib_pyplot()
/gpfs/u/home/dcherian/python/xarray/xarray/plot/facetgrid.py in _easy_facetgrid(data, plotfunc, kind, x, y, row, col, col_wrap, sharex, sharey, aspect, size, subplot_kws, ax, figsize, **kwargs)
724
725 if kind == "groupby":
--> 726 return g.map_groupby(plotfunc, x, y, **kwargs)
727
728 if kind == "groupby_line":
/gpfs/u/home/dcherian/python/xarray/xarray/plot/facetgrid.py in map_groupby(self, func, x, y, hue, hue_style, add_guide, **kwargs)
411
412 for (_, subset), ax in zip(self.data, self.axes.flat):
--> 413 mappable = func(subset, x=x, y=y, ax=ax, **func_kwargs)
414 self._mappables.append(mappable)
415
/gpfs/u/home/dcherian/python/xarray/xarray/plot/plot.py in newplotfunc(darray, x, y, figsize, size, aspect, ax, row, col, col_wrap, xincrease, yincrease, add_colorbar, add_labels, vmin, vmax, cmap, center, robust, extend, levels, infer_intervals, colors, subplot_kws, cbar_ax, cbar_kwargs, xscale, yscale, xticks, yticks, xlim, ylim, norm, **kwargs)
698 # check if we need to broadcast one dimension
699 if xval.ndim < yval.ndim:
--> 700 xval = np.broadcast_to(xval, yval.shape)
701
702 if yval.ndim < xval.ndim:
<__array_function__ internals> in broadcast_to(*args, **kwargs)
~/miniconda3/envs/dcpy/lib/python3.6/site-packages/numpy/lib/stride_tricks.py in broadcast_to(array, shape, subok)
180 [1, 2, 3]])
181 """
--> 182 return _broadcast_to(array, shape, subok=subok, readonly=True)
183
184
~/miniconda3/envs/dcpy/lib/python3.6/site-packages/numpy/lib/stride_tricks.py in _broadcast_to(array, shape, subok, readonly)
125 it = np.nditer(
126 (array,), flags=['multi_index', 'refs_ok', 'zerosize_ok'] + extras,
--> 127 op_flags=['readonly'], itershape=shape, order='C')
128 with it:
129 # never really has writebackifcopy semantics
ValueError: operands could not be broadcast together with remapped shapes [original->remapped]: (142,) and requested shape (142,480)
gcm1.surface.theta.sel(time="1995-12-01 00:00").plot()
dcpy.plots.liney(0)
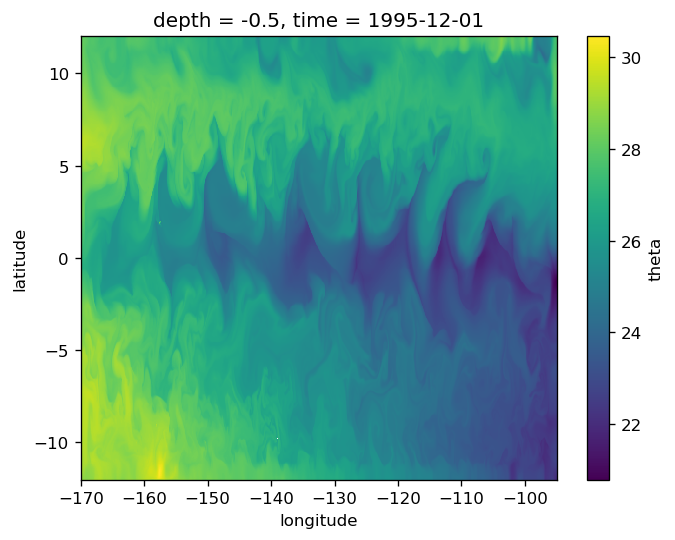
%matplotlib inline
surf110 = surf110.assign_coords(tmat=surf110.time.broadcast_like(surf110.theta))
f, ax = plt.subplots(2, 1, sharex=True, constrained_layout=True)
surf110.zeta.where(surf110.period.isin([4, 5, 6]), drop=True).plot(
x="time", y="latitude", ax=ax[0], robust=True
)
surf110.zeta.where(surf110.period.isin([4, 5, 6]), drop=True).plot(
x="tmat", y="yref", ax=ax[1], robust=True
)
<matplotlib.collections.QuadMesh at 0x2ac15b240860>
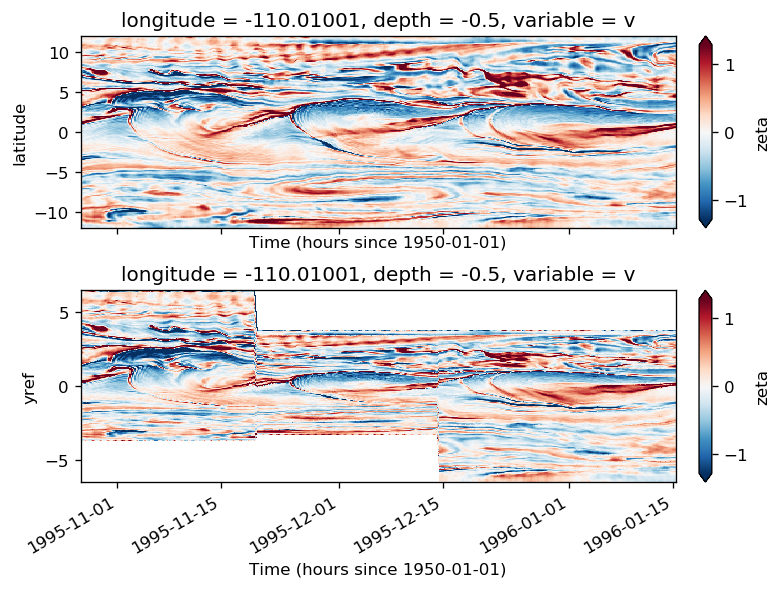
(
surf110.zeta.where(surf110.period.isin([4, 5, 6]))
.groupby_bins("tiw_phase", np.arange(0, 360, 5))
.mean("time")
.plot(y="latitude", robust=True)
)
<matplotlib.collections.QuadMesh at 0x2b599fc7b860>
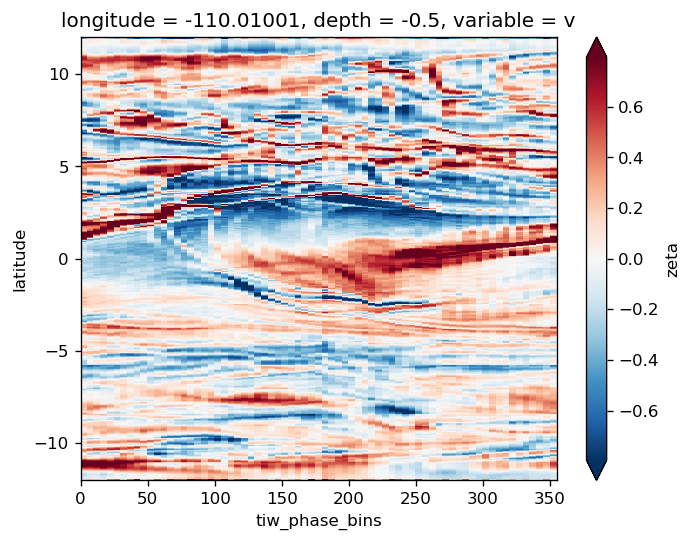
%matplotlib notebook
def mark_periods(period, ax=None):
if ax is None:
ax = plt.gca()
unique_periods = np.unique(period.dropna("time"))
for per in unique_periods:
tstart = period.time.where(period == per, drop=True)[0].values
tstop = period.time.where(period == per, drop=True)[-1].values
ax.text(tstart, 5, f"{per:.0f}")
ax.axvline(tstart, color="w", zorder=11)
ax.axvline(tstop, color="w", zorder=11)
def plot_surface_fields(model, longitude, latitude=2):
latlon = dict(longitude=longitude, latitude=latitude, method="nearest")
tao = model.tao.sel(**latlon)
phase = model.tao.tiw_phase.sel(**latlon)
phase360 = phase.where(np.abs(phase - 360) < 5, drop=True)
f0 = dcpy.oceans.coriolis(model.surface.latitude)
f, ax = plt.subplots(2, 1, sharex=True, sharey=True)
plt.sca(ax[0])
tao.sel(depth=slice(-25, -80)).mean("depth").v.plot(x="time")
(f0 + model.surface.zeta).sel(**latlon).plot(x="time")
(f0 + model.surface.sel(longitude=longitude, method="nearest").zeta).plot(
x="time", robust=True, add_colorbar=False
)
plt.sca(ax[1])
tao.sel(depth=slice(-25, -80)).mean("depth").v.plot(x="time")
model.surface.zeta.sel(**latlon).plot(x="time")
model.surface.sel(longitude=longitude, method="nearest").theta.plot(
x="time", robust=True, cmap=mpl.cm.RdYlBu_r, add_colorbar=False
)
[mark_periods(model.tao.period.sel(**latlon), ax=aa) for aa in ax]
# [dcpy.plots.linex(phase360.time.values, ax=aa, zorder=10) for aa in ax]
return ax
ax = plot_surface_fields(gcm1, -110, 2)
gcm1.surface = gcm1.surface.chunk({"longitude": 150, "latitude": 120})
gcm1.surface.zeta.sel(longitude=-110, method="nearest").plot(
x="time", robust=True, cbar_kwargs={"orientation": "horizontal"}
)
<matplotlib.collections.QuadMesh at 0x2b9b57f6b2e8>
gcm1.surface.zeta.sel(longitude=-110, latitude=2, method="nearest").plot()
# gcm1.surface.zeta.sel(longitude=-125, latitude=2, method="nearest").plot()
# gcm1.surface.zeta.sel(longitude=-140, latitude=2, method="nearest").plot()
[<matplotlib.lines.Line2D at 0x2b9a9f346b38>]
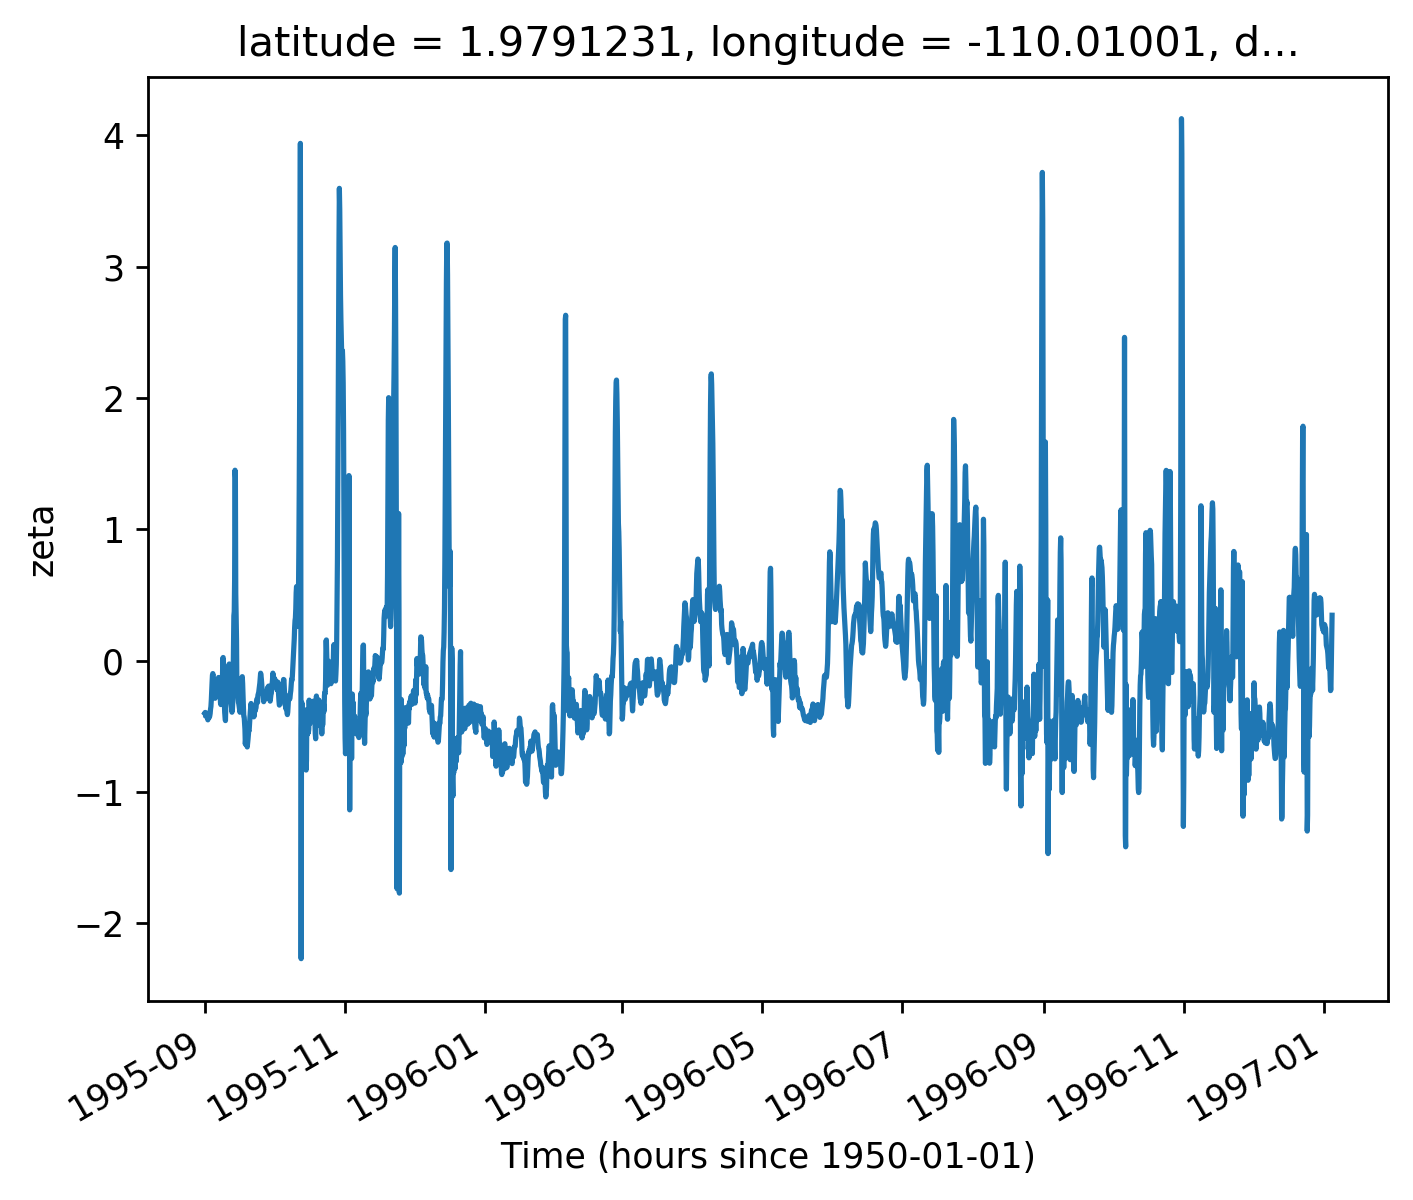
surf140.zeta.plot(y="latitude", robust=True)
plt.figure()
surf140.v.plot(y="latitude")
surf140.zeta.where(surf140.zeta > 1).plot.contour(
y="latitude", linewidths=0.5, colors="k"
)
avg_surf.zeta.plot(x="tiw_phase_bins", robust=True)
<matplotlib.collections.QuadMesh at 0x2b41d67fe940>
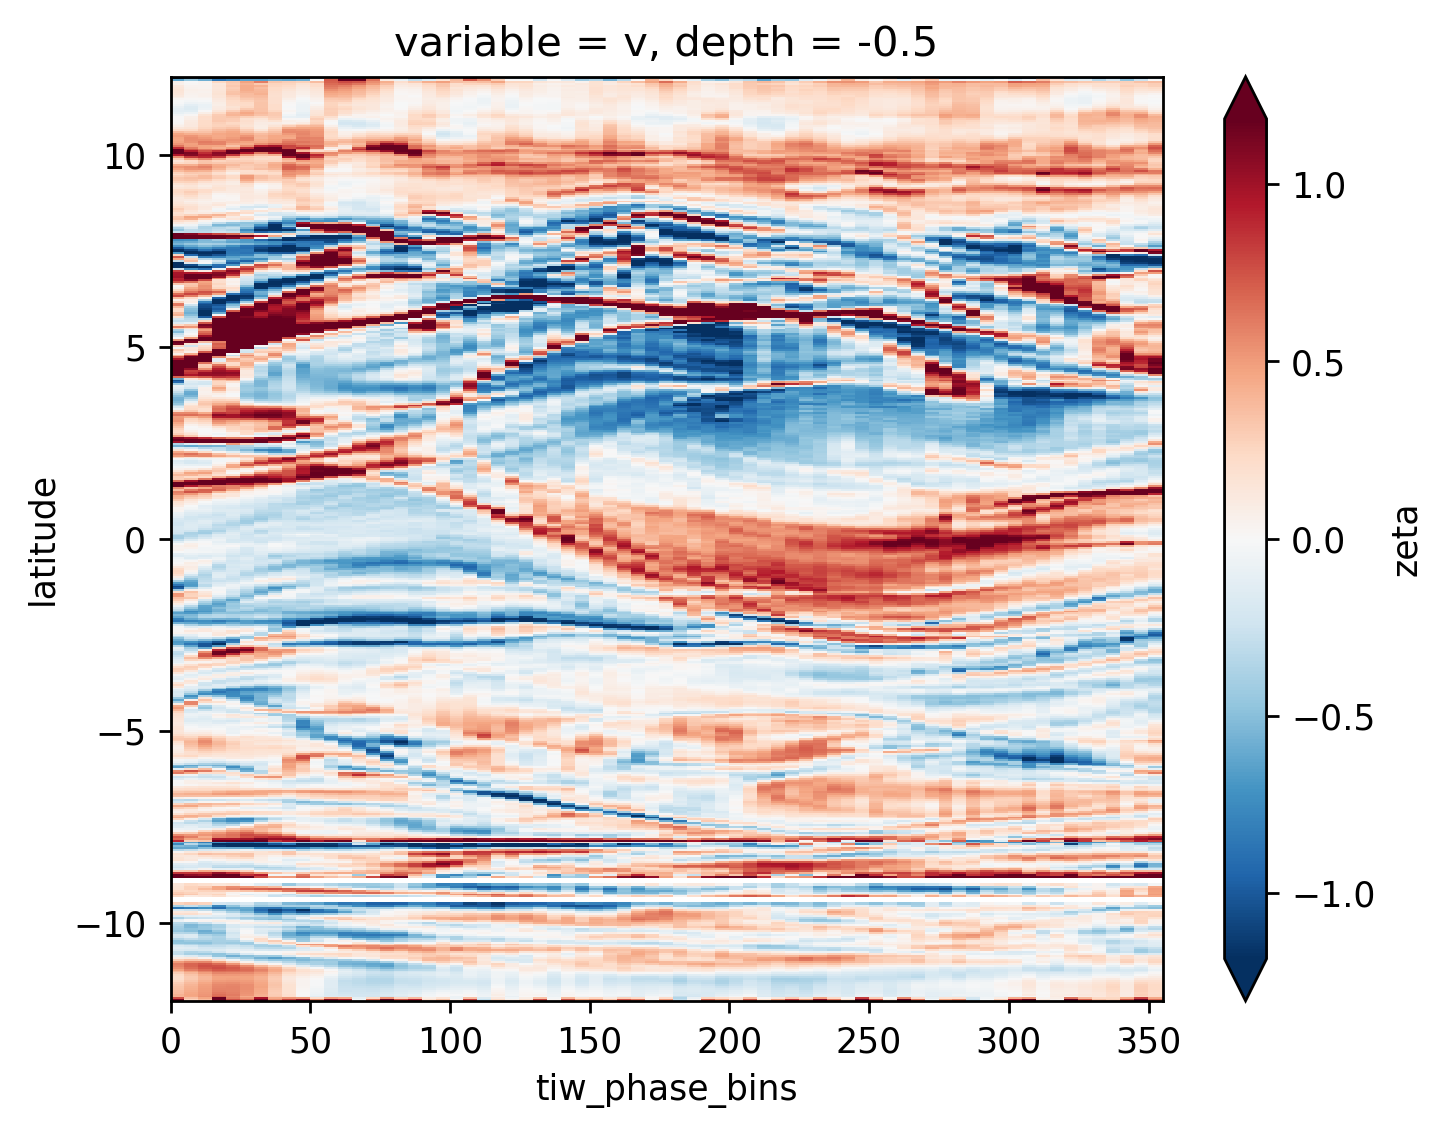
surf140.theta.plot(x="time")
---------------------------------------------------------------------------
KeyboardInterrupt Traceback (most recent call last)
~/miniconda3/envs/dcpy/lib/python3.6/site-packages/distributed/client.py in get(self, dsk, keys, restrictions, loose_restrictions, resources, sync, asynchronous, direct, retries, priority, fifo_timeout, actors, **kwargs)
2509 try:
-> 2510 results = self.gather(packed, asynchronous=asynchronous, direct=direct)
2511 finally:
~/miniconda3/envs/dcpy/lib/python3.6/site-packages/distributed/client.py in gather(self, futures, errors, direct, asynchronous)
1811 local_worker=local_worker,
-> 1812 asynchronous=asynchronous,
1813 )
~/miniconda3/envs/dcpy/lib/python3.6/site-packages/distributed/client.py in sync(self, func, asynchronous, callback_timeout, *args, **kwargs)
752 return sync(
--> 753 self.loop, func, *args, callback_timeout=callback_timeout, **kwargs
754 )
~/miniconda3/envs/dcpy/lib/python3.6/site-packages/distributed/utils.py in sync(loop, func, callback_timeout, *args, **kwargs)
334 while not e.is_set():
--> 335 e.wait(10)
336 if error[0]:
~/miniconda3/envs/dcpy/lib/python3.6/threading.py in wait(self, timeout)
550 if not signaled:
--> 551 signaled = self._cond.wait(timeout)
552 return signaled
~/miniconda3/envs/dcpy/lib/python3.6/threading.py in wait(self, timeout)
298 if timeout > 0:
--> 299 gotit = waiter.acquire(True, timeout)
300 else:
KeyboardInterrupt:
During handling of the above exception, another exception occurred:
KeyboardInterrupt Traceback (most recent call last)
<ipython-input-18-3273c3e701c8> in <module>
----> 1 surf140.theta.plot(x="time")
/gpfs/u/home/dcherian/python/xarray/xarray/plot/plot.py in __call__(self, **kwargs)
459
460 def __call__(self, **kwargs):
--> 461 return plot(self._da, **kwargs)
462
463 @functools.wraps(hist)
/gpfs/u/home/dcherian/python/xarray/xarray/plot/plot.py in plot(darray, row, col, col_wrap, ax, hue, rtol, subplot_kws, **kwargs)
160
161 """
--> 162 darray = darray.squeeze().compute()
163
164 plot_dims = set(darray.dims)
/gpfs/u/home/dcherian/python/xarray/xarray/core/dataarray.py in compute(self, **kwargs)
825 """
826 new = self.copy(deep=False)
--> 827 return new.load(**kwargs)
828
829 def persist(self, **kwargs) -> "DataArray":
/gpfs/u/home/dcherian/python/xarray/xarray/core/dataarray.py in load(self, **kwargs)
799 dask.array.compute
800 """
--> 801 ds = self._to_temp_dataset().load(**kwargs)
802 new = self._from_temp_dataset(ds)
803 self._variable = new._variable
/gpfs/u/home/dcherian/python/xarray/xarray/core/dataset.py in load(self, **kwargs)
642
643 # evaluate all the dask arrays simultaneously
--> 644 evaluated_data = da.compute(*lazy_data.values(), **kwargs)
645
646 for k, data in zip(lazy_data, evaluated_data):
~/miniconda3/envs/dcpy/lib/python3.6/site-packages/dask/base.py in compute(*args, **kwargs)
444 keys = [x.__dask_keys__() for x in collections]
445 postcomputes = [x.__dask_postcompute__() for x in collections]
--> 446 results = schedule(dsk, keys, **kwargs)
447 return repack([f(r, *a) for r, (f, a) in zip(results, postcomputes)])
448
~/miniconda3/envs/dcpy/lib/python3.6/site-packages/distributed/client.py in get(self, dsk, keys, restrictions, loose_restrictions, resources, sync, asynchronous, direct, retries, priority, fifo_timeout, actors, **kwargs)
2511 finally:
2512 for f in futures.values():
-> 2513 f.release()
2514 if getattr(thread_state, "key", False) and should_rejoin:
2515 rejoin()
~/miniconda3/envs/dcpy/lib/python3.6/site-packages/distributed/client.py in release(self, _in_destructor)
354 self._cleared = True
355 try:
--> 356 self.client.loop.add_callback(self.client._dec_ref, tokey(self.key))
357 except TypeError:
358 pass # Shutting down, add_callback may be None
~/miniconda3/envs/dcpy/lib/python3.6/site-packages/tornado/platform/asyncio.py in add_callback(self, callback, *args, **kwargs)
152 self.asyncio_loop.call_soon_threadsafe(
153 self._run_callback,
--> 154 functools.partial(stack_context.wrap(callback), *args, **kwargs))
155 except RuntimeError:
156 # "Event loop is closed". Swallow the exception for
~/miniconda3/envs/dcpy/lib/python3.6/asyncio/base_events.py in call_soon_threadsafe(self, callback, *args)
627 if self._debug:
628 self._check_callback(callback, 'call_soon_threadsafe')
--> 629 handle = self._call_soon(callback, args)
630 if handle._source_traceback:
631 del handle._source_traceback[-1]
~/miniconda3/envs/dcpy/lib/python3.6/asyncio/base_events.py in _call_soon(self, callback, args)
599
600 def _call_soon(self, callback, args):
--> 601 handle = events.Handle(callback, args, self)
602 if handle._source_traceback:
603 del handle._source_traceback[-1]
~/miniconda3/envs/dcpy/lib/python3.6/asyncio/events.py in __init__(self, callback, args, loop)
108 self._cancelled = False
109 self._repr = None
--> 110 if self._loop.get_debug():
111 self._source_traceback = extract_stack(sys._getframe(1))
112 else:
KeyboardInterrupt:
ERROR:asyncio:Task exception was never retrieved
future: <Task finished coro=<BaseTCPConnector.connect() done, defined at /glade/u/home/dcherian/miniconda3/envs/dcpy/lib/python3.6/site-packages/distributed/comm/tcp.py:349> exception=CommClosedError('in <distributed.comm.tcp.TCPConnector object at 0x2ac997f167f0>: ConnectionRefusedError: [Errno 111] Connection refused',)>
Traceback (most recent call last):
File "/glade/u/home/dcherian/miniconda3/envs/dcpy/lib/python3.6/site-packages/distributed/comm/tcp.py", line 356, in connect
ip, port, max_buffer_size=MAX_BUFFER_SIZE, **kwargs
File "/glade/u/home/dcherian/miniconda3/envs/dcpy/lib/python3.6/site-packages/tornado/gen.py", line 1141, in run
yielded = self.gen.throw(*exc_info)
File "/glade/u/home/dcherian/miniconda3/envs/dcpy/lib/python3.6/site-packages/tornado/tcpclient.py", line 232, in connect
af, addr, stream = yield connector.start(connect_timeout=timeout)
File "/glade/u/home/dcherian/miniconda3/envs/dcpy/lib/python3.6/site-packages/tornado/gen.py", line 1133, in run
value = future.result()
File "/glade/u/home/dcherian/miniconda3/envs/dcpy/lib/python3.6/site-packages/tornado/tcpclient.py", line 112, in on_connect_done
stream = future.result()
tornado.iostream.StreamClosedError: Stream is closed
During handling of the above exception, another exception occurred:
Traceback (most recent call last):
File "/glade/u/home/dcherian/miniconda3/envs/dcpy/lib/python3.6/site-packages/distributed/comm/tcp.py", line 368, in connect
convert_stream_closed_error(self, e)
File "/glade/u/home/dcherian/miniconda3/envs/dcpy/lib/python3.6/site-packages/distributed/comm/tcp.py", line 138, in convert_stream_closed_error
raise CommClosedError("in %s: %s: %s" % (obj, exc.__class__.__name__, exc))
distributed.comm.core.CommClosedError: in <distributed.comm.tcp.TCPConnector object at 0x2ac997f167f0>: ConnectionRefusedError: [Errno 111] Connection refused
f, ax = plt.subplots(2, 1, sharex=True)
surf140.theta.where(tao0140.period.isin([1, 3, 4])).plot(
x="time", robust=True, ax=ax[0]
)
surf140.theta.where(tao0140.period.isin([2, 6])).plot(x="time", robust=True, ax=ax[1])
<matplotlib.collections.QuadMesh at 0x2ac5bf401048>
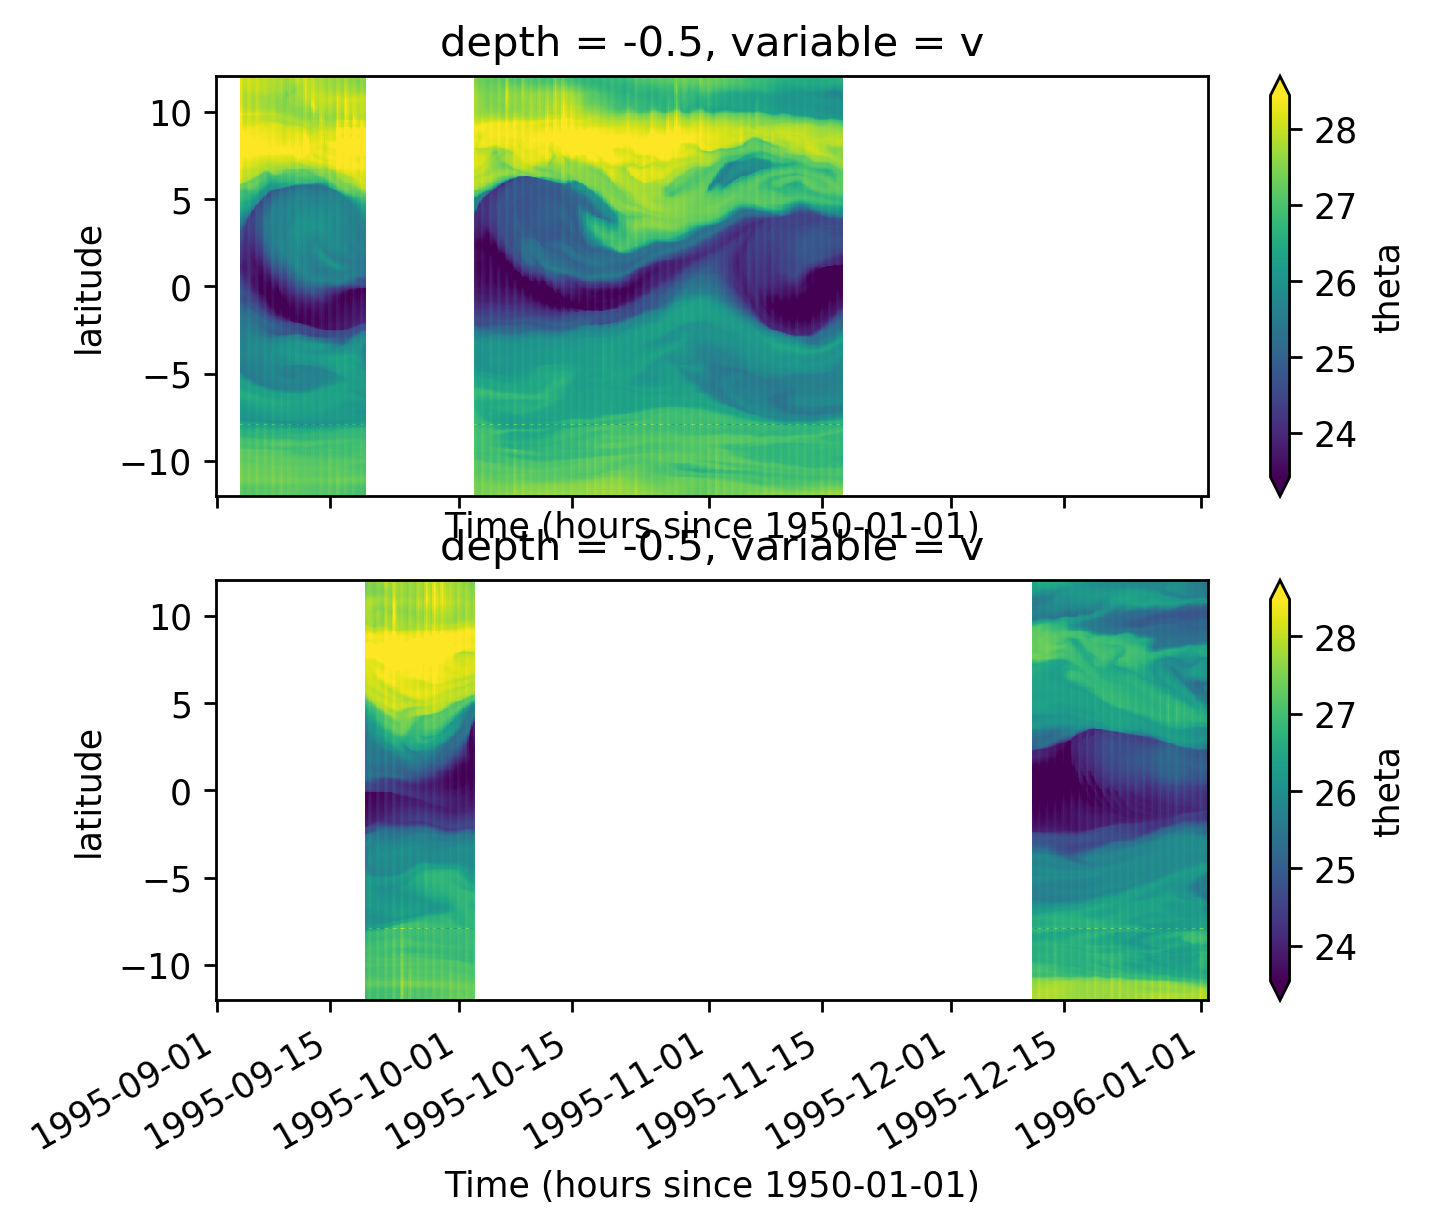
surf140.theta.where(tao0140.period == 1, drop=True).plot.hist(bins=100, alpha=0.2)
surf140.theta.where(tao0140.period == 3, drop=True).plot.hist(bins=100, alpha=0.2)
(array([ 36., 29., 38., 55., 63., 88., 114., 121., 133.,
161., 256., 370., 515., 480., 481., 443., 428., 417.,
338., 323., 311., 303., 330., 318., 281., 312., 317.,
341., 298., 390., 538., 670., 796., 1028., 1070., 893.,
793., 674., 688., 689., 742., 618., 499., 330., 265.,
211., 226., 219., 263., 295., 298., 441., 733., 959.,
987., 1583., 2132., 1875., 1542., 1295., 1072., 921., 863.,
938., 1121., 1365., 1229., 1342., 1262., 1291., 1465., 1279.,
1033., 902., 938., 1034., 1240., 1452., 1482., 1129., 977.,
802., 689., 547., 537., 443., 543., 665., 840., 898.,
892., 693., 570., 576., 385., 222., 87., 74., 17.,
23.]),
array([22.681477, 22.743967, 22.806458, 22.86895 , 22.93144 , 22.99393 ,
23.056421, 23.118912, 23.181404, 23.243895, 23.306385, 23.368876,
23.431366, 23.493856, 23.556349, 23.61884 , 23.68133 , 23.74382 ,
23.80631 , 23.868803, 23.931293, 23.993784, 24.056274, 24.118765,
24.181257, 24.243748, 24.306238, 24.368729, 24.43122 , 24.493711,
24.556202, 24.618692, 24.681183, 24.743673, 24.806164, 24.868656,
24.931147, 24.993637, 25.056128, 25.118618, 25.18111 , 25.2436 ,
25.306091, 25.368582, 25.431072, 25.493565, 25.556055, 25.618546,
25.681036, 25.743526, 25.806019, 25.86851 , 25.931 , 25.99349 ,
26.05598 , 26.118471, 26.180964, 26.243454, 26.305944, 26.368435,
26.430925, 26.493418, 26.555908, 26.618399, 26.68089 , 26.74338 ,
26.805872, 26.868362, 26.930853, 26.993343, 27.055834, 27.118324,
27.180817, 27.243307, 27.305798, 27.368288, 27.430779, 27.49327 ,
27.555761, 27.618252, 27.680742, 27.743233, 27.805725, 27.868216,
27.930706, 27.993196, 28.055687, 28.11818 , 28.18067 , 28.24316 ,
28.30565 , 28.368141, 28.430632, 28.493124, 28.555614, 28.618105,
28.680595, 28.743086, 28.805578, 28.868069, 28.93056 ],
dtype=float32),
<a list of 100 Patch objects>)
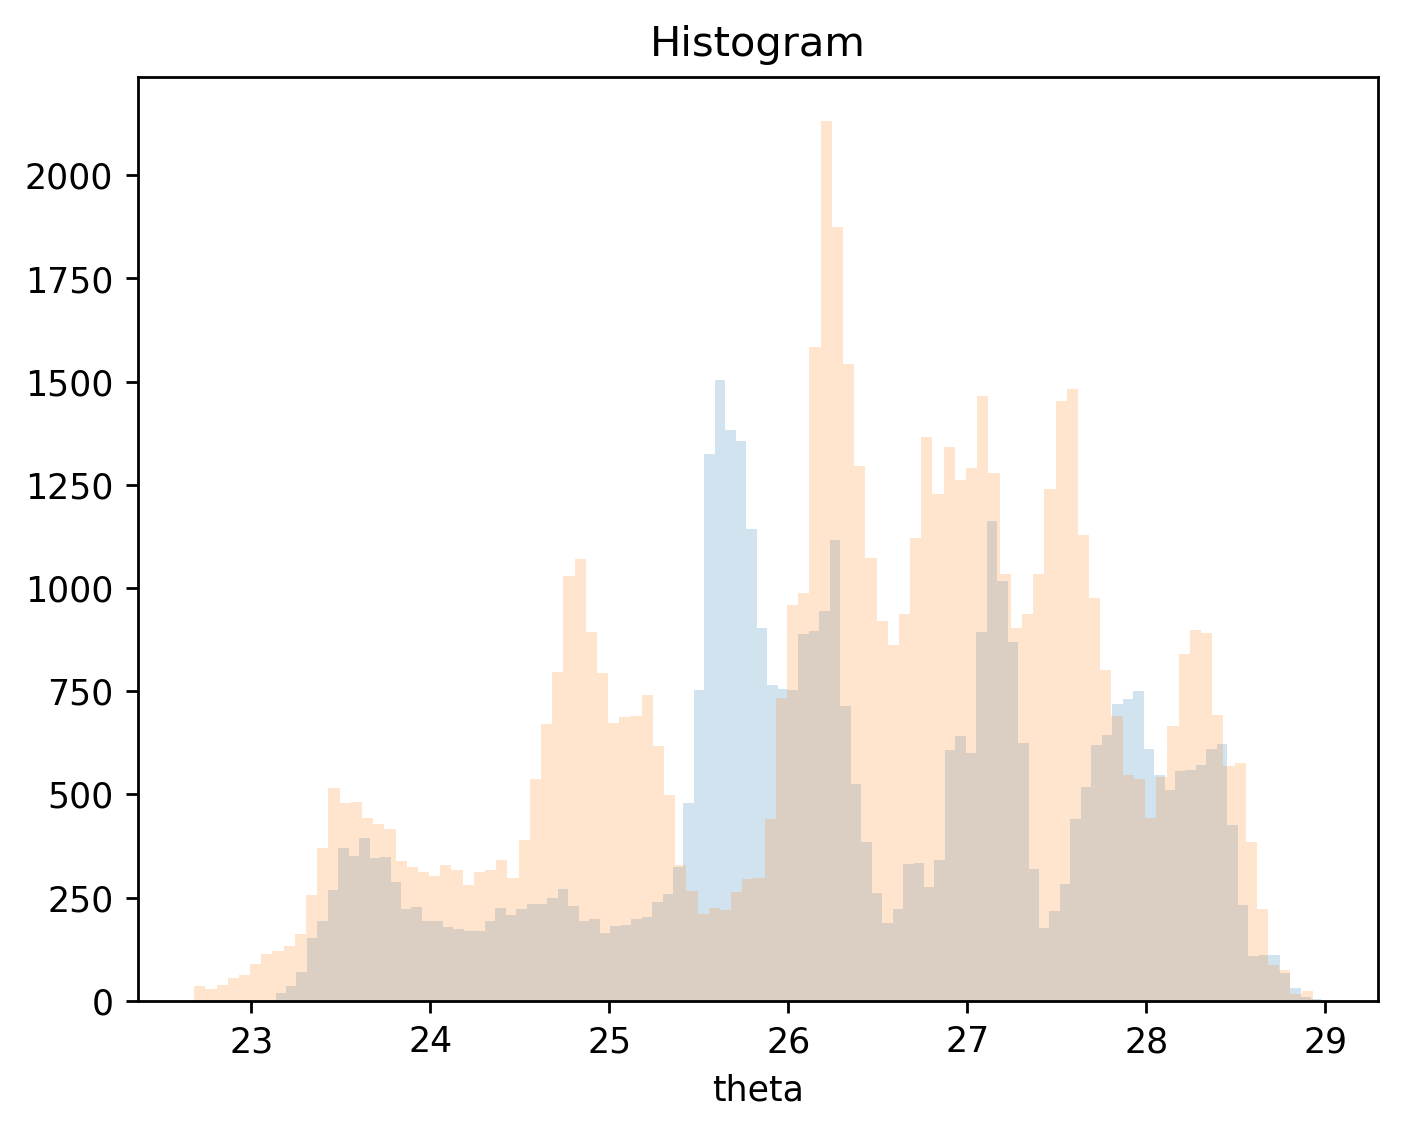
surf140.zeta.load()
---------------------------------------------------------------------------
KeyboardInterrupt Traceback (most recent call last)
<ipython-input-29-b9bd66c3b689> in <module>
----> 1 surf140.zeta.load()
/gpfs/u/home/dcherian/python/xarray/xarray/core/dataarray.py in load(self, **kwargs)
799 dask.array.compute
800 """
--> 801 ds = self._to_temp_dataset().load(**kwargs)
802 new = self._from_temp_dataset(ds)
803 self._variable = new._variable
/gpfs/u/home/dcherian/python/xarray/xarray/core/dataset.py in load(self, **kwargs)
642
643 # evaluate all the dask arrays simultaneously
--> 644 evaluated_data = da.compute(*lazy_data.values(), **kwargs)
645
646 for k, data in zip(lazy_data, evaluated_data):
~/miniconda3/envs/dcpy/lib/python3.6/site-packages/dask/base.py in compute(*args, **kwargs)
444 keys = [x.__dask_keys__() for x in collections]
445 postcomputes = [x.__dask_postcompute__() for x in collections]
--> 446 results = schedule(dsk, keys, **kwargs)
447 return repack([f(r, *a) for r, (f, a) in zip(results, postcomputes)])
448
~/miniconda3/envs/dcpy/lib/python3.6/site-packages/distributed/client.py in get(self, dsk, keys, restrictions, loose_restrictions, resources, sync, asynchronous, direct, retries, priority, fifo_timeout, actors, **kwargs)
2508 should_rejoin = False
2509 try:
-> 2510 results = self.gather(packed, asynchronous=asynchronous, direct=direct)
2511 finally:
2512 for f in futures.values():
~/miniconda3/envs/dcpy/lib/python3.6/site-packages/distributed/client.py in gather(self, futures, errors, direct, asynchronous)
1810 direct=direct,
1811 local_worker=local_worker,
-> 1812 asynchronous=asynchronous,
1813 )
1814
~/miniconda3/envs/dcpy/lib/python3.6/site-packages/distributed/client.py in sync(self, func, asynchronous, callback_timeout, *args, **kwargs)
751 else:
752 return sync(
--> 753 self.loop, func, *args, callback_timeout=callback_timeout, **kwargs
754 )
755
~/miniconda3/envs/dcpy/lib/python3.6/site-packages/distributed/utils.py in sync(loop, func, callback_timeout, *args, **kwargs)
333 else:
334 while not e.is_set():
--> 335 e.wait(10)
336 if error[0]:
337 six.reraise(*error[0])
~/miniconda3/envs/dcpy/lib/python3.6/threading.py in wait(self, timeout)
549 signaled = self._flag
550 if not signaled:
--> 551 signaled = self._cond.wait(timeout)
552 return signaled
553
~/miniconda3/envs/dcpy/lib/python3.6/threading.py in wait(self, timeout)
297 else:
298 if timeout > 0:
--> 299 gotit = waiter.acquire(True, timeout)
300 else:
301 gotit = waiter.acquire(False)
KeyboardInterrupt:
surf140.theta.latitude
<xarray.DataArray 'latitude' (latitude: 480)>
array([-12. , -11.949896, -11.899791, ..., 11.899791, 11.949896,
12. ], dtype=float32)
Coordinates:
* latitude (latitude) float32 -12.0 -11.949896 -11.899791 ... 11.949896 12.0
longitude float32 -139.97998
depth float32 -0.5
f, ax = plt.subplots(2, 1, sharex=True)
(
surf140.theta.sel(
latitude=[
0,
1,
2,
],
method="nearest",
)
.assign_coords(
{
"latitude": [
0,
1,
2,
]
}
)
.sel(time=slice(None, "1996-03-01"))
# .where(tao0140.period.isin([1, 3, 5]))
.plot(hue="latitude", ax=ax[0])
)
(
surf140.zeta.sel(
latitude=[
0,
1,
2,
],
method="nearest",
)
.assign_coords(
{
"latitude": [
0,
1,
2,
]
}
)
.sel(time=slice(None, "1996-03-01"))
# .where(tao0140.period.isin([1, 3, 5]))
.plot(hue="latitude", ax=ax[1])
)
---------------------------------------------------------------------------
KeyboardInterrupt Traceback (most recent call last)
<ipython-input-27-bc6eb83bc16f> in <module>
13 .sel(time=slice(None, "1996-03-01"))
14 # .where(tao0140.period.isin([1, 3, 5]))
---> 15 .plot(hue="latitude", ax=ax[1]))
16
/gpfs/u/home/dcherian/python/xarray/xarray/plot/plot.py in __call__(self, **kwargs)
459
460 def __call__(self, **kwargs):
--> 461 return plot(self._da, **kwargs)
462
463 @functools.wraps(hist)
/gpfs/u/home/dcherian/python/xarray/xarray/plot/plot.py in plot(darray, row, col, col_wrap, ax, hue, rtol, subplot_kws, **kwargs)
160
161 """
--> 162 darray = darray.squeeze().compute()
163
164 plot_dims = set(darray.dims)
/gpfs/u/home/dcherian/python/xarray/xarray/core/dataarray.py in compute(self, **kwargs)
825 """
826 new = self.copy(deep=False)
--> 827 return new.load(**kwargs)
828
829 def persist(self, **kwargs) -> "DataArray":
/gpfs/u/home/dcherian/python/xarray/xarray/core/dataarray.py in load(self, **kwargs)
799 dask.array.compute
800 """
--> 801 ds = self._to_temp_dataset().load(**kwargs)
802 new = self._from_temp_dataset(ds)
803 self._variable = new._variable
/gpfs/u/home/dcherian/python/xarray/xarray/core/dataset.py in load(self, **kwargs)
642
643 # evaluate all the dask arrays simultaneously
--> 644 evaluated_data = da.compute(*lazy_data.values(), **kwargs)
645
646 for k, data in zip(lazy_data, evaluated_data):
~/miniconda3/envs/dcpy/lib/python3.6/site-packages/dask/base.py in compute(*args, **kwargs)
444 keys = [x.__dask_keys__() for x in collections]
445 postcomputes = [x.__dask_postcompute__() for x in collections]
--> 446 results = schedule(dsk, keys, **kwargs)
447 return repack([f(r, *a) for r, (f, a) in zip(results, postcomputes)])
448
~/miniconda3/envs/dcpy/lib/python3.6/site-packages/distributed/client.py in get(self, dsk, keys, restrictions, loose_restrictions, resources, sync, asynchronous, direct, retries, priority, fifo_timeout, actors, **kwargs)
2508 should_rejoin = False
2509 try:
-> 2510 results = self.gather(packed, asynchronous=asynchronous, direct=direct)
2511 finally:
2512 for f in futures.values():
~/miniconda3/envs/dcpy/lib/python3.6/site-packages/distributed/client.py in gather(self, futures, errors, direct, asynchronous)
1810 direct=direct,
1811 local_worker=local_worker,
-> 1812 asynchronous=asynchronous,
1813 )
1814
~/miniconda3/envs/dcpy/lib/python3.6/site-packages/distributed/client.py in sync(self, func, asynchronous, callback_timeout, *args, **kwargs)
751 else:
752 return sync(
--> 753 self.loop, func, *args, callback_timeout=callback_timeout, **kwargs
754 )
755
~/miniconda3/envs/dcpy/lib/python3.6/site-packages/distributed/utils.py in sync(loop, func, callback_timeout, *args, **kwargs)
333 else:
334 while not e.is_set():
--> 335 e.wait(10)
336 if error[0]:
337 six.reraise(*error[0])
~/miniconda3/envs/dcpy/lib/python3.6/threading.py in wait(self, timeout)
549 signaled = self._flag
550 if not signaled:
--> 551 signaled = self._cond.wait(timeout)
552 return signaled
553
~/miniconda3/envs/dcpy/lib/python3.6/threading.py in wait(self, timeout)
297 else:
298 if timeout > 0:
--> 299 gotit = waiter.acquire(True, timeout)
300 else:
301 gotit = waiter.acquire(False)
KeyboardInterrupt:
Error in callback <function install_repl_displayhook.<locals>.post_execute at 0x2b107c9fe6a8> (for post_execute):
---------------------------------------------------------------------------
KeyboardInterrupt Traceback (most recent call last)
~/miniconda3/envs/dcpy/lib/python3.6/site-packages/matplotlib/pyplot.py in post_execute()
107 def post_execute():
108 if matplotlib.is_interactive():
--> 109 draw_all()
110
111 # IPython >= 2
~/miniconda3/envs/dcpy/lib/python3.6/site-packages/matplotlib/_pylab_helpers.py in draw_all(cls, force)
126 for f_mgr in cls.get_all_fig_managers():
127 if force or f_mgr.canvas.figure.stale:
--> 128 f_mgr.canvas.draw_idle()
129
130 atexit.register(Gcf.destroy_all)
~/miniconda3/envs/dcpy/lib/python3.6/site-packages/matplotlib/backend_bases.py in draw_idle(self, *args, **kwargs)
1905 if not self._is_idle_drawing:
1906 with self._idle_draw_cntx():
-> 1907 self.draw(*args, **kwargs)
1908
1909 def draw_cursor(self, event):
~/miniconda3/envs/dcpy/lib/python3.6/site-packages/matplotlib/backends/backend_agg.py in draw(self)
386 self.renderer = self.get_renderer(cleared=True)
387 with RendererAgg.lock:
--> 388 self.figure.draw(self.renderer)
389 # A GUI class may be need to update a window using this draw, so
390 # don't forget to call the superclass.
~/miniconda3/envs/dcpy/lib/python3.6/site-packages/matplotlib/artist.py in draw_wrapper(artist, renderer, *args, **kwargs)
36 renderer.start_filter()
37
---> 38 return draw(artist, renderer, *args, **kwargs)
39 finally:
40 if artist.get_agg_filter() is not None:
~/miniconda3/envs/dcpy/lib/python3.6/site-packages/matplotlib/figure.py in draw(self, renderer)
1707 self.patch.draw(renderer)
1708 mimage._draw_list_compositing_images(
-> 1709 renderer, self, artists, self.suppressComposite)
1710
1711 renderer.close_group('figure')
~/miniconda3/envs/dcpy/lib/python3.6/site-packages/matplotlib/image.py in _draw_list_compositing_images(renderer, parent, artists, suppress_composite)
133 if not_composite or not has_images:
134 for a in artists:
--> 135 a.draw(renderer)
136 else:
137 # Composite any adjacent images together
~/miniconda3/envs/dcpy/lib/python3.6/site-packages/matplotlib/artist.py in draw_wrapper(artist, renderer, *args, **kwargs)
36 renderer.start_filter()
37
---> 38 return draw(artist, renderer, *args, **kwargs)
39 finally:
40 if artist.get_agg_filter() is not None:
~/miniconda3/envs/dcpy/lib/python3.6/site-packages/matplotlib/axes/_base.py in draw(self, renderer, inframe)
2605 artists.remove(spine)
2606
-> 2607 self._update_title_position(renderer)
2608
2609 if not self.axison or inframe:
~/miniconda3/envs/dcpy/lib/python3.6/site-packages/matplotlib/axes/_base.py in _update_title_position(self, renderer)
2547 if (ax.xaxis.get_label_position() == 'top' or
2548 ax.xaxis.get_ticks_position() in choices):
-> 2549 bb = ax.xaxis.get_tightbbox(renderer)
2550 else:
2551 bb = ax.get_window_extent(renderer)
~/miniconda3/envs/dcpy/lib/python3.6/site-packages/matplotlib/axis.py in get_tightbbox(self, renderer)
1176 if a.get_visible()),
1177 *ticklabelBoxes,
-> 1178 *ticklabelBoxes2,
1179 ]
1180 bboxes = [b for b in bboxes
~/miniconda3/envs/dcpy/lib/python3.6/site-packages/matplotlib/axis.py in <genexpr>(.0)
1174 *(a.get_window_extent(renderer)
1175 for a in [self.label, self.offsetText]
-> 1176 if a.get_visible()),
1177 *ticklabelBoxes,
1178 *ticklabelBoxes2,
~/miniconda3/envs/dcpy/lib/python3.6/site-packages/matplotlib/text.py in get_window_extent(self, renderer, dpi)
888 raise RuntimeError('Cannot get window extent w/o renderer')
889
--> 890 bbox, info, descent = self._get_layout(self._renderer)
891 x, y = self.get_unitless_position()
892 x, y = self.get_transform().transform_point((x, y))
~/miniconda3/envs/dcpy/lib/python3.6/site-packages/matplotlib/text.py in _get_layout(self, renderer)
336
337 # get the rotation matrix
--> 338 M = Affine2D().rotate_deg(self.get_rotation())
339
340 # now offset the individual text lines within the box
~/miniconda3/envs/dcpy/lib/python3.6/site-packages/matplotlib/transforms.py in rotate_deg(self, degrees)
1936 and :meth:`scale`.
1937 """
-> 1938 return self.rotate(np.deg2rad(degrees))
1939
1940 def rotate_around(self, x, y, theta):
~/miniconda3/envs/dcpy/lib/python3.6/site-packages/matplotlib/transforms.py in rotate(self, theta)
1924 rotate_mtx = np.array([[a, -b, 0.0], [b, a, 0.0], [0.0, 0.0, 1.0]],
1925 float)
-> 1926 self._mtx = np.dot(rotate_mtx, self._mtx)
1927 self.invalidate()
1928 return self
<__array_function__ internals> in dot(*args, **kwargs)
KeyboardInterrupt:
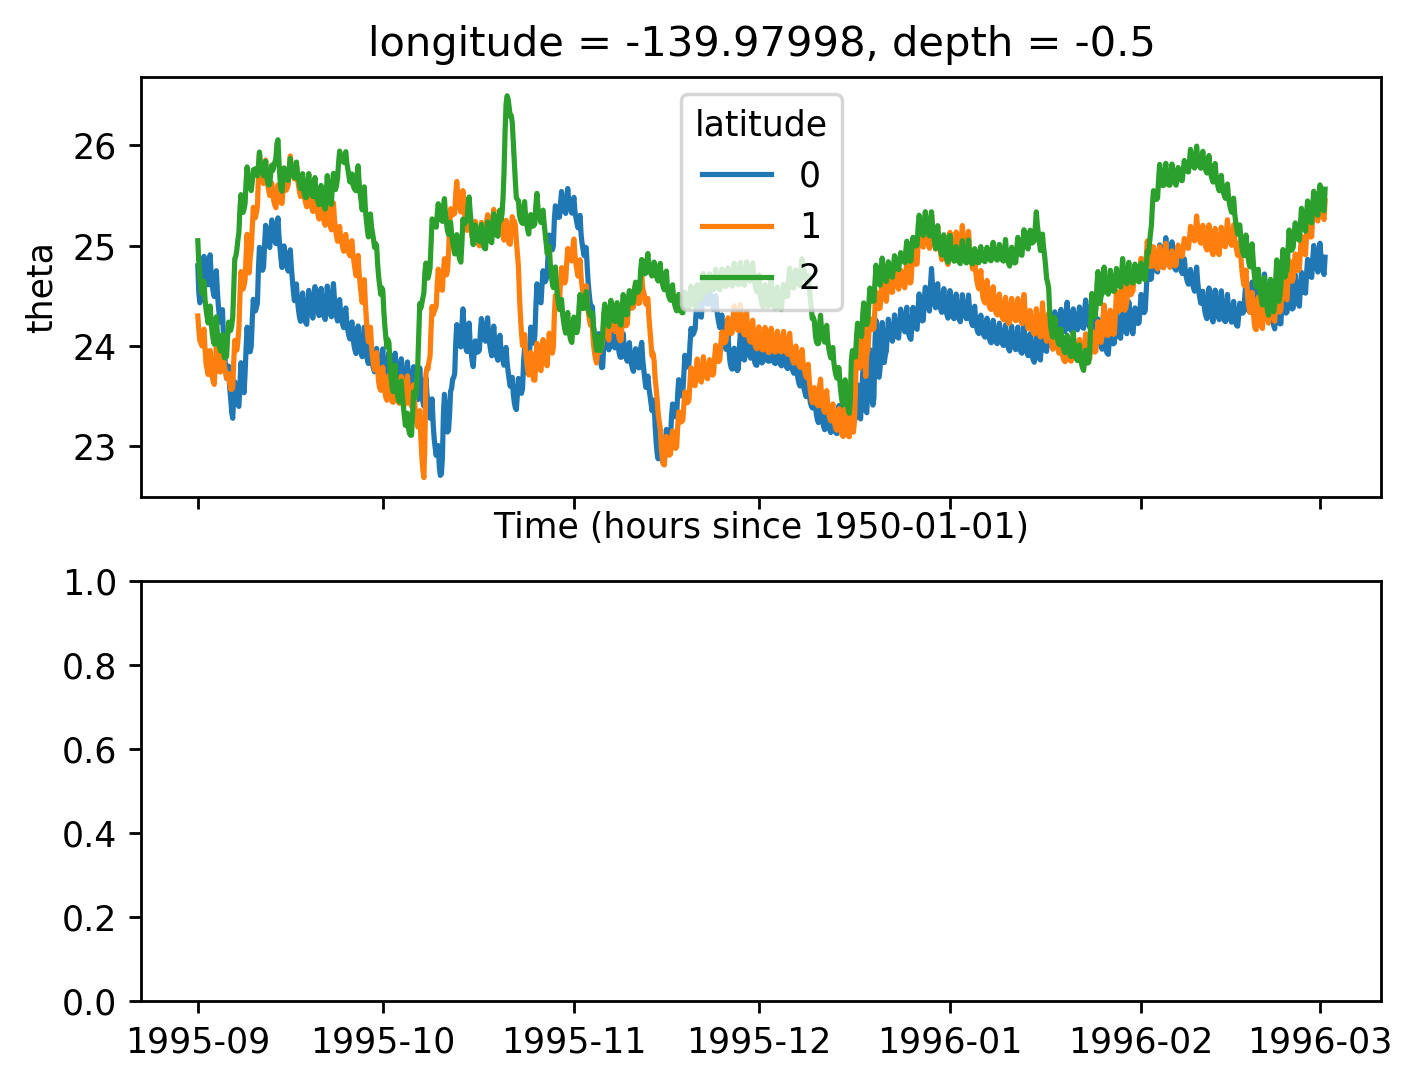
surf140.coords.to_dataset().drop("time")
<xarray.Dataset>
Dimensions: (latitude: 480)
Coordinates:
depth float32 ...
* latitude (latitude) float32 -12.0 -11.949896 -11.899791 ... 11.949896 12.0
longitude float32 -139.97998
Data variables:
*empty*
Attributes:
title: daily snapshot from 1/20 degree Equatorial Pacific MI...
easting: longitude
northing: latitude
field_julian_date: 400296
julian_day_unit: days since 1950-01-01 00:00:00
(surf140.v * (surf140.theta - surf140.theta.mean("time"))).sel(
latitude=0, method="nearest"
).plot(x="time")
(surf140.v.sel(latitude=0, method="nearest")).plot()
---------------------------------------------------------------------------
NameError Traceback (most recent call last)
<ipython-input-25-5ec3b8e7eacd> in <module>
----> 1 (surf140.v * (surf140.theta - surf140.theta.mean("time"))).sel(latitude=0, method="nearest").plot(x="time")
2 (surf140.v.sel(latitude=0, method="nearest")).plot()
NameError: name 'surf140' is not defined