Reduced Shear Evolution equation#
\begin{equation} \frac{D}{Dt} Sh^2_{red} = u_z^2v_y +v_z^2u_x - (u_y + v_x)u_zv_z + u_z F_z^x + v_z F_z^y + \left(\frac{1}{2Ri_c - 1}\right) (u_zb_x + v_zb_y) + \frac{1}{2Ri_c} w_zb_z + \frac{1}{2Ri_c}∂_{zz}Kb_z \end{equation}
# %load_ext %autoreload
%load_ext watermark
%autoreload 1

%matplotlib inline
%config InlineBackend.figure_format="retina"

import cf_xarray
import dask
import dcpy
import distributed
import holoviews as hv
import hvplot.xarray
import matplotlib as mpl
import matplotlib.dates as mdates
import matplotlib.pyplot as plt
import matplotlib.units as munits
import numpy as np
import pandas as pd
import panel.widgets as pnw
import seawater as sw
import xarray as xr
import xgcm
from holoviews import opts

%aimport pump


mpl.rcParams["figure.dpi"] = 140
mpl.rcParams["savefig.dpi"] = 300
mpl.rcParams["savefig.bbox"] = "tight"

munits.registry[np.datetime64] = mdates.ConciseDateConverter()

xr.set_options(keep_attrs=True)


hv.extension("bokeh")
# hv.opts.defaults(opts.Image(fontscale=1.5), opts.Curve(fontscale=1.5))


%watermark -iv


xr.DataArray([1.0])


panel      : 0.12.0
seawater   : 3.3.4
dask       : 2021.7.2
cf_xarray  : 0.6.0
dcpy       : 0.1
xgcm       : 0.5.1.dev138+g3b80993
distributed: 2021.7.2
hvplot     : 0.7.3
xarray     : 0.19.0
pump       : 0.1
matplotlib : 3.4.2
pandas     : 1.3.1
holoviews  : 1.14.5
numpy      : 1.21.1
<xarray.DataArray (dim_0: 1)>
array([1.])
Dimensions without coordinates: dim_0
xarray.DataArray
- dim_0: 1
- 1.0
array([1.])
import dask_jobqueue

if "client" in locals():
    client.close()
# if "cluster" in locals():
#    cluster.close()

env = {"OMP_NUM_THREADS": "1", "NUMBA_NUM_THREADS": "1", "OPENBLAS_NUM_THREADS": "1"}

# cluster = distributed.LocalCluster(
#    n_workers=8,
#    threads_per_worker=1,
#    env=env
# )

if "cluster" in locals():
    del cluster

# cluster = ncar_jobqueue.NCARCluster(
#    account="NCGD0011",
#    scheduler_options=dict(dashboard_address=":9797"),
#    env_extra=env,
# )
cluster = dask_jobqueue.PBSCluster(
    cores=1,  # The number of cores you want
    memory="23GB",  # Amount of memory
    processes=1,  # How many processes
    queue="casper",  # The type of queue to utilize (/glade/u/apps/dav/opt/usr/bin/execcasper)
    local_directory="$TMPDIR",  # Use your local directory
    resource_spec="select=1:ncpus=1:mem=23GB",  # Specify resources
    project="ncgd0011",  # Input your project ID here
    walltime="02:00:00",  # Amount of wall time
    interface="ib0",  # Interface to use
)
cluster.scale(6)
/glade/u/home/dcherian/miniconda3/envs/dcpy/lib/python3.8/site-packages/distributed/node.py:160: UserWarning: Port 8787 is already in use.
Perhaps you already have a cluster running?
Hosting the HTTP server on port 46575 instead
  warnings.warn(
client = distributed.Client(cluster)
client
Client
Client-ab60f98f-2082-11ec-920c-3cecef1acbfa
| Connection method: Cluster object | Cluster type: PBSCluster |
| Dashboard: /proxy/46575/status |
Cluster Info
PBSCluster
ee763c47
| Dashboard: /proxy/46575/status | Workers: 0 |
| Total threads: 0 | Total memory: 0 B |
Scheduler Info
Scheduler
Scheduler-94c79975-9265-42e3-b551-62fb27415968
| Comm: tcp://10.12.206.63:45958 | Workers: 0 |
| Dashboard: /proxy/46575/status | Total threads: 0 |
| Started: Just now | Total memory: 0 B |
Workers
Stations#
gcmdir = "/glade/campaign/cgd/oce/people/bachman/TPOS_1_20_20_year/OUTPUT/"  # MITgcm output directory
stationdirname = gcmdir

metrics = pump.model.read_metrics(stationdirname)
stations = pump.model.read_stations_20(stationdirname)
enso = pump.obs.make_enso_mask()
stations["enso"] = enso.reindex(time=stations.time.data, method="nearest")
%aimport pump.model
pump.model.rename_metrics(metrics)
<xarray.Dataset>
Dimensions:  (RC: 185, YC: 480, XC: 1500, XG: 1500, YG: 480, RF: 186)
Coordinates:
  * RF       (RF) float64 dask.array<chunksize=(186,), meta=np.ndarray>
Dimensions without coordinates: RC, YC, XC, XG, YG
Data variables: (12/13)
    hFacC    (RC, YC, XC) float64 dask.array<chunksize=(185, 480, 1500), meta=np.ndarray>
    RAC      (YC, XC) float64 dask.array<chunksize=(480, 1500), meta=np.ndarray>
    DXC      (YC, XG) float64 dask.array<chunksize=(480, 1500), meta=np.ndarray>
    DYC      (YG, XC) float64 dask.array<chunksize=(480, 1500), meta=np.ndarray>
    cellvol  (YC, XC, RC) float64 dask.array<chunksize=(480, 1500, 185), meta=np.ndarray>
    rAw      (YC, XG) float32 dask.array<chunksize=(480, 1500), meta=np.ndarray>
    ...       ...
    hFacS    (RC, YG, XC) float32 dask.array<chunksize=(185, 480, 1500), meta=np.ndarray>
    drF      (RC) float32 dask.array<chunksize=(185,), meta=np.ndarray>
    drC      (RF) float32 dask.array<chunksize=(186,), meta=np.ndarray>
    rAs      (YG, XC) float32 dask.array<chunksize=(480, 1500), meta=np.ndarray>
    DXG      (YG, XC) float32 dask.array<chunksize=(480, 1500), meta=np.ndarray>
    DYG      (YC, XG) float32 dask.array<chunksize=(480, 1500), meta=np.ndarray>
Attributes:
    long_name:  cell_height
    units:      m
xarray.Dataset
- RC: 185
- YC: 480
- XC: 1500
- XG: 1500
- YG: 480
- RF: 186
- RF(RF)float64dask.array<chunksize=(186,), meta=np.ndarray>
Array Chunk Bytes 1.45 kiB 1.45 kiB Shape (186,) (186,) Count 5 Tasks 1 Chunks Type float64 numpy.ndarray
- hFacC(RC, YC, XC)float64dask.array<chunksize=(185, 480, 1500), meta=np.ndarray>
Array Chunk Bytes 0.99 GiB 0.99 GiB Shape (185, 480, 1500) (185, 480, 1500) Count 4 Tasks 1 Chunks Type float64 numpy.ndarray - RAC(YC, XC)float64dask.array<chunksize=(480, 1500), meta=np.ndarray>
Array Chunk Bytes 5.49 MiB 5.49 MiB Shape (480, 1500) (480, 1500) Count 5 Tasks 1 Chunks Type float64 numpy.ndarray - DXC(YC, XG)float64dask.array<chunksize=(480, 1500), meta=np.ndarray>
Array Chunk Bytes 5.49 MiB 5.49 MiB Shape (480, 1500) (480, 1500) Count 5 Tasks 1 Chunks Type float64 numpy.ndarray - DYC(YG, XC)float64dask.array<chunksize=(480, 1500), meta=np.ndarray>
Array Chunk Bytes 5.49 MiB 5.49 MiB Shape (480, 1500) (480, 1500) Count 5 Tasks 1 Chunks Type float64 numpy.ndarray - cellvol(YC, XC, RC)float64dask.array<chunksize=(480, 1500, 185), meta=np.ndarray>
Array Chunk Bytes 0.99 GiB 0.99 GiB Shape (480, 1500, 185) (480, 1500, 185) Count 26 Tasks 1 Chunks Type float64 numpy.ndarray - rAw(YC, XG)float32dask.array<chunksize=(480, 1500), meta=np.ndarray>
Array Chunk Bytes 2.75 MiB 2.75 MiB Shape (480, 1500) (480, 1500) Count 4 Tasks 1 Chunks Type float32 numpy.ndarray - hFacW(RC, YC, XG)float32dask.array<chunksize=(185, 480, 1500), meta=np.ndarray>
Array Chunk Bytes 508.12 MiB 508.12 MiB Shape (185, 480, 1500) (185, 480, 1500) Count 5 Tasks 1 Chunks Type float32 numpy.ndarray - hFacS(RC, YG, XC)float32dask.array<chunksize=(185, 480, 1500), meta=np.ndarray>
Array Chunk Bytes 508.12 MiB 508.12 MiB Shape (185, 480, 1500) (185, 480, 1500) Count 3 Tasks 1 Chunks Type float32 numpy.ndarray - drF(RC)float32dask.array<chunksize=(185,), meta=np.ndarray>
Array Chunk Bytes 740 B 740 B Shape (185,) (185,) Count 4 Tasks 1 Chunks Type float32 numpy.ndarray - drC(RF)float32dask.array<chunksize=(186,), meta=np.ndarray>
Array Chunk Bytes 744 B 744 B Shape (186,) (186,) Count 4 Tasks 1 Chunks Type float32 numpy.ndarray - rAs(YG, XC)float32dask.array<chunksize=(480, 1500), meta=np.ndarray>
Array Chunk Bytes 2.75 MiB 2.75 MiB Shape (480, 1500) (480, 1500) Count 4 Tasks 1 Chunks Type float32 numpy.ndarray - DXG(YG, XC)float32dask.array<chunksize=(480, 1500), meta=np.ndarray>
Array Chunk Bytes 2.75 MiB 2.75 MiB Shape (480, 1500) (480, 1500) Count 4 Tasks 1 Chunks Type float32 numpy.ndarray - DYG(YC, XG)float32dask.array<chunksize=(480, 1500), meta=np.ndarray>
Array Chunk Bytes 2.75 MiB 2.75 MiB Shape (480, 1500) (480, 1500) Count 4 Tasks 1 Chunks Type float32 numpy.ndarray
- long_name :
- cell_height
- units :
- m
metrics = metrics.reindex_like(moor, method="nearest").load()
metrics
<xarray.Dataset>
Dimensions:    (depth: 185, latitude: 37, longitude: 4, depth_left: 186, RF: 186)
Coordinates:
  * depth      (depth) float64 -1.25 -3.75 -6.25 ... -5.658e+03 -5.758e+03
  * latitude   (latitude) float64 -3.025 -2.775 -2.525 ... 5.475 5.725 5.975
  * longitude  (longitude) float64 -155.0 -140.0 -125.0 -110.0
    RF         (depth_left) float64 0.0 -2.5 -5.0 ... -5.708e+03 -5.808e+03
Dimensions without coordinates: depth_left
Data variables: (12/14)
    dRF        (depth) float64 -2.5 -2.5 -2.5 -2.5 ... -100.0 -100.0 -100.0
    hFacC      (depth, latitude, longitude) float64 1.0 1.0 1.0 ... 0.0 0.0 0.0
    RAC        (latitude, longitude) float64 3.086e+07 3.086e+07 ... 3.073e+07
    DXC        (latitude, longitude) float64 5.551e+03 5.551e+03 ... 5.529e+03
    DYC        (latitude, longitude) float64 5.559e+03 5.559e+03 ... 5.559e+03
    cellvol    (latitude, longitude, depth) float64 7.715e+07 7.715e+07 ... nan
    ...         ...
    hFacS      (depth, latitude, longitude) float32 1.0 1.0 1.0 ... 0.0 0.0 0.0
    drF        (depth) float32 2.5 2.5 2.5 2.5 2.5 ... 100.0 100.0 100.0 100.0
    drC        (RF) float32 1.25 2.5 2.5 2.5 2.5 ... 100.0 100.0 100.0 50.0
    rAs        (latitude, longitude) float32 3.086e+07 3.086e+07 ... 3.073e+07
    DXG        (latitude, longitude) float32 5.551e+03 5.551e+03 ... 5.529e+03
    DYG        (latitude, longitude) float32 5.559e+03 5.559e+03 ... 5.559e+03
Attributes:
    long_name:  cell_height
    units:      m
xarray.Dataset
- depth: 185
- latitude: 37
- longitude: 4
- depth_left: 186
- RF: 186
- depth(depth)float64-1.25 -3.75 ... -5.758e+03
array([-1.250000e+00, -3.750000e+00, -6.250000e+00, -8.750000e+00, -1.125000e+01, -1.375000e+01, -1.625000e+01, -1.875000e+01, -2.125000e+01, -2.375000e+01, -2.625000e+01, -2.875000e+01, -3.125000e+01, -3.375000e+01, -3.625000e+01, -3.875000e+01, -4.125000e+01, -4.375000e+01, -4.625000e+01, -4.875000e+01, -5.125000e+01, -5.375000e+01, -5.625000e+01, -5.875000e+01, -6.125000e+01, -6.375000e+01, -6.625000e+01, -6.875000e+01, -7.125000e+01, -7.375000e+01, -7.625000e+01, -7.875000e+01, -8.125000e+01, -8.375000e+01, -8.625000e+01, -8.875000e+01, -9.125000e+01, -9.375000e+01, -9.625000e+01, -9.875000e+01, -1.012500e+02, -1.037500e+02, -1.062500e+02, -1.087500e+02, -1.112500e+02, -1.137500e+02, -1.162500e+02, -1.187500e+02, -1.212500e+02, -1.237500e+02, -1.262500e+02, -1.287500e+02, -1.312500e+02, -1.337500e+02, -1.362500e+02, -1.387500e+02, -1.412500e+02, -1.437500e+02, -1.462500e+02, -1.487500e+02, -1.512500e+02, -1.537500e+02, -1.562500e+02, -1.587500e+02, -1.612500e+02, -1.637500e+02, -1.662500e+02, -1.687500e+02, -1.712500e+02, -1.737500e+02, -1.762500e+02, -1.787500e+02, -1.812500e+02, -1.837500e+02, -1.862500e+02, -1.887500e+02, -1.912500e+02, -1.937500e+02, -1.962500e+02, -1.987500e+02, -2.012500e+02, -2.037500e+02, -2.062500e+02, -2.087500e+02, -2.112500e+02, -2.137500e+02, -2.162500e+02, -2.187500e+02, -2.212500e+02, -2.237500e+02, -2.262500e+02, -2.287500e+02, -2.312500e+02, -2.337500e+02, -2.362500e+02, -2.387500e+02, -2.412500e+02, -2.437500e+02, -2.462500e+02, -2.487500e+02, -2.513687e+02, -2.542363e+02, -2.573763e+02, -2.608145e+02, -2.645794e+02, -2.687019e+02, -2.732162e+02, -2.781592e+02, -2.835718e+02, -2.894987e+02, -2.959886e+02, -3.030949e+02, -3.108764e+02, -3.193972e+02, -3.287274e+02, -3.389439e+02, -3.501312e+02, -3.623811e+02, -3.757947e+02, -3.904827e+02, -4.065660e+02, -4.241773e+02, -4.434617e+02, -4.645781e+02, -4.877004e+02, -5.130195e+02, -5.407438e+02, -5.711019e+02, -6.043441e+02, -6.407443e+02, -6.806025e+02, -7.242472e+02, -7.720381e+02, -8.243693e+02, -8.816718e+02, -9.444181e+02, -1.013125e+03, -1.088360e+03, -1.170741e+03, -1.260949e+03, -1.358099e+03, -1.458099e+03, -1.558099e+03, -1.658099e+03, -1.758099e+03, -1.858099e+03, -1.958099e+03, -2.058098e+03, -2.158098e+03, -2.258098e+03, -2.358098e+03, -2.458098e+03, -2.558098e+03, -2.658098e+03, -2.758098e+03, -2.858098e+03, -2.958098e+03, -3.058098e+03, -3.158098e+03, -3.258098e+03, -3.358098e+03, -3.458098e+03, -3.558098e+03, -3.658098e+03, -3.758098e+03, -3.858098e+03, -3.958098e+03, -4.058098e+03, -4.158099e+03, -4.258099e+03, -4.358099e+03, -4.458099e+03, -4.558099e+03, -4.658099e+03, -4.758099e+03, -4.858099e+03, -4.958099e+03, -5.058099e+03, -5.158099e+03, -5.258099e+03, -5.358099e+03, -5.458099e+03, -5.558099e+03, -5.658099e+03, -5.758099e+03]) - latitude(latitude)float64-3.025 -2.775 ... 5.725 5.975
array([-3.025, -2.775, -2.525, -2.275, -2.025, -1.775, -1.525, -1.275, -1.025, -0.775, -0.525, -0.275, -0.025, 0.225, 0.475, 0.725, 0.975, 1.225, 1.475, 1.725, 1.975, 2.225, 2.475, 2.725, 2.975, 3.225, 3.475, 3.725, 3.975, 4.225, 4.475, 4.725, 4.975, 5.225, 5.475, 5.725, 5.975]) - longitude(longitude)float64-155.0 -140.0 -125.0 -110.0
array([-155.024994, -140.024994, -125.025002, -110.025002])
- RF(depth_left)float640.0 -2.5 ... -5.708e+03 -5.808e+03
array([ 0.00000000e+00, -2.50000000e+00, -5.00000000e+00, -7.50000000e+00,
       -1.00000000e+01, -1.25000000e+01, -1.50000000e+01, -1.75000000e+01,
       -2.00000000e+01, -2.25000000e+01, -2.50000000e+01, -2.75000000e+01,
       -3.00000000e+01, -3.25000000e+01, -3.50000000e+01, -3.75000000e+01,
       -4.00000000e+01, -4.25000000e+01, -4.50000000e+01, -4.75000000e+01,
       -5.00000000e+01, -5.25000000e+01, -5.50000000e+01, -5.75000000e+01,
       -6.00000000e+01, -6.25000000e+01, -6.50000000e+01, -6.75000000e+01,
       -7.00000000e+01, -7.25000000e+01, -7.50000000e+01, -7.75000000e+01,
       -8.00000000e+01, -8.25000000e+01, -8.50000000e+01, -8.75000000e+01,
       -9.00000000e+01, -9.25000000e+01, -9.50000000e+01, -9.75000000e+01,
       -1.00000000e+02, -1.02500000e+02, -1.05000000e+02, -1.07500000e+02,
       -1.10000000e+02, -1.12500000e+02, -1.15000000e+02, -1.17500000e+02,
       -1.20000000e+02, -1.22500000e+02, -1.25000000e+02, -1.27500000e+02,
       -1.30000000e+02, -1.32500000e+02, -1.35000000e+02, -1.37500000e+02,
       -1.40000000e+02, -1.42500000e+02, -1.45000000e+02, -1.47500000e+02,
       -1.50000000e+02, -1.52500000e+02, -1.55000000e+02, -1.57500000e+02,
       -1.60000000e+02, -1.62500000e+02, -1.65000000e+02, -1.67500000e+02,
       -1.70000000e+02, -1.72500000e+02, -1.75000000e+02, -1.77500000e+02,
       -1.80000000e+02, -1.82500000e+02, -1.85000000e+02, -1.87500000e+02,
       -1.90000000e+02, -1.92500000e+02, -1.95000000e+02, -1.97500000e+02,
...
       -2.80742798e+02, -2.86400909e+02, -2.92596497e+02, -2.99380615e+02,
       -3.06809204e+02, -3.14943604e+02, -3.23850708e+02, -3.33604004e+02,
       -3.44283905e+02, -3.55978394e+02, -3.68783813e+02, -3.82805695e+02,
       -3.98159698e+02, -4.14972412e+02, -4.33382294e+02, -4.53541107e+02,
       -4.75614990e+02, -4.99785889e+02, -5.26252991e+02, -5.55234497e+02,
       -5.86969299e+02, -6.21718872e+02, -6.59769714e+02, -7.01435303e+02,
       -7.47059082e+02, -7.97017212e+02, -8.51721313e+02, -9.11622314e+02,
       -9.77213928e+02, -1.04903674e+03, -1.12768274e+03, -1.21380005e+03,
       -1.30809851e+03, -1.40809851e+03, -1.50809851e+03, -1.60809851e+03,
       -1.70809851e+03, -1.80809851e+03, -1.90809851e+03, -2.00809851e+03,
       -2.10809839e+03, -2.20809839e+03, -2.30809839e+03, -2.40809839e+03,
       -2.50809839e+03, -2.60809839e+03, -2.70809839e+03, -2.80809839e+03,
       -2.90809839e+03, -3.00809839e+03, -3.10809839e+03, -3.20809839e+03,
       -3.30809839e+03, -3.40809839e+03, -3.50809839e+03, -3.60809839e+03,
       -3.70809839e+03, -3.80809839e+03, -3.90809839e+03, -4.00809839e+03,
       -4.10809863e+03, -4.20809863e+03, -4.30809863e+03, -4.40809863e+03,
       -4.50809863e+03, -4.60809863e+03, -4.70809863e+03, -4.80809863e+03,
       -4.90809863e+03, -5.00809863e+03, -5.10809863e+03, -5.20809863e+03,
       -5.30809863e+03, -5.40809863e+03, -5.50809863e+03, -5.60809863e+03,
       -5.70809863e+03, -5.80809863e+03])
- dRF(depth)float64-2.5 -2.5 -2.5 ... -100.0 -100.0
- long_name :
- cell_height
- units :
- m
array([ -2.5 , -2.5 , -2.5 , -2.5 , -2.5 , -2.5 , -2.5 , -2.5 , -2.5 , -2.5 , -2.5 , -2.5 , -2.5 , -2.5 , -2.5 , -2.5 , -2.5 , -2.5 , -2.5 , -2.5 , -2.5 , -2.5 , -2.5 , -2.5 , -2.5 , -2.5 , -2.5 , -2.5 , -2.5 , -2.5 , -2.5 , -2.5 , -2.5 , -2.5 , -2.5 , -2.5 , -2.5 , -2.5 , -2.5 , -2.5 , -2.5 , -2.5 , -2.5 , -2.5 , -2.5 , -2.5 , -2.5 , -2.5 , -2.5 , -2.5 , -2.5 , -2.5 , -2.5 , -2.5 , -2.5 , -2.5 , -2.5 , -2.5 , -2.5 , -2.5 , -2.5 , -2.5 , -2.5 , -2.5 , -2.5 , -2.5 , -2.5 , -2.5 , -2.5 , -2.5 , -2.5 , -2.5 , -2.5 , -2.5 , -2.5 , -2.5 , -2.5 , -2.5 , -2.5 , -2.5 , ... -5.65811157, -6.19558716, -6.78411865, -7.42858887, -8.13439941, -8.90710449, -9.7532959 , -10.67990112, -11.69448853, -12.80541992, -14.0218811 , -15.35400391, -16.81271362, -18.40988159, -20.15881348, -22.07388306, -24.17089844, -26.46710205, -28.98150635, -31.73480225, -34.74957275, -38.05084229, -41.66558838, -45.6237793 , -49.95812988, -54.70410156, -59.90100098, -65.59161377, -71.82281494, -78.64599609, -86.11730957, -94.29846191, -100. , -100. , -100. , -100. , -100. , -100. , -100. , -99.99987793, -100. , -100. , -100. , -100. , -100. , -100. , -100. , -100. , -100. , -100. , -100. , -100. , -100. , -100. , -100. , -100. , -100. , -100. , -100. , -100.00024414, -100. , -100. , -100. , -100. , -100. , -100. , -100. , -100. , -100. , -100. , -100. , -100. , -100. , -100. , -100. , -100. , -100. ]) - hFacC(depth, latitude, longitude)float641.0 1.0 1.0 1.0 ... 0.0 0.0 0.0 0.0
array([[[1. , 1. , 1. , 1. ], [1. , 1. , 1. , 1. ], [1. , 1. , 1. , 1. ], ..., [1. , 1. , 1. , 1. ], [1. , 1. , 1. , 1. ], [1. , 1. , 1. , 1. ]], [[1. , 1. , 1. , 1. ], [1. , 1. , 1. , 1. ], [1. , 1. , 1. , 1. ], ..., [1. , 1. , 1. , 1. ], [1. , 1. , 1. , 1. ], [1. , 1. , 1. , 1. ]], [[1. , 1. , 1. , 1. ], [1. , 1. , 1. , 1. ], [1. , 1. , 1. , 1. ], ..., ... ..., [1. , 1. , 1. , 1. ], [0.5290724, 0.5290724, 0.5290724, 0.5290724], [0. , 0. , 0. , 0. ]], [[0. , 0. , 0. , 0. ], [0. , 0. , 0. , 0. ], [0. , 0. , 0. , 0. ], ..., [1. , 1. , 1. , 1. ], [0. , 0. , 0. , 0. ], [0. , 0. , 0. , 0. ]], [[0. , 0. , 0. , 0. ], [0. , 0. , 0. , 0. ], [0. , 0. , 0. , 0. ], ..., [1. , 1. , 1. , 1. ], [0. , 0. , 0. , 0. ], [0. , 0. , 0. , 0. ]]]) - RAC(latitude, longitude)float643.086e+07 3.086e+07 ... 3.073e+07
array([[30858018., 30858018., 30858018., 30858018.], [30864840., 30864840., 30864840., 30864840.], [30871074., 30871074., 30871074., 30871074.], [30876720., 30876720., 30876720., 30876720.], [30881778., 30881778., 30881778., 30881778.], [30886248., 30886248., 30886248., 30886248.], [30890130., 30890130., 30890130., 30890130.], [30893424., 30893424., 30893424., 30893424.], [30896130., 30896130., 30896130., 30896130.], [30898248., 30898248., 30898248., 30898248.], [30899778., 30899778., 30899778., 30899778.], [30900720., 30900720., 30900720., 30900720.], [30901072., 30901072., 30901072., 30901072.], [30900838., 30900838., 30900838., 30900838.], [30900014., 30900014., 30900014., 30900014.], [30898602., 30898602., 30898602., 30898602.], [30896602., 30896602., 30896602., 30896602.], [30894014., 30894014., 30894014., 30894014.], [30890836., 30890836., 30890836., 30890836.], [30887072., 30887072., 30887072., 30887072.], [30882718., 30882718., 30882718., 30882718.], [30877778., 30877778., 30877778., 30877778.], [30872250., 30872250., 30872250., 30872250.], [30866134., 30866134., 30866134., 30866134.], [30859430., 30859430., 30859430., 30859430.], [30852138., 30852138., 30852138., 30852138.], [30844258., 30844258., 30844258., 30844258.], [30835792., 30835792., 30835792., 30835792.], [30826740., 30826740., 30826740., 30826740.], [30817100., 30817100., 30817100., 30817100.], [30806872., 30806872., 30806872., 30806872.], [30796060., 30796060., 30796060., 30796060.], [30784660., 30784660., 30784660., 30784660.], [30772674., 30772674., 30772674., 30772674.], [30760102., 30760102., 30760102., 30760102.], [30746946., 30746946., 30746946., 30746946.], [30733202., 30733202., 30733202., 30733202.]]) - DXC(latitude, longitude)float645.551e+03 5.551e+03 ... 5.529e+03
array([[5551.12792969, 5551.12792969, 5551.12792969, 5551.12792969], [5552.35498047, 5552.35498047, 5552.35498047, 5552.35498047], [5553.4765625 , 5553.4765625 , 5553.4765625 , 5553.4765625 ], [5554.4921875 , 5554.4921875 , 5554.4921875 , 5554.4921875 ], [5555.40234375, 5555.40234375, 5555.40234375, 5555.40234375], [5556.20654297, 5556.20654297, 5556.20654297, 5556.20654297], [5556.90478516, 5556.90478516, 5556.90478516, 5556.90478516], [5557.49755859, 5557.49755859, 5557.49755859, 5557.49755859], [5557.984375 , 5557.984375 , 5557.984375 , 5557.984375 ], [5558.36523438, 5558.36523438, 5558.36523438, 5558.36523438], [5558.64013672, 5558.64013672, 5558.64013672, 5558.64013672], [5558.80957031, 5558.80957031, 5558.80957031, 5558.80957031], [5558.87304688, 5558.87304688, 5558.87304688, 5558.87304688], [5558.83056641, 5558.83056641, 5558.83056641, 5558.83056641], [5558.68261719, 5558.68261719, 5558.68261719, 5558.68261719], [5558.42871094, 5558.42871094, 5558.42871094, 5558.42871094], [5558.06884766, 5558.06884766, 5558.06884766, 5558.06884766], [5557.60302734, 5557.60302734, 5557.60302734, 5557.60302734], [5557.03173828, 5557.03173828, 5557.03173828, 5557.03173828], [5556.35449219, 5556.35449219, 5556.35449219, 5556.35449219], [5555.57128906, 5555.57128906, 5555.57128906, 5555.57128906], [5554.68261719, 5554.68261719, 5554.68261719, 5554.68261719], [5553.68798828, 5553.68798828, 5553.68798828, 5553.68798828], [5552.58789062, 5552.58789062, 5552.58789062, 5552.58789062], [5551.38183594, 5551.38183594, 5551.38183594, 5551.38183594], [5550.0703125 , 5550.0703125 , 5550.0703125 , 5550.0703125 ], [5548.65283203, 5548.65283203, 5548.65283203, 5548.65283203], [5547.12988281, 5547.12988281, 5547.12988281, 5547.12988281], [5545.50097656, 5545.50097656, 5545.50097656, 5545.50097656], [5543.76708984, 5543.76708984, 5543.76708984, 5543.76708984], [5541.92724609, 5541.92724609, 5541.92724609, 5541.92724609], [5539.98193359, 5539.98193359, 5539.98193359, 5539.98193359], [5537.93115234, 5537.93115234, 5537.93115234, 5537.93115234], [5535.77539062, 5535.77539062, 5535.77539062, 5535.77539062], [5533.51367188, 5533.51367188, 5533.51367188, 5533.51367188], [5531.14697266, 5531.14697266, 5531.14697266, 5531.14697266], [5528.67480469, 5528.67480469, 5528.67480469, 5528.67480469]]) - DYC(latitude, longitude)float645.559e+03 5.559e+03 ... 5.559e+03
array([[5558.87353516, 5558.87353516, 5558.87353516, 5558.87353516], [5558.87353516, 5558.87353516, 5558.87353516, 5558.87353516], [5558.87353516, 5558.87353516, 5558.87353516, 5558.87353516], [5558.87353516, 5558.87353516, 5558.87353516, 5558.87353516], [5558.87353516, 5558.87353516, 5558.87353516, 5558.87353516], [5558.87353516, 5558.87353516, 5558.87353516, 5558.87353516], [5558.87353516, 5558.87353516, 5558.87353516, 5558.87353516], [5558.87353516, 5558.87353516, 5558.87353516, 5558.87353516], [5558.87353516, 5558.87353516, 5558.87353516, 5558.87353516], [5558.87353516, 5558.87353516, 5558.87353516, 5558.87353516], [5558.87353516, 5558.87353516, 5558.87353516, 5558.87353516], [5558.87353516, 5558.87353516, 5558.87353516, 5558.87353516], [5558.87353516, 5558.87353516, 5558.87353516, 5558.87353516], [5558.87353516, 5558.87353516, 5558.87353516, 5558.87353516], [5558.87353516, 5558.87353516, 5558.87353516, 5558.87353516], [5558.87353516, 5558.87353516, 5558.87353516, 5558.87353516], [5558.87353516, 5558.87353516, 5558.87353516, 5558.87353516], [5558.87353516, 5558.87353516, 5558.87353516, 5558.87353516], [5558.87353516, 5558.87353516, 5558.87353516, 5558.87353516], [5558.87353516, 5558.87353516, 5558.87353516, 5558.87353516], [5558.87353516, 5558.87353516, 5558.87353516, 5558.87353516], [5558.87353516, 5558.87353516, 5558.87353516, 5558.87353516], [5558.87353516, 5558.87353516, 5558.87353516, 5558.87353516], [5558.87353516, 5558.87353516, 5558.87353516, 5558.87353516], [5558.87353516, 5558.87353516, 5558.87353516, 5558.87353516], [5558.87353516, 5558.87353516, 5558.87353516, 5558.87353516], [5558.87353516, 5558.87353516, 5558.87353516, 5558.87353516], [5558.87353516, 5558.87353516, 5558.87353516, 5558.87353516], [5558.87353516, 5558.87353516, 5558.87353516, 5558.87353516], [5558.87353516, 5558.87353516, 5558.87353516, 5558.87353516], [5558.87353516, 5558.87353516, 5558.87353516, 5558.87353516], [5558.87353516, 5558.87353516, 5558.87353516, 5558.87353516], [5558.87353516, 5558.87353516, 5558.87353516, 5558.87353516], [5558.87353516, 5558.87353516, 5558.87353516, 5558.87353516], [5558.87353516, 5558.87353516, 5558.87353516, 5558.87353516], [5558.87353516, 5558.87353516, 5558.87353516, 5558.87353516], [5558.87353516, 5558.87353516, 5558.87353516, 5558.87353516]]) - cellvol(latitude, longitude, depth)float647.715e+07 7.715e+07 ... nan nan
array([[[7.71450450e+07, 7.71450450e+07, 7.71450450e+07, ..., nan, nan, nan], [7.71450450e+07, 7.71450450e+07, 7.71450450e+07, ..., nan, nan, nan], [7.71450450e+07, 7.71450450e+07, 7.71450450e+07, ..., nan, nan, nan], [7.71450450e+07, 7.71450450e+07, 7.71450450e+07, ..., nan, nan, nan]], [[7.71621000e+07, 7.71621000e+07, 7.71621000e+07, ..., nan, nan, nan], [7.71621000e+07, 7.71621000e+07, 7.71621000e+07, ..., nan, nan, nan], [7.71621000e+07, 7.71621000e+07, 7.71621000e+07, ..., nan, nan, nan], [7.71621000e+07, 7.71621000e+07, 7.71621000e+07, ..., nan, nan, nan]], [[7.71776850e+07, 7.71776850e+07, 7.71776850e+07, ..., nan, nan, nan], ... [7.69002550e+07, 7.69002550e+07, 7.69002550e+07, ..., 3.07601020e+09, 3.07601020e+09, 3.07601020e+09]], [[7.68673650e+07, 7.68673650e+07, 7.68673650e+07, ..., 1.62673606e+09, nan, nan], [7.68673650e+07, 7.68673650e+07, 7.68673650e+07, ..., 1.62673606e+09, nan, nan], [7.68673650e+07, 7.68673650e+07, 7.68673650e+07, ..., 1.62673606e+09, nan, nan], [7.68673650e+07, 7.68673650e+07, 7.68673650e+07, ..., 1.62673606e+09, nan, nan]], [[7.68330050e+07, 7.68330050e+07, 7.68330050e+07, ..., nan, nan, nan], [7.68330050e+07, 7.68330050e+07, 7.68330050e+07, ..., nan, nan, nan], [7.68330050e+07, 7.68330050e+07, 7.68330050e+07, ..., nan, nan, nan], [7.68330050e+07, 7.68330050e+07, 7.68330050e+07, ..., nan, nan, nan]]]) - rAw(latitude, longitude)float323.086e+07 3.086e+07 ... 3.073e+07
array([[30858018., 30858018., 30858018., 30858018.], [30864840., 30864840., 30864840., 30864840.], [30871074., 30871074., 30871074., 30871074.], [30876720., 30876720., 30876720., 30876720.], [30881778., 30881778., 30881778., 30881778.], [30886248., 30886248., 30886248., 30886248.], [30890130., 30890130., 30890130., 30890130.], [30893424., 30893424., 30893424., 30893424.], [30896130., 30896130., 30896130., 30896130.], [30898248., 30898248., 30898248., 30898248.], [30899778., 30899778., 30899778., 30899778.], [30900720., 30900720., 30900720., 30900720.], [30901072., 30901072., 30901072., 30901072.], [30900838., 30900838., 30900838., 30900838.], [30900014., 30900014., 30900014., 30900014.], [30898602., 30898602., 30898602., 30898602.], [30896602., 30896602., 30896602., 30896602.], [30894014., 30894014., 30894014., 30894014.], [30890836., 30890836., 30890836., 30890836.], [30887072., 30887072., 30887072., 30887072.], [30882718., 30882718., 30882718., 30882718.], [30877778., 30877778., 30877778., 30877778.], [30872250., 30872250., 30872250., 30872250.], [30866134., 30866134., 30866134., 30866134.], [30859430., 30859430., 30859430., 30859430.], [30852138., 30852138., 30852138., 30852138.], [30844258., 30844258., 30844258., 30844258.], [30835792., 30835792., 30835792., 30835792.], [30826740., 30826740., 30826740., 30826740.], [30817100., 30817100., 30817100., 30817100.], [30806872., 30806872., 30806872., 30806872.], [30796060., 30796060., 30796060., 30796060.], [30784660., 30784660., 30784660., 30784660.], [30772674., 30772674., 30772674., 30772674.], [30760102., 30760102., 30760102., 30760102.], [30746946., 30746946., 30746946., 30746946.], [30733202., 30733202., 30733202., 30733202.]], dtype=float32) - hFacW(depth, latitude, longitude)float321.0 1.0 1.0 1.0 ... nan nan nan nan
array([[[ 1., 1., 1., 1.], [ 1., 1., 1., 1.], [ 1., 1., 1., 1.], ..., [ 1., 1., 1., 1.], [ 1., 1., 1., 1.], [ 1., 1., 1., 1.]], [[ 1., 1., 1., 1.], [ 1., 1., 1., 1.], [ 1., 1., 1., 1.], ..., [ 1., 1., 1., 1.], [ 1., 1., 1., 1.], [ 1., 1., 1., 1.]], [[ 1., 1., 1., 1.], [ 1., 1., 1., 1.], [ 1., 1., 1., 1.], ..., ... ..., [nan, nan, nan, nan], [nan, nan, nan, nan], [nan, nan, nan, nan]], [[nan, nan, nan, nan], [nan, nan, nan, nan], [nan, nan, nan, nan], ..., [nan, nan, nan, nan], [nan, nan, nan, nan], [nan, nan, nan, nan]], [[nan, nan, nan, nan], [nan, nan, nan, nan], [nan, nan, nan, nan], ..., [nan, nan, nan, nan], [nan, nan, nan, nan], [nan, nan, nan, nan]]], dtype=float32) - hFacS(depth, latitude, longitude)float321.0 1.0 1.0 1.0 ... 0.0 0.0 0.0 0.0
array([[[1. , 1. , 1. , 1. ], [1. , 1. , 1. , 1. ], [1. , 1. , 1. , 1. ], ..., [1. , 1. , 1. , 1. ], [1. , 1. , 1. , 1. ], [1. , 1. , 1. , 1. ]], [[1. , 1. , 1. , 1. ], [1. , 1. , 1. , 1. ], [1. , 1. , 1. , 1. ], ..., [1. , 1. , 1. , 1. ], [1. , 1. , 1. , 1. ], [1. , 1. , 1. , 1. ]], [[1. , 1. , 1. , 1. ], [1. , 1. , 1. , 1. ], [1. , 1. , 1. , 1. ], ..., ... ..., [1. , 1. , 1. , 1. ], [0.5290724 , 0.5290724 , 0.5290724 , 0.5290724 ], [0. , 0. , 0. , 0. ]], [[0. , 0. , 0. , 0. ], [0. , 0. , 0. , 0. ], [0. , 0. , 0. , 0. ], ..., [0.75369215, 0.75369215, 0.75369215, 0.75369215], [0. , 0. , 0. , 0. ], [0. , 0. , 0. , 0. ]], [[0. , 0. , 0. , 0. ], [0. , 0. , 0. , 0. ], [0. , 0. , 0. , 0. ], ..., [0. , 0. , 0. , 0. ], [0. , 0. , 0. , 0. ], [0. , 0. , 0. , 0. ]]], dtype=float32) - drF(depth)float322.5 2.5 2.5 ... 100.0 100.0 100.0
array([ 2.5 , 2.5 , 2.5 , 2.5 , 2.5 , 2.5 , 2.5 , 2.5 , 2.5 , 2.5 , 2.5 , 2.5 , 2.5 , 2.5 , 2.5 , 2.5 , 2.5 , 2.5 , 2.5 , 2.5 , 2.5 , 2.5 , 2.5 , 2.5 , 2.5 , 2.5 , 2.5 , 2.5 , 2.5 , 2.5 , 2.5 , 2.5 , 2.5 , 2.5 , 2.5 , 2.5 , 2.5 , 2.5 , 2.5 , 2.5 , 2.5 , 2.5 , 2.5 , 2.5 , 2.5 , 2.5 , 2.5 , 2.5 , 2.5 , 2.5 , 2.5 , 2.5 , 2.5 , 2.5 , 2.5 , 2.5 , 2.5 , 2.5 , 2.5 , 2.5 , 2.5 , 2.5 , 2.5 , 2.5 , 2.5 , 2.5 , 2.5 , 2.5 , 2.5 , 2.5 , 2.5 , 2.5 , 2.5 , 2.5 , 2.5 , 2.5 , 2.5 , 2.5 , 2.5 , 2.5 , 2.5 , 2.5 , 2.5 , 2.5 , 2.5 , 2.5 , 2.5 , 2.5 , 2.5 , 2.5 , 2.5 , 2.5 , 2.5 , 2.5 , 2.5 , 2.5 , 2.5 , 2.5 , 2.5 , 2.5 , 2.7375, 2.9976, 3.2823, 3.5942, 3.9356, 4.3095, 4.7189, 5.1672, 5.6581, 6.1956, 6.7841, 7.4286, 8.1344, 8.9071, 9.7533, 10.6799, 11.6945, 12.8054, 14.0219, 15.354 , 16.8127, 18.4099, 20.1588, 22.0739, 24.1709, 26.4671, 28.9815, 31.7348, 34.7496, 38.0508, 41.6656, 45.6238, 49.9581, 54.7041, 59.901 , 65.5916, 71.8228, 78.646 , 86.1173, 94.2985, 100. , 100. , 100. , 100. , 100. , 100. , 100. , 100. , 100. , 100. , 100. , 100. , 100. , 100. , 100. , 100. , 100. , 100. , 100. , 100. , 100. , 100. , 100. , 100. , 100. , 100. , 100. , 100. , 100. , 100. , 100. , 100. , 100. , 100. , 100. , 100. , 100. , 100. , 100. , 100. , 100. , 100. , 100. , 100. , 100. ], dtype=float32) - drC(RF)float321.25 2.5 2.5 ... 100.0 100.0 50.0
array([ 1.25 , 2.5 , 2.5 , 2.5 , 2.5 , 2.5 , 2.5 , 2.5 , 2.5 , 2.5 , 2.5 , 2.5 , 2.5 , 2.5 , 2.5 , 2.5 , 2.5 , 2.5 , 2.5 , 2.5 , 2.5 , 2.5 , 2.5 , 2.5 , 2.5 , 2.5 , 2.5 , 2.5 , 2.5 , 2.5 , 2.5 , 2.5 , 2.5 , 2.5 , 2.5 , 2.5 , 2.5 , 2.5 , 2.5 , 2.5 , 2.5 , 2.5 , 2.5 , 2.5 , 2.5 , 2.5 , 2.5 , 2.5 , 2.5 , 2.5 , 2.5 , 2.5 , 2.5 , 2.5 , 2.5 , 2.5 , 2.5 , 2.5 , 2.5 , 2.5 , 2.5 , 2.5 , 2.5 , 2.5 , 2.5 , 2.5 , 2.5 , 2.5 , 2.5 , 2.5 , 2.5 , 2.5 , 2.5 , 2.5 , 2.5 , 2.5 , 2.5 , 2.5 , 2.5 , 2.5 , 2.5 , 2.5 , 2.5 , 2.5 , 2.5 , 2.5 , 2.5 , 2.5 , 2.5 , 2.5 , 2.5 , 2.5 , 2.5 , 2.5 , 2.5 , 2.5 , 2.5 , 2.5 , 2.5 , 2.5 , 2.61875, 2.86755, 3.13995, 3.43825, 3.7649 , 4.12255, 4.5142 , 4.94305, 5.41265, 5.92685, 6.48985, 7.10635, 7.7815 , 8.52075, 9.3302 , 10.2166 , 11.1872 , 12.24995, 13.41365, 14.68795, 16.08335, 17.6113 , 19.28435, 21.11635, 23.1224 , 25.319 , 27.7243 , 30.35815, 33.2422 , 36.4002 , 39.8582 , 43.6447 , 47.79095, 52.3311 , 57.30255, 62.7463 , 68.7072 , 75.2344 , 82.38165, 90.2079 , 97.14925, 100. , 100. , 100. , 100. , 100. , 100. , 100. , 100. , 100. , 100. , 100. , 100. , 100. , 100. , 100. , 100. , 100. , 100. , 100. , 100. , 100. , 100. , 100. , 100. , 100. , 100. , 100. , 100. , 100. , 100. , 100. , 100. , 100. , 100. , 100. , 100. , 100. , 100. , 100. , 100. , 100. , 100. , 100. , 100. , 50. ], dtype=float32) - rAs(latitude, longitude)float323.086e+07 3.086e+07 ... 3.073e+07
array([[30857304., 30857304., 30857304., 30857304.], [30864184., 30864184., 30864184., 30864184.], [30870476., 30870476., 30870476., 30870476.], [30876182., 30876182., 30876182., 30876182.], [30881298., 30881298., 30881298., 30881298.], [30885828., 30885828., 30885828., 30885828.], [30889768., 30889768., 30889768., 30889768.], [30893122., 30893122., 30893122., 30893122.], [30895886., 30895886., 30895886., 30895886.], [30898064., 30898064., 30898064., 30898064.], [30899652., 30899652., 30899652., 30899652.], [30900652., 30900652., 30900652., 30900652.], [30901064., 30901064., 30901064., 30901064.], [30900888., 30900888., 30900888., 30900888.], [30900122., 30900122., 30900122., 30900122.], [30898770., 30898770., 30898770., 30898770.], [30896828., 30896828., 30896828., 30896828.], [30894298., 30894298., 30894298., 30894298.], [30891180., 30891180., 30891180., 30891180.], [30887474., 30887474., 30887474., 30887474.], [30883180., 30883180., 30883180., 30883180.], [30878298., 30878298., 30878298., 30878298.], [30872828., 30872828., 30872828., 30872828.], [30866772., 30866772., 30866772., 30866772.], [30860126., 30860126., 30860126., 30860126.], [30852894., 30852894., 30852894., 30852894.], [30845074., 30845074., 30845074., 30845074.], [30836666., 30836666., 30836666., 30836666.], [30827672., 30827672., 30827672., 30827672.], [30818090., 30818090., 30818090., 30818090.], [30807922., 30807922., 30807922., 30807922.], [30797168., 30797168., 30797168., 30797168.], [30785826., 30785826., 30785826., 30785826.], [30773898., 30773898., 30773898., 30773898.], [30761386., 30761386., 30761386., 30761386.], [30748288., 30748288., 30748288., 30748288.], [30734604., 30734604., 30734604., 30734604.]], dtype=float32) - DXG(latitude, longitude)float325.551e+03 5.551e+03 ... 5.529e+03
array([[5550.9995, 5550.9995, 5550.9995, 5550.9995], [5552.2373, 5552.2373, 5552.2373, 5552.2373], [5553.369 , 5553.369 , 5553.369 , 5553.369 ], [5554.3955, 5554.3955, 5554.3955, 5554.3955], [5555.316 , 5555.316 , 5555.316 , 5555.316 ], [5556.131 , 5556.131 , 5556.131 , 5556.131 ], [5556.84 , 5556.84 , 5556.84 , 5556.84 ], [5557.443 , 5557.443 , 5557.443 , 5557.443 ], [5557.9404, 5557.9404, 5557.9404, 5557.9404], [5558.332 , 5558.332 , 5558.332 , 5558.332 ], [5558.6177, 5558.6177, 5558.6177, 5558.6177], [5558.7974, 5558.7974, 5558.7974, 5558.7974], [5558.8716, 5558.8716, 5558.8716, 5558.8716], [5558.84 , 5558.84 , 5558.84 , 5558.84 ], [5558.702 , 5558.702 , 5558.702 , 5558.702 ], [5558.459 , 5558.459 , 5558.459 , 5558.459 ], [5558.1094, 5558.1094, 5558.1094, 5558.1094], [5557.6543, 5557.6543, 5557.6543, 5557.6543], [5557.0938, 5557.0938, 5557.0938, 5557.0938], [5556.427 , 5556.427 , 5556.427 , 5556.427 ], [5555.6543, 5555.6543, 5555.6543, 5555.6543], [5554.7764, 5554.7764, 5554.7764, 5554.7764], [5553.7925, 5553.7925, 5553.7925, 5553.7925], [5552.7026, 5552.7026, 5552.7026, 5552.7026], [5551.5073, 5551.5073, 5551.5073, 5551.5073], [5550.206 , 5550.206 , 5550.206 , 5550.206 ], [5548.7993, 5548.7993, 5548.7993, 5548.7993], [5547.2866, 5547.2866, 5547.2866, 5547.2866], [5545.669 , 5545.669 , 5545.669 , 5545.669 ], [5543.9453, 5543.9453, 5543.9453, 5543.9453], [5542.116 , 5542.116 , 5542.116 , 5542.116 ], [5540.181 , 5540.181 , 5540.181 , 5540.181 ], [5538.141 , 5538.141 , 5538.141 , 5538.141 ], [5535.9956, 5535.9956, 5535.9956, 5535.9956], [5533.7446, 5533.7446, 5533.7446, 5533.7446], [5531.388 , 5531.388 , 5531.388 , 5531.388 ], [5528.927 , 5528.927 , 5528.927 , 5528.927 ]], dtype=float32) - DYG(latitude, longitude)float325.559e+03 5.559e+03 ... 5.559e+03
array([[5558.8735, 5558.8735, 5558.8735, 5558.8735],
       [5558.8735, 5558.8735, 5558.8735, 5558.8735],
       [5558.8735, 5558.8735, 5558.8735, 5558.8735],
       [5558.8735, 5558.8735, 5558.8735, 5558.8735],
       [5558.8735, 5558.8735, 5558.8735, 5558.8735],
       [5558.8735, 5558.8735, 5558.8735, 5558.8735],
       [5558.8735, 5558.8735, 5558.8735, 5558.8735],
       [5558.8735, 5558.8735, 5558.8735, 5558.8735],
       [5558.8735, 5558.8735, 5558.8735, 5558.8735],
       [5558.8735, 5558.8735, 5558.8735, 5558.8735],
       [5558.8735, 5558.8735, 5558.8735, 5558.8735],
       [5558.8735, 5558.8735, 5558.8735, 5558.8735],
       [5558.8735, 5558.8735, 5558.8735, 5558.8735],
       [5558.8735, 5558.8735, 5558.8735, 5558.8735],
       [5558.8735, 5558.8735, 5558.8735, 5558.8735],
       [5558.8735, 5558.8735, 5558.8735, 5558.8735],
       [5558.8735, 5558.8735, 5558.8735, 5558.8735],
       [5558.8735, 5558.8735, 5558.8735, 5558.8735],
       [5558.8735, 5558.8735, 5558.8735, 5558.8735],
       [5558.8735, 5558.8735, 5558.8735, 5558.8735],
       [5558.8735, 5558.8735, 5558.8735, 5558.8735],
       [5558.8735, 5558.8735, 5558.8735, 5558.8735],
       [5558.8735, 5558.8735, 5558.8735, 5558.8735],
       [5558.8735, 5558.8735, 5558.8735, 5558.8735],
       [5558.8735, 5558.8735, 5558.8735, 5558.8735],
       [5558.8735, 5558.8735, 5558.8735, 5558.8735],
       [5558.8735, 5558.8735, 5558.8735, 5558.8735],
       [5558.8735, 5558.8735, 5558.8735, 5558.8735],
       [5558.8735, 5558.8735, 5558.8735, 5558.8735],
       [5558.8735, 5558.8735, 5558.8735, 5558.8735],
       [5558.8735, 5558.8735, 5558.8735, 5558.8735],
       [5558.8735, 5558.8735, 5558.8735, 5558.8735],
       [5558.8735, 5558.8735, 5558.8735, 5558.8735],
       [5558.8735, 5558.8735, 5558.8735, 5558.8735],
       [5558.8735, 5558.8735, 5558.8735, 5558.8735],
       [5558.8735, 5558.8735, 5558.8735, 5558.8735],
       [5558.8735, 5558.8735, 5558.8735, 5558.8735]], dtype=float32)
- long_name :
- cell_height
- units :
- m
moor = stations.isel(longitude=slice(1, -1, 3), latitude=slice(1, -1, 3)).sel(
    time=slice("2007-01-01", "2009-12-31")
)
moor
<xarray.Dataset>
Dimensions:        (depth: 185, time: 26304, longitude: 4, latitude: 37)
Coordinates:
  * depth          (depth) float32 -1.25 -3.75 -6.25 ... -5.658e+03 -5.758e+03
  * latitude       (latitude) float64 -3.025 -2.775 -2.525 ... 5.475 5.725 5.975
  * longitude      (longitude) float64 -155.0 -140.0 -125.0 -110.0
  * time           (time) datetime64[ns] 2007-01-01 ... 2009-12-31T23:00:00
Data variables: (12/21)
    DFrI_TH        (depth, time, longitude, latitude) float32 dask.array<chunksize=(185, 1866, 1, 1), meta=np.ndarray>
    KPPdiffKzT     (depth, time, longitude, latitude) float32 dask.array<chunksize=(185, 1866, 1, 1), meta=np.ndarray>
    KPPg_TH        (depth, time, longitude, latitude) float32 dask.array<chunksize=(185, 1866, 1, 1), meta=np.ndarray>
    KPPhbl         (time, longitude, latitude) float32 dask.array<chunksize=(1866, 1, 1), meta=np.ndarray>
    KPPviscAz      (depth, time, longitude, latitude) float32 dask.array<chunksize=(185, 1866, 1, 1), meta=np.ndarray>
    SSH            (time, longitude, latitude) float32 dask.array<chunksize=(1866, 1, 1), meta=np.ndarray>
    ...             ...
    dens           (depth, time, longitude, latitude) float32 dask.array<chunksize=(185, 1866, 1, 1), meta=np.ndarray>
    mld            (time, longitude, latitude) float32 dask.array<chunksize=(1866, 1, 1), meta=np.ndarray>
    Jq             (depth, time, longitude, latitude) float64 dask.array<chunksize=(185, 1866, 1, 1), meta=np.ndarray>
    dJdz           (depth, time, longitude, latitude) float64 dask.array<chunksize=(185, 1866, 1, 1), meta=np.ndarray>
    dTdt           (depth, time, longitude, latitude) float64 dask.array<chunksize=(185, 1866, 1, 1), meta=np.ndarray>
    enso           (time) <U8 'Neutral' 'Neutral' ... 'El-Nino' 'El-Nino'
Attributes:
    easting:   longitude
    northing:  latitude
    title:     Station profile, index (i,j)=(1201,240)
xarray.Dataset
- depth: 185
- time: 26304
- longitude: 4
- latitude: 37
- depth(depth)float32-1.25 -3.75 ... -5.758e+03
- axis :
- Z
array([-1.250000e+00, -3.750000e+00, -6.250000e+00, -8.750000e+00, -1.125000e+01, -1.375000e+01, -1.625000e+01, -1.875000e+01, -2.125000e+01, -2.375000e+01, -2.625000e+01, -2.875000e+01, -3.125000e+01, -3.375000e+01, -3.625000e+01, -3.875000e+01, -4.125000e+01, -4.375000e+01, -4.625000e+01, -4.875000e+01, -5.125000e+01, -5.375000e+01, -5.625000e+01, -5.875000e+01, -6.125000e+01, -6.375000e+01, -6.625000e+01, -6.875000e+01, -7.125000e+01, -7.375000e+01, -7.625000e+01, -7.875000e+01, -8.125000e+01, -8.375000e+01, -8.625000e+01, -8.875000e+01, -9.125000e+01, -9.375000e+01, -9.625000e+01, -9.875000e+01, -1.012500e+02, -1.037500e+02, -1.062500e+02, -1.087500e+02, -1.112500e+02, -1.137500e+02, -1.162500e+02, -1.187500e+02, -1.212500e+02, -1.237500e+02, -1.262500e+02, -1.287500e+02, -1.312500e+02, -1.337500e+02, -1.362500e+02, -1.387500e+02, -1.412500e+02, -1.437500e+02, -1.462500e+02, -1.487500e+02, -1.512500e+02, -1.537500e+02, -1.562500e+02, -1.587500e+02, -1.612500e+02, -1.637500e+02, -1.662500e+02, -1.687500e+02, -1.712500e+02, -1.737500e+02, -1.762500e+02, -1.787500e+02, -1.812500e+02, -1.837500e+02, -1.862500e+02, -1.887500e+02, -1.912500e+02, -1.937500e+02, -1.962500e+02, -1.987500e+02, -2.012500e+02, -2.037500e+02, -2.062500e+02, -2.087500e+02, -2.112500e+02, -2.137500e+02, -2.162500e+02, -2.187500e+02, -2.212500e+02, -2.237500e+02, -2.262500e+02, -2.287500e+02, -2.312500e+02, -2.337500e+02, -2.362500e+02, -2.387500e+02, -2.412500e+02, -2.437500e+02, -2.462500e+02, -2.487500e+02, -2.513687e+02, -2.542363e+02, -2.573763e+02, -2.608145e+02, -2.645794e+02, -2.687019e+02, -2.732162e+02, -2.781592e+02, -2.835718e+02, -2.894987e+02, -2.959886e+02, -3.030949e+02, -3.108764e+02, -3.193972e+02, -3.287274e+02, -3.389439e+02, -3.501312e+02, -3.623811e+02, -3.757947e+02, -3.904827e+02, -4.065660e+02, -4.241773e+02, -4.434617e+02, -4.645781e+02, -4.877004e+02, -5.130195e+02, -5.407438e+02, -5.711019e+02, -6.043441e+02, -6.407443e+02, -6.806025e+02, -7.242472e+02, -7.720381e+02, -8.243693e+02, -8.816718e+02, -9.444181e+02, -1.013125e+03, -1.088360e+03, -1.170741e+03, -1.260949e+03, -1.358099e+03, -1.458099e+03, -1.558099e+03, -1.658099e+03, -1.758099e+03, -1.858099e+03, -1.958099e+03, -2.058098e+03, -2.158098e+03, -2.258098e+03, -2.358098e+03, -2.458098e+03, -2.558098e+03, -2.658098e+03, -2.758098e+03, -2.858098e+03, -2.958098e+03, -3.058098e+03, -3.158098e+03, -3.258098e+03, -3.358098e+03, -3.458098e+03, -3.558098e+03, -3.658098e+03, -3.758098e+03, -3.858098e+03, -3.958098e+03, -4.058098e+03, -4.158099e+03, -4.258099e+03, -4.358099e+03, -4.458099e+03, -4.558099e+03, -4.658099e+03, -4.758099e+03, -4.858099e+03, -4.958099e+03, -5.058099e+03, -5.158099e+03, -5.258099e+03, -5.358099e+03, -5.458099e+03, -5.558099e+03, -5.658099e+03, -5.758099e+03], dtype=float32) - latitude(latitude)float64-3.025 -2.775 ... 5.725 5.975
- units :
- degrees_north
- standard_name :
- latitude
array([-3.025, -2.775, -2.525, -2.275, -2.025, -1.775, -1.525, -1.275, -1.025, -0.775, -0.525, -0.275, -0.025, 0.225, 0.475, 0.725, 0.975, 1.225, 1.475, 1.725, 1.975, 2.225, 2.475, 2.725, 2.975, 3.225, 3.475, 3.725, 3.975, 4.225, 4.475, 4.725, 4.975, 5.225, 5.475, 5.725, 5.975]) - longitude(longitude)float64-155.0 -140.0 -125.0 -110.0
- units :
- degrees_east
- standard_name :
- longitude
array([-155.024994, -140.024994, -125.025002, -110.025002])
- time(time)datetime64[ns]2007-01-01 ... 2009-12-31T23:00:00
array(['2007-01-01T00:00:00.000000000', '2007-01-01T01:00:00.000000000',
       '2007-01-01T02:00:00.000000000', ..., '2009-12-31T21:00:00.000000000',
       '2009-12-31T21:59:44.000000000', '2009-12-31T23:00:00.000000000'],
      dtype='datetime64[ns]')
- DFrI_TH(depth, time, longitude, latitude)float32dask.array<chunksize=(185, 1866, 1, 1), meta=np.ndarray>
Array Chunk Bytes 2.68 GiB 4.23 MiB Shape (185, 26304, 4, 37) (185, 6000, 1, 1) Count 13793 Tasks 888 Chunks Type float32 numpy.ndarray - KPPdiffKzT(depth, time, longitude, latitude)float32dask.array<chunksize=(185, 1866, 1, 1), meta=np.ndarray>
Array Chunk Bytes 2.68 GiB 4.23 MiB Shape (185, 26304, 4, 37) (185, 6000, 1, 1) Count 13793 Tasks 888 Chunks Type float32 numpy.ndarray - KPPg_TH(depth, time, longitude, latitude)float32dask.array<chunksize=(185, 1866, 1, 1), meta=np.ndarray>
Array Chunk Bytes 2.68 GiB 4.23 MiB Shape (185, 26304, 4, 37) (185, 6000, 1, 1) Count 26669 Tasks 888 Chunks Type float32 numpy.ndarray - KPPhbl(time, longitude, latitude)float32dask.array<chunksize=(1866, 1, 1), meta=np.ndarray>
Array Chunk Bytes 14.85 MiB 23.44 kiB Shape (26304, 4, 37) (6000, 1, 1) Count 13793 Tasks 888 Chunks Type float32 numpy.ndarray - KPPviscAz(depth, time, longitude, latitude)float32dask.array<chunksize=(185, 1866, 1, 1), meta=np.ndarray>
Array Chunk Bytes 2.68 GiB 4.23 MiB Shape (185, 26304, 4, 37) (185, 6000, 1, 1) Count 13793 Tasks 888 Chunks Type float32 numpy.ndarray - SSH(time, longitude, latitude)float32dask.array<chunksize=(1866, 1, 1), meta=np.ndarray>
Array Chunk Bytes 14.85 MiB 23.44 kiB Shape (26304, 4, 37) (6000, 1, 1) Count 13793 Tasks 888 Chunks Type float32 numpy.ndarray - VISrI_Um(depth, time, longitude, latitude)float32dask.array<chunksize=(185, 1866, 1, 1), meta=np.ndarray>
Array Chunk Bytes 2.68 GiB 4.23 MiB Shape (185, 26304, 4, 37) (185, 6000, 1, 1) Count 13793 Tasks 888 Chunks Type float32 numpy.ndarray - VISrI_Vm(depth, time, longitude, latitude)float32dask.array<chunksize=(185, 1866, 1, 1), meta=np.ndarray>
Array Chunk Bytes 2.68 GiB 4.23 MiB Shape (185, 26304, 4, 37) (185, 6000, 1, 1) Count 13793 Tasks 888 Chunks Type float32 numpy.ndarray - salt(depth, time, longitude, latitude)float32dask.array<chunksize=(185, 1866, 1, 1), meta=np.ndarray>
Array Chunk Bytes 2.68 GiB 4.23 MiB Shape (185, 26304, 4, 37) (185, 6000, 1, 1) Count 13793 Tasks 888 Chunks Type float32 numpy.ndarray - theta(depth, time, longitude, latitude)float32dask.array<chunksize=(185, 1866, 1, 1), meta=np.ndarray>
Array Chunk Bytes 2.68 GiB 4.23 MiB Shape (185, 26304, 4, 37) (185, 6000, 1, 1) Count 13793 Tasks 888 Chunks Type float32 numpy.ndarray - u(depth, time, longitude, latitude)float32dask.array<chunksize=(185, 1866, 1, 1), meta=np.ndarray>
Array Chunk Bytes 2.68 GiB 4.23 MiB Shape (185, 26304, 4, 37) (185, 6000, 1, 1) Count 13793 Tasks 888 Chunks Type float32 numpy.ndarray - v(depth, time, longitude, latitude)float32dask.array<chunksize=(185, 1866, 1, 1), meta=np.ndarray>
Array Chunk Bytes 2.68 GiB 4.23 MiB Shape (185, 26304, 4, 37) (185, 6000, 1, 1) Count 13793 Tasks 888 Chunks Type float32 numpy.ndarray - w(depth, time, longitude, latitude)float32dask.array<chunksize=(185, 1866, 1, 1), meta=np.ndarray>
Array Chunk Bytes 2.68 GiB 4.23 MiB Shape (185, 26304, 4, 37) (185, 6000, 1, 1) Count 13793 Tasks 888 Chunks Type float32 numpy.ndarray - Jq_shear(depth, time, longitude, latitude)float64dask.array<chunksize=(185, 1866, 1, 1), meta=np.ndarray>
Array Chunk Bytes 5.37 GiB 8.47 MiB Shape (185, 26304, 4, 37) (185, 6000, 1, 1) Count 35558 Tasks 888 Chunks Type float64 numpy.ndarray - nonlocal_flux(depth, time, longitude, latitude)float64dask.array<chunksize=(185, 1866, 1, 1), meta=np.ndarray>
Array Chunk Bytes 5.37 GiB 8.47 MiB Shape (185, 26304, 4, 37) (185, 6000, 1, 1) Count 35558 Tasks 888 Chunks Type float64 numpy.ndarray - dens(depth, time, longitude, latitude)float32dask.array<chunksize=(185, 1866, 1, 1), meta=np.ndarray>
Array Chunk Bytes 2.68 GiB 4.23 MiB Shape (185, 26304, 4, 37) (185, 6000, 1, 1) Count 35283 Tasks 888 Chunks Type float32 numpy.ndarray - mld(time, longitude, latitude)float32dask.array<chunksize=(1866, 1, 1), meta=np.ndarray>
- long_name :
- MLD
- units :
- m
- description :
- Interpolate density to 1m grid. Search for max depth where |drho| > 0.015 and N2 > 1e-05
Array Chunk Bytes 14.85 MiB 23.44 kiB Shape (26304, 4, 37) (6000, 1, 1) Count 108248 Tasks 888 Chunks Type float32 numpy.ndarray - Jq(depth, time, longitude, latitude)float64dask.array<chunksize=(185, 1866, 1, 1), meta=np.ndarray>
Array Chunk Bytes 5.37 GiB 8.47 MiB Shape (185, 26304, 4, 37) (185, 6000, 1, 1) Count 69923 Tasks 888 Chunks Type float64 numpy.ndarray - dJdz(depth, time, longitude, latitude)float64dask.array<chunksize=(185, 1866, 1, 1), meta=np.ndarray>
Array Chunk Bytes 5.37 GiB 8.47 MiB Shape (185, 26304, 4, 37) (185, 6000, 1, 1) Count 95675 Tasks 888 Chunks Type float64 numpy.ndarray - dTdt(depth, time, longitude, latitude)float64dask.array<chunksize=(185, 1866, 1, 1), meta=np.ndarray>
- long_name :
- $∂T/∂t = -1/(ρ_0c_p) ∂J_q/∂z$
- units :
- °C/month
Array Chunk Bytes 5.37 GiB 8.47 MiB Shape (185, 26304, 4, 37) (185, 6000, 1, 1) Count 117135 Tasks 888 Chunks Type float64 numpy.ndarray - enso(time)<U8'Neutral' 'Neutral' ... 'El-Nino'
- description :
- ENSO phase; El-Nino = NINO34 SSTA > 0.4 for at least 6 months; La-Nina = NINO34 SSTA < -0.4 for at least 6 months
array(['Neutral', 'Neutral', 'Neutral', ..., 'El-Nino', 'El-Nino',
       'El-Nino'], dtype='<U8')
- easting :
- longitude
- northing :
- latitude
- title :
- Station profile, index (i,j)=(1201,240)
dim = {"x": "longitude", "y": "latitude", "z": "depth"}
metric = {"x": "DXC", "y": "DYC", "z": "drF"}

der = xr.Dataset()
for axis in ["x", "y", "z"]:
    for var in ["u", "v", "w"]:
        der[f"{var}{axis}"] = stations[var].diff(dim[axis]) / metrics[metric[axis]]
        der[f"{var}{axis}"].attrs["long_name"] = f"${var}_{axis}$"
der = der.reindex_like(moor)
der
/glade/u/home/dcherian/miniconda3/envs/dcpy/lib/python3.8/site-packages/xarray/core/indexing.py:1232: PerformanceWarning: Slicing is producing a large chunk. To accept the large
chunk and silence this warning, set the option
    >>> with dask.config.set(**{'array.slicing.split_large_chunks': False}):
    ...     array[indexer]

To avoid creating the large chunks, set the option
    >>> with dask.config.set(**{'array.slicing.split_large_chunks': True}):
    ...     array[indexer]
  value = value[(slice(None),) * axis + (subkey,)]
/glade/u/home/dcherian/miniconda3/envs/dcpy/lib/python3.8/site-packages/dask/array/core.py:4360: PerformanceWarning: Increasing number of chunks by factor of 37
  result = blockwise(
/glade/u/home/dcherian/miniconda3/envs/dcpy/lib/python3.8/site-packages/xarray/core/indexing.py:1226: PerformanceWarning: Slicing is producing a large chunk. To accept the large
chunk and silence this warning, set the option
    >>> with dask.config.set(**{'array.slicing.split_large_chunks': False}):
    ...     array[indexer]

To avoid creating the large chunks, set the option
    >>> with dask.config.set(**{'array.slicing.split_large_chunks': True}):
    ...     array[indexer]
  return self.array[key]
<xarray.Dataset>
Dimensions:    (depth: 185, latitude: 37, longitude: 4, time: 26304)
Coordinates:
  * depth      (depth) float64 -1.25 -3.75 -6.25 ... -5.658e+03 -5.758e+03
  * latitude   (latitude) float64 -3.025 -2.775 -2.525 ... 5.475 5.725 5.975
  * longitude  (longitude) float64 -155.0 -140.0 -125.0 -110.0
  * time       (time) datetime64[ns] 2007-01-01 ... 2009-12-31T23:00:00
Data variables:
    ux         (depth, time, longitude, latitude) float64 dask.array<chunksize=(185, 1866, 1, 1), meta=np.ndarray>
    vx         (depth, time, longitude, latitude) float64 dask.array<chunksize=(185, 1866, 1, 1), meta=np.ndarray>
    wx         (depth, time, longitude, latitude) float64 dask.array<chunksize=(185, 1866, 1, 1), meta=np.ndarray>
    uy         (depth, time, longitude, latitude) float64 dask.array<chunksize=(185, 1866, 1, 1), meta=np.ndarray>
    vy         (depth, time, longitude, latitude) float64 dask.array<chunksize=(185, 1866, 1, 1), meta=np.ndarray>
    wy         (depth, time, longitude, latitude) float64 dask.array<chunksize=(185, 1866, 1, 1), meta=np.ndarray>
    uz         (depth, time, longitude, latitude) float32 dask.array<chunksize=(185, 1866, 1, 1), meta=np.ndarray>
    vz         (depth, time, longitude, latitude) float32 dask.array<chunksize=(185, 1866, 1, 1), meta=np.ndarray>
    wz         (depth, time, longitude, latitude) float32 dask.array<chunksize=(185, 1866, 1, 1), meta=np.ndarray>
xarray.Dataset
- depth: 185
- latitude: 37
- longitude: 4
- time: 26304
- depth(depth)float64-1.25 -3.75 ... -5.758e+03
- axis :
- Z
array([-1.250000e+00, -3.750000e+00, -6.250000e+00, -8.750000e+00, -1.125000e+01, -1.375000e+01, -1.625000e+01, -1.875000e+01, -2.125000e+01, -2.375000e+01, -2.625000e+01, -2.875000e+01, -3.125000e+01, -3.375000e+01, -3.625000e+01, -3.875000e+01, -4.125000e+01, -4.375000e+01, -4.625000e+01, -4.875000e+01, -5.125000e+01, -5.375000e+01, -5.625000e+01, -5.875000e+01, -6.125000e+01, -6.375000e+01, -6.625000e+01, -6.875000e+01, -7.125000e+01, -7.375000e+01, -7.625000e+01, -7.875000e+01, -8.125000e+01, -8.375000e+01, -8.625000e+01, -8.875000e+01, -9.125000e+01, -9.375000e+01, -9.625000e+01, -9.875000e+01, -1.012500e+02, -1.037500e+02, -1.062500e+02, -1.087500e+02, -1.112500e+02, -1.137500e+02, -1.162500e+02, -1.187500e+02, -1.212500e+02, -1.237500e+02, -1.262500e+02, -1.287500e+02, -1.312500e+02, -1.337500e+02, -1.362500e+02, -1.387500e+02, -1.412500e+02, -1.437500e+02, -1.462500e+02, -1.487500e+02, -1.512500e+02, -1.537500e+02, -1.562500e+02, -1.587500e+02, -1.612500e+02, -1.637500e+02, -1.662500e+02, -1.687500e+02, -1.712500e+02, -1.737500e+02, -1.762500e+02, -1.787500e+02, -1.812500e+02, -1.837500e+02, -1.862500e+02, -1.887500e+02, -1.912500e+02, -1.937500e+02, -1.962500e+02, -1.987500e+02, -2.012500e+02, -2.037500e+02, -2.062500e+02, -2.087500e+02, -2.112500e+02, -2.137500e+02, -2.162500e+02, -2.187500e+02, -2.212500e+02, -2.237500e+02, -2.262500e+02, -2.287500e+02, -2.312500e+02, -2.337500e+02, -2.362500e+02, -2.387500e+02, -2.412500e+02, -2.437500e+02, -2.462500e+02, -2.487500e+02, -2.513687e+02, -2.542363e+02, -2.573763e+02, -2.608145e+02, -2.645794e+02, -2.687019e+02, -2.732162e+02, -2.781592e+02, -2.835718e+02, -2.894987e+02, -2.959886e+02, -3.030949e+02, -3.108764e+02, -3.193972e+02, -3.287274e+02, -3.389439e+02, -3.501312e+02, -3.623811e+02, -3.757947e+02, -3.904827e+02, -4.065660e+02, -4.241773e+02, -4.434617e+02, -4.645781e+02, -4.877004e+02, -5.130195e+02, -5.407438e+02, -5.711019e+02, -6.043441e+02, -6.407443e+02, -6.806025e+02, -7.242472e+02, -7.720381e+02, -8.243693e+02, -8.816718e+02, -9.444181e+02, -1.013125e+03, -1.088360e+03, -1.170741e+03, -1.260949e+03, -1.358099e+03, -1.458099e+03, -1.558099e+03, -1.658099e+03, -1.758099e+03, -1.858099e+03, -1.958099e+03, -2.058098e+03, -2.158098e+03, -2.258098e+03, -2.358098e+03, -2.458098e+03, -2.558098e+03, -2.658098e+03, -2.758098e+03, -2.858098e+03, -2.958098e+03, -3.058098e+03, -3.158098e+03, -3.258098e+03, -3.358098e+03, -3.458098e+03, -3.558098e+03, -3.658098e+03, -3.758098e+03, -3.858098e+03, -3.958098e+03, -4.058098e+03, -4.158099e+03, -4.258099e+03, -4.358099e+03, -4.458099e+03, -4.558099e+03, -4.658099e+03, -4.758099e+03, -4.858099e+03, -4.958099e+03, -5.058099e+03, -5.158099e+03, -5.258099e+03, -5.358099e+03, -5.458099e+03, -5.558099e+03, -5.658099e+03, -5.758099e+03]) - latitude(latitude)float64-3.025 -2.775 ... 5.725 5.975
- units :
- degrees_north
- standard_name :
- latitude
array([-3.025, -2.775, -2.525, -2.275, -2.025, -1.775, -1.525, -1.275, -1.025, -0.775, -0.525, -0.275, -0.025, 0.225, 0.475, 0.725, 0.975, 1.225, 1.475, 1.725, 1.975, 2.225, 2.475, 2.725, 2.975, 3.225, 3.475, 3.725, 3.975, 4.225, 4.475, 4.725, 4.975, 5.225, 5.475, 5.725, 5.975]) - longitude(longitude)float64-155.0 -140.0 -125.0 -110.0
- units :
- degrees_east
- standard_name :
- longitude
array([-155.024994, -140.024994, -125.025002, -110.025002])
- time(time)datetime64[ns]2007-01-01 ... 2009-12-31T23:00:00
array(['2007-01-01T00:00:00.000000000', '2007-01-01T01:00:00.000000000',
       '2007-01-01T02:00:00.000000000', ..., '2009-12-31T21:00:00.000000000',
       '2009-12-31T21:59:44.000000000', '2009-12-31T23:00:00.000000000'],
      dtype='datetime64[ns]')
- ux(depth, time, longitude, latitude)float64dask.array<chunksize=(185, 1866, 1, 1), meta=np.ndarray>
- long_name :
- $u_x$
Array Chunk Bytes 5.37 GiB 8.47 MiB Shape (185, 26304, 4, 37) (185, 6000, 1, 1) Count 69886 Tasks 888 Chunks Type float64 numpy.ndarray - vx(depth, time, longitude, latitude)float64dask.array<chunksize=(185, 1866, 1, 1), meta=np.ndarray>
- long_name :
- $v_x$
Array Chunk Bytes 5.37 GiB 8.47 MiB Shape (185, 26304, 4, 37) (185, 6000, 1, 1) Count 69886 Tasks 888 Chunks Type float64 numpy.ndarray - wx(depth, time, longitude, latitude)float64dask.array<chunksize=(185, 1866, 1, 1), meta=np.ndarray>
- long_name :
- $w_x$
Array Chunk Bytes 5.37 GiB 8.47 MiB Shape (185, 26304, 4, 37) (185, 6000, 1, 1) Count 69886 Tasks 888 Chunks Type float64 numpy.ndarray - uy(depth, time, longitude, latitude)float64dask.array<chunksize=(185, 1866, 1, 1), meta=np.ndarray>
- long_name :
- $u_y$
Array Chunk Bytes 5.37 GiB 8.47 MiB Shape (185, 26304, 4, 37) (185, 6000, 1, 1) Count 73366 Tasks 888 Chunks Type float64 numpy.ndarray - vy(depth, time, longitude, latitude)float64dask.array<chunksize=(185, 1866, 1, 1), meta=np.ndarray>
- long_name :
- $v_y$
Array Chunk Bytes 5.37 GiB 8.47 MiB Shape (185, 26304, 4, 37) (185, 6000, 1, 1) Count 73366 Tasks 888 Chunks Type float64 numpy.ndarray - wy(depth, time, longitude, latitude)float64dask.array<chunksize=(185, 1866, 1, 1), meta=np.ndarray>
- long_name :
- $w_y$
Array Chunk Bytes 5.37 GiB 8.47 MiB Shape (185, 26304, 4, 37) (185, 6000, 1, 1) Count 73366 Tasks 888 Chunks Type float64 numpy.ndarray - uz(depth, time, longitude, latitude)float32dask.array<chunksize=(185, 1866, 1, 1), meta=np.ndarray>
- long_name :
- $u_z$
Array Chunk Bytes 2.68 GiB 4.23 MiB Shape (185, 26304, 4, 37) (185, 6000, 1, 1) Count 52709 Tasks 888 Chunks Type float32 numpy.ndarray - vz(depth, time, longitude, latitude)float32dask.array<chunksize=(185, 1866, 1, 1), meta=np.ndarray>
- long_name :
- $v_z$
Array Chunk Bytes 2.68 GiB 4.23 MiB Shape (185, 26304, 4, 37) (185, 6000, 1, 1) Count 52709 Tasks 888 Chunks Type float32 numpy.ndarray - wz(depth, time, longitude, latitude)float32dask.array<chunksize=(185, 1866, 1, 1), meta=np.ndarray>
- long_name :
- $w_z$
Array Chunk Bytes 2.68 GiB 4.23 MiB Shape (185, 26304, 4, 37) (185, 6000, 1, 1) Count 52709 Tasks 888 Chunks Type float32 numpy.ndarray
shred2 = xr.Dataset()
shred2["strvy"] = der.uz**2 * der.vy
shred2["strux"] = der.vz**2 * der.ux
shred2["tiltuy"] = -1 * der.uy * der.vz * der.uz
shred2["tiltvx"] = -1 * der.vx * der.vz * der.uz

shred2["strvy"].attrs["long_name"] = "$u_z^2 * v_y$"
shred2["strux"].attrs["long_name"] = "$v_z^2 * u_x$"
shred2["tiltuy"].attrs["long_name"] = "$-u_y u_z v_z$"
shred2["tiltvx"].attrs["long_name"] = "$- v_x u_z v_z$"
moor = moor.update(shred2).update(der)
subset = (
    moor.sel(latitude=[-2, 0, 2, 4], longitude=-140, method="nearest")
    .sel(depth=slice(-80))
    .mean("depth")
)
subset
/glade/u/home/dcherian/miniconda3/envs/dcpy/lib/python3.8/site-packages/numpy/core/_methods.py:179: RuntimeWarning: invalid value encountered in reduce
  ret = umr_sum(arr, axis, dtype, out, keepdims, where=where)
<xarray.Dataset>
Dimensions:        (time: 26304, latitude: 4)
Coordinates:
  * latitude       (latitude) float64 -2.025 -0.025 1.975 3.975
    longitude      float64 -140.0
  * time           (time) datetime64[ns] 2007-01-01 ... 2009-12-31T23:00:00
Data variables: (12/34)
    DFrI_TH        (time, latitude) float32 dask.array<chunksize=(1866, 1), meta=np.ndarray>
    KPPdiffKzT     (time, latitude) float32 dask.array<chunksize=(1866, 1), meta=np.ndarray>
    KPPg_TH        (time, latitude) float32 dask.array<chunksize=(1866, 1), meta=np.ndarray>
    KPPhbl         (time, latitude) float32 dask.array<chunksize=(1866, 1), meta=np.ndarray>
    KPPviscAz      (time, latitude) float32 dask.array<chunksize=(1866, 1), meta=np.ndarray>
    SSH            (time, latitude) float32 dask.array<chunksize=(1866, 1), meta=np.ndarray>
    ...             ...
    uy             (time, latitude) float64 dask.array<chunksize=(1866, 1), meta=np.ndarray>
    vy             (time, latitude) float64 dask.array<chunksize=(1866, 1), meta=np.ndarray>
    wy             (time, latitude) float64 dask.array<chunksize=(1866, 1), meta=np.ndarray>
    uz             (time, latitude) float32 dask.array<chunksize=(1866, 1), meta=np.ndarray>
    vz             (time, latitude) float32 dask.array<chunksize=(1866, 1), meta=np.ndarray>
    wz             (time, latitude) float32 dask.array<chunksize=(1866, 1), meta=np.ndarray>
Attributes:
    easting:   longitude
    northing:  latitude
    title:     Station profile, index (i,j)=(1201,240)
xarray.Dataset
- time: 26304
- latitude: 4
- latitude(latitude)float64-2.025 -0.025 1.975 3.975
- units :
- degrees_north
- standard_name :
- latitude
array([-2.025, -0.025, 1.975, 3.975])
- longitude()float64-140.0
- units :
- degrees_east
- standard_name :
- longitude
array(-140.0249939)
- time(time)datetime64[ns]2007-01-01 ... 2009-12-31T23:00:00
array(['2007-01-01T00:00:00.000000000', '2007-01-01T01:00:00.000000000',
       '2007-01-01T02:00:00.000000000', ..., '2009-12-31T21:00:00.000000000',
       '2009-12-31T21:59:44.000000000', '2009-12-31T23:00:00.000000000'],
      dtype='datetime64[ns]')
- DFrI_TH(time, latitude)float32dask.array<chunksize=(1866, 1), meta=np.ndarray>
Array Chunk Bytes 411.00 kiB 23.44 kiB Shape (26304, 4) (6000, 1) Count 14111 Tasks 24 Chunks Type float32 numpy.ndarray - KPPdiffKzT(time, latitude)float32dask.array<chunksize=(1866, 1), meta=np.ndarray>
Array Chunk Bytes 411.00 kiB 23.44 kiB Shape (26304, 4) (6000, 1) Count 14111 Tasks 24 Chunks Type float32 numpy.ndarray - KPPg_TH(time, latitude)float32dask.array<chunksize=(1866, 1), meta=np.ndarray>
Array Chunk Bytes 411.00 kiB 23.44 kiB Shape (26304, 4) (6000, 1) Count 26987 Tasks 24 Chunks Type float32 numpy.ndarray - KPPhbl(time, latitude)float32dask.array<chunksize=(1866, 1), meta=np.ndarray>
Array Chunk Bytes 411.00 kiB 23.44 kiB Shape (26304, 4) (6000, 1) Count 14039 Tasks 24 Chunks Type float32 numpy.ndarray - KPPviscAz(time, latitude)float32dask.array<chunksize=(1866, 1), meta=np.ndarray>
Array Chunk Bytes 411.00 kiB 23.44 kiB Shape (26304, 4) (6000, 1) Count 14111 Tasks 24 Chunks Type float32 numpy.ndarray - SSH(time, latitude)float32dask.array<chunksize=(1866, 1), meta=np.ndarray>
Array Chunk Bytes 411.00 kiB 23.44 kiB Shape (26304, 4) (6000, 1) Count 14039 Tasks 24 Chunks Type float32 numpy.ndarray - VISrI_Um(time, latitude)float32dask.array<chunksize=(1866, 1), meta=np.ndarray>
Array Chunk Bytes 411.00 kiB 23.44 kiB Shape (26304, 4) (6000, 1) Count 14111 Tasks 24 Chunks Type float32 numpy.ndarray - VISrI_Vm(time, latitude)float32dask.array<chunksize=(1866, 1), meta=np.ndarray>
Array Chunk Bytes 411.00 kiB 23.44 kiB Shape (26304, 4) (6000, 1) Count 14111 Tasks 24 Chunks Type float32 numpy.ndarray - salt(time, latitude)float32dask.array<chunksize=(1866, 1), meta=np.ndarray>
Array Chunk Bytes 411.00 kiB 23.44 kiB Shape (26304, 4) (6000, 1) Count 14111 Tasks 24 Chunks Type float32 numpy.ndarray - theta(time, latitude)float32dask.array<chunksize=(1866, 1), meta=np.ndarray>
Array Chunk Bytes 411.00 kiB 23.44 kiB Shape (26304, 4) (6000, 1) Count 14111 Tasks 24 Chunks Type float32 numpy.ndarray - u(time, latitude)float32dask.array<chunksize=(1866, 1), meta=np.ndarray>
Array Chunk Bytes 411.00 kiB 23.44 kiB Shape (26304, 4) (6000, 1) Count 14111 Tasks 24 Chunks Type float32 numpy.ndarray - v(time, latitude)float32dask.array<chunksize=(1866, 1), meta=np.ndarray>
Array Chunk Bytes 411.00 kiB 23.44 kiB Shape (26304, 4) (6000, 1) Count 14111 Tasks 24 Chunks Type float32 numpy.ndarray - w(time, latitude)float32dask.array<chunksize=(1866, 1), meta=np.ndarray>
Array Chunk Bytes 411.00 kiB 23.44 kiB Shape (26304, 4) (6000, 1) Count 14111 Tasks 24 Chunks Type float32 numpy.ndarray - Jq_shear(time, latitude)float64dask.array<chunksize=(1866, 1), meta=np.ndarray>
Array Chunk Bytes 822.00 kiB 46.88 kiB Shape (26304, 4) (6000, 1) Count 35876 Tasks 24 Chunks Type float64 numpy.ndarray - nonlocal_flux(time, latitude)float64dask.array<chunksize=(1866, 1), meta=np.ndarray>
Array Chunk Bytes 822.00 kiB 46.88 kiB Shape (26304, 4) (6000, 1) Count 35876 Tasks 24 Chunks Type float64 numpy.ndarray - dens(time, latitude)float32dask.array<chunksize=(1866, 1), meta=np.ndarray>
Array Chunk Bytes 411.00 kiB 23.44 kiB Shape (26304, 4) (6000, 1) Count 35601 Tasks 24 Chunks Type float32 numpy.ndarray - mld(time, latitude)float32dask.array<chunksize=(1866, 1), meta=np.ndarray>
- long_name :
- MLD
- units :
- m
- description :
- Interpolate density to 1m grid. Search for max depth where |drho| > 0.015 and N2 > 1e-05
Array Chunk Bytes 411.00 kiB 23.44 kiB Shape (26304, 4) (6000, 1) Count 108494 Tasks 24 Chunks Type float32 numpy.ndarray - Jq(time, latitude)float64dask.array<chunksize=(1866, 1), meta=np.ndarray>
Array Chunk Bytes 822.00 kiB 46.88 kiB Shape (26304, 4) (6000, 1) Count 70241 Tasks 24 Chunks Type float64 numpy.ndarray - dJdz(time, latitude)float64dask.array<chunksize=(1866, 1), meta=np.ndarray>
Array Chunk Bytes 822.00 kiB 46.88 kiB Shape (26304, 4) (6000, 1) Count 95993 Tasks 24 Chunks Type float64 numpy.ndarray - dTdt(time, latitude)float64dask.array<chunksize=(1866, 1), meta=np.ndarray>
- long_name :
- $∂T/∂t = -1/(ρ_0c_p) ∂J_q/∂z$
- units :
- °C/month
Array Chunk Bytes 822.00 kiB 46.88 kiB Shape (26304, 4) (6000, 1) Count 117453 Tasks 24 Chunks Type float64 numpy.ndarray - enso(time)<U8'Neutral' 'Neutral' ... 'El-Nino'
- description :
- ENSO phase; El-Nino = NINO34 SSTA > 0.4 for at least 6 months; La-Nina = NINO34 SSTA < -0.4 for at least 6 months
array(['Neutral', 'Neutral', 'Neutral', ..., 'El-Nino', 'El-Nino', 'El-Nino'], dtype='<U8') - strvy(time, latitude)float64dask.array<chunksize=(1866, 1), meta=np.ndarray>
- long_name :
- $u_z^2 * v_y$
Array Chunk Bytes 822.00 kiB 46.88 kiB Shape (26304, 4) (6000, 1) Count 128169 Tasks 24 Chunks Type float64 numpy.ndarray - strux(time, latitude)float64dask.array<chunksize=(1866, 1), meta=np.ndarray>
- long_name :
- $v_z^2 * u_x$
Array Chunk Bytes 822.00 kiB 46.88 kiB Shape (26304, 4) (6000, 1) Count 124689 Tasks 24 Chunks Type float64 numpy.ndarray - tiltuy(time, latitude)float64dask.array<chunksize=(1866, 1), meta=np.ndarray>
- long_name :
- $-u_y u_z v_z$
Array Chunk Bytes 822.00 kiB 46.88 kiB Shape (26304, 4) (6000, 1) Count 164281 Tasks 24 Chunks Type float64 numpy.ndarray - tiltvx(time, latitude)float64dask.array<chunksize=(1866, 1), meta=np.ndarray>
- long_name :
- $- v_x u_z v_z$
Array Chunk Bytes 822.00 kiB 46.88 kiB Shape (26304, 4) (6000, 1) Count 160801 Tasks 24 Chunks Type float64 numpy.ndarray - ux(time, latitude)float64dask.array<chunksize=(1866, 1), meta=np.ndarray>
- long_name :
- $u_x$
Array Chunk Bytes 822.00 kiB 46.88 kiB Shape (26304, 4) (6000, 1) Count 70204 Tasks 24 Chunks Type float64 numpy.ndarray - vx(time, latitude)float64dask.array<chunksize=(1866, 1), meta=np.ndarray>
- long_name :
- $v_x$
Array Chunk Bytes 822.00 kiB 46.88 kiB Shape (26304, 4) (6000, 1) Count 70204 Tasks 24 Chunks Type float64 numpy.ndarray - wx(time, latitude)float64dask.array<chunksize=(1866, 1), meta=np.ndarray>
- long_name :
- $w_x$
Array Chunk Bytes 822.00 kiB 46.88 kiB Shape (26304, 4) (6000, 1) Count 70204 Tasks 24 Chunks Type float64 numpy.ndarray - uy(time, latitude)float64dask.array<chunksize=(1866, 1), meta=np.ndarray>
- long_name :
- $u_y$
Array Chunk Bytes 822.00 kiB 46.88 kiB Shape (26304, 4) (6000, 1) Count 73684 Tasks 24 Chunks Type float64 numpy.ndarray - vy(time, latitude)float64dask.array<chunksize=(1866, 1), meta=np.ndarray>
- long_name :
- $v_y$
Array Chunk Bytes 822.00 kiB 46.88 kiB Shape (26304, 4) (6000, 1) Count 73684 Tasks 24 Chunks Type float64 numpy.ndarray - wy(time, latitude)float64dask.array<chunksize=(1866, 1), meta=np.ndarray>
- long_name :
- $w_y$
Array Chunk Bytes 822.00 kiB 46.88 kiB Shape (26304, 4) (6000, 1) Count 73684 Tasks 24 Chunks Type float64 numpy.ndarray - uz(time, latitude)float32dask.array<chunksize=(1866, 1), meta=np.ndarray>
- long_name :
- $u_z$
Array Chunk Bytes 411.00 kiB 23.44 kiB Shape (26304, 4) (6000, 1) Count 53027 Tasks 24 Chunks Type float32 numpy.ndarray - vz(time, latitude)float32dask.array<chunksize=(1866, 1), meta=np.ndarray>
- long_name :
- $v_z$
Array Chunk Bytes 411.00 kiB 23.44 kiB Shape (26304, 4) (6000, 1) Count 53027 Tasks 24 Chunks Type float32 numpy.ndarray - wz(time, latitude)float32dask.array<chunksize=(1866, 1), meta=np.ndarray>
- long_name :
- $w_z$
Array Chunk Bytes 411.00 kiB 23.44 kiB Shape (26304, 4) (6000, 1) Count 53027 Tasks 24 Chunks Type float32 numpy.ndarray
- easting :
- longitude
- northing :
- latitude
- title :
- Station profile, index (i,j)=(1201,240)
%aimport dask_groupby.core
%aimport dask_groupby.xarray
from dask_groupby.xarray import resample_reduce
%aimport dcpy.ts
daily = resample_reduce(subset.resample(time="D"), func="mean").compute()
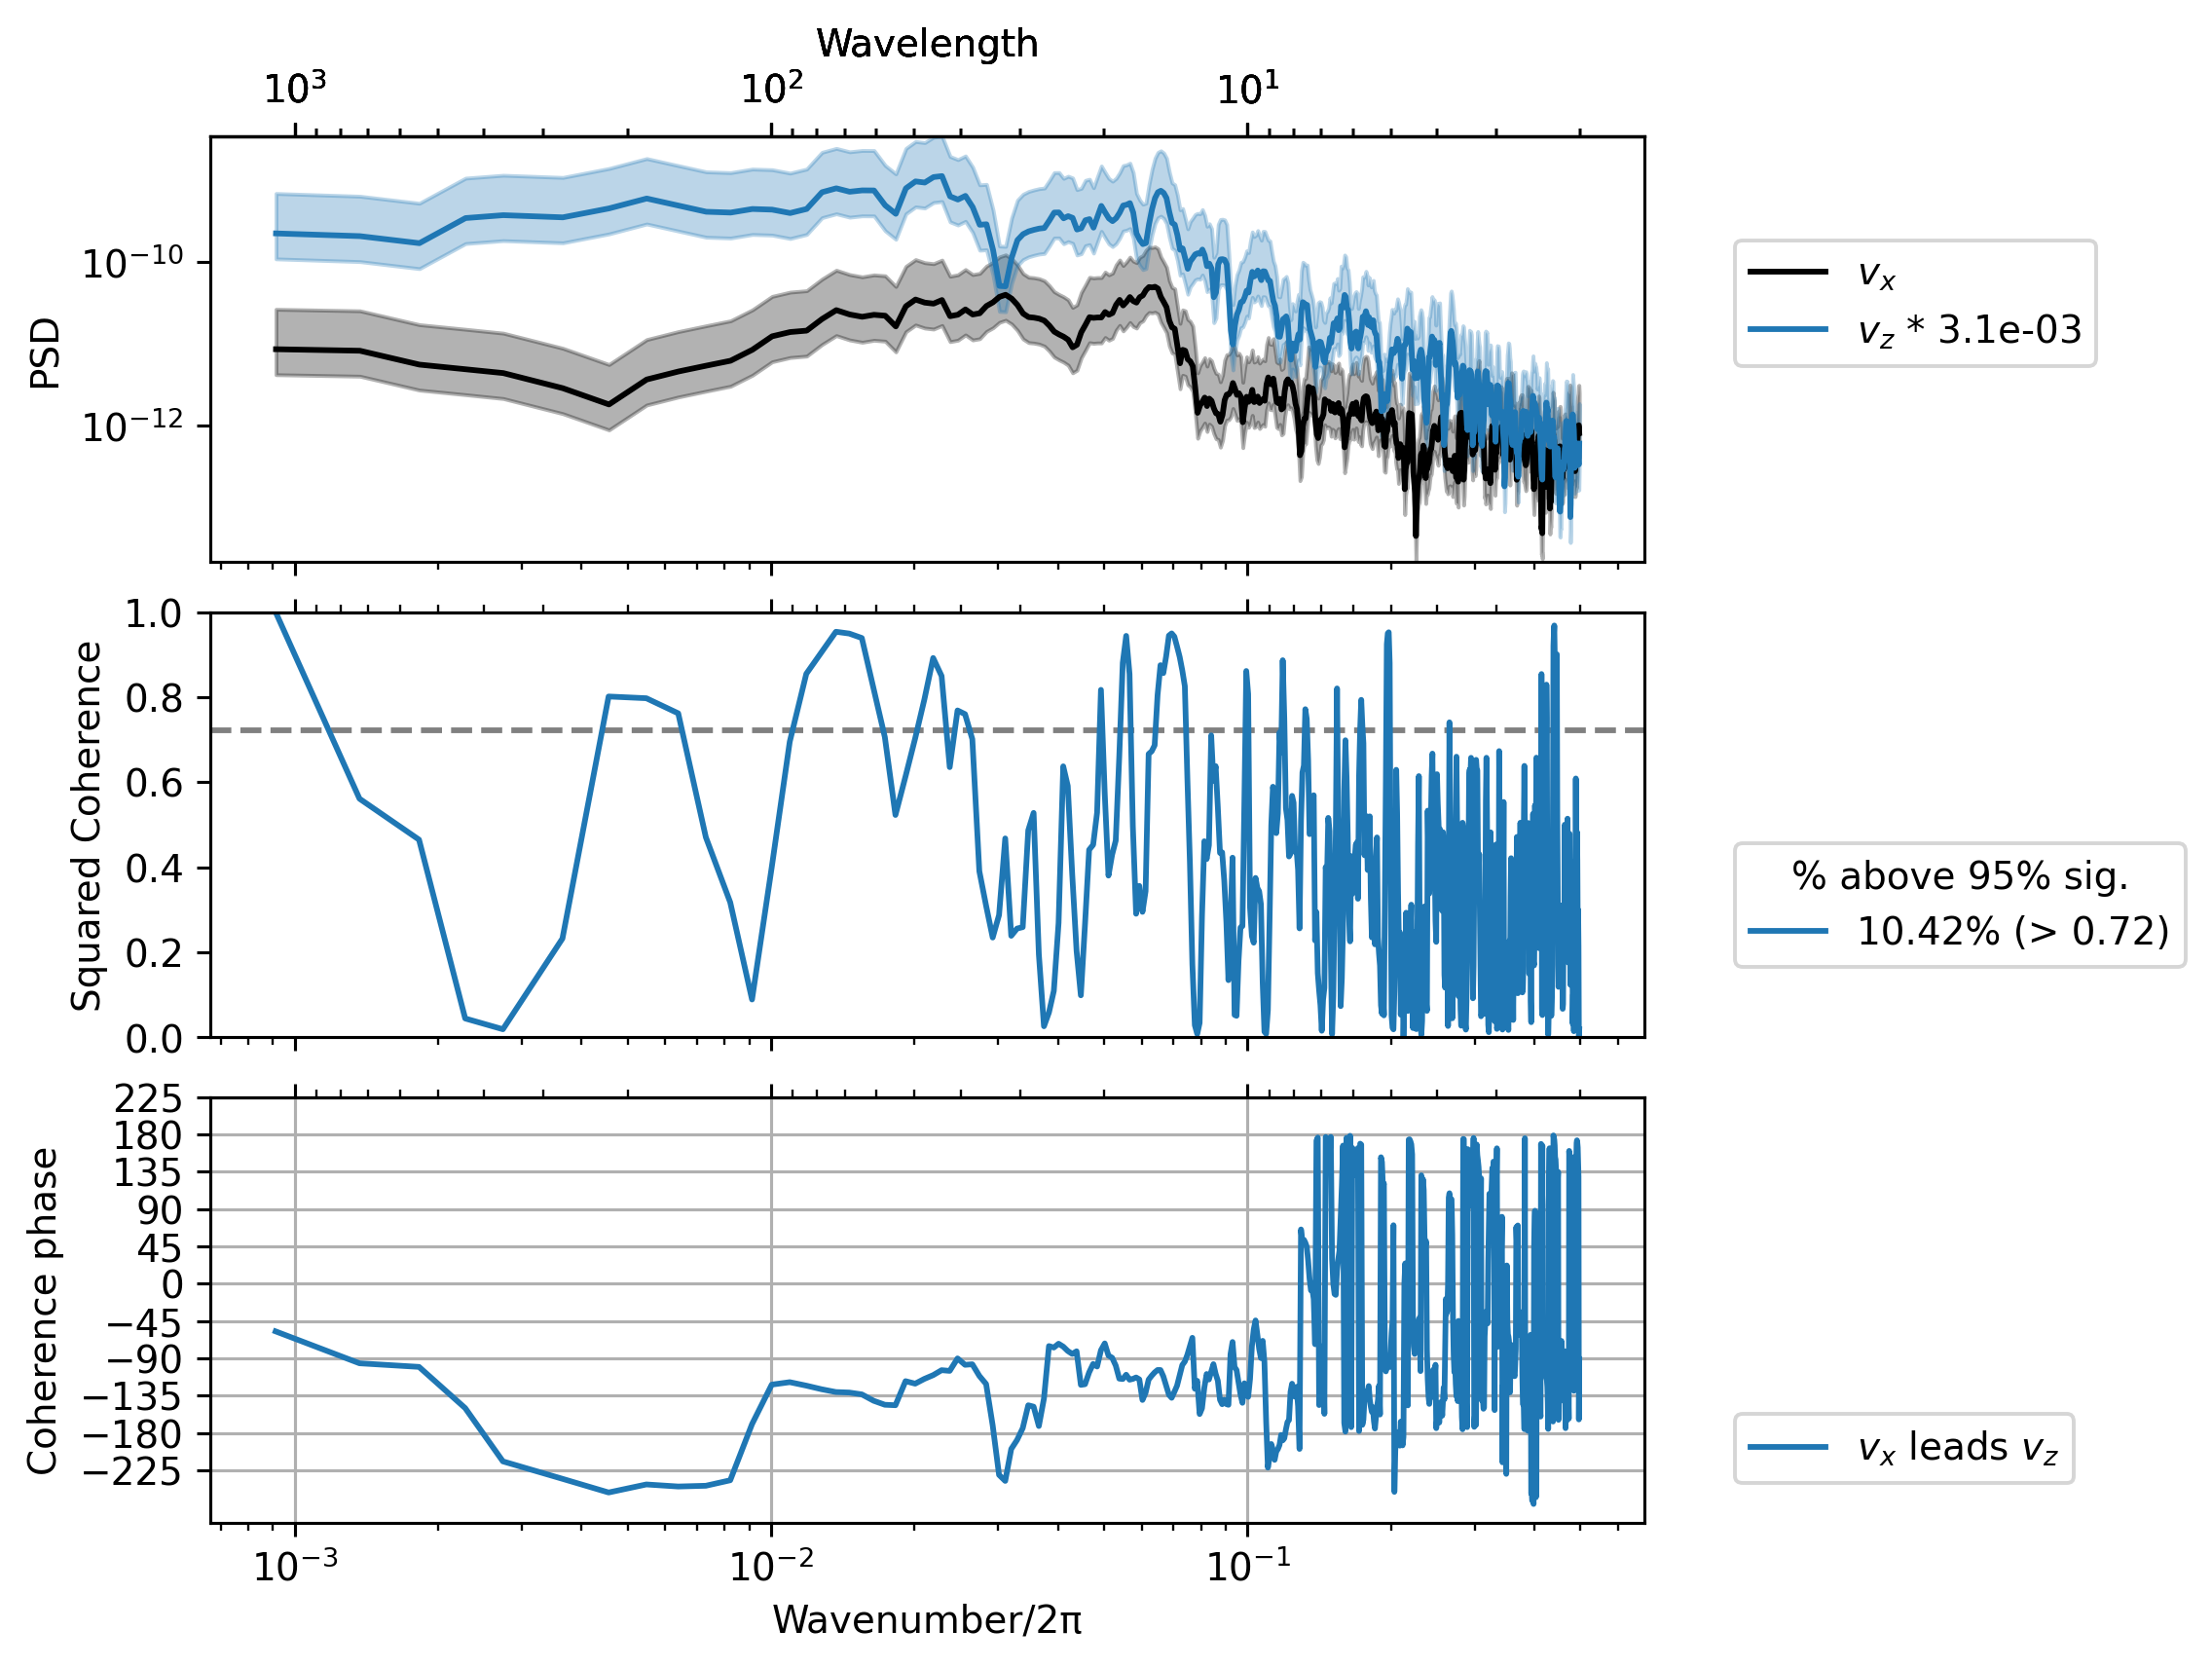
dcpy.ts.PlotCoherence(sub.vx, sub.vz, unwrap=True);
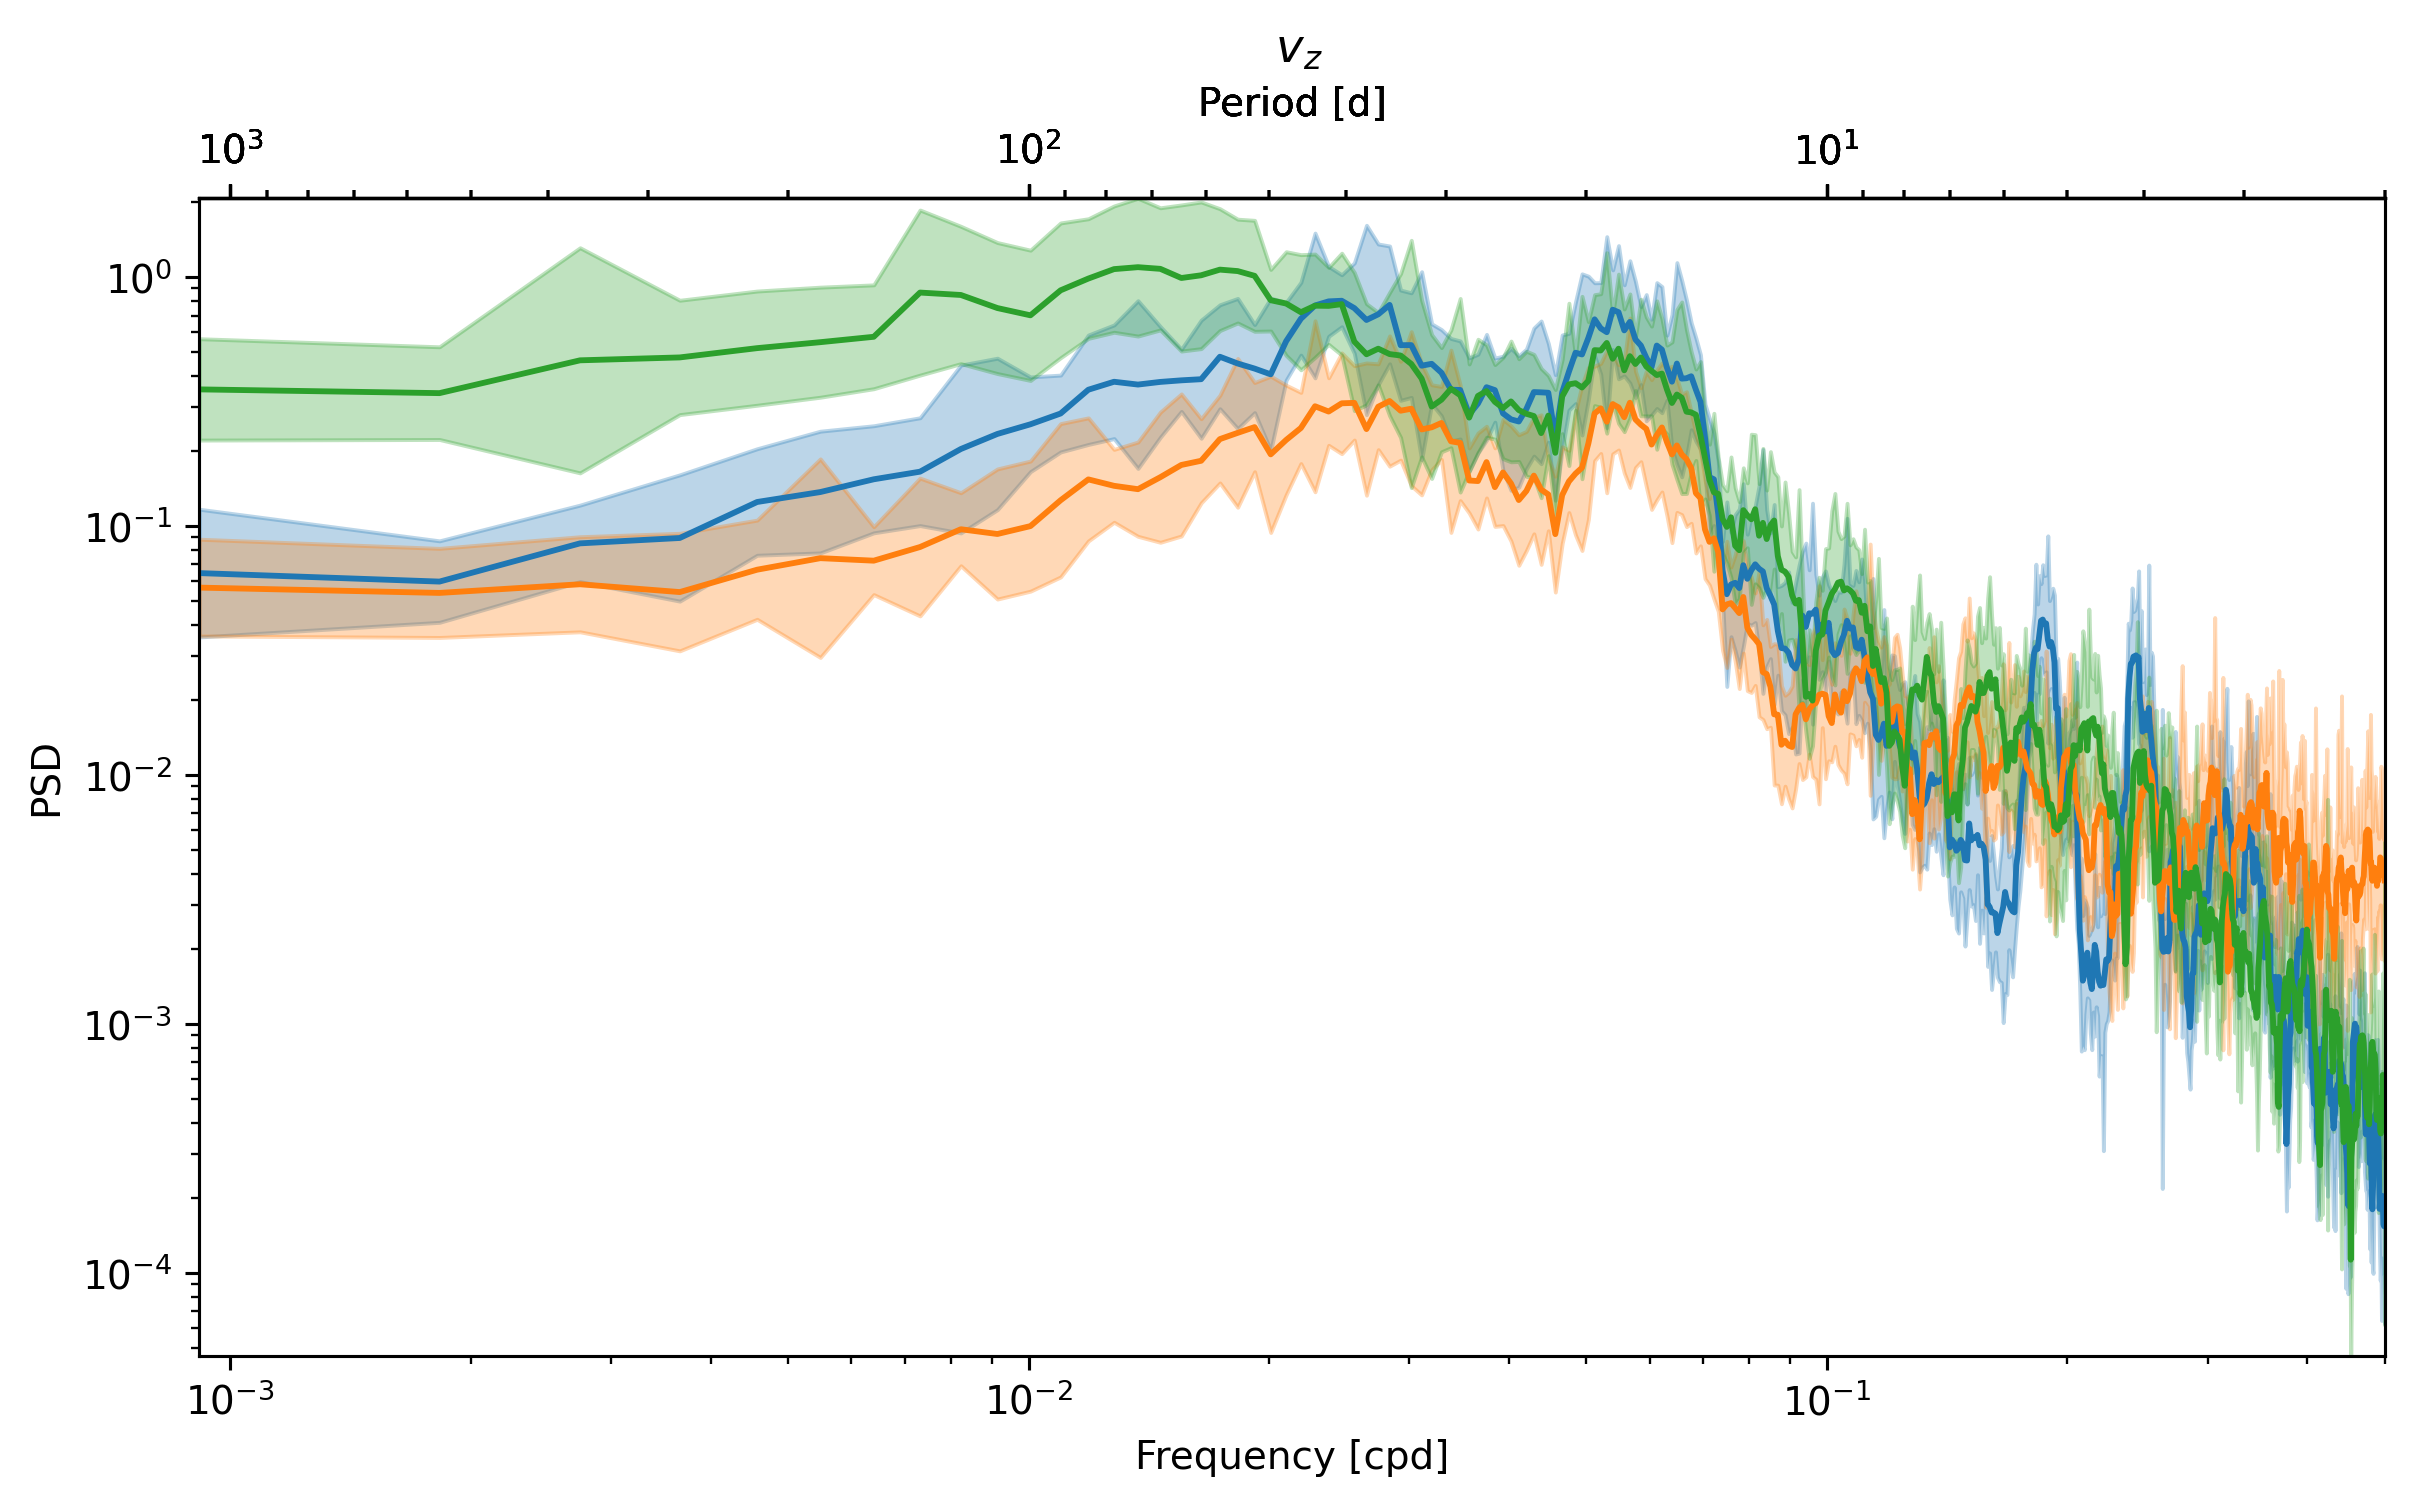
Need indicators for phenomena#
sub = daily.sel(latitude=0, method="nearest")
_, ax = dcpy.ts.PlotSpectrum(sub.v)
dcpy.ts.PlotSpectrum(sub.vx * 1e5, ax=ax)
dcpy.ts.PlotSpectrum(sub.vz * 100, ax=ax)
([<matplotlib.lines.Line2D at 0x2ac4e9310ca0>],
 <AxesSubplot:title={'center':' $v_y$'}, xlabel='Frequency [cpd]', ylabel='PSD'>)
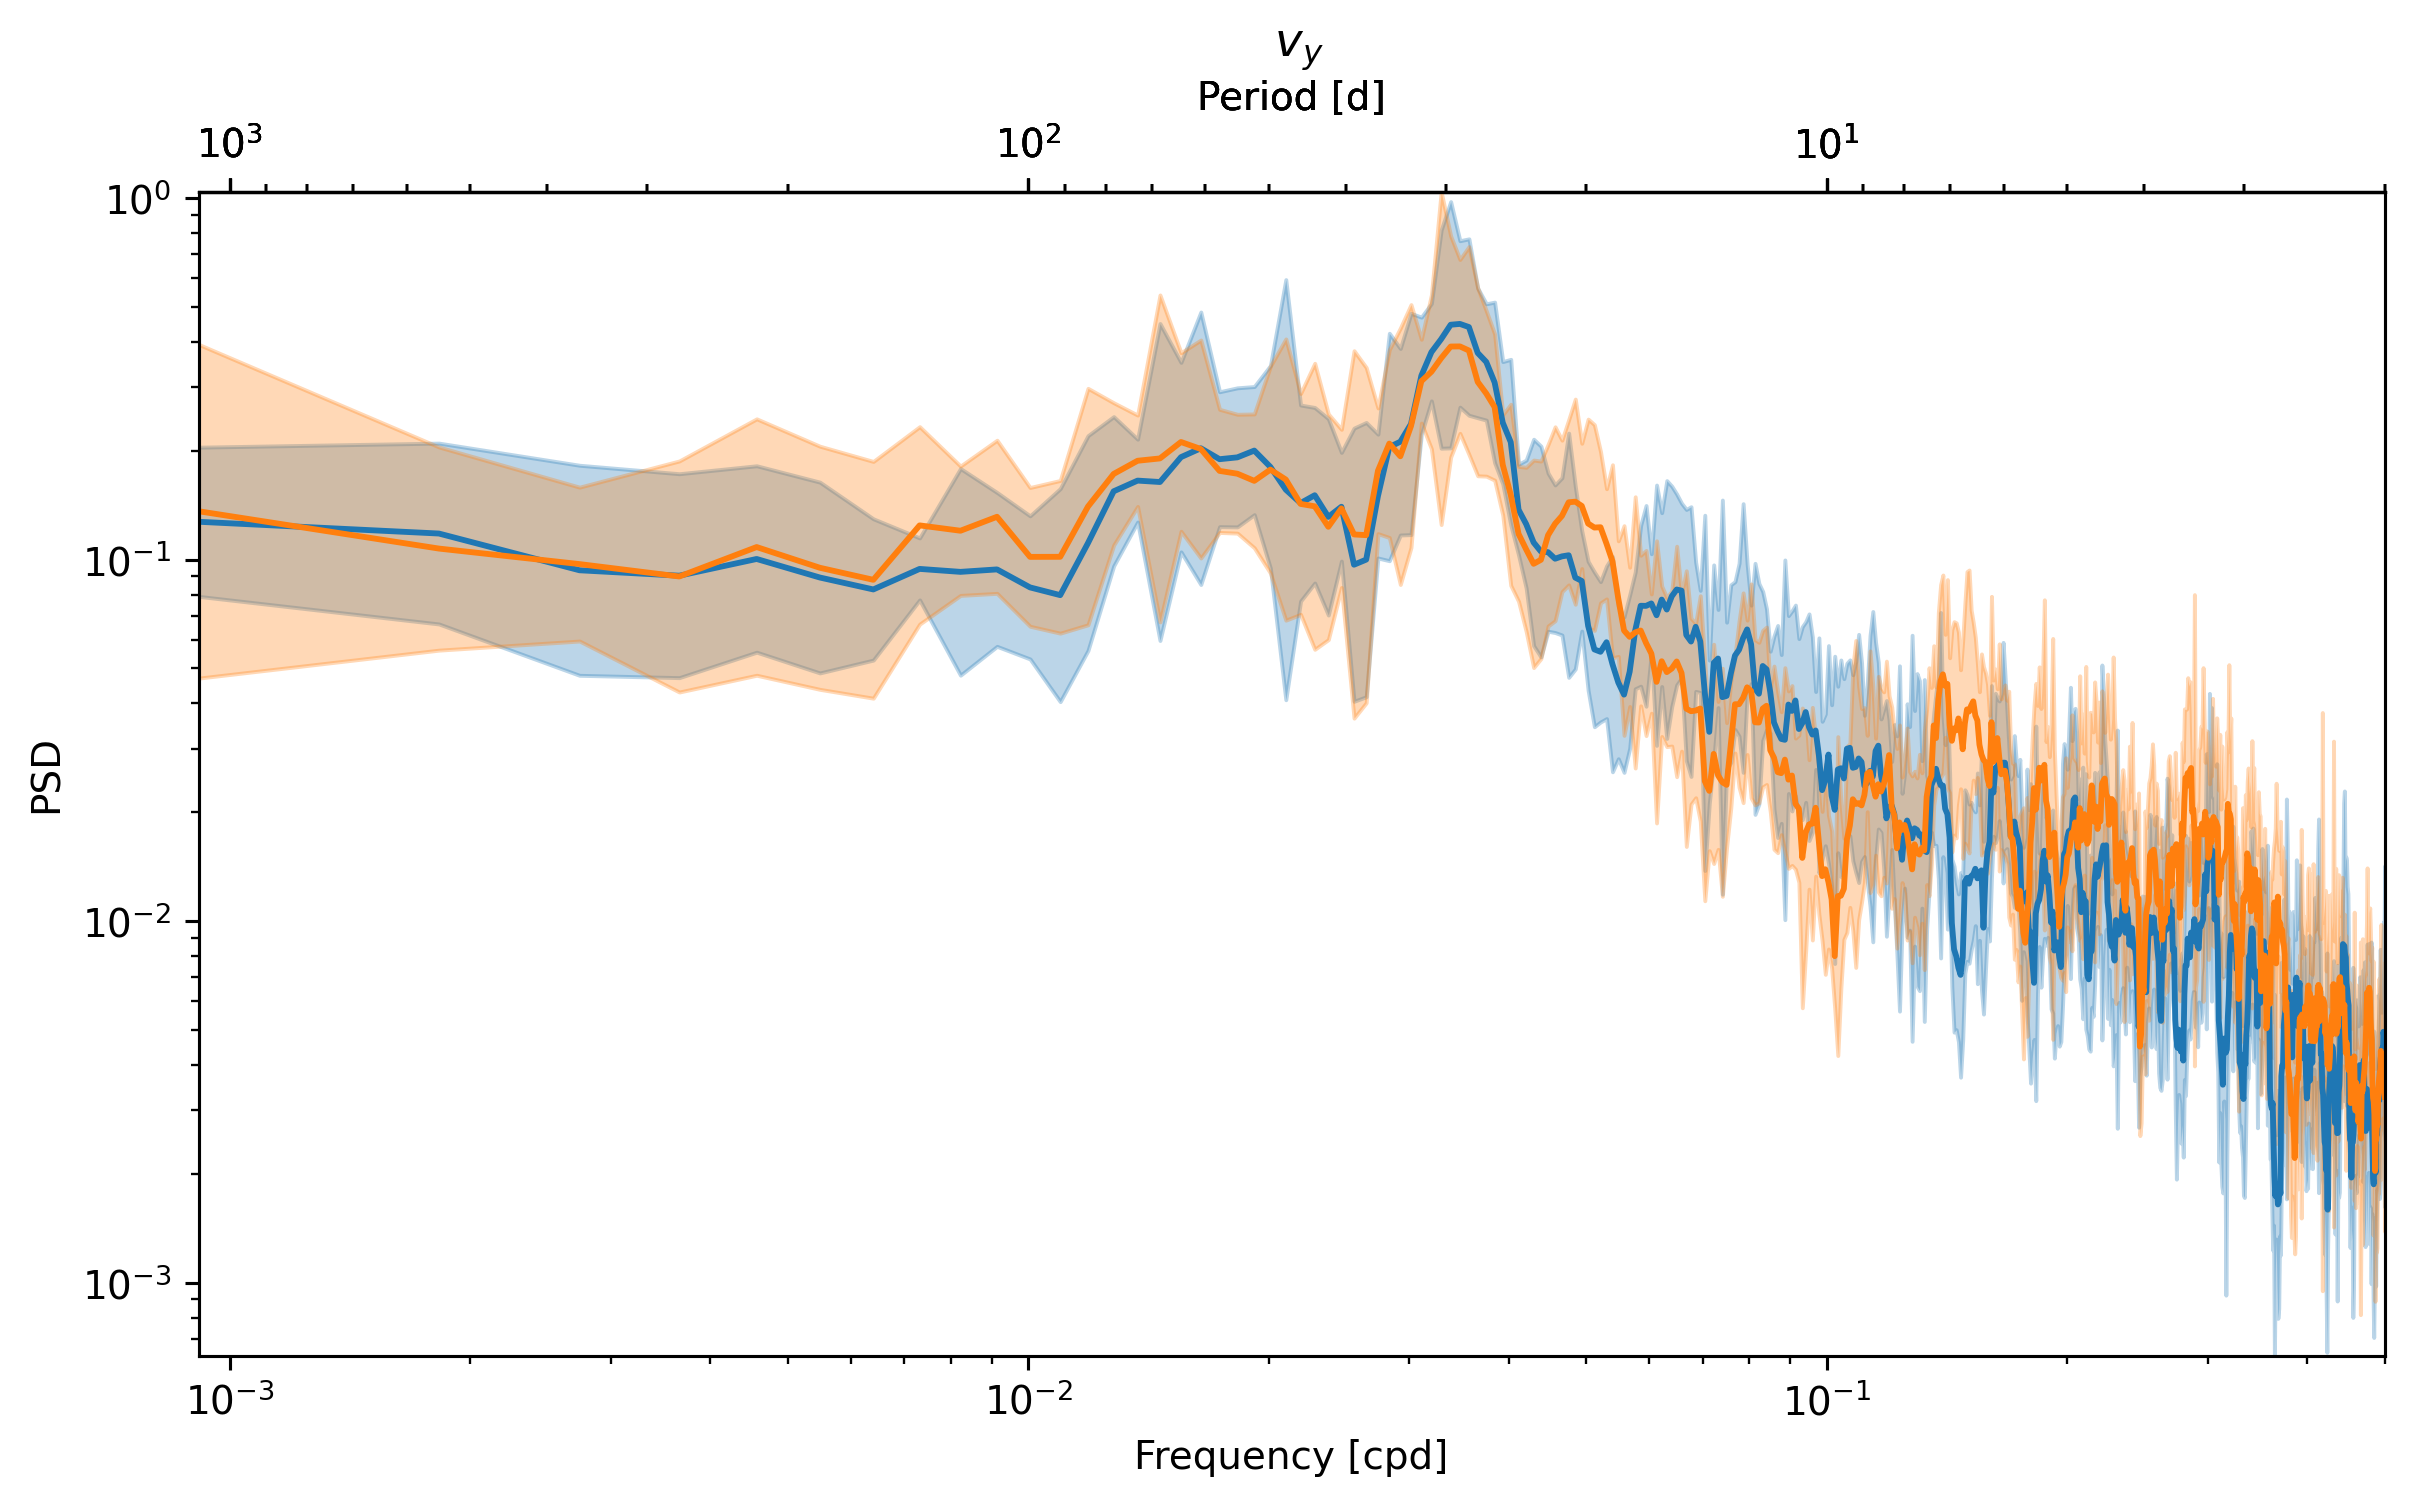
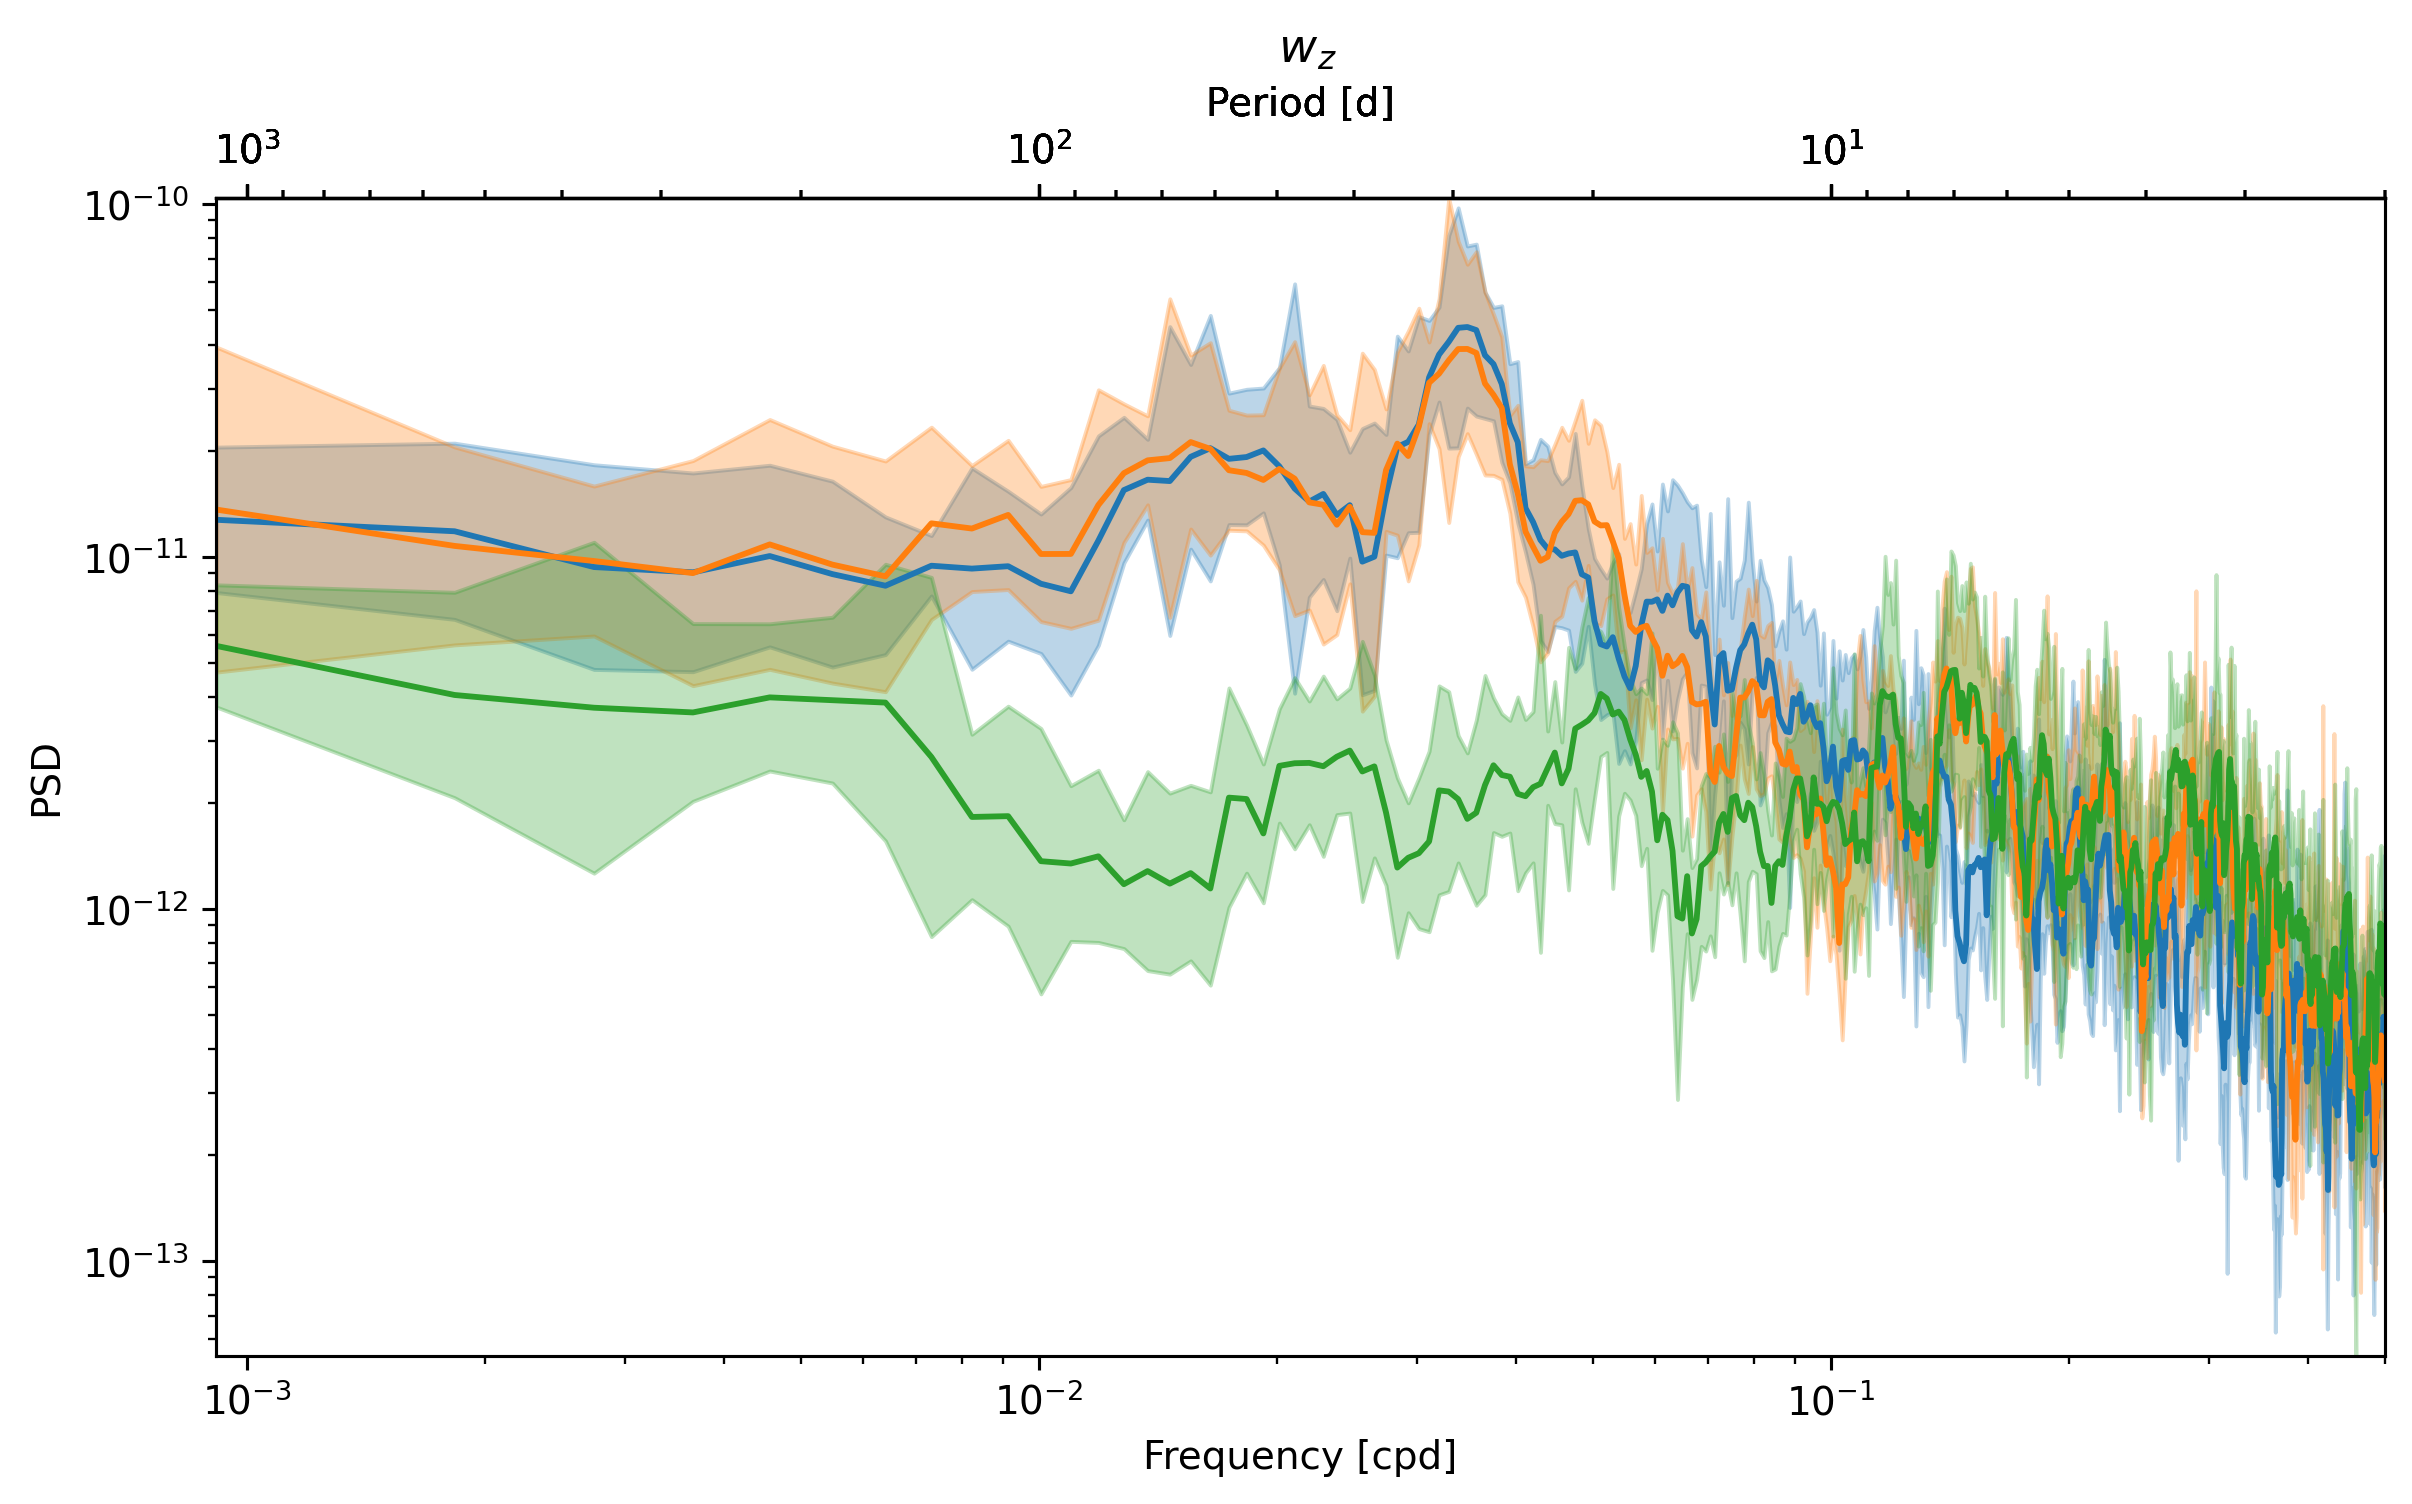
Divergence terms#
What is happening at 7 day periods? \(v_y \sim w_z\)?
sub = daily.sel(latitude=0, method="nearest")
_, ax = dcpy.ts.PlotSpectrum(sub.ux)
dcpy.ts.PlotSpectrum(sub.vy, ax=ax)
dcpy.ts.PlotSpectrum(sub.wz, ax=ax)
([<matplotlib.lines.Line2D at 0x2ac4e84ef610>],
 <AxesSubplot:title={'center':' $w_z$'}, xlabel='Frequency [cpd]', ylabel='PSD'>)
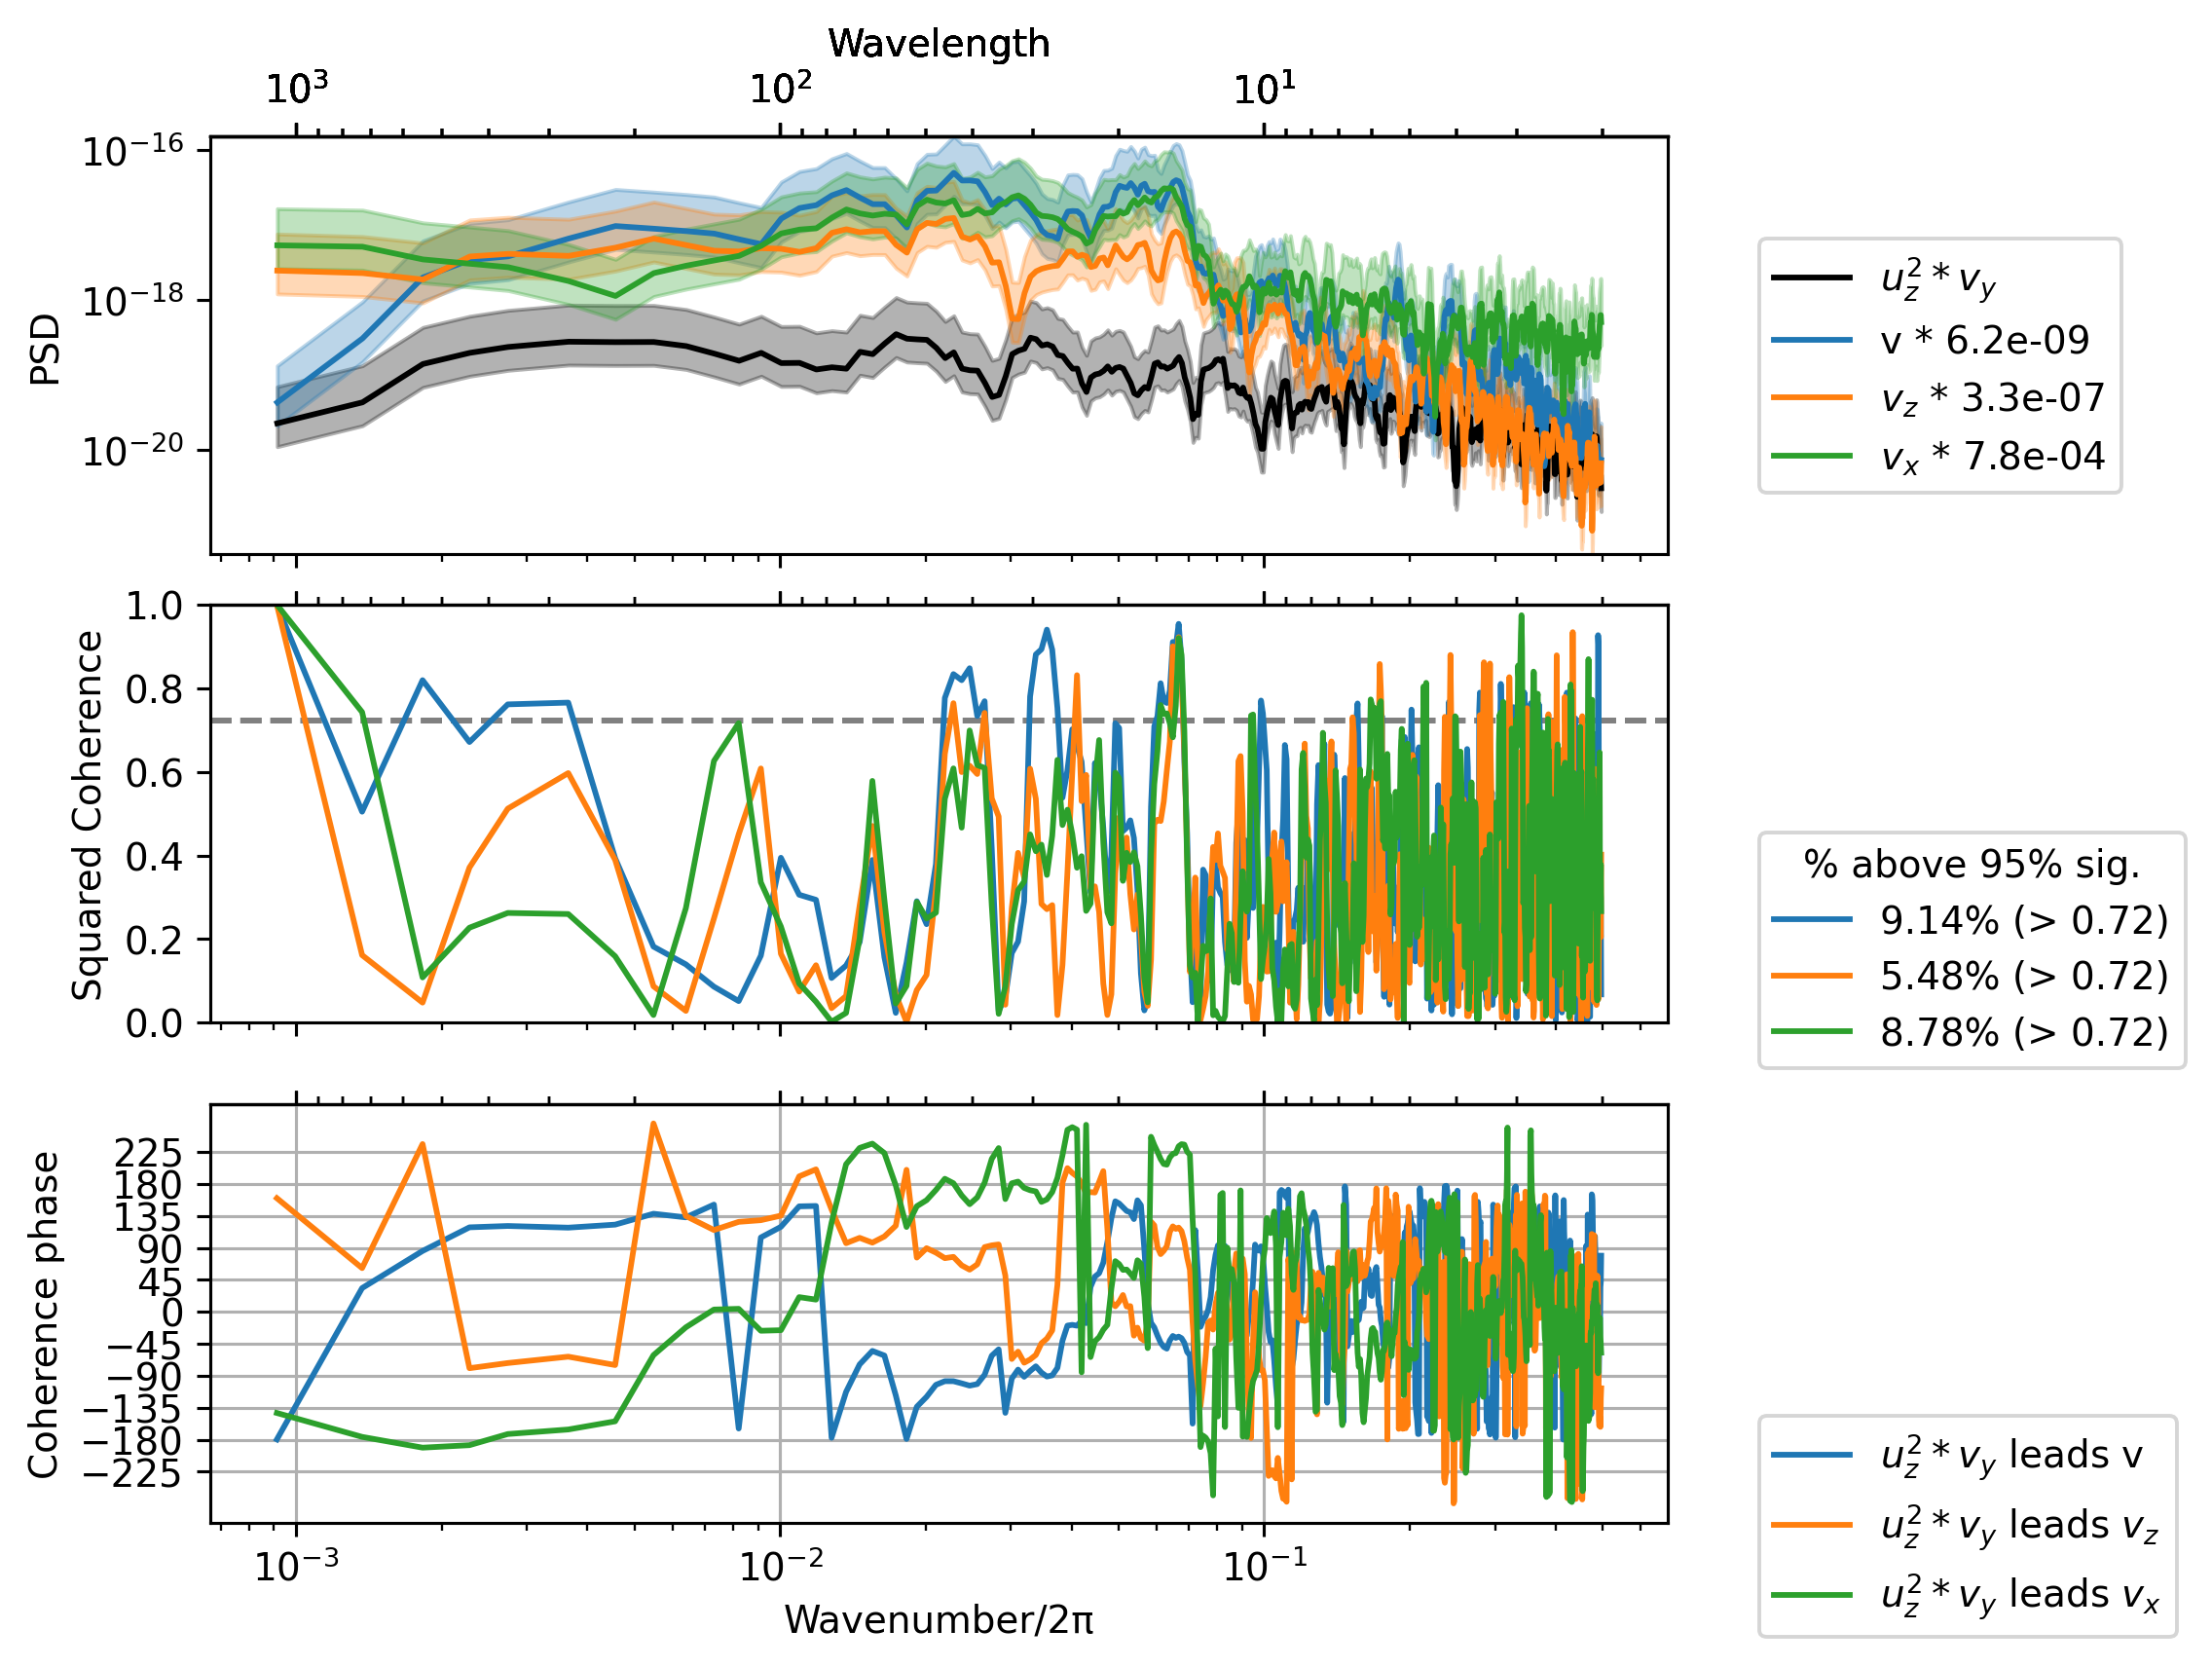
Holmes et al: vortex stretching term \(u_z v_y\) intensifies \(-u_z\)#
sub = daily.sel(latitude=0, method="nearest")
term = sub.strvy
_, ax = dcpy.ts.PlotCoherence(term, sub.v)
dcpy.ts.PlotCoherence(term, sub.vz, ax=ax, ploty0=False, unwrap=True)
dcpy.ts.PlotCoherence(term, sub.vx, ax=ax, ploty0=False, unwrap=True);
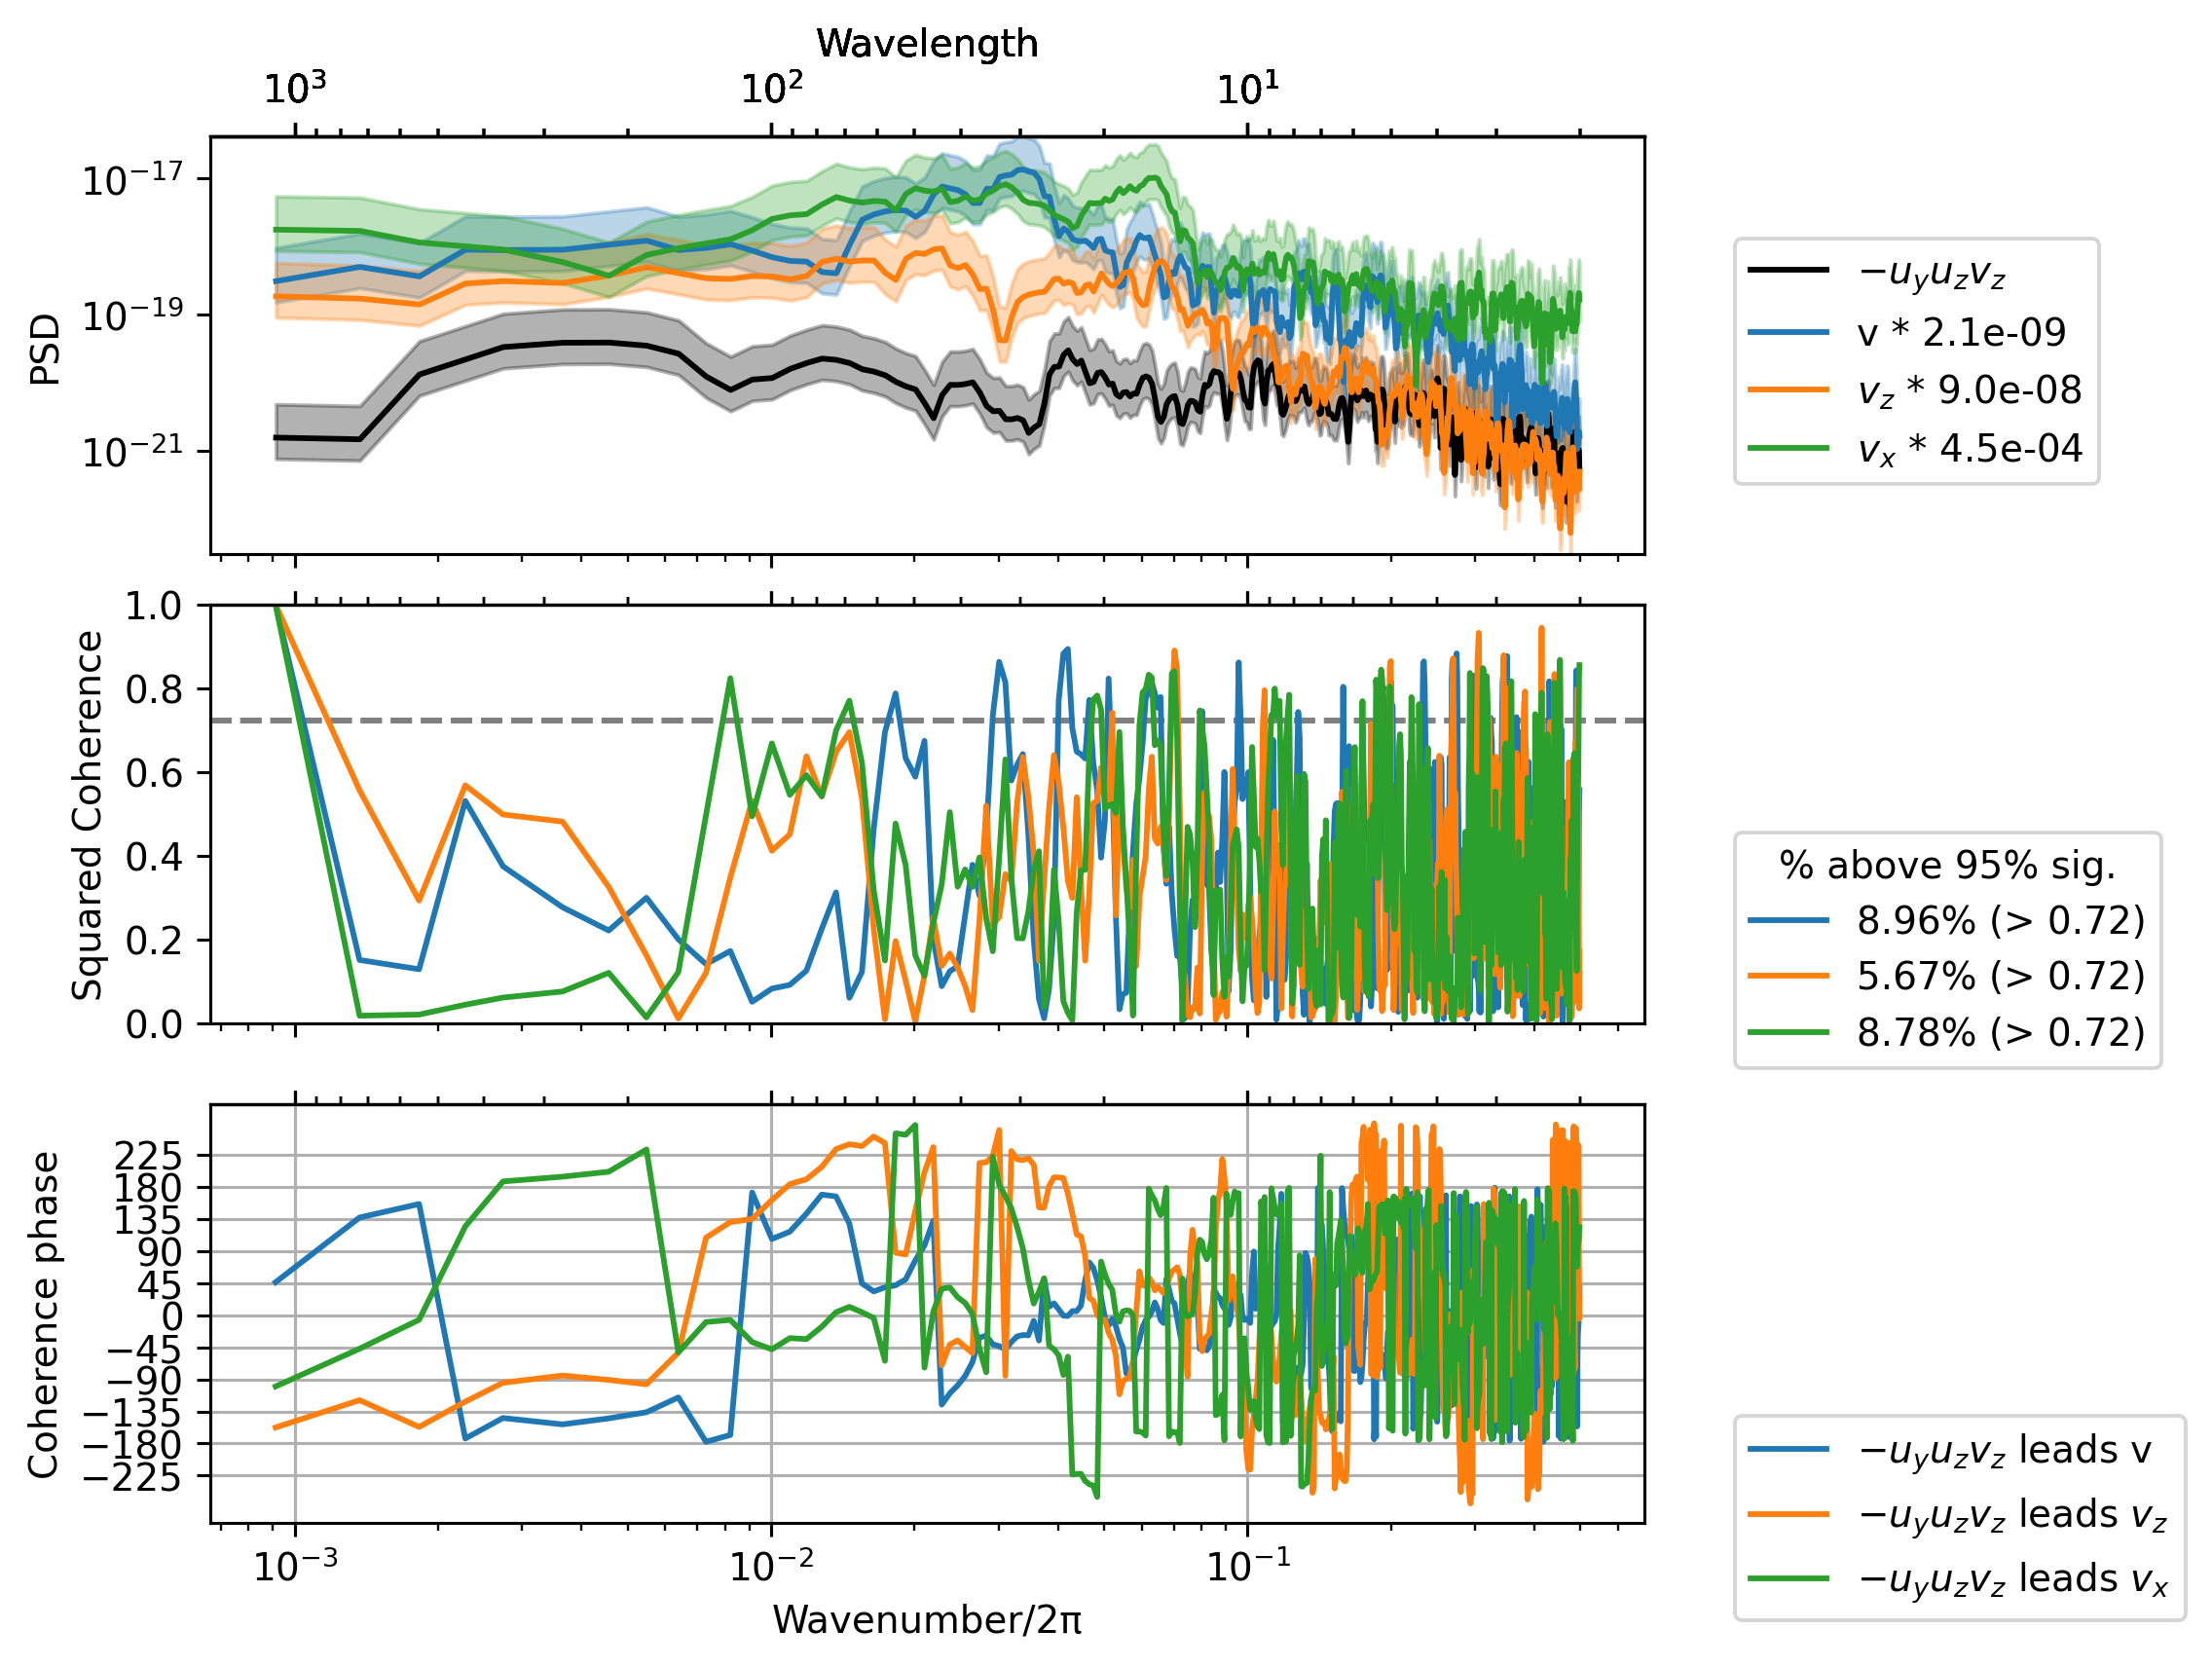
Cherian et al: vortex tilting term \(-u_y u_z\) rotates \(u_z\) to create \(v_z\) off the equator#
sub = daily.sel(latitude=3, method="nearest")

term = sub.tiltuy
_, ax = dcpy.ts.PlotCoherence(term, sub.v)
dcpy.ts.PlotCoherence(
    term,
    daily.vz.sel(latitude=0, method="nearest"),
    ax=ax,
    ploty0=False,
    unwrap=True,
)
dcpy.ts.PlotCoherence(
    term,
    daily.vx.sel(latitude=0, method="nearest"),
    ax=ax,
    ploty0=False,
    unwrap=True,
);
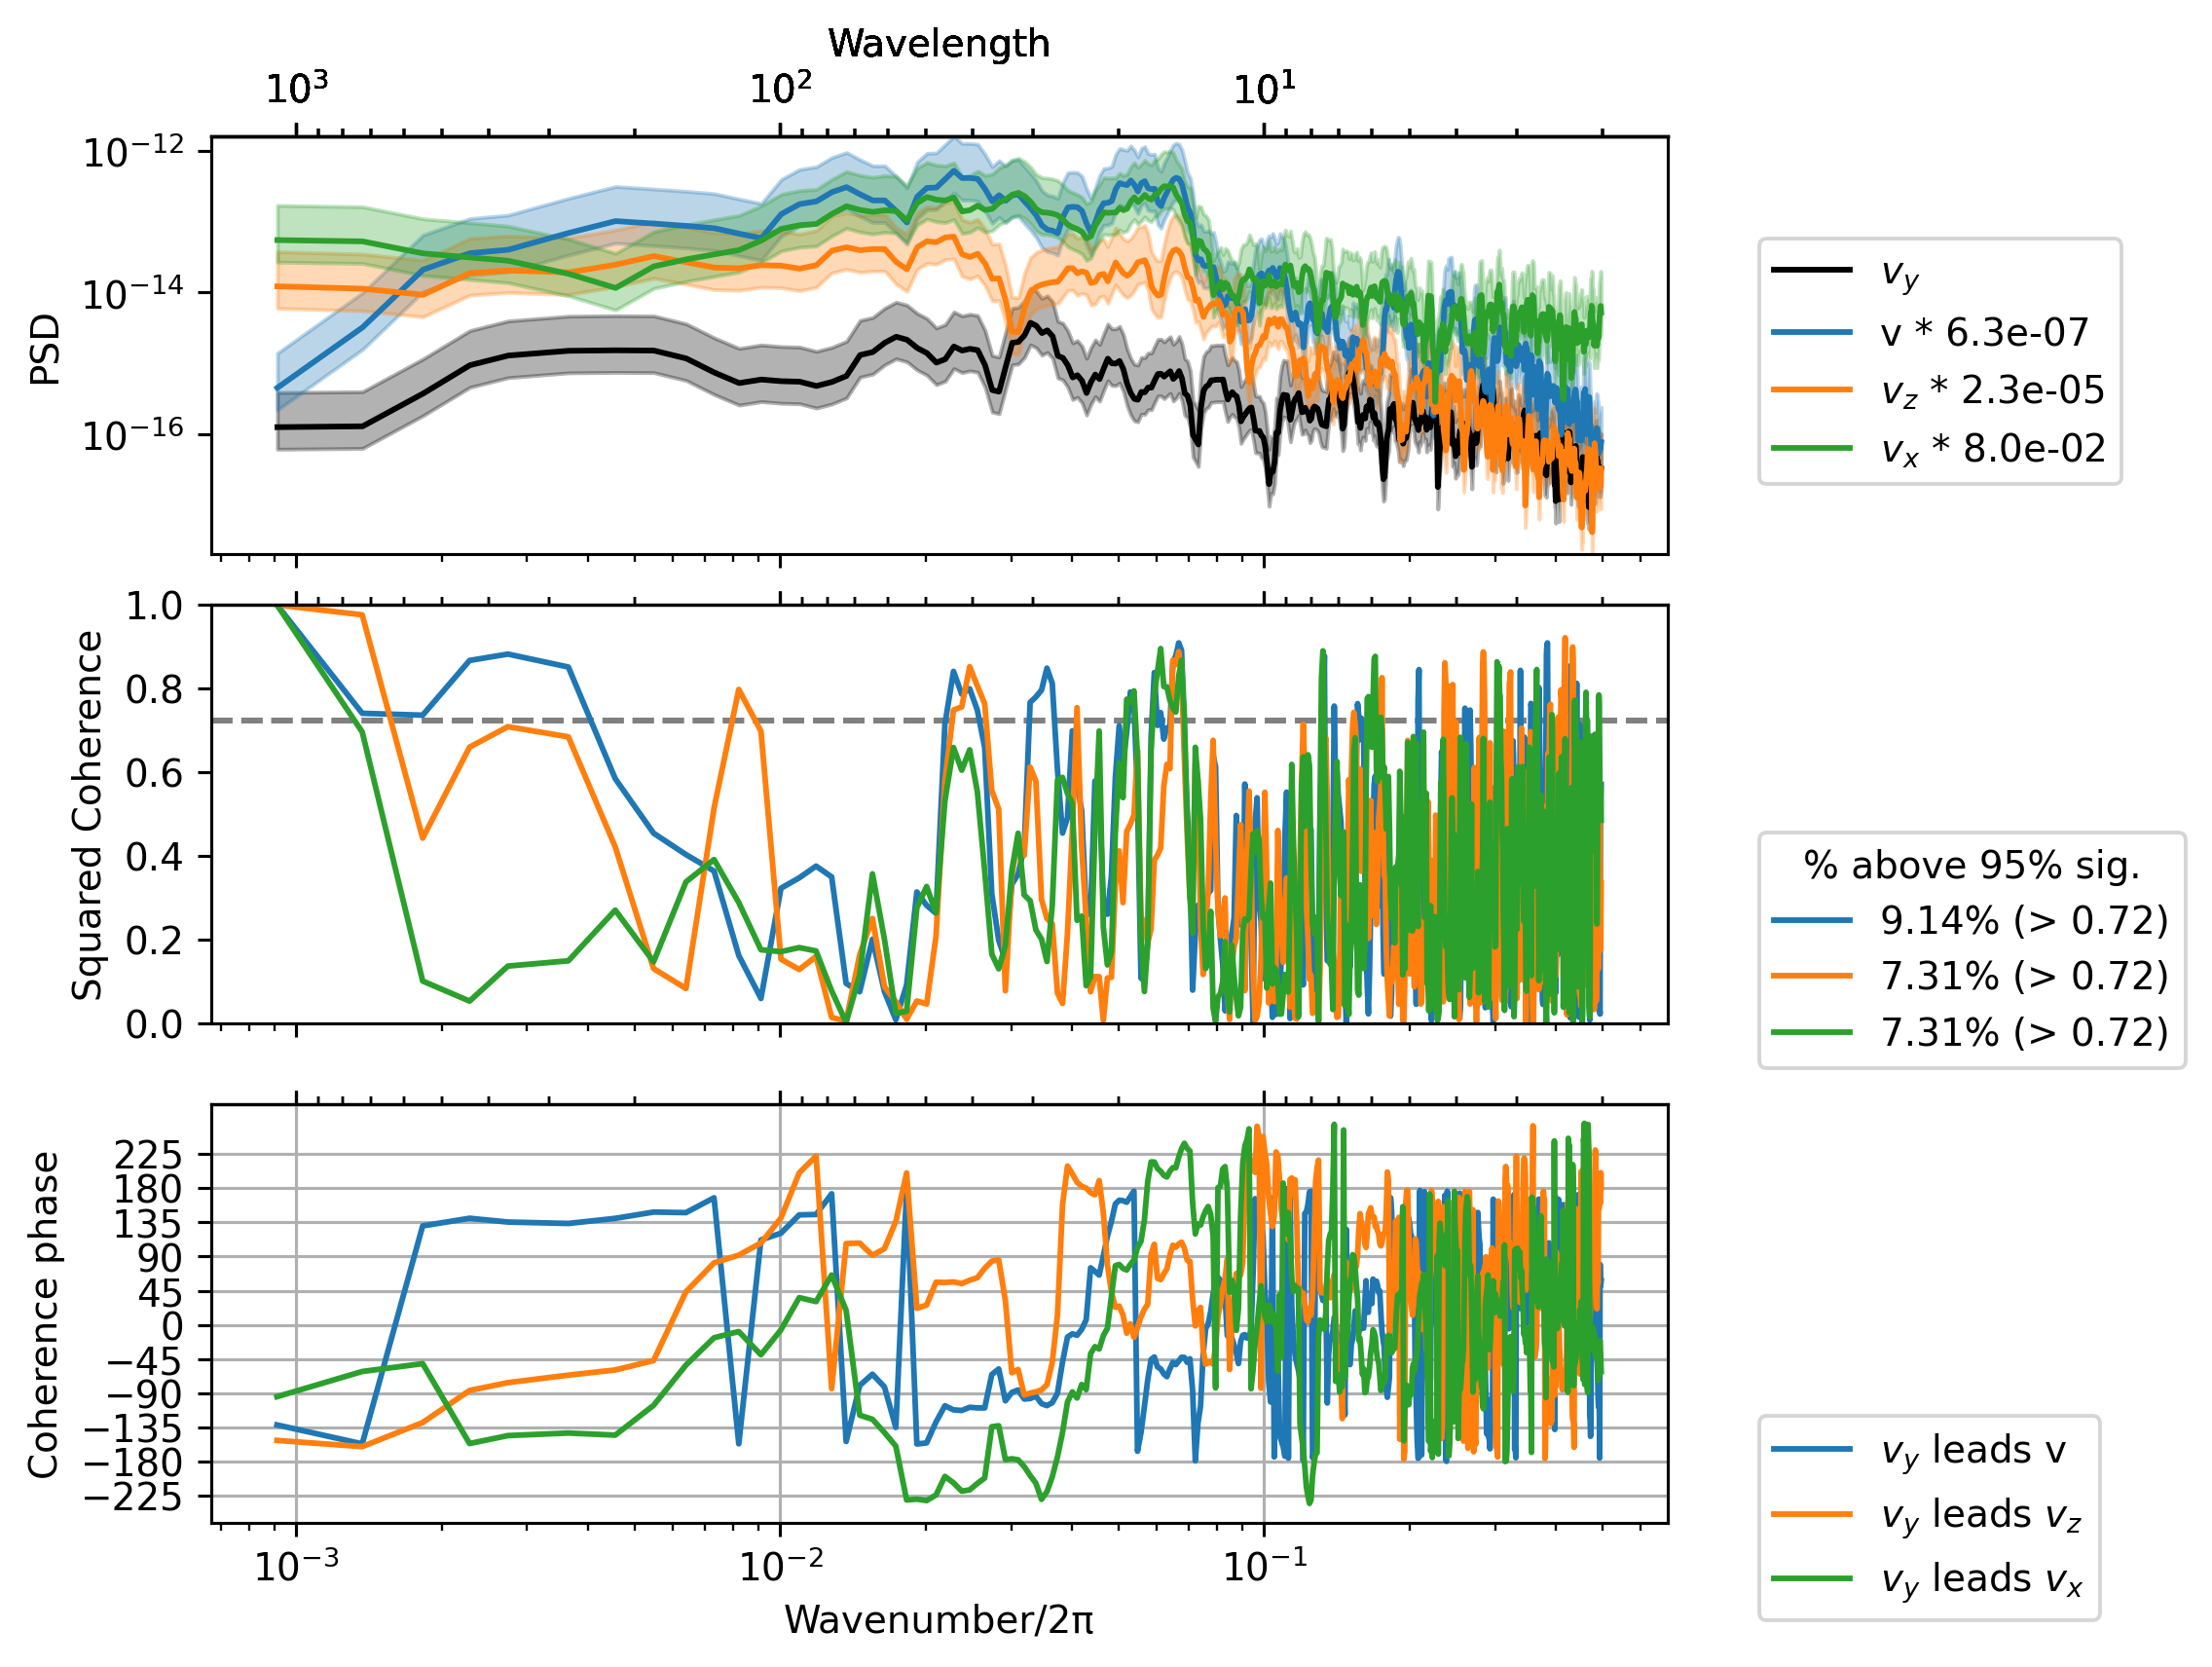
sub = daily.sel(latitude=0, method="nearest")

term = sub.vy * sub.uz
_, ax = dcpy.ts.PlotCoherence(term, sub.v)
dcpy.ts.PlotCoherence(
    term,
    daily.vz.sel(latitude=0, method="nearest"),
    ax=ax,
    ploty0=False,
    unwrap=True,
)
dcpy.ts.PlotCoherence(
    term,
    daily.vx.sel(latitude=0, method="nearest"),
    ax=ax,
    ploty0=False,
    unwrap=True,
);
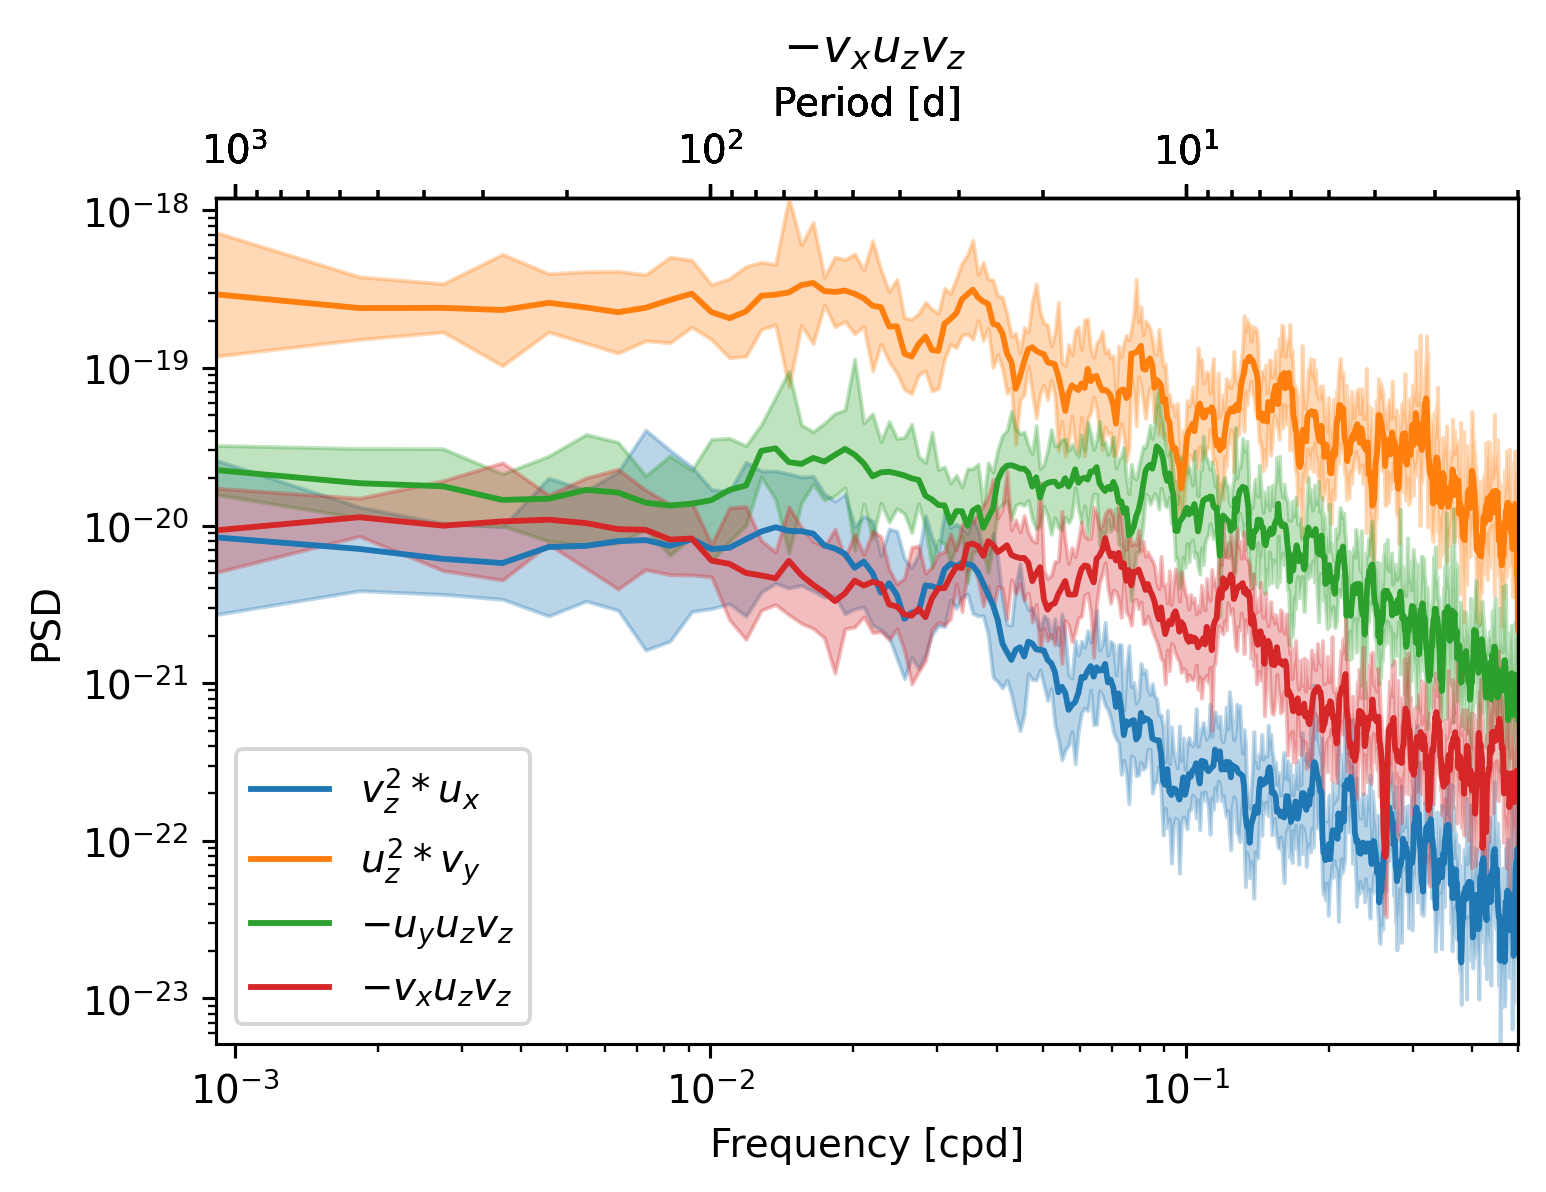
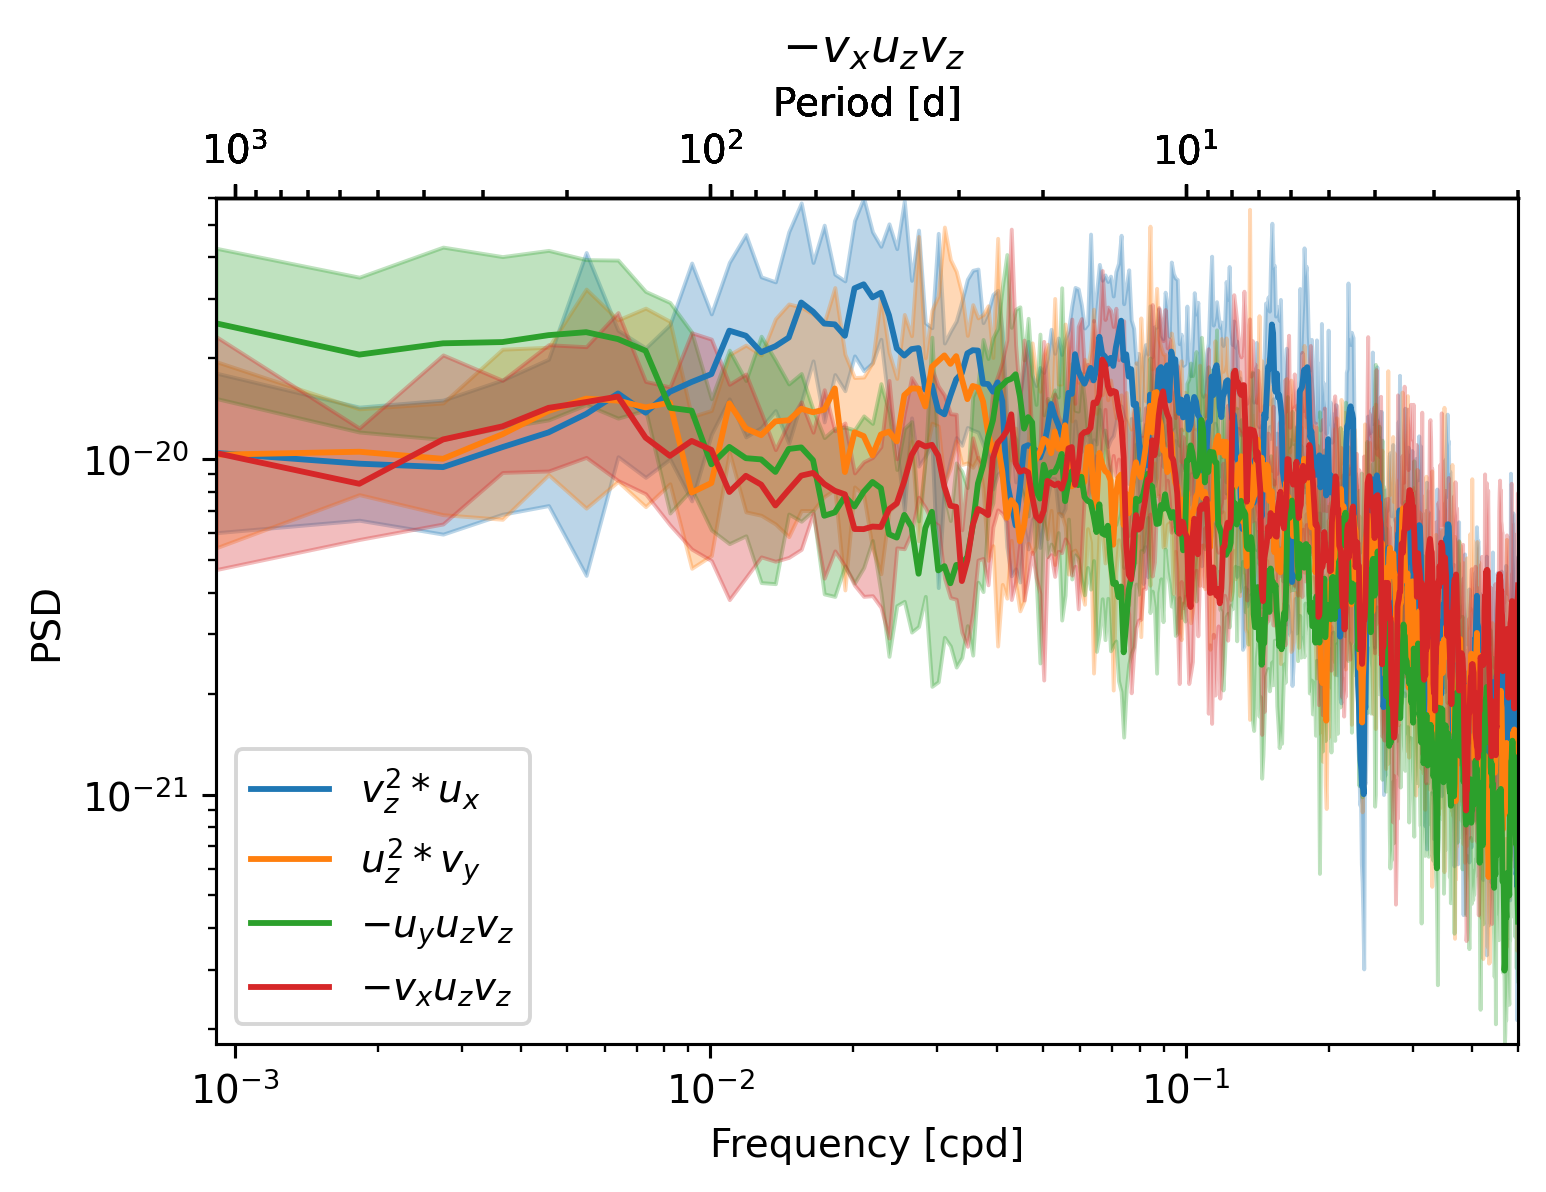
Checking all terms#
sub = daily.sel(latitude=0, method="nearest")


def plot_spec(ts, ax):
    dcpy.ts.PlotSpectrum(ts, ax=ax, label=ts.attrs["long_name"])


f, ax = plt.subplots(1, 1)
for term in [sub.strux, sub.strvy, sub.tiltuy, sub.tiltvx]:
    plot_spec(term, ax)
ax.legend()
<matplotlib.legend.Legend at 0x2ac4f0364e20>
sub = daily.sel(latitude=3.5, method="nearest")


def plot_spec(ts, ax):
    dcpy.ts.PlotSpectrum(ts, ax=ax, label=ts.attrs["long_name"])


f, ax = plt.subplots(1, 1)
for term in [sub.strux, sub.strvy, sub.tiltuy, sub.tiltvx]:
    plot_spec(term, ax)
ax.legend()
<matplotlib.legend.Legend at 0x2ac4e633d310>
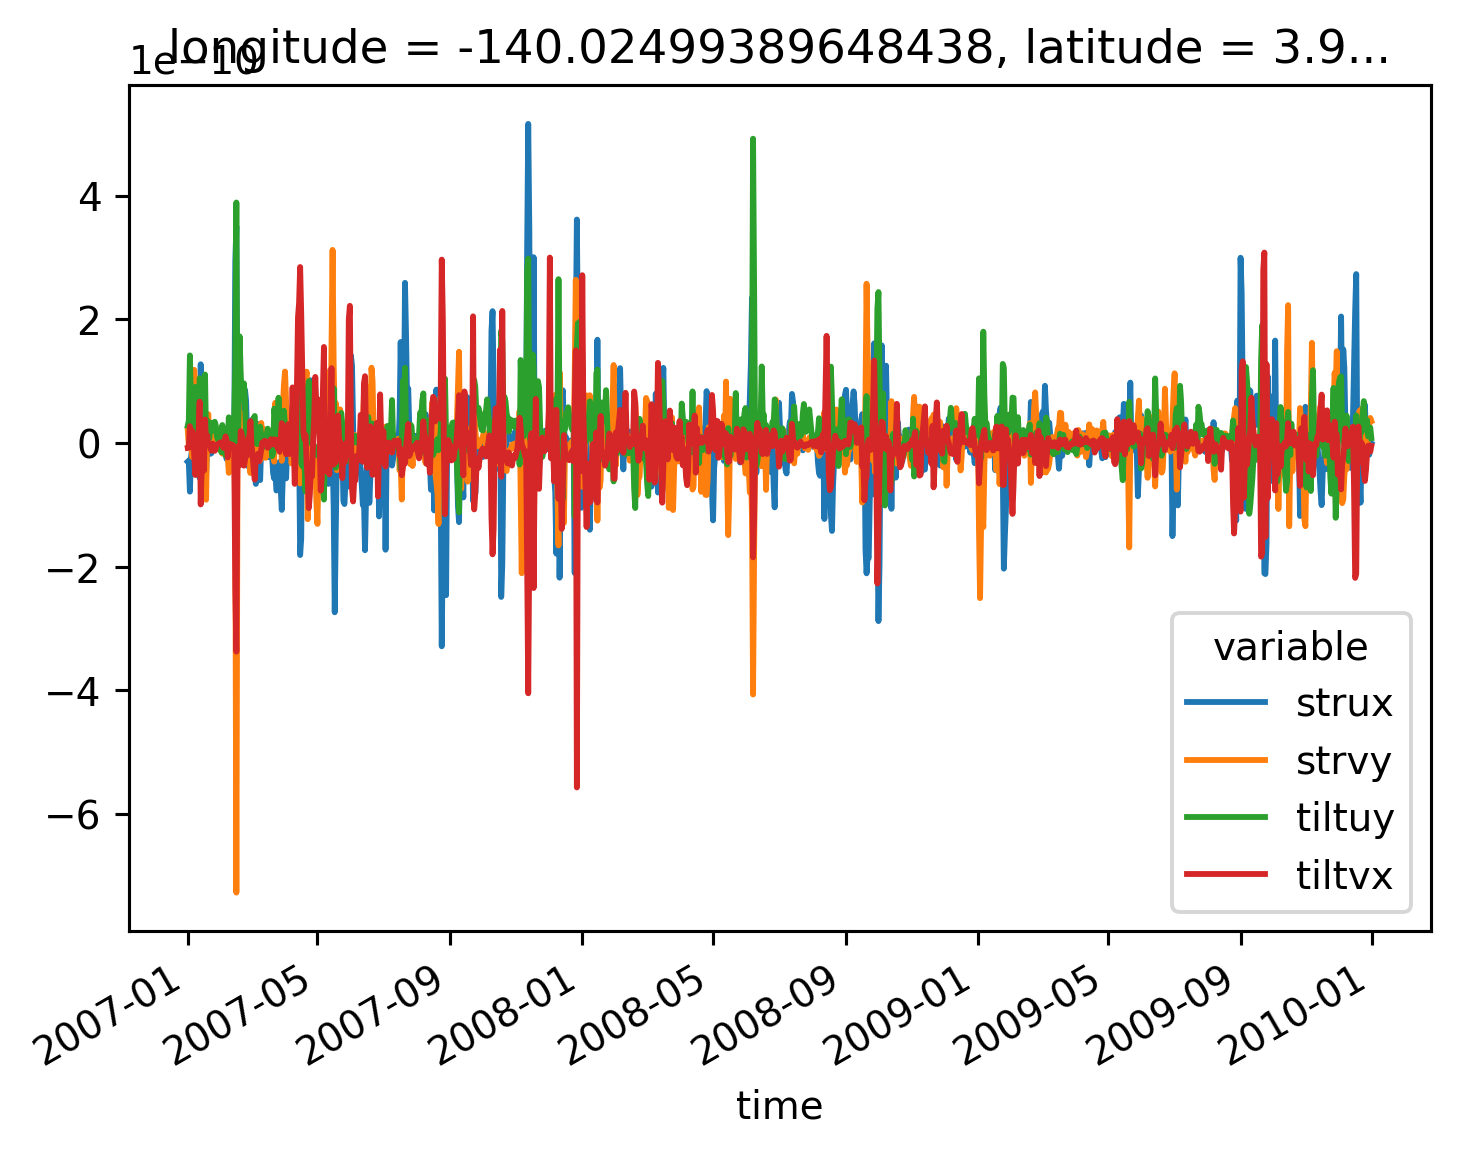
(
    daily[["strux", "strvy", "tiltuy", "tiltvx"]]
    .sel(latitude=4, method="nearest")
    .to_array(dim="variable")
    .plot(hue="variable")
)
[<matplotlib.lines.Line2D at 0x2ac4e9cfce80>,
 <matplotlib.lines.Line2D at 0x2ac4e9cfcf70>,
 <matplotlib.lines.Line2D at 0x2ac4e9cfcf40>,
 <matplotlib.lines.Line2D at 0x2ac4e9d060d0>]
station_grid = xgcm.Grid(
    stations.merge(station_metrics),
    coords={
        "X": {"center": "longitude"},
        "Y": {"center": "latitude"},
        "Z": {"center": "depth"},
    },
    metrics={"X": ("DXC",), "Y": ("DYC",), "Z": ("drC",), ("X", "Y"): ("RAC",)},
    periodic=False,
    boundary="fill",
    fill_value=np.nan,
)
Full domain#
Having lots of trouble getting this to work.
ds, metrics, grid = pump.model.read_mitgcm_20_year(
    state=True,
    start="2008-01-01",
    stop="2008-12-31",
    chunks={"latitude": -1, "longitude": -1},
)
ds["b"] = -9.81 / 1035 * ds.dens
ds
3288 3653
<xarray.Dataset>
Dimensions:          (RF: 136, YG: 400, XG: 1420, YC: 400, XC: 1420, time: 366, RC: 136)
Coordinates:
  * RF               (RF) float64 0.0 -2.5 -5.0 -7.5 ... -797.0 -851.7 -911.6
  * YG               (YG) float64 -10.0 -9.95 -9.9 -9.85 ... 9.8 9.85 9.9 9.95
  * XG               (XG) float64 -168.0 -168.0 -167.9 ... -97.18 -97.12 -97.08
  * YC               (YC) float64 -9.975 -9.925 -9.875 ... 9.875 9.925 9.975
  * XC               (XC) float64 -168.0 -167.9 -167.9 ... -97.15 -97.1 -97.05
  * time             (time) datetime64[ns] 2008-01-01 2008-01-02 ... 2008-12-31
  * RC               (RC) float64 -1.25 -3.75 -6.25 ... -824.4 -881.7 -944.4
Data variables: (12/14)
    theta            (time, RC, YC, XC) float32 dask.array<chunksize=(1, 136, 400, 1420), meta=np.ndarray>
    u                (time, RC, YC, XG) float32 dask.array<chunksize=(1, 136, 400, 1420), meta=np.ndarray>
    v                (time, RC, YG, XC) float32 dask.array<chunksize=(1, 136, 400, 1420), meta=np.ndarray>
    w                (time, RF, YC, XC) float32 dask.array<chunksize=(1, 136, 400, 1420), meta=np.ndarray>
    salt             (time, RC, YC, XC) float32 dask.array<chunksize=(1, 136, 400, 1420), meta=np.ndarray>
    KPP_diffusivity  (time, RF, YC, XC) float32 dask.array<chunksize=(1, 136, 400, 1420), meta=np.ndarray>
    ...               ...
    S2               (time, RF, YC, XC) float32 dask.array<chunksize=(1, 1, 399, 1419), meta=np.ndarray>
    Ri               (time, RF, YC, XC) float32 dask.array<chunksize=(1, 1, 399, 1419), meta=np.ndarray>
    mld              (time, YC, XC) float64 dask.array<chunksize=(1, 400, 1420), meta=np.ndarray>
    dcl_base         (time, YC, XC) float64 dask.array<chunksize=(1, 399, 1419), meta=np.ndarray>
    dcl              (time, YC, XC) float64 dask.array<chunksize=(1, 399, 1419), meta=np.ndarray>
    b                (time, RC, YC, XC) float32 dask.array<chunksize=(1, 136, 400, 1420), meta=np.ndarray>
Attributes:
    title:              daily snapshot from 1/20 degree Equatorial Pacific MI...
    easting:            longitude
    northing:           latitude
    field_julian_date:  508416
    julian_day_unit:    days since 1950-01-01 00:00:00
xarray.Dataset
- RF: 136
- YG: 400
- XG: 1420
- YC: 400
- XC: 1420
- time: 366
- RC: 136
- RF(RF)float640.0 -2.5 -5.0 ... -851.7 -911.6
- axis :
- Z
- c_grid_axis_shift :
- -0.5
array([ 0. , -2.5 , -5. , -7.5 , -10. , -12.5 , -15. , -17.5 , -20. , -22.5 , -25. , -27.5 , -30. , -32.5 , -35. , -37.5 , -40. , -42.5 , -45. , -47.5 , -50. , -52.5 , -55. , -57.5 , -60. , -62.5 , -65. , -67.5 , -70. , -72.5 , -75. , -77.5 , -80. , -82.5 , -85. , -87.5 , -90. , -92.5 , -95. , -97.5 , -100. , -102.5 , -105. , -107.5 , -110. , -112.5 , -115. , -117.5 , -120. , -122.5 , -125. , -127.5 , -130. , -132.5 , -135. , -137.5 , -140. , -142.5 , -145. , -147.5 , -150. , -152.5 , -155. , -157.5 , -160. , -162.5 , -165. , -167.5 , -170. , -172.5 , -175. , -177.5 , -180. , -182.5 , -185. , -187.5 , -190. , -192.5 , -195. , -197.5 , -200. , -202.5 , -205. , -207.5 , -210. , -212.5 , -215. , -217.5 , -220. , -222.5 , -225. , -227.5 , -230. , -232.5 , -235. , -237.5 , -240. , -242.5 , -245. , -247.5 , -250. , -252.737503, -255.735107, -259.017395, -262.611603, -266.547211, -270.856689, -275.575592, -280.742798, -286.400909, -292.596497, -299.380615, -306.809204, -314.943604, -323.850708, -333.604004, -344.283905, -355.978394, -368.783813, -382.805695, -398.159698, -414.972412, -433.382294, -453.541107, -475.61499 , -499.785889, -526.252991, -555.234497, -586.969299, -621.718872, -659.769714, -701.435303, -747.059082, -797.017212, -851.721313, -911.622314]) - YG(YG)float64-10.0 -9.95 -9.9 ... 9.85 9.9 9.95
- axis :
- Y
array([-10. , -9.95, -9.9 , ..., 9.85, 9.9 , 9.95])
- XG(XG)float64-168.0 -168.0 ... -97.12 -97.08
- axis :
- X
array([-168.025 , -167.975 , -167.925 , ..., -97.175002, -97.124998, -97.075003]) - YC(YC)float64-9.975 -9.925 ... 9.925 9.975
- axis :
- Y
array([-9.975, -9.925, -9.875, ..., 9.875, 9.925, 9.975])
- XC(XC)float64-168.0 -167.9 ... -97.1 -97.05
- axis :
- X
array([-168. , -167.95 , -167.9 , ..., -97.15 , -97.099997, -97.050002]) - time(time)datetime64[ns]2008-01-01 ... 2008-12-31
- long_name :
- Time (hours since 1950-01-01)
- standard_name :
- time
- axis :
- T
- _CoordinateAxisType :
- Time
array(['2008-01-01T00:00:00.000000000', '2008-01-02T00:00:00.000000000', '2008-01-03T00:00:00.000000000', ..., '2008-12-29T00:00:00.000000000', '2008-12-30T00:00:00.000000000', '2008-12-31T00:00:00.000000000'], dtype='datetime64[ns]') - RC(RC)float64-1.25 -3.75 -6.25 ... -881.7 -944.4
- axis :
- Z
array([  -1.25    ,   -3.75    ,   -6.25    ,   -8.75    ,  -11.25    ,
        -13.75    ,  -16.25    ,  -18.75    ,  -21.25    ,  -23.75    ,
        -26.25    ,  -28.75    ,  -31.25    ,  -33.75    ,  -36.25    ,
        -38.75    ,  -41.25    ,  -43.75    ,  -46.25    ,  -48.75    ,
        -51.25    ,  -53.75    ,  -56.25    ,  -58.75    ,  -61.25    ,
        -63.75    ,  -66.25    ,  -68.75    ,  -71.25    ,  -73.75    ,
        -76.25    ,  -78.75    ,  -81.25    ,  -83.75    ,  -86.25    ,
        -88.75    ,  -91.25    ,  -93.75    ,  -96.25    ,  -98.75    ,
       -101.25    , -103.75    , -106.25    , -108.75    , -111.25    ,
       -113.75    , -116.25    , -118.75    , -121.25    , -123.75    ,
       -126.25    , -128.75    , -131.25    , -133.75    , -136.25    ,
       -138.75    , -141.25    , -143.75    , -146.25    , -148.75    ,
       -151.25    , -153.75    , -156.25    , -158.75    , -161.25    ,
       -163.75    , -166.25    , -168.75    , -171.25    , -173.75    ,
       -176.25    , -178.75    , -181.25    , -183.75    , -186.25    ,
       -188.75    , -191.25    , -193.75    , -196.25    , -198.75    ,
       -201.25    , -203.75    , -206.25    , -208.75    , -211.25    ,
       -213.75    , -216.25    , -218.75    , -221.25    , -223.75    ,
       -226.25    , -228.75    , -231.25    , -233.75    , -236.25    ,
       -238.75    , -241.25    , -243.75    , -246.25    , -248.75    ,
       -251.368744, -254.236298, -257.376251, -260.814514, -264.579407,
       -268.701935, -273.216156, -278.15921 , -283.571838, -289.498688,
       -295.988556, -303.09491 , -310.876404, -319.397156, -328.727356,
       -338.943939, -350.131165, -362.381104, -375.794739, -390.482697,
       -406.56604 , -424.177338, -443.4617  , -464.578064, -487.700439,
       -513.01947 , -540.743774, -571.101929, -604.344116, -640.744324,
       -680.602478, -724.247192, -772.038147, -824.369263, -881.671814,
       -944.418091])
- theta(time, RC, YC, XC)float32dask.array<chunksize=(1, 136, 400, 1420), meta=np.ndarray>
Array Chunk Bytes 105.32 GiB 294.68 MiB Shape (366, 136, 400, 1420) (1, 136, 400, 1420) Count 1098 Tasks 366 Chunks Type float32 numpy.ndarray - u(time, RC, YC, XG)float32dask.array<chunksize=(1, 136, 400, 1420), meta=np.ndarray>
Array Chunk Bytes 105.32 GiB 294.68 MiB Shape (366, 136, 400, 1420) (1, 136, 400, 1420) Count 1098 Tasks 366 Chunks Type float32 numpy.ndarray - v(time, RC, YG, XC)float32dask.array<chunksize=(1, 136, 400, 1420), meta=np.ndarray>
Array Chunk Bytes 105.32 GiB 294.68 MiB Shape (366, 136, 400, 1420) (1, 136, 400, 1420) Count 1098 Tasks 366 Chunks Type float32 numpy.ndarray - w(time, RF, YC, XC)float32dask.array<chunksize=(1, 136, 400, 1420), meta=np.ndarray>
Array Chunk Bytes 105.32 GiB 294.68 MiB Shape (366, 136, 400, 1420) (1, 136, 400, 1420) Count 1098 Tasks 366 Chunks Type float32 numpy.ndarray - salt(time, RC, YC, XC)float32dask.array<chunksize=(1, 136, 400, 1420), meta=np.ndarray>
Array Chunk Bytes 105.32 GiB 294.68 MiB Shape (366, 136, 400, 1420) (1, 136, 400, 1420) Count 1098 Tasks 366 Chunks Type float32 numpy.ndarray - KPP_diffusivity(time, RF, YC, XC)float32dask.array<chunksize=(1, 136, 400, 1420), meta=np.ndarray>
Array Chunk Bytes 105.32 GiB 294.68 MiB Shape (366, 136, 400, 1420) (1, 136, 400, 1420) Count 1098 Tasks 366 Chunks Type float32 numpy.ndarray - dens(time, RC, YC, XC)float32dask.array<chunksize=(1, 136, 400, 1420), meta=np.ndarray>
Array Chunk Bytes 105.32 GiB 294.68 MiB Shape (366, 136, 400, 1420) (1, 136, 400, 1420) Count 2929 Tasks 366 Chunks Type float32 numpy.ndarray - N2(time, RF, YC, XC)float32dask.array<chunksize=(1, 1, 400, 1420), meta=np.ndarray>
Array Chunk Bytes 105.32 GiB 292.51 MiB Shape (366, 136, 400, 1420) (1, 135, 400, 1420) Count 6594 Tasks 732 Chunks Type float32 numpy.ndarray - S2(time, RF, YC, XC)float32dask.array<chunksize=(1, 1, 399, 1419), meta=np.ndarray>
Array Chunk Bytes 105.32 GiB 291.57 MiB Shape (366, 136, 400, 1420) (1, 135, 399, 1419) Count 38801 Tasks 2928 Chunks Type float32 numpy.ndarray - Ri(time, RF, YC, XC)float32dask.array<chunksize=(1, 1, 399, 1419), meta=np.ndarray>
Array Chunk Bytes 105.32 GiB 291.57 MiB Shape (366, 136, 400, 1420) (1, 135, 399, 1419) Count 54174 Tasks 2928 Chunks Type float32 numpy.ndarray - mld(time, YC, XC)float64dask.array<chunksize=(1, 400, 1420), meta=np.ndarray>
- long_name :
- MLD
- units :
- m
- description :
- Interpolate density to 1m grid. Search for max depth where |drho| > 0.015 and N2 > 1e-05
Array Chunk Bytes 1.55 GiB 4.33 MiB Shape (366, 400, 1420) (1, 400, 1420) Count 9518 Tasks 366 Chunks Type float64 numpy.ndarray - dcl_base(time, YC, XC)float64dask.array<chunksize=(1, 399, 1419), meta=np.ndarray>
- long_name :
- $z_{Ri}$
- units :
- m
- description :
- Interpolate density to 1m grid. Search for max depth where |drho| > 0.015 and N2 > 1e-05
Array Chunk Bytes 1.55 GiB 4.32 MiB Shape (366, 400, 1420) (1, 399, 1419) Count 79796 Tasks 1464 Chunks Type float64 numpy.ndarray - dcl(time, YC, XC)float64dask.array<chunksize=(1, 399, 1419), meta=np.ndarray>
- long_name :
- DCL
- units :
- m
- description :
- Interpolate density to 1m grid. Search for max depth where |drho| > 0.015 and N2 > 1e-05
Array Chunk Bytes 1.55 GiB 4.32 MiB Shape (366, 400, 1420) (1, 399, 1419) Count 81260 Tasks 1464 Chunks Type float64 numpy.ndarray - b(time, RC, YC, XC)float32dask.array<chunksize=(1, 136, 400, 1420), meta=np.ndarray>
Array Chunk Bytes 105.32 GiB 294.68 MiB Shape (366, 136, 400, 1420) (1, 136, 400, 1420) Count 3295 Tasks 366 Chunks Type float32 numpy.ndarray
- title :
- daily snapshot from 1/20 degree Equatorial Pacific MITgcm simulation
- easting :
- longitude
- northing :
- latitude
- field_julian_date :
- 508416
- julian_day_unit :
- days since 1950-01-01 00:00:00
ds["dcl"], ds["dcl_base"] = dask.persist(ds.dcl, ds.dcl_base)
der = xr.Dataset()
for axis in ["x", "y", "z"]:
    for field in ["u", "v", "w", "b"]:
        der[f"{field}{axis}"] = grid.derivative(ds[field], axis=axis.upper())
der
/glade/u/home/dcherian/python/xgcm/xgcm/grid.py:1384: UserWarning: Metric at ('time', 'RC', 'YC', 'XC') being interpolated from metrics at dimensions ('YG', 'XC'). Boundary value set to 'extend'.
  warnings.warn(
/glade/u/home/dcherian/python/xgcm/xgcm/grid.py:1384: UserWarning: Metric at ('time', 'RC', 'YG', 'XG') being interpolated from metrics at dimensions ('YG', 'XC'). Boundary value set to 'extend'.
  warnings.warn(
/glade/u/home/dcherian/python/xgcm/xgcm/grid.py:1384: UserWarning: Metric at ('time', 'RC', 'YG', 'XG') being interpolated from metrics at dimensions ('YG', 'XC'). Boundary value set to 'extend'.
  warnings.warn(
/glade/u/home/dcherian/python/xgcm/xgcm/grid.py:1384: UserWarning: Metric at ('time', 'RC', 'YC', 'XC') being interpolated from metrics at dimensions ('YG', 'XC'). Boundary value set to 'extend'.
  warnings.warn(
<xarray.Dataset>
Dimensions:  (time: 366, RC: 136, YC: 400, XC: 1420, YG: 400, XG: 1420, RF: 136)
Coordinates:
  * time     (time) datetime64[ns] 2008-01-01 2008-01-02 ... 2008-12-31
  * RC       (RC) float64 -1.25 -3.75 -6.25 -8.75 ... -824.4 -881.7 -944.4
  * YC       (YC) float64 -9.975 -9.925 -9.875 -9.825 ... 9.875 9.925 9.975
  * XC       (XC) float64 -168.0 -167.9 -167.9 -167.9 ... -97.15 -97.1 -97.05
  * YG       (YG) float64 -10.0 -9.95 -9.9 -9.85 -9.8 ... 9.75 9.8 9.85 9.9 9.95
  * XG       (XG) float64 -168.0 -168.0 -167.9 -167.9 ... -97.18 -97.12 -97.08
  * RF       (RF) float64 0.0 -2.5 -5.0 -7.5 ... -747.1 -797.0 -851.7 -911.6
Data variables:
    ux       (time, RC, YC, XC) float32 dask.array<chunksize=(1, 136, 400, 1419), meta=np.ndarray>
    vx       (time, RC, YG, XG) float32 dask.array<chunksize=(1, 136, 400, 1), meta=np.ndarray>
    wx       (time, RF, YC, XG) float64 dask.array<chunksize=(1, 136, 400, 1), meta=np.ndarray>
    bx       (time, RC, YC, XG) float64 dask.array<chunksize=(1, 136, 400, 1), meta=np.ndarray>
    uy       (time, RC, YG, XG) float64 dask.array<chunksize=(1, 136, 1, 1420), meta=np.ndarray>
    vy       (time, RC, YC, XC) float64 dask.array<chunksize=(1, 136, 399, 1420), meta=np.ndarray>
    wy       (time, RF, YG, XC) float64 dask.array<chunksize=(1, 136, 1, 1420), meta=np.ndarray>
    by       (time, RC, YG, XC) float64 dask.array<chunksize=(1, 136, 1, 1420), meta=np.ndarray>
    uz       (time, RF, YC, XG) float32 dask.array<chunksize=(1, 1, 400, 1420), meta=np.ndarray>
    vz       (time, RF, YG, XC) float32 dask.array<chunksize=(1, 1, 400, 1420), meta=np.ndarray>
    wz       (time, RC, YC, XC) float32 dask.array<chunksize=(1, 135, 400, 1420), meta=np.ndarray>
    bz       (time, RF, YC, XC) float32 dask.array<chunksize=(1, 1, 400, 1420), meta=np.ndarray>
xarray.Dataset
- time: 366
- RC: 136
- YC: 400
- XC: 1420
- YG: 400
- XG: 1420
- RF: 136
- time(time)datetime64[ns]2008-01-01 ... 2008-12-31
- long_name :
- Time (hours since 1950-01-01)
- standard_name :
- time
- axis :
- T
- _CoordinateAxisType :
- Time
array(['2008-01-01T00:00:00.000000000', '2008-01-02T00:00:00.000000000', '2008-01-03T00:00:00.000000000', ..., '2008-12-29T00:00:00.000000000', '2008-12-30T00:00:00.000000000', '2008-12-31T00:00:00.000000000'], dtype='datetime64[ns]') - RC(RC)float64-1.25 -3.75 -6.25 ... -881.7 -944.4
- axis :
- Z
array([ -1.25 , -3.75 , -6.25 , -8.75 , -11.25 , -13.75 , -16.25 , -18.75 , -21.25 , -23.75 , -26.25 , -28.75 , -31.25 , -33.75 , -36.25 , -38.75 , -41.25 , -43.75 , -46.25 , -48.75 , -51.25 , -53.75 , -56.25 , -58.75 , -61.25 , -63.75 , -66.25 , -68.75 , -71.25 , -73.75 , -76.25 , -78.75 , -81.25 , -83.75 , -86.25 , -88.75 , -91.25 , -93.75 , -96.25 , -98.75 , -101.25 , -103.75 , -106.25 , -108.75 , -111.25 , -113.75 , -116.25 , -118.75 , -121.25 , -123.75 , -126.25 , -128.75 , -131.25 , -133.75 , -136.25 , -138.75 , -141.25 , -143.75 , -146.25 , -148.75 , -151.25 , -153.75 , -156.25 , -158.75 , -161.25 , -163.75 , -166.25 , -168.75 , -171.25 , -173.75 , -176.25 , -178.75 , -181.25 , -183.75 , -186.25 , -188.75 , -191.25 , -193.75 , -196.25 , -198.75 , -201.25 , -203.75 , -206.25 , -208.75 , -211.25 , -213.75 , -216.25 , -218.75 , -221.25 , -223.75 , -226.25 , -228.75 , -231.25 , -233.75 , -236.25 , -238.75 , -241.25 , -243.75 , -246.25 , -248.75 , -251.368744, -254.236298, -257.376251, -260.814514, -264.579407, -268.701935, -273.216156, -278.15921 , -283.571838, -289.498688, -295.988556, -303.09491 , -310.876404, -319.397156, -328.727356, -338.943939, -350.131165, -362.381104, -375.794739, -390.482697, -406.56604 , -424.177338, -443.4617 , -464.578064, -487.700439, -513.01947 , -540.743774, -571.101929, -604.344116, -640.744324, -680.602478, -724.247192, -772.038147, -824.369263, -881.671814, -944.418091]) - YC(YC)float64-9.975 -9.925 ... 9.925 9.975
- axis :
- Y
array([-9.975, -9.925, -9.875, ..., 9.875, 9.925, 9.975])
- XC(XC)float64-168.0 -167.9 ... -97.1 -97.05
- axis :
- X
array([-168. , -167.95 , -167.9 , ..., -97.15 , -97.099997, -97.050002]) - YG(YG)float64-10.0 -9.95 -9.9 ... 9.85 9.9 9.95
- axis :
- Y
array([-10. , -9.95, -9.9 , ..., 9.85, 9.9 , 9.95])
- XG(XG)float64-168.0 -168.0 ... -97.12 -97.08
- axis :
- X
array([-168.025 , -167.975 , -167.925 , ..., -97.175002, -97.124998, -97.075003]) - RF(RF)float640.0 -2.5 -5.0 ... -851.7 -911.6
- axis :
- Z
- c_grid_axis_shift :
- -0.5
array([   0.      ,   -2.5     ,   -5.      ,   -7.5     ,  -10.      ,
        -12.5     ,  -15.      ,  -17.5     ,  -20.      ,  -22.5     ,
        -25.      ,  -27.5     ,  -30.      ,  -32.5     ,  -35.      ,
        -37.5     ,  -40.      ,  -42.5     ,  -45.      ,  -47.5     ,
        -50.      ,  -52.5     ,  -55.      ,  -57.5     ,  -60.      ,
        -62.5     ,  -65.      ,  -67.5     ,  -70.      ,  -72.5     ,
        -75.      ,  -77.5     ,  -80.      ,  -82.5     ,  -85.      ,
        -87.5     ,  -90.      ,  -92.5     ,  -95.      ,  -97.5     ,
       -100.      , -102.5     , -105.      , -107.5     , -110.      ,
       -112.5     , -115.      , -117.5     , -120.      , -122.5     ,
       -125.      , -127.5     , -130.      , -132.5     , -135.      ,
       -137.5     , -140.      , -142.5     , -145.      , -147.5     ,
       -150.      , -152.5     , -155.      , -157.5     , -160.      ,
       -162.5     , -165.      , -167.5     , -170.      , -172.5     ,
       -175.      , -177.5     , -180.      , -182.5     , -185.      ,
       -187.5     , -190.      , -192.5     , -195.      , -197.5     ,
       -200.      , -202.5     , -205.      , -207.5     , -210.      ,
       -212.5     , -215.      , -217.5     , -220.      , -222.5     ,
       -225.      , -227.5     , -230.      , -232.5     , -235.      ,
       -237.5     , -240.      , -242.5     , -245.      , -247.5     ,
       -250.      , -252.737503, -255.735107, -259.017395, -262.611603,
       -266.547211, -270.856689, -275.575592, -280.742798, -286.400909,
       -292.596497, -299.380615, -306.809204, -314.943604, -323.850708,
       -333.604004, -344.283905, -355.978394, -368.783813, -382.805695,
       -398.159698, -414.972412, -433.382294, -453.541107, -475.61499 ,
       -499.785889, -526.252991, -555.234497, -586.969299, -621.718872,
       -659.769714, -701.435303, -747.059082, -797.017212, -851.721313,
       -911.622314])
- ux(time, RC, YC, XC)float32dask.array<chunksize=(1, 136, 400, 1419), meta=np.ndarray>
Array Chunk Bytes 105.32 GiB 294.47 MiB Shape (366, 136, 400, 1420) (1, 136, 400, 1419) Count 5861 Tasks 732 Chunks Type float32 numpy.ndarray - vx(time, RC, YG, XG)float32dask.array<chunksize=(1, 136, 400, 1), meta=np.ndarray>
Array Chunk Bytes 105.32 GiB 294.47 MiB Shape (366, 136, 400, 1420) (1, 136, 400, 1419) Count 5861 Tasks 732 Chunks Type float32 numpy.ndarray - wx(time, RF, YC, XG)float64dask.array<chunksize=(1, 136, 400, 1), meta=np.ndarray>
Array Chunk Bytes 210.65 GiB 588.94 MiB Shape (366, 136, 400, 1420) (1, 136, 400, 1419) Count 5861 Tasks 732 Chunks Type float64 numpy.ndarray - bx(time, RC, YC, XG)float64dask.array<chunksize=(1, 136, 400, 1), meta=np.ndarray>
Array Chunk Bytes 210.65 GiB 588.94 MiB Shape (366, 136, 400, 1420) (1, 136, 400, 1419) Count 8058 Tasks 732 Chunks Type float64 numpy.ndarray - uy(time, RC, YG, XG)float64dask.array<chunksize=(1, 136, 1, 1420), meta=np.ndarray>
Array Chunk Bytes 210.65 GiB 587.88 MiB Shape (366, 136, 400, 1420) (1, 136, 399, 1420) Count 5861 Tasks 732 Chunks Type float64 numpy.ndarray - vy(time, RC, YC, XC)float64dask.array<chunksize=(1, 136, 399, 1420), meta=np.ndarray>
Array Chunk Bytes 210.65 GiB 587.88 MiB Shape (366, 136, 400, 1420) (1, 136, 399, 1420) Count 5861 Tasks 732 Chunks Type float64 numpy.ndarray - wy(time, RF, YG, XC)float64dask.array<chunksize=(1, 136, 1, 1420), meta=np.ndarray>
Array Chunk Bytes 210.65 GiB 587.88 MiB Shape (366, 136, 400, 1420) (1, 136, 399, 1420) Count 5861 Tasks 732 Chunks Type float64 numpy.ndarray - by(time, RC, YG, XC)float64dask.array<chunksize=(1, 136, 1, 1420), meta=np.ndarray>
Array Chunk Bytes 210.65 GiB 587.88 MiB Shape (366, 136, 400, 1420) (1, 136, 399, 1420) Count 8058 Tasks 732 Chunks Type float64 numpy.ndarray - uz(time, RF, YC, XG)float32dask.array<chunksize=(1, 1, 400, 1420), meta=np.ndarray>
Array Chunk Bytes 105.32 GiB 292.51 MiB Shape (366, 136, 400, 1420) (1, 135, 400, 1420) Count 5861 Tasks 732 Chunks Type float32 numpy.ndarray - vz(time, RF, YG, XC)float32dask.array<chunksize=(1, 1, 400, 1420), meta=np.ndarray>
Array Chunk Bytes 105.32 GiB 292.51 MiB Shape (366, 136, 400, 1420) (1, 135, 400, 1420) Count 5861 Tasks 732 Chunks Type float32 numpy.ndarray - wz(time, RC, YC, XC)float32dask.array<chunksize=(1, 135, 400, 1420), meta=np.ndarray>
Array Chunk Bytes 105.32 GiB 292.51 MiB Shape (366, 136, 400, 1420) (1, 135, 400, 1420) Count 5861 Tasks 732 Chunks Type float32 numpy.ndarray - bz(time, RF, YC, XC)float32dask.array<chunksize=(1, 1, 400, 1420), meta=np.ndarray>
Array Chunk Bytes 105.32 GiB 292.51 MiB Shape (366, 136, 400, 1420) (1, 135, 400, 1420) Count 8058 Tasks 732 Chunks Type float32 numpy.ndarray
shred2 = xr.Dataset()
shred2["strvy"] = grid.interp_like(der.uz**2, der.vy) * der.vy
shred2["strux"] = grid.interp_like(der.vz**2, der.ux) * der.ux
shred2["str"] = shred2.strvy + shred2.strux

shred2["tilt"] = (
    -grid.interp_like(der.uy + der.vx, shred2.str)
    * grid.interp_like(der.uz, shred2.str)
    * grid.interp_like(der.vz, shred2.str)
)
shred2
<xarray.Dataset>
Dimensions:  (time: 366, RC: 136, YC: 400, XC: 1420)
Coordinates:
  * time     (time) datetime64[ns] 2008-01-01 2008-01-02 ... 2008-12-31
  * RC       (RC) float64 -1.25 -3.75 -6.25 -8.75 ... -824.4 -881.7 -944.4
  * YC       (YC) float64 -9.975 -9.925 -9.875 -9.825 ... 9.875 9.925 9.975
  * XC       (XC) float64 -168.0 -167.9 -167.9 -167.9 ... -97.15 -97.1 -97.05
Data variables:
    strvy    (time, RC, YC, XC) float64 dask.array<chunksize=(1, 1, 399, 1419), meta=np.ndarray>
    strux    (time, RC, YC, XC) float32 dask.array<chunksize=(1, 1, 399, 1419), meta=np.ndarray>
    str      (time, RC, YC, XC) float64 dask.array<chunksize=(1, 1, 399, 1419), meta=np.ndarray>
    tilt     (time, RC, YC, XC) float64 dask.array<chunksize=(1, 1, 1, 1), meta=np.ndarray>
xarray.Dataset
- time: 366
- RC: 136
- YC: 400
- XC: 1420
- time(time)datetime64[ns]2008-01-01 ... 2008-12-31
- long_name :
- Time (hours since 1950-01-01)
- standard_name :
- time
- axis :
- T
- _CoordinateAxisType :
- Time
array(['2008-01-01T00:00:00.000000000', '2008-01-02T00:00:00.000000000', '2008-01-03T00:00:00.000000000', ..., '2008-12-29T00:00:00.000000000', '2008-12-30T00:00:00.000000000', '2008-12-31T00:00:00.000000000'], dtype='datetime64[ns]') - RC(RC)float64-1.25 -3.75 -6.25 ... -881.7 -944.4
- axis :
- Z
array([ -1.25 , -3.75 , -6.25 , -8.75 , -11.25 , -13.75 , -16.25 , -18.75 , -21.25 , -23.75 , -26.25 , -28.75 , -31.25 , -33.75 , -36.25 , -38.75 , -41.25 , -43.75 , -46.25 , -48.75 , -51.25 , -53.75 , -56.25 , -58.75 , -61.25 , -63.75 , -66.25 , -68.75 , -71.25 , -73.75 , -76.25 , -78.75 , -81.25 , -83.75 , -86.25 , -88.75 , -91.25 , -93.75 , -96.25 , -98.75 , -101.25 , -103.75 , -106.25 , -108.75 , -111.25 , -113.75 , -116.25 , -118.75 , -121.25 , -123.75 , -126.25 , -128.75 , -131.25 , -133.75 , -136.25 , -138.75 , -141.25 , -143.75 , -146.25 , -148.75 , -151.25 , -153.75 , -156.25 , -158.75 , -161.25 , -163.75 , -166.25 , -168.75 , -171.25 , -173.75 , -176.25 , -178.75 , -181.25 , -183.75 , -186.25 , -188.75 , -191.25 , -193.75 , -196.25 , -198.75 , -201.25 , -203.75 , -206.25 , -208.75 , -211.25 , -213.75 , -216.25 , -218.75 , -221.25 , -223.75 , -226.25 , -228.75 , -231.25 , -233.75 , -236.25 , -238.75 , -241.25 , -243.75 , -246.25 , -248.75 , -251.368744, -254.236298, -257.376251, -260.814514, -264.579407, -268.701935, -273.216156, -278.15921 , -283.571838, -289.498688, -295.988556, -303.09491 , -310.876404, -319.397156, -328.727356, -338.943939, -350.131165, -362.381104, -375.794739, -390.482697, -406.56604 , -424.177338, -443.4617 , -464.578064, -487.700439, -513.01947 , -540.743774, -571.101929, -604.344116, -640.744324, -680.602478, -724.247192, -772.038147, -824.369263, -881.671814, -944.418091]) - YC(YC)float64-9.975 -9.925 ... 9.925 9.975
- axis :
- Y
array([-9.975, -9.925, -9.875, ..., 9.875, 9.925, 9.975])
- XC(XC)float64-168.0 -167.9 ... -97.1 -97.05
- axis :
- X
array([-168.      , -167.95    , -167.9     , ...,  -97.15    ,  -97.099997,
        -97.050002])
- strvy(time, RC, YC, XC)float64dask.array<chunksize=(1, 1, 399, 1419), meta=np.ndarray>
Array Chunk Bytes 210.65 GiB 578.83 MiB Shape (366, 136, 400, 1420) (1, 134, 399, 1419) Count 56740 Tasks 4392 Chunks Type float64 numpy.ndarray - strux(time, RC, YC, XC)float32dask.array<chunksize=(1, 1, 399, 1419), meta=np.ndarray>
Array Chunk Bytes 105.32 GiB 289.41 MiB Shape (366, 136, 400, 1420) (1, 134, 399, 1419) Count 56740 Tasks 4392 Chunks Type float32 numpy.ndarray - str(time, RC, YC, XC)float64dask.array<chunksize=(1, 1, 399, 1419), meta=np.ndarray>
Array Chunk Bytes 210.65 GiB 578.83 MiB Shape (366, 136, 400, 1420) (1, 134, 399, 1419) Count 115671 Tasks 4392 Chunks Type float64 numpy.ndarray - tilt(time, RC, YC, XC)float64dask.array<chunksize=(1, 1, 1, 1), meta=np.ndarray>
Array Chunk Bytes 210.65 GiB 576.97 MiB Shape (366, 136, 400, 1420) (1, 134, 398, 1418) Count 195825 Tasks 9882 Chunks Type float64 numpy.ndarray
dclsub = ds.dcl
dclsub = dclsub.where(dclsub > 10)
dclsub.isel(time=0).plot(robust=True)
<matplotlib.collections.QuadMesh at 0x2b3464ff8a00>
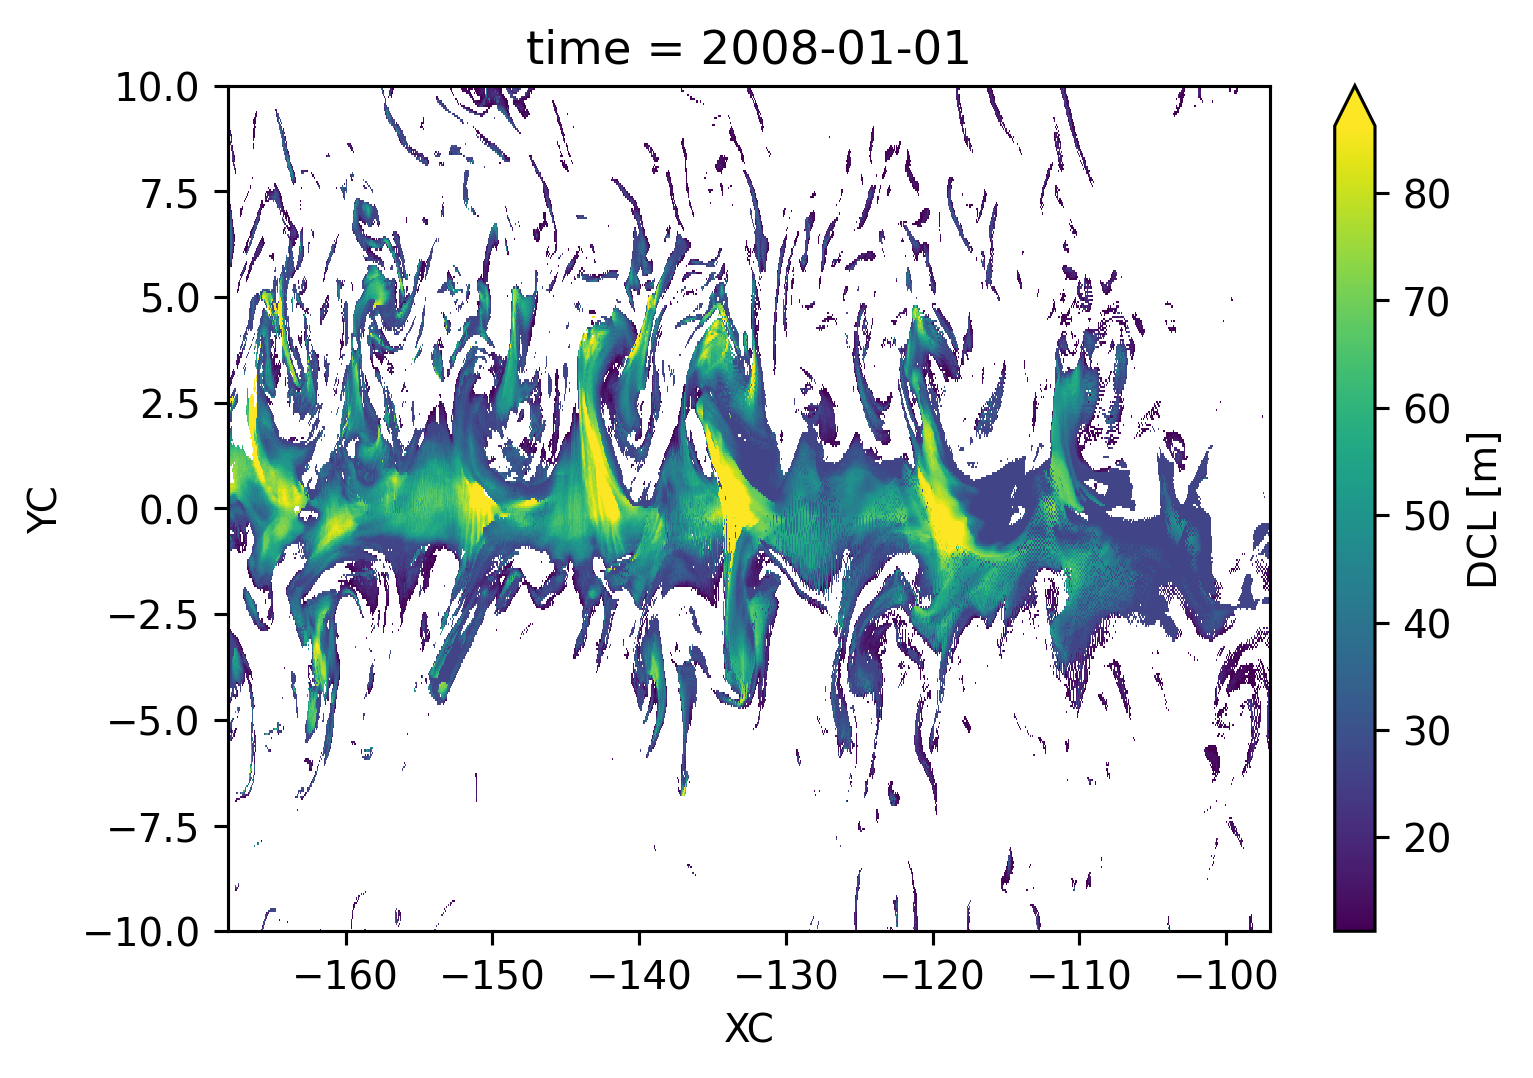
shred2140 = dcpy.dask.map_copy(
    shred2.strvy.sel(YC=0, XC=-140, method="nearest")
).persist()
dclmask = (ds.dcl > 10) & (ds.RC > ds.dcl_base)
dclmask
<xarray.DataArray (time: 366, YC: 400, XC: 1420, RC: 136)>
dask.array<and_, shape=(366, 400, 1420, 136), dtype=bool, chunksize=(1, 399, 1419, 136), chunktype=numpy.ndarray>
Coordinates:
  * YC       (YC) float64 -9.975 -9.925 -9.875 -9.825 ... 9.875 9.925 9.975
  * XC       (XC) float64 -168.0 -167.9 -167.9 -167.9 ... -97.15 -97.1 -97.05
  * time     (time) datetime64[ns] 2008-01-01 2008-01-02 ... 2008-12-31
  * RC       (RC) float64 -1.25 -3.75 -6.25 -8.75 ... -824.4 -881.7 -944.4
Attributes:
    long_name:    DCL
    units:        m
    description:  Interpolate density to 1m grid. Search for max depth where ...
xarray.DataArray
- time: 366
- YC: 400
- XC: 1420
- RC: 136
- dask.array<chunksize=(1, 399, 1419, 136), meta=np.ndarray>
Array Chunk Bytes 26.33 GiB 73.43 MiB Shape (366, 400, 1420, 136) (1, 399, 1419, 136) Count 91509 Tasks 1464 Chunks Type bool numpy.ndarray - YC(YC)float64-9.975 -9.925 ... 9.925 9.975
- axis :
- Y
array([-9.975, -9.925, -9.875, ..., 9.875, 9.925, 9.975])
- XC(XC)float64-168.0 -167.9 ... -97.1 -97.05
- axis :
- X
array([-168. , -167.95 , -167.9 , ..., -97.15 , -97.099997, -97.050002]) - time(time)datetime64[ns]2008-01-01 ... 2008-12-31
- long_name :
- Time (hours since 1950-01-01)
- standard_name :
- time
- axis :
- T
- _CoordinateAxisType :
- Time
array(['2008-01-01T00:00:00.000000000', '2008-01-02T00:00:00.000000000', '2008-01-03T00:00:00.000000000', ..., '2008-12-29T00:00:00.000000000', '2008-12-30T00:00:00.000000000', '2008-12-31T00:00:00.000000000'], dtype='datetime64[ns]') - RC(RC)float64-1.25 -3.75 -6.25 ... -881.7 -944.4
- axis :
- Z
array([  -1.25    ,   -3.75    ,   -6.25    ,   -8.75    ,  -11.25    ,
        -13.75    ,  -16.25    ,  -18.75    ,  -21.25    ,  -23.75    ,
        -26.25    ,  -28.75    ,  -31.25    ,  -33.75    ,  -36.25    ,
        -38.75    ,  -41.25    ,  -43.75    ,  -46.25    ,  -48.75    ,
        -51.25    ,  -53.75    ,  -56.25    ,  -58.75    ,  -61.25    ,
        -63.75    ,  -66.25    ,  -68.75    ,  -71.25    ,  -73.75    ,
        -76.25    ,  -78.75    ,  -81.25    ,  -83.75    ,  -86.25    ,
        -88.75    ,  -91.25    ,  -93.75    ,  -96.25    ,  -98.75    ,
       -101.25    , -103.75    , -106.25    , -108.75    , -111.25    ,
       -113.75    , -116.25    , -118.75    , -121.25    , -123.75    ,
       -126.25    , -128.75    , -131.25    , -133.75    , -136.25    ,
       -138.75    , -141.25    , -143.75    , -146.25    , -148.75    ,
       -151.25    , -153.75    , -156.25    , -158.75    , -161.25    ,
       -163.75    , -166.25    , -168.75    , -171.25    , -173.75    ,
       -176.25    , -178.75    , -181.25    , -183.75    , -186.25    ,
       -188.75    , -191.25    , -193.75    , -196.25    , -198.75    ,
       -201.25    , -203.75    , -206.25    , -208.75    , -211.25    ,
       -213.75    , -216.25    , -218.75    , -221.25    , -223.75    ,
       -226.25    , -228.75    , -231.25    , -233.75    , -236.25    ,
       -238.75    , -241.25    , -243.75    , -246.25    , -248.75    ,
       -251.368744, -254.236298, -257.376251, -260.814514, -264.579407,
       -268.701935, -273.216156, -278.15921 , -283.571838, -289.498688,
       -295.988556, -303.09491 , -310.876404, -319.397156, -328.727356,
       -338.943939, -350.131165, -362.381104, -375.794739, -390.482697,
       -406.56604 , -424.177338, -443.4617  , -464.578064, -487.700439,
       -513.01947 , -540.743774, -571.101929, -604.344116, -640.744324,
       -680.602478, -724.247192, -772.038147, -824.369263, -881.671814,
       -944.418091])
- long_name :
- DCL
- units :
- m
- description :
- Interpolate density to 1m grid. Search for max depth where |drho| > 0.015 and N2 > 1e-05
mivol = grid.integrate(dclmask, axis=("X", "Y", "Z"))
mivol
/glade/u/home/dcherian/python/xgcm/xgcm/grid.py:1408: UserWarning: Metric at ('time', 'YC', 'XC', 'RC') being interpolated from metrics at dimensions [('YC', 'XG'), ('RC',)]. Boundary value set to 'extend'.
  warnings.warn(
/glade/u/home/dcherian/python/xgcm/xgcm/grid.py:1408: UserWarning: Metric at ('time', 'YC', 'XC', 'RC') being interpolated from metrics at dimensions [('YC', 'XG'), ('RF',)]. Boundary value set to 'extend'.
  warnings.warn(
/glade/u/home/dcherian/python/xgcm/xgcm/grid.py:1408: UserWarning: Metric at ('time', 'YC', 'XC', 'RC') being interpolated from metrics at dimensions [('YG', 'XC'), ('RC',)]. Boundary value set to 'extend'.
  warnings.warn(
/glade/u/home/dcherian/python/xgcm/xgcm/grid.py:1408: UserWarning: Metric at ('time', 'YC', 'XC', 'RC') being interpolated from metrics at dimensions [('YG', 'XC'), ('RF',)]. Boundary value set to 'extend'.
  warnings.warn(
<xarray.DataArray (time: 366)>
dask.array<sum-aggregate, shape=(366,), dtype=float32, chunksize=(1,), chunktype=numpy.ndarray>
Coordinates:
  * time     (time) datetime64[ns] 2008-01-01 2008-01-02 ... 2008-12-31
Attributes:
    long_name:    DCL
    units:        m
    description:  Interpolate density to 1m grid. Search for max depth where ...
xarray.DataArray
- time: 366
- dask.array<chunksize=(1,), meta=np.ndarray>
Array Chunk Bytes 1.43 kiB 4 B Shape (366,) (1,) Count 97740 Tasks 366 Chunks Type float32 numpy.ndarray - time(time)datetime64[ns]2008-01-01 ... 2008-12-31
- long_name :
- Time (hours since 1950-01-01)
- standard_name :
- time
- axis :
- T
- _CoordinateAxisType :
- Time
array(['2008-01-01T00:00:00.000000000', '2008-01-02T00:00:00.000000000',
       '2008-01-03T00:00:00.000000000', ..., '2008-12-29T00:00:00.000000000',
       '2008-12-30T00:00:00.000000000', '2008-12-31T00:00:00.000000000'],
      dtype='datetime64[ns]')
- long_name :
- DCL
- units :
- m
- description :
- Interpolate density to 1m grid. Search for max depth where |drho| > 0.015 and N2 > 1e-05
intshred2 = grid.integrate(shred2.where(dclmask), axis=("X", "Y", "Z"))
intshred2
/glade/u/home/dcherian/python/xgcm/xgcm/grid.py:1408: UserWarning: Metric at Frozen({'time': 366, 'RC': 136, 'YC': 400, 'XC': 1420}) being interpolated from metrics at dimensions [('YC', 'XG'), ('RC',)]. Boundary value set to 'extend'.
  warnings.warn(
/glade/u/home/dcherian/python/xgcm/xgcm/grid.py:1408: UserWarning: Metric at Frozen({'time': 366, 'RC': 136, 'YC': 400, 'XC': 1420}) being interpolated from metrics at dimensions [('YC', 'XG'), ('RF',)]. Boundary value set to 'extend'.
  warnings.warn(
/glade/u/home/dcherian/python/xgcm/xgcm/grid.py:1408: UserWarning: Metric at Frozen({'time': 366, 'RC': 136, 'YC': 400, 'XC': 1420}) being interpolated from metrics at dimensions [('YG', 'XC'), ('RC',)]. Boundary value set to 'extend'.
  warnings.warn(
/glade/u/home/dcherian/python/xgcm/xgcm/grid.py:1408: UserWarning: Metric at Frozen({'time': 366, 'RC': 136, 'YC': 400, 'XC': 1420}) being interpolated from metrics at dimensions [('YG', 'XC'), ('RF',)]. Boundary value set to 'extend'.
  warnings.warn(
<xarray.Dataset>
Dimensions:  (time: 366)
Coordinates:
  * time     (time) datetime64[ns] 2008-01-01 2008-01-02 ... 2008-12-31
Data variables:
    strvy    (time) float64 dask.array<chunksize=(1,), meta=np.ndarray>
    strux    (time) float32 dask.array<chunksize=(1,), meta=np.ndarray>
    str      (time) float64 dask.array<chunksize=(1,), meta=np.ndarray>
    tilt     (time) float64 dask.array<chunksize=(1,), meta=np.ndarray>
xarray.Dataset
- time: 366
- time(time)datetime64[ns]2008-01-01 ... 2008-12-31
- long_name :
- Time (hours since 1950-01-01)
- standard_name :
- time
- axis :
- T
- _CoordinateAxisType :
- Time
array(['2008-01-01T00:00:00.000000000', '2008-01-02T00:00:00.000000000',
       '2008-01-03T00:00:00.000000000', ..., '2008-12-29T00:00:00.000000000',
       '2008-12-30T00:00:00.000000000', '2008-12-31T00:00:00.000000000'],
      dtype='datetime64[ns]')
- strvy(time)float64dask.array<chunksize=(1,), meta=np.ndarray>
Array Chunk Bytes 2.86 kiB 8 B Shape (366,) (1,) Count 181580 Tasks 366 Chunks Type float64 numpy.ndarray - strux(time)float32dask.array<chunksize=(1,), meta=np.ndarray>
Array Chunk Bytes 1.43 kiB 4 B Shape (366,) (1,) Count 181580 Tasks 366 Chunks Type float32 numpy.ndarray - str(time)float64dask.array<chunksize=(1,), meta=np.ndarray>
Array Chunk Bytes 2.86 kiB 8 B Shape (366,) (1,) Count 240511 Tasks 366 Chunks Type float64 numpy.ndarray - tilt(time)float64dask.array<chunksize=(1,), meta=np.ndarray>
Array Chunk Bytes 2.86 kiB 8 B Shape (366,) (1,) Count 361321 Tasks 366 Chunks Type float64 numpy.ndarray
mivol, intshred2 = dask.persist(mivol, intshred2)
cluster.scale(24)