TIW DCL Paper Figures#
import ncar_jobqueue
if "client" in locals():
client.close()
del client
# if "cluster" in locals():
# cluster.close()
# env = {"OMP_NUM_THREADS": "3", "NUMBA_NUM_THREADS": "3"}
# cluster = distributed.LocalCluster(
# n_workers=8,
# threads_per_worker=1,
# env=env
# )
if "cluster" in locals():
del cluster
# cluster = ncar_jobqueue.NCARCluster(
# project="NCGD0011",
# scheduler_options=dict(dashboard_address=":9797"),
# )
# cluster = dask_jobqueue.PBSCluster(
# cores=9, processes=9, memory="108GB", walltime="02:00:00", project="NCGD0043",
# env_extra=env,
# )
import dask_jobqueue
cluster = dask_jobqueue.PBSCluster(
cores=1, # The number of cores you want
memory="23GB", # Amount of memory
processes=1, # How many processes
queue="casper", # The type of queue to utilize (/glade/u/apps/dav/opt/usr/bin/execcasper)
local_directory="$TMPDIR", # Use your local directory
resource_spec="select=1:ncpus=1:mem=23GB", # Specify resources
project="ncgd0011", # Input your project ID here
walltime="02:00:00", # Amount of wall time
interface="ib0", # Interface to use
)
cluster.scale(jobs=6)
# %load_ext autoreload
# %autoreload 2
%matplotlib inline
import cf_xarray
import dask
import dcpy
import distributed
import holoviews as hv
import hvplot.xarray
import matplotlib as mpl
import matplotlib.dates as mdates
import matplotlib.pyplot as plt
import matplotlib.units as munits
import numpy as np
import pandas as pd
import pump
from pump.calc import ddx, ddy, ddz
import seawater as sw
from holoviews import opts
import xarray as xr
# import hvplot.xarray
# import facetgrid
# mpl.rcParams["savefig.dpi"] = 300
# mpl.rcParams["savefig.bbox"] = "tight"
# mpl.rcParams["figure.dpi"] = 140
munits.registry[np.datetime64] = mdates.ConciseDateConverter()
xr.set_options(keep_attrs=True)
from dask.cache import Cache
cache = Cache(5e9, 0.4) # Leverage two gigabytes of memory
cache.register() # Turn cache on globally
hv.extension("bokeh")
# hv.opts.defaults(opts.Image(fontscale=1.5), opts.Curve(fontscale=1.5))
print(dask.__version__)
print(distributed.__version__)
print(xr.__version__)
def unpack(d):
val = []
for k, v in d.items():
if isinstance(v, dict):
val.extend(unpack(v))
else:
val.append(v)
return val
xr.DataArray([1.0])


2.30.0
2.30.0
0.16.3.dev150+g37522e991
<xarray.DataArray (dim_0: 1)> array([1.]) Dimensions without coordinates: dim_0
xarray.DataArray
- dim_0: 1
- 1.0
array([1.])
client = distributed.Client(cluster)
client
Client
|
Cluster
|
def slice_like(obj, other):
indexes = set(obj.indexes) & set(other.indexes)
return obj.sel({k: slice(other[k][0].values, other[k][-1].values) for k in indexes})
gcm1 = pump.model.Model(
"/glade/u/home/dcherian/pump/TPOS_MITgcm_1_hb/HOLD_NC_LINKS/",
name="gcm1",
full=False,
budget=False,
)
# gcm1.tao.load()
# gcm1.tao = xr.merge([gcm1.tao, pump.calc.get_tiw_phase(gcm1.tao.v)])
# gcm1.surface["zeta"] = xr.open_dataset(gcm1.dirname + "obs_subset/surface_zeta.nc").zeta
# gcm1.surface = gcm1.surface.chunk({"time": 1})
# gcm1.surface["zeta"] = gcm1.surface.v.differentiate("longitude") - gcm1.surface.u.differentiate("latitude")
---------------------------------------------------------------------------
AttributeError Traceback (most recent call last)
<ipython-input-5-17e9045cc9c0> in <module>
----> 1 gcm1 = pump.model.Model(
2 "/glade/u/home/dcherian/pump/TPOS_MITgcm_1_hb/HOLD_NC_LINKS/",
3 name="gcm1",
4 full=False,
5 budget=False,
~/pump/pump/model.py in __init__(self, dirname, name, kind, full, budget)
510 self.depth = None
511
--> 512 self.update_coords()
513 self.read_metrics()
514
~/pump/pump/model.py in update_coords(self)
770 elif "latitude" in self.full:
771 ds = self.full
--> 772 elif "latitude" in self.budget:
773 ds = self.budget
774 else:
AttributeError: 'Model' object has no attribute 'budget'
gcm1.tao["mld"] = pump.calc.get_mld(gcm1.tao.dens)
gcm1.tao["dcl"] = pump.calc.get_dcl_base_Ri(gcm1.tao)
Read data#
/glade/scratch/dcherian/TPOS_MITgcm_1_hb/110w-period-4-with-jq.nc has in-situ density
# period4 = xr.open_dataset("/glade/scratch/dcherian/TPOS_MITgcm_1_hb/110w-period-4-with-jq.nc")
period4 = xr.open_zarr(
"/glade/work/dcherian/pump/zarrs/110w-period-4-4.zarr", consolidated=True
).chunk({"time": 50})
period4.latitude.attrs = {"long_name": "Latitude", "units": "°N"}
metrics = (
pump.model.read_metrics(
f"/glade/campaign/cgd/oce/people/dcherian/TPOS_MITgcm_1_hb/"
)
.reindex_like(period4, method="nearest")
.load()
)
# from http://mailman.mitgcm.org/pipermail/mitgcm-support/2010-December/006921.html
period4["Um_Impl"] = period4.VISrI_Um.diff("depth", label="lower") / (
metrics.rAw * metrics.drF * metrics.hFacW
)
period4["Vm_Impl"] = period4.VISrI_Vm.diff("depth", label="lower") / (
metrics.rAw * metrics.drF * metrics.hFacW
)
# period4["time"] = period4["time"] - pd.Timedelta("7h")
# period4["dens"] = pump.mdjwf.dens(period4.salt, period4.theta, np.array([0.0]))
# period4 = pump.calc.calc_reduced_shear(period4)
# period4["mld"] = pump.calc.get_mld(period4.dens)
# period4["dcl_base"] = pump.calc.get_dcl_base_Ri(period4)
# period4["dcl"] = period4["mld"] - period4["dcl_base"]
# period4["sst"] = period4.theta.isel(depth=0)
# period4["eucmax"] = pump.calc.get_euc_max(
# period4.u.sel(latitude=0, method="nearest", drop=True)
# )
period4["nonlocal_flux"] = 1035 * 3995 * period4.KPPg_TH / metrics.RAC
# period4.nonlocal_flux.isel(longitude=1).sel(latitude=3.5, method="nearest").plot(y="depth")
snapshot_times = pd.to_datetime(
[
"1995-11-18 00:00",
# "1995-11-24 18:00",
"1995-11-26 06:00",
"1995-12-03 18:00",
# "1995-12-09 18:00",
]
)
period4["dcl_mask"] = (
(period4.depth < period4.mld)
& (period4.depth > period4.dcl_base)
& (period4.dcl > 30)
)
import dcpy.interpolate
period4["hRib"] = (
dcpy.interpolate.pchip_roots_old(
period4.KPPRi.sortby("depth").chunk({"depth": -1}), dim="depth", target=0.3
)
.squeeze()
.persist()
)
period4 = period4.persist()
# period4.depth.attrs["units"] = "m"
# period4.Jq.attrs["long_name"] = "$J^t_q$"
# period4.Jq.attrs["units"] = "W/m²"
# period4.S2.attrs["long_name"] = "$S²$"
# period4.S2.attrs["units"] = "$s^{-2}$"
# period4.Ri.attrs["long_name"] = "$Ri$"
# period4.N2.attrs["long_name"] = "$N²$"
# period4.N2.attrs["units"] = "$s^{-2}$"
/glade/u/home/dcherian/miniconda3/envs/dcpy/lib/python3.8/site-packages/xarray/core/indexing.py:1375: PerformanceWarning: Slicing is producing a large chunk. To accept the large
chunk and silence this warning, set the option
>>> with dask.config.set(**{'array.slicing.split_large_chunks': False}):
... array[indexer]
To avoid creating the large chunks, set the option
>>> with dask.config.set(**{'array.slicing.split_large_chunks': True}):
... array[indexer]
value = value[(slice(None),) * axis + (subkey,)]
/glade/u/home/dcherian/miniconda3/envs/dcpy/lib/python3.8/site-packages/xarray/core/indexing.py:1369: PerformanceWarning: Slicing is producing a large chunk. To accept the large
chunk and silence this warning, set the option
>>> with dask.config.set(**{'array.slicing.split_large_chunks': False}):
... array[indexer]
To avoid creating the large chunks, set the option
>>> with dask.config.set(**{'array.slicing.split_large_chunks': True}):
... array[indexer]
return self.array[key]
vort = pump.calc.vorticity(period4).isel(longitude=1).compute()
vort["vy"] = pump.calc.ddy(period4.v.isel(longitude=1)).compute()
(vort.f + vort.vx - vort.uy).sel(depth=slice(-60)).mean("depth").plot(
x="time", robust=True
)
<matplotlib.collections.QuadMesh at 0x2accedcf4ee0>
test viscous term#
period4.Um_Impl.isel(longitude=1).sel(latitude=0, method="nearest").rolling(
depth=4
).mean().plot(x="time", robust=True)
<matplotlib.collections.QuadMesh at 0x2af30fc93c50>
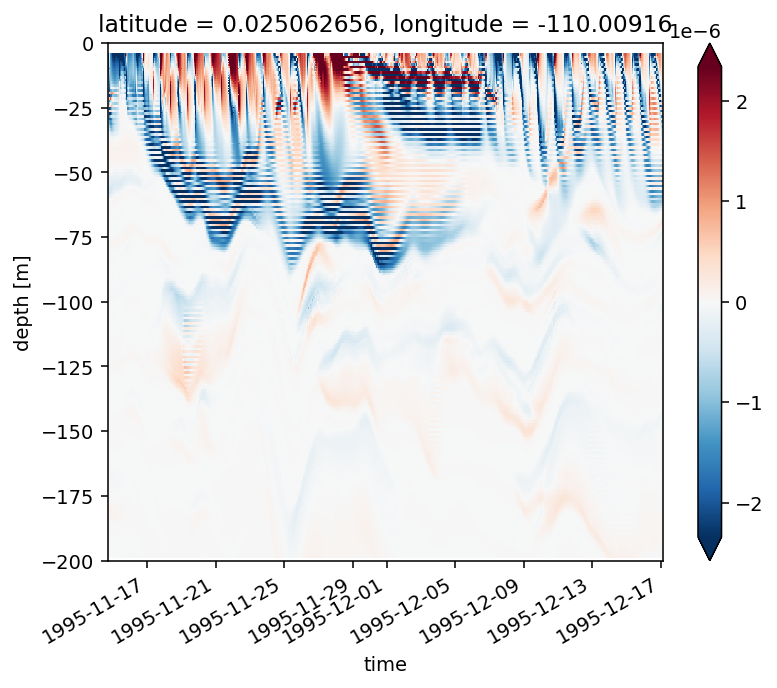
Figure 1: snapshot#
gcm1.read_budget()
/glade/u/home/dcherian/python/xarray/xarray/core/indexing.py:1369: PerformanceWarning: Slicing is producing a large chunk. To accept the large
chunk and silence this warning, set the option
>>> with dask.config.set(**{'array.slicing.split_large_chunks': False}):
... array[indexer]
To avoid creating the large chunks, set the option
>>> with dask.config.set(**{'array.slicing.split_large_chunks': True}):
... array[indexer]
return self.array[key]
gcm1 = pump.model.Model(
"/glade/u/home/dcherian/pump/TPOS_MITgcm_1_hb/HOLD_NC_LINKS/",
name="gcm1",
full=True,
budget=True,
)
gcm1.full = pump.calc_reduced_shear(gcm1.full)
gcm1.full["mld"] = pump.calc.get_mld(gcm1.full.dens.sel(depth=slice(-200)))
gcm1.full["dcl_base"] = pump.calc.get_dcl_base_Ri(gcm1.full)
gcm1.full
calc uz
calc vz
Exception ignored in: <bound method GCDiagnosis._gc_callback of <distributed.utils_perf.GCDiagnosis object at 0x2b60d609da90>>
Traceback (most recent call last):
File "/glade/u/home/dcherian/miniconda3/envs/dcpy/lib/python3.8/site-packages/distributed/utils_perf.py", line 183, in _gc_callback
def _gc_callback(self, phase, info):
KeyboardInterrupt:
calc S2
calc N2
Exception ignored in: <bound method GCDiagnosis._gc_callback of <distributed.utils_perf.GCDiagnosis object at 0x2b60d609da90>>
Traceback (most recent call last):
File "/glade/u/home/dcherian/miniconda3/envs/dcpy/lib/python3.8/site-packages/distributed/utils_perf.py", line 193, in _gc_callback
self._fractional_timer.start_timing()
File "/glade/u/home/dcherian/miniconda3/envs/dcpy/lib/python3.8/site-packages/distributed/utils_perf.py", line 116, in start_timing
assert self._cur_start is None
AssertionError:
calc shred2
Calc Ri
<xarray.Dataset>
Dimensions: (depth: 345, latitude: 480, longitude: 1500, time: 2947)
Coordinates:
* latitude (latitude) float32 -12.0 -11.95 -11.9 ... 11.9 11.95 12.0
* longitude (longitude) float32 -170.0 -169.9 -169.9 ... -95.05 -95.0
* depth (depth) float32 -0.5 -1.5 -2.5 ... -5.666e+03 -5.766e+03
* time (time) datetime64[ns] 1995-09-01 ... 1997-01-04T12:00:00
Data variables:
theta (time, depth, latitude, longitude) float32 dask.array<chunksize=(1, 100, 138, 430), meta=np.ndarray>
u (time, depth, latitude, longitude) float32 dask.array<chunksize=(1, 100, 138, 430), meta=np.ndarray>
v (time, depth, latitude, longitude) float32 dask.array<chunksize=(1, 100, 138, 430), meta=np.ndarray>
w (time, depth, latitude, longitude) float32 dask.array<chunksize=(1, 100, 138, 430), meta=np.ndarray>
salt (time, depth, latitude, longitude) float32 dask.array<chunksize=(1, 100, 138, 430), meta=np.ndarray>
KPP_diffusivity (time, depth, latitude, longitude) float32 dask.array<chunksize=(1, 100, 138, 430), meta=np.ndarray>
dens (time, depth, latitude, longitude) float64 dask.array<chunksize=(1, 100, 138, 430), meta=np.ndarray>
uz (time, depth, latitude, longitude) float32 dask.array<chunksize=(1, 100, 138, 430), meta=np.ndarray>
vz (time, depth, latitude, longitude) float32 dask.array<chunksize=(1, 100, 138, 430), meta=np.ndarray>
S2 (time, depth, latitude, longitude) float32 dask.array<chunksize=(1, 100, 138, 430), meta=np.ndarray>
shear (time, depth, latitude, longitude) float32 dask.array<chunksize=(1, 100, 138, 430), meta=np.ndarray>
N2 (time, depth, latitude, longitude) float64 dask.array<chunksize=(1, 100, 138, 430), meta=np.ndarray>
shred2 (time, depth, latitude, longitude) float64 dask.array<chunksize=(1, 100, 138, 430), meta=np.ndarray>
Ri (time, depth, latitude, longitude) float64 dask.array<chunksize=(1, 100, 138, 430), meta=np.ndarray>
mld (time, latitude, longitude) float32 dask.array<chunksize=(1, 138, 430), meta=np.ndarray>
dcl_base (time, latitude, longitude) float32 dask.array<chunksize=(1, 69, 215), meta=np.ndarray>
Attributes:
title: daily snapshot from 1/20 degree Equatorial Pacific MI...
easting: longitude
northing: latitude
field_julian_date: 400296
julian_day_unit: days since 1950-01-01 00:00:00xarray.Dataset
- depth: 345
- latitude: 480
- longitude: 1500
- time: 2947
- latitude(latitude)float32-12.0 -11.95 -11.9 ... 11.95 12.0
array([-12. , -11.949896, -11.899791, ..., 11.899791, 11.949896, 12. ], dtype=float32) - longitude(longitude)float32-170.0 -169.9 ... -95.05 -95.0
array([-170. , -169.94997, -169.89993, ..., -95.10007, -95.05003, -95. ], dtype=float32) - depth(depth)float32-0.5 -1.5 ... -5.666e+03 -5.766e+03
array([-5.000000e-01, -1.500000e+00, -2.500000e+00, ..., -5.565922e+03, -5.665922e+03, -5.765922e+03], dtype=float32) - time(time)datetime64[ns]1995-09-01 ... 1997-01-04T12:00:00
- long_name :
- Time (hours since 1950-01-01)
- standard_name :
- time
- axis :
- T
- _CoordinateAxisType :
- Time
array(['1995-09-01T00:00:00.000000000', '1995-09-01T04:00:00.000000000', '1995-09-01T08:00:00.000000000', ..., '1997-01-03T20:00:00.000000000', '1997-01-04T00:00:00.000000000', '1997-01-04T12:00:00.000000000'], dtype='datetime64[ns]')
- theta(time, depth, latitude, longitude)float32dask.array<chunksize=(1, 100, 138, 430), meta=np.ndarray>
Array Chunk Bytes 2.93 TB 23.74 MB Shape (2947, 345, 480, 1500) (1, 100, 138, 430) Count 380163 Tasks 188608 Chunks Type float32 numpy.ndarray - u(time, depth, latitude, longitude)float32dask.array<chunksize=(1, 100, 138, 430), meta=np.ndarray>
Array Chunk Bytes 2.93 TB 23.74 MB Shape (2947, 345, 480, 1500) (1, 100, 138, 430) Count 380163 Tasks 188608 Chunks Type float32 numpy.ndarray - v(time, depth, latitude, longitude)float32dask.array<chunksize=(1, 100, 138, 430), meta=np.ndarray>
Array Chunk Bytes 2.93 TB 23.74 MB Shape (2947, 345, 480, 1500) (1, 100, 138, 430) Count 380163 Tasks 188608 Chunks Type float32 numpy.ndarray - w(time, depth, latitude, longitude)float32dask.array<chunksize=(1, 100, 138, 430), meta=np.ndarray>
Array Chunk Bytes 2.93 TB 23.74 MB Shape (2947, 345, 480, 1500) (1, 100, 138, 430) Count 380163 Tasks 188608 Chunks Type float32 numpy.ndarray - salt(time, depth, latitude, longitude)float32dask.array<chunksize=(1, 100, 138, 430), meta=np.ndarray>
Array Chunk Bytes 2.93 TB 23.74 MB Shape (2947, 345, 480, 1500) (1, 100, 138, 430) Count 380163 Tasks 188608 Chunks Type float32 numpy.ndarray - KPP_diffusivity(time, depth, latitude, longitude)float32dask.array<chunksize=(1, 100, 138, 430), meta=np.ndarray>
Array Chunk Bytes 2.93 TB 23.74 MB Shape (2947, 345, 480, 1500) (1, 100, 138, 430) Count 380163 Tasks 188608 Chunks Type float32 numpy.ndarray - dens(time, depth, latitude, longitude)float64dask.array<chunksize=(1, 100, 138, 430), meta=np.ndarray>
Array Chunk Bytes 5.86 TB 47.47 MB Shape (2947, 345, 480, 1500) (1, 100, 138, 430) Count 1326151 Tasks 188608 Chunks Type float64 numpy.ndarray - uz(time, depth, latitude, longitude)float32dask.array<chunksize=(1, 100, 138, 430), meta=np.ndarray>
Array Chunk Bytes 2.93 TB 23.74 MB Shape (2947, 345, 480, 1500) (1, 100, 138, 430) Count 1794723 Tasks 188608 Chunks Type float32 numpy.ndarray - vz(time, depth, latitude, longitude)float32dask.array<chunksize=(1, 100, 138, 430), meta=np.ndarray>
Array Chunk Bytes 2.93 TB 23.74 MB Shape (2947, 345, 480, 1500) (1, 100, 138, 430) Count 1794723 Tasks 188608 Chunks Type float32 numpy.ndarray - S2(time, depth, latitude, longitude)float32dask.array<chunksize=(1, 100, 138, 430), meta=np.ndarray>
- long_name :
- $S^2$
- units :
- s$^{-2}$
Array Chunk Bytes 2.93 TB 23.74 MB Shape (2947, 345, 480, 1500) (1, 100, 138, 430) Count 4155270 Tasks 188608 Chunks Type float32 numpy.ndarray - shear(time, depth, latitude, longitude)float32dask.array<chunksize=(1, 100, 138, 430), meta=np.ndarray>
- long_name :
- |$u_z$|
- units :
- s$^{-1}$
Array Chunk Bytes 2.93 TB 23.74 MB Shape (2947, 345, 480, 1500) (1, 100, 138, 430) Count 4343878 Tasks 188608 Chunks Type float32 numpy.ndarray - N2(time, depth, latitude, longitude)float64dask.array<chunksize=(1, 100, 138, 430), meta=np.ndarray>
- long_name :
- $N^2$
- units :
- s$^{-2}$
Array Chunk Bytes 5.86 TB 47.47 MB Shape (2947, 345, 480, 1500) (1, 100, 138, 430) Count 2929319 Tasks 188608 Chunks Type float64 numpy.ndarray - shred2(time, depth, latitude, longitude)float64dask.array<chunksize=(1, 100, 138, 430), meta=np.ndarray>
- long_name :
- Reduced shear$^2$
- units :
- $s^{-2}$
Array Chunk Bytes 5.86 TB 47.47 MB Shape (2947, 345, 480, 1500) (1, 100, 138, 430) Count 7461805 Tasks 188608 Chunks Type float64 numpy.ndarray - Ri(time, depth, latitude, longitude)float64dask.array<chunksize=(1, 100, 138, 430), meta=np.ndarray>
- long_name :
- Ri
- units :
Array Chunk Bytes 5.86 TB 47.47 MB Shape (2947, 345, 480, 1500) (1, 100, 138, 430) Count 7273197 Tasks 188608 Chunks Type float64 numpy.ndarray - mld(time, latitude, longitude)float32dask.array<chunksize=(1, 138, 430), meta=np.ndarray>
- long_name :
- MLD
- units :
- m
- description :
- Interpolate density to 1m grid. Search for max depth where |drho| > 0.01 and N2 > 1e-5
Array Chunk Bytes 8.49 GB 237.36 kB Shape (2947, 480, 1500) (1, 138, 430) Count 3023628 Tasks 47152 Chunks Type float32 numpy.ndarray - dcl_base(time, latitude, longitude)float32dask.array<chunksize=(1, 69, 215), meta=np.ndarray>
- long_name :
- DCL Base (Ri)
- units :
- m
- description :
- Deepest depth above EUC where Ri=0.54
Array Chunk Bytes 8.49 GB 59.34 kB Shape (2947, 480, 1500) (1, 69, 215) Count 16299873 Tasks 144403 Chunks Type float32 numpy.ndarray
- title :
- daily snapshot from 1/20 degree Equatorial Pacific MITgcm simulation
- easting :
- longitude
- northing :
- latitude
- field_julian_date :
- 400296
- julian_day_unit :
- days since 1950-01-01 00:00:00
time = "1995-12-04"
# gcm1.full["time"] = gcm1.full.time - pd.Timedelta("8h")
# gcm1.budget["time"] = gcm1.budget.time - pd.Timedelta("8h")
extract = gcm1.full.sel(time=time)
extract["Jq"] = gcm1.budget.Jq.sel(time=time)
extract["oceQnet"] = gcm1.budget.oceQnet.sel(time=time)
# extract.sel(depth=slice(-200)).to_zarr("/glade/scratch/dcherian/TPOS_MITgcm_1_hb/snapshot.zarr")
extract
<xarray.Dataset>
Dimensions: (depth: 345, latitude: 480, longitude: 1500, time: 6)
Coordinates:
* latitude (latitude) float32 -12.0 -11.95 -11.9 ... 11.9 11.95 12.0
* longitude (longitude) float32 -170.0 -169.9 -169.9 ... -95.05 -95.0
* depth (depth) float64 -0.5 -1.5 -2.5 ... -5.666e+03 -5.766e+03
* time (time) datetime64[ns] 1995-12-04 ... 1995-12-04T20:00:00
Data variables:
theta (time, depth, latitude, longitude) float32 dask.array<chunksize=(1, 100, 138, 430), meta=np.ndarray>
u (time, depth, latitude, longitude) float32 dask.array<chunksize=(1, 100, 138, 430), meta=np.ndarray>
v (time, depth, latitude, longitude) float32 dask.array<chunksize=(1, 100, 138, 430), meta=np.ndarray>
w (time, depth, latitude, longitude) float32 dask.array<chunksize=(1, 100, 138, 430), meta=np.ndarray>
salt (time, depth, latitude, longitude) float32 dask.array<chunksize=(1, 100, 138, 430), meta=np.ndarray>
KPP_diffusivity (time, depth, latitude, longitude) float32 dask.array<chunksize=(1, 100, 138, 430), meta=np.ndarray>
dens (time, depth, latitude, longitude) float64 dask.array<chunksize=(1, 100, 138, 430), meta=np.ndarray>
uz (time, depth, latitude, longitude) float32 dask.array<chunksize=(1, 100, 138, 430), meta=np.ndarray>
vz (time, depth, latitude, longitude) float32 dask.array<chunksize=(1, 100, 138, 430), meta=np.ndarray>
S2 (time, depth, latitude, longitude) float32 dask.array<chunksize=(1, 100, 138, 430), meta=np.ndarray>
shear (time, depth, latitude, longitude) float32 dask.array<chunksize=(1, 100, 138, 430), meta=np.ndarray>
N2 (time, depth, latitude, longitude) float64 dask.array<chunksize=(1, 100, 138, 430), meta=np.ndarray>
shred2 (time, depth, latitude, longitude) float64 dask.array<chunksize=(1, 100, 138, 430), meta=np.ndarray>
Ri (time, depth, latitude, longitude) float64 dask.array<chunksize=(1, 100, 138, 430), meta=np.ndarray>
mld (time, latitude, longitude) float32 dask.array<chunksize=(1, 138, 430), meta=np.ndarray>
dcl_base (time, latitude, longitude) float32 dask.array<chunksize=(1, 69, 215), meta=np.ndarray>
Jq (time, depth, latitude, longitude) float64 dask.array<chunksize=(1, 100, 138, 430), meta=np.ndarray>
oceQnet (time, latitude, longitude) float32 dask.array<chunksize=(1, 480, 1500), meta=np.ndarray>
Attributes:
title: daily snapshot from 1/20 degree Equatorial Pacific MI...
easting: longitude
northing: latitude
field_julian_date: 400296
julian_day_unit: days since 1950-01-01 00:00:00xarray.Dataset
- depth: 345
- latitude: 480
- longitude: 1500
- time: 6
- latitude(latitude)float32-12.0 -11.95 -11.9 ... 11.95 12.0
array([-12. , -11.949896, -11.899791, ..., 11.899791, 11.949896, 12. ], dtype=float32) - longitude(longitude)float32-170.0 -169.9 ... -95.05 -95.0
array([-170. , -169.94997, -169.89993, ..., -95.10007, -95.05003, -95. ], dtype=float32) - depth(depth)float64-0.5 -1.5 ... -5.666e+03 -5.766e+03
array([-5.000000e-01, -1.500000e+00, -2.500000e+00, ..., -5.565922e+03, -5.665922e+03, -5.765922e+03]) - time(time)datetime64[ns]1995-12-04 ... 1995-12-04T20:00:00
- long_name :
- Time (hours since 1950-01-01)
- standard_name :
- time
- axis :
- T
- _CoordinateAxisType :
- Time
array(['1995-12-04T00:00:00.000000000', '1995-12-04T04:00:00.000000000', '1995-12-04T08:00:00.000000000', '1995-12-04T12:00:00.000000000', '1995-12-04T16:00:00.000000000', '1995-12-04T20:00:00.000000000'], dtype='datetime64[ns]')
- theta(time, depth, latitude, longitude)float32dask.array<chunksize=(1, 100, 138, 430), meta=np.ndarray>
Array Chunk Bytes 5.96 GB 23.74 MB Shape (6, 345, 480, 1500) (1, 100, 138, 430) Count 380547 Tasks 384 Chunks Type float32 numpy.ndarray - u(time, depth, latitude, longitude)float32dask.array<chunksize=(1, 100, 138, 430), meta=np.ndarray>
Array Chunk Bytes 5.96 GB 23.74 MB Shape (6, 345, 480, 1500) (1, 100, 138, 430) Count 380547 Tasks 384 Chunks Type float32 numpy.ndarray - v(time, depth, latitude, longitude)float32dask.array<chunksize=(1, 100, 138, 430), meta=np.ndarray>
Array Chunk Bytes 5.96 GB 23.74 MB Shape (6, 345, 480, 1500) (1, 100, 138, 430) Count 380547 Tasks 384 Chunks Type float32 numpy.ndarray - w(time, depth, latitude, longitude)float32dask.array<chunksize=(1, 100, 138, 430), meta=np.ndarray>
Array Chunk Bytes 5.96 GB 23.74 MB Shape (6, 345, 480, 1500) (1, 100, 138, 430) Count 380547 Tasks 384 Chunks Type float32 numpy.ndarray - salt(time, depth, latitude, longitude)float32dask.array<chunksize=(1, 100, 138, 430), meta=np.ndarray>
Array Chunk Bytes 5.96 GB 23.74 MB Shape (6, 345, 480, 1500) (1, 100, 138, 430) Count 380547 Tasks 384 Chunks Type float32 numpy.ndarray - KPP_diffusivity(time, depth, latitude, longitude)float32dask.array<chunksize=(1, 100, 138, 430), meta=np.ndarray>
Array Chunk Bytes 5.96 GB 23.74 MB Shape (6, 345, 480, 1500) (1, 100, 138, 430) Count 380547 Tasks 384 Chunks Type float32 numpy.ndarray - dens(time, depth, latitude, longitude)float64dask.array<chunksize=(1, 100, 138, 430), meta=np.ndarray>
Array Chunk Bytes 11.92 GB 47.47 MB Shape (6, 345, 480, 1500) (1, 100, 138, 430) Count 1326535 Tasks 384 Chunks Type float64 numpy.ndarray - uz(time, depth, latitude, longitude)float32dask.array<chunksize=(1, 100, 138, 430), meta=np.ndarray>
Array Chunk Bytes 5.96 GB 23.74 MB Shape (6, 345, 480, 1500) (1, 100, 138, 430) Count 1795107 Tasks 384 Chunks Type float32 numpy.ndarray - vz(time, depth, latitude, longitude)float32dask.array<chunksize=(1, 100, 138, 430), meta=np.ndarray>
Array Chunk Bytes 5.96 GB 23.74 MB Shape (6, 345, 480, 1500) (1, 100, 138, 430) Count 1795107 Tasks 384 Chunks Type float32 numpy.ndarray - S2(time, depth, latitude, longitude)float32dask.array<chunksize=(1, 100, 138, 430), meta=np.ndarray>
- long_name :
- $S^2$
- units :
- s$^{-2}$
Array Chunk Bytes 5.96 GB 23.74 MB Shape (6, 345, 480, 1500) (1, 100, 138, 430) Count 4155654 Tasks 384 Chunks Type float32 numpy.ndarray - shear(time, depth, latitude, longitude)float32dask.array<chunksize=(1, 100, 138, 430), meta=np.ndarray>
- long_name :
- |$u_z$|
- units :
- s$^{-1}$
Array Chunk Bytes 5.96 GB 23.74 MB Shape (6, 345, 480, 1500) (1, 100, 138, 430) Count 4344262 Tasks 384 Chunks Type float32 numpy.ndarray - N2(time, depth, latitude, longitude)float64dask.array<chunksize=(1, 100, 138, 430), meta=np.ndarray>
- long_name :
- $N^2$
- units :
- s$^{-2}$
Array Chunk Bytes 11.92 GB 47.47 MB Shape (6, 345, 480, 1500) (1, 100, 138, 430) Count 2929703 Tasks 384 Chunks Type float64 numpy.ndarray - shred2(time, depth, latitude, longitude)float64dask.array<chunksize=(1, 100, 138, 430), meta=np.ndarray>
- long_name :
- Reduced shear$^2$
- units :
- $s^{-2}$
Array Chunk Bytes 11.92 GB 47.47 MB Shape (6, 345, 480, 1500) (1, 100, 138, 430) Count 7462189 Tasks 384 Chunks Type float64 numpy.ndarray - Ri(time, depth, latitude, longitude)float64dask.array<chunksize=(1, 100, 138, 430), meta=np.ndarray>
- long_name :
- Ri
- units :
Array Chunk Bytes 11.92 GB 47.47 MB Shape (6, 345, 480, 1500) (1, 100, 138, 430) Count 7273581 Tasks 384 Chunks Type float64 numpy.ndarray - mld(time, latitude, longitude)float32dask.array<chunksize=(1, 138, 430), meta=np.ndarray>
- long_name :
- MLD
- units :
- m
- description :
- Interpolate density to 1m grid. Search for max depth where |drho| > 0.01 and N2 > 1e-5
Array Chunk Bytes 17.28 MB 237.36 kB Shape (6, 480, 1500) (1, 138, 430) Count 3023724 Tasks 96 Chunks Type float32 numpy.ndarray - dcl_base(time, latitude, longitude)float32dask.array<chunksize=(1, 69, 215), meta=np.ndarray>
- long_name :
- DCL Base (Ri)
- units :
- m
- description :
- Deepest depth above EUC where Ri=0.54
Array Chunk Bytes 17.28 MB 59.34 kB Shape (6, 480, 1500) (1, 69, 215) Count 16300167 Tasks 294 Chunks Type float32 numpy.ndarray - Jq(time, depth, latitude, longitude)float64dask.array<chunksize=(1, 100, 138, 430), meta=np.ndarray>
- long_name :
- $J_q^t$
- units :
- W/m$^2$
Array Chunk Bytes 11.92 GB 47.47 MB Shape (6, 345, 480, 1500) (1, 100, 138, 430) Count 1963082 Tasks 384 Chunks Type float64 numpy.ndarray - oceQnet(time, latitude, longitude)float32dask.array<chunksize=(1, 480, 1500), meta=np.ndarray>
Array Chunk Bytes 17.28 MB 2.88 MB Shape (6, 480, 1500) (1, 480, 1500) Count 9834 Tasks 6 Chunks Type float32 numpy.ndarray
- title :
- daily snapshot from 1/20 degree Equatorial Pacific MITgcm simulation
- easting :
- longitude
- northing :
- latitude
- field_julian_date :
- 400296
- julian_day_unit :
- days since 1950-01-01 00:00:00
(
extract.sel(depth=slice(-200), latitude=slice(-10, 10))
.chunk({"latitude": 138})
.to_zarr("/glade/work/dcherian/pump/zarrs/snapshot.zarr", mode="w")
)
<xarray.backends.zarr.ZarrStore at 0x2b6298eddfa0>
integrate jq in the dcl over a day
snapshot = xr.open_zarr("/glade/work/dcherian/pump/zarrs/snapshot.zarr")
snapshot["ijq"] = (
snapshot.Jq.sel(depth=slice(-250))
.where(
(snapshot.depth.sel(depth=slice(-250)) < snapshot.mld)
& (snapshot.depth >= snapshot.dcl_base)
)
.sum("depth")
)
snapshot["dcl"] = snapshot["mld"] - snapshot["dcl_base"]
snapshot["dcl"] = snapshot.dcl.where(snapshot.dcl > 5, 0)
snapshot["sst"] = snapshot.theta.isel(depth=0)
snapshot["umean"] = snapshot.u.sel(depth=slice(-50, -250)).mean("depth")
snapshot["sst"].attrs["long_name"] = "SST"
snapshot["sst"].attrs["units"] = "°C"
snapshot["oceQnet"].attrs["long_name"] = "$Q_{net}$"
snapshot["oceQnet"].attrs["units"] = "W/m²"
snapshot["ijq"].attrs["long_name"] = "Avg. $J_q^t$ in low Ri layer"
snapshot["ijq"].attrs["units"] = "W/m²"
snapshot["dcl"].attrs["long_name"] = "Low Ri layer width"
snapshot["dcl"].attrs["units"] = "m"
snapshot["umean"].attrs["long_name"] = "Mean 50-250m $u$"
snapshot["umean"].attrs["units"] = "m/s"
xr.set_options(keep_attrs=True)
extract = snapshot.mean("time").compute()
snapshot
<xarray.Dataset>
Dimensions: (depth: 200, latitude: 400, longitude: 1500, time: 6)
Coordinates:
* depth (depth) float32 -0.5 -1.5 -2.5 ... -197.5 -198.5 -199.5
* latitude (latitude) float32 -9.996 -9.946 -9.896 ... 9.946 9.996
* longitude (longitude) float32 -170.0 -169.9 -169.9 ... -95.05 -95.0
* time (time) datetime64[ns] 1995-12-04 ... 1995-12-04T20:00:00
Data variables: (12/22)
Jq (time, depth, latitude, longitude) float64 dask.array<chunksize=(1, 100, 138, 430), meta=np.ndarray>
KPP_diffusivity (time, depth, latitude, longitude) float32 dask.array<chunksize=(1, 100, 138, 430), meta=np.ndarray>
N2 (time, depth, latitude, longitude) float64 dask.array<chunksize=(1, 100, 138, 430), meta=np.ndarray>
Ri (time, depth, latitude, longitude) float64 dask.array<chunksize=(1, 100, 138, 430), meta=np.ndarray>
S2 (time, depth, latitude, longitude) float32 dask.array<chunksize=(1, 100, 138, 430), meta=np.ndarray>
dcl_base (time, latitude, longitude) float32 dask.array<chunksize=(1, 138, 215), meta=np.ndarray>
... ...
vz (time, depth, latitude, longitude) float32 dask.array<chunksize=(1, 100, 138, 430), meta=np.ndarray>
w (time, depth, latitude, longitude) float32 dask.array<chunksize=(1, 100, 138, 430), meta=np.ndarray>
ijq (time, latitude, longitude) float64 dask.array<chunksize=(1, 138, 215), meta=np.ndarray>
dcl (time, latitude, longitude) float32 dask.array<chunksize=(1, 138, 215), meta=np.ndarray>
sst (time, latitude, longitude) float32 dask.array<chunksize=(1, 138, 430), meta=np.ndarray>
umean (time, latitude, longitude) float32 dask.array<chunksize=(1, 138, 430), meta=np.ndarray>
Attributes:
easting: longitude
field_julian_date: 400296
julian_day_unit: days since 1950-01-01 00:00:00
northing: latitude
title: daily snapshot from 1/20 degree Equatorial Pacific MI...xarray.Dataset
- depth: 200
- latitude: 400
- longitude: 1500
- time: 6
- depth(depth)float32-0.5 -1.5 -2.5 ... -198.5 -199.5
array([ -0.5, -1.5, -2.5, -3.5, -4.5, -5.5, -6.5, -7.5, -8.5, -9.5, -10.5, -11.5, -12.5, -13.5, -14.5, -15.5, -16.5, -17.5, -18.5, -19.5, -20.5, -21.5, -22.5, -23.5, -24.5, -25.5, -26.5, -27.5, -28.5, -29.5, -30.5, -31.5, -32.5, -33.5, -34.5, -35.5, -36.5, -37.5, -38.5, -39.5, -40.5, -41.5, -42.5, -43.5, -44.5, -45.5, -46.5, -47.5, -48.5, -49.5, -50.5, -51.5, -52.5, -53.5, -54.5, -55.5, -56.5, -57.5, -58.5, -59.5, -60.5, -61.5, -62.5, -63.5, -64.5, -65.5, -66.5, -67.5, -68.5, -69.5, -70.5, -71.5, -72.5, -73.5, -74.5, -75.5, -76.5, -77.5, -78.5, -79.5, -80.5, -81.5, -82.5, -83.5, -84.5, -85.5, -86.5, -87.5, -88.5, -89.5, -90.5, -91.5, -92.5, -93.5, -94.5, -95.5, -96.5, -97.5, -98.5, -99.5, -100.5, -101.5, -102.5, -103.5, -104.5, -105.5, -106.5, -107.5, -108.5, -109.5, -110.5, -111.5, -112.5, -113.5, -114.5, -115.5, -116.5, -117.5, -118.5, -119.5, -120.5, -121.5, -122.5, -123.5, -124.5, -125.5, -126.5, -127.5, -128.5, -129.5, -130.5, -131.5, -132.5, -133.5, -134.5, -135.5, -136.5, -137.5, -138.5, -139.5, -140.5, -141.5, -142.5, -143.5, -144.5, -145.5, -146.5, -147.5, -148.5, -149.5, -150.5, -151.5, -152.5, -153.5, -154.5, -155.5, -156.5, -157.5, -158.5, -159.5, -160.5, -161.5, -162.5, -163.5, -164.5, -165.5, -166.5, -167.5, -168.5, -169.5, -170.5, -171.5, -172.5, -173.5, -174.5, -175.5, -176.5, -177.5, -178.5, -179.5, -180.5, -181.5, -182.5, -183.5, -184.5, -185.5, -186.5, -187.5, -188.5, -189.5, -190.5, -191.5, -192.5, -193.5, -194.5, -195.5, -196.5, -197.5, -198.5, -199.5], dtype=float32) - latitude(latitude)float32-9.996 -9.946 ... 9.946 9.996
array([-9.995825, -9.945721, -9.895616, ..., 9.895616, 9.945721, 9.995825], dtype=float32) - longitude(longitude)float32-170.0 -169.9 ... -95.05 -95.0
array([-170. , -169.94997, -169.89993, ..., -95.10007, -95.05003, -95. ], dtype=float32) - time(time)datetime64[ns]1995-12-04 ... 1995-12-04T20:00:00
- _CoordinateAxisType :
- Time
- axis :
- T
- long_name :
- Time (hours since 1950-01-01)
- standard_name :
- time
array(['1995-12-04T00:00:00.000000000', '1995-12-04T04:00:00.000000000', '1995-12-04T08:00:00.000000000', '1995-12-04T12:00:00.000000000', '1995-12-04T16:00:00.000000000', '1995-12-04T20:00:00.000000000'], dtype='datetime64[ns]')
- Jq(time, depth, latitude, longitude)float64dask.array<chunksize=(1, 100, 138, 430), meta=np.ndarray>
- long_name :
- $J_q^t$
- units :
- W/m$^2$
Array Chunk Bytes 5.76 GB 47.47 MB Shape (6, 200, 400, 1500) (1, 100, 138, 430) Count 145 Tasks 144 Chunks Type float64 numpy.ndarray - KPP_diffusivity(time, depth, latitude, longitude)float32dask.array<chunksize=(1, 100, 138, 430), meta=np.ndarray>
Array Chunk Bytes 2.88 GB 23.74 MB Shape (6, 200, 400, 1500) (1, 100, 138, 430) Count 145 Tasks 144 Chunks Type float32 numpy.ndarray - N2(time, depth, latitude, longitude)float64dask.array<chunksize=(1, 100, 138, 430), meta=np.ndarray>
- long_name :
- $N^2$
- units :
- s$^{-2}$
Array Chunk Bytes 5.76 GB 47.47 MB Shape (6, 200, 400, 1500) (1, 100, 138, 430) Count 145 Tasks 144 Chunks Type float64 numpy.ndarray - Ri(time, depth, latitude, longitude)float64dask.array<chunksize=(1, 100, 138, 430), meta=np.ndarray>
- long_name :
- Ri
- units :
Array Chunk Bytes 5.76 GB 47.47 MB Shape (6, 200, 400, 1500) (1, 100, 138, 430) Count 145 Tasks 144 Chunks Type float64 numpy.ndarray - S2(time, depth, latitude, longitude)float32dask.array<chunksize=(1, 100, 138, 430), meta=np.ndarray>
- long_name :
- $S^2$
- units :
- s$^{-2}$
Array Chunk Bytes 2.88 GB 23.74 MB Shape (6, 200, 400, 1500) (1, 100, 138, 430) Count 145 Tasks 144 Chunks Type float32 numpy.ndarray - dcl_base(time, latitude, longitude)float32dask.array<chunksize=(1, 138, 215), meta=np.ndarray>
- description :
- Deepest depth above EUC where Ri=0.54
- long_name :
- DCL Base (Ri)
- units :
- m
Array Chunk Bytes 14.40 MB 118.68 kB Shape (6, 400, 1500) (1, 138, 215) Count 127 Tasks 126 Chunks Type float32 numpy.ndarray - dens(time, depth, latitude, longitude)float64dask.array<chunksize=(1, 100, 138, 430), meta=np.ndarray>
Array Chunk Bytes 5.76 GB 47.47 MB Shape (6, 200, 400, 1500) (1, 100, 138, 430) Count 145 Tasks 144 Chunks Type float64 numpy.ndarray - mld(time, latitude, longitude)float32dask.array<chunksize=(1, 138, 430), meta=np.ndarray>
- description :
- Interpolate density to 1m grid. Search for max depth where |drho| > 0.01 and N2 > 1e-5
- long_name :
- MLD
- units :
- m
Array Chunk Bytes 14.40 MB 237.36 kB Shape (6, 400, 1500) (1, 138, 430) Count 73 Tasks 72 Chunks Type float32 numpy.ndarray - oceQnet(time, latitude, longitude)float32dask.array<chunksize=(1, 138, 1500), meta=np.ndarray>
- long_name :
- $Q_{net}$
- units :
- W/m²
Array Chunk Bytes 14.40 MB 828.00 kB Shape (6, 400, 1500) (1, 138, 1500) Count 19 Tasks 18 Chunks Type float32 numpy.ndarray - salt(time, depth, latitude, longitude)float32dask.array<chunksize=(1, 100, 138, 430), meta=np.ndarray>
Array Chunk Bytes 2.88 GB 23.74 MB Shape (6, 200, 400, 1500) (1, 100, 138, 430) Count 145 Tasks 144 Chunks Type float32 numpy.ndarray - shear(time, depth, latitude, longitude)float32dask.array<chunksize=(1, 100, 138, 430), meta=np.ndarray>
- long_name :
- |$u_z$|
- units :
- s$^{-1}$
Array Chunk Bytes 2.88 GB 23.74 MB Shape (6, 200, 400, 1500) (1, 100, 138, 430) Count 145 Tasks 144 Chunks Type float32 numpy.ndarray - shred2(time, depth, latitude, longitude)float64dask.array<chunksize=(1, 100, 138, 430), meta=np.ndarray>
- long_name :
- Reduced shear$^2$
- units :
- $s^{-2}$
Array Chunk Bytes 5.76 GB 47.47 MB Shape (6, 200, 400, 1500) (1, 100, 138, 430) Count 145 Tasks 144 Chunks Type float64 numpy.ndarray - theta(time, depth, latitude, longitude)float32dask.array<chunksize=(1, 100, 138, 430), meta=np.ndarray>
Array Chunk Bytes 2.88 GB 23.74 MB Shape (6, 200, 400, 1500) (1, 100, 138, 430) Count 145 Tasks 144 Chunks Type float32 numpy.ndarray - u(time, depth, latitude, longitude)float32dask.array<chunksize=(1, 100, 138, 430), meta=np.ndarray>
Array Chunk Bytes 2.88 GB 23.74 MB Shape (6, 200, 400, 1500) (1, 100, 138, 430) Count 145 Tasks 144 Chunks Type float32 numpy.ndarray - uz(time, depth, latitude, longitude)float32dask.array<chunksize=(1, 100, 138, 430), meta=np.ndarray>
Array Chunk Bytes 2.88 GB 23.74 MB Shape (6, 200, 400, 1500) (1, 100, 138, 430) Count 145 Tasks 144 Chunks Type float32 numpy.ndarray - v(time, depth, latitude, longitude)float32dask.array<chunksize=(1, 100, 138, 430), meta=np.ndarray>
Array Chunk Bytes 2.88 GB 23.74 MB Shape (6, 200, 400, 1500) (1, 100, 138, 430) Count 145 Tasks 144 Chunks Type float32 numpy.ndarray - vz(time, depth, latitude, longitude)float32dask.array<chunksize=(1, 100, 138, 430), meta=np.ndarray>
Array Chunk Bytes 2.88 GB 23.74 MB Shape (6, 200, 400, 1500) (1, 100, 138, 430) Count 145 Tasks 144 Chunks Type float32 numpy.ndarray - w(time, depth, latitude, longitude)float32dask.array<chunksize=(1, 100, 138, 430), meta=np.ndarray>
Array Chunk Bytes 2.88 GB 23.74 MB Shape (6, 200, 400, 1500) (1, 100, 138, 430) Count 145 Tasks 144 Chunks Type float32 numpy.ndarray - ijq(time, latitude, longitude)float64dask.array<chunksize=(1, 138, 215), meta=np.ndarray>
- long_name :
- Avg. $J_q^t$ in low Ri layer
- units :
- W/m²
Array Chunk Bytes 28.80 MB 237.36 kB Shape (6, 400, 1500) (1, 138, 215) Count 3334 Tasks 126 Chunks Type float64 numpy.ndarray - dcl(time, latitude, longitude)float32dask.array<chunksize=(1, 138, 215), meta=np.ndarray>
- description :
- Interpolate density to 1m grid. Search for max depth where |drho| > 0.01 and N2 > 1e-5
- long_name :
- Low Ri layer width
- units :
- m
Array Chunk Bytes 14.40 MB 118.68 kB Shape (6, 400, 1500) (1, 138, 215) Count 812 Tasks 126 Chunks Type float32 numpy.ndarray - sst(time, latitude, longitude)float32dask.array<chunksize=(1, 138, 430), meta=np.ndarray>
- long_name :
- SST
- units :
- °C
Array Chunk Bytes 14.40 MB 237.36 kB Shape (6, 400, 1500) (1, 138, 430) Count 217 Tasks 72 Chunks Type float32 numpy.ndarray - umean(time, latitude, longitude)float32dask.array<chunksize=(1, 138, 430), meta=np.ndarray>
- long_name :
- Mean 50-250m $u$
- units :
- m/s
Array Chunk Bytes 14.40 MB 237.36 kB Shape (6, 400, 1500) (1, 138, 430) Count 505 Tasks 72 Chunks Type float32 numpy.ndarray
- easting :
- longitude
- field_julian_date :
- 400296
- julian_day_unit :
- days since 1950-01-01 00:00:00
- northing :
- latitude
- title :
- daily snapshot from 1/20 degree Equatorial Pacific MITgcm simulation
f, axx = plt.subplots(
5, 1, constrained_layout=True, sharex=True, sharey=True, squeeze=False
)
ax = dict(zip(["sflx", "sst", "umean", "jqt", "dcl"], axx.flat))
cbar_kwargs = {"label": ""}
(-1 * extract.oceQnet).plot(
ax=ax["sflx"], robust=True, cmap=mpl.cm.RdBu_r, center=0, cbar_kwargs=cbar_kwargs
)
extract.sst.plot(
x="longitude",
robust=True,
cmap=mpl.cm.RdYlBu_r,
ax=ax["sst"],
vmax=27.5,
cbar_kwargs=cbar_kwargs,
)
extract.umean.plot(
ax=ax["umean"], robust=True, cmap=mpl.cm.PuOr_r, cbar_kwargs=cbar_kwargs
)
(extract.ijq / 50).plot(
x="longitude",
ax=ax["jqt"],
vmax=0,
robust=True,
cmap=mpl.cm.Blues_r,
cbar_kwargs=cbar_kwargs,
)
extract.dcl.plot(
x="longitude", ax=ax["dcl"], robust=True, cmap=mpl.cm.BuGn, cbar_kwargs=cbar_kwargs
)
axx[0, 0].set_yticks([-10, -5, 0, 5, 10])
axx[0, 0].set_xticks([-95, -110, -125, -140, -155, -170])
ax["jqt"].plot([-114, -105, -105, -114, -114], [-2, -2, 5, 5, -2], color="k", lw=1)
[dcpy.plots.lat_lon_ticks(aa) for aa in axx.flat]
axx[0, 0].set_ylim([-8, 8])
dcpy.plots.clean_axes(axx)
dcpy.plots.label_subplots(
axx.squeeze(),
labels=[
"Net surface heat flux $Q_{net}$ [W/m²]",
"SST [°C]",
"Mean 50-250m $u$ [m/s]",
"Avg $J_q^t$ in low Ri layer [W/m²]",
"Low Ri layer thickness [m]",
],
y=0.05,
)
f.set_size_inches((8, 8))
f.savefig("images/snapshot-sflx-sst-jq-dcl.png")
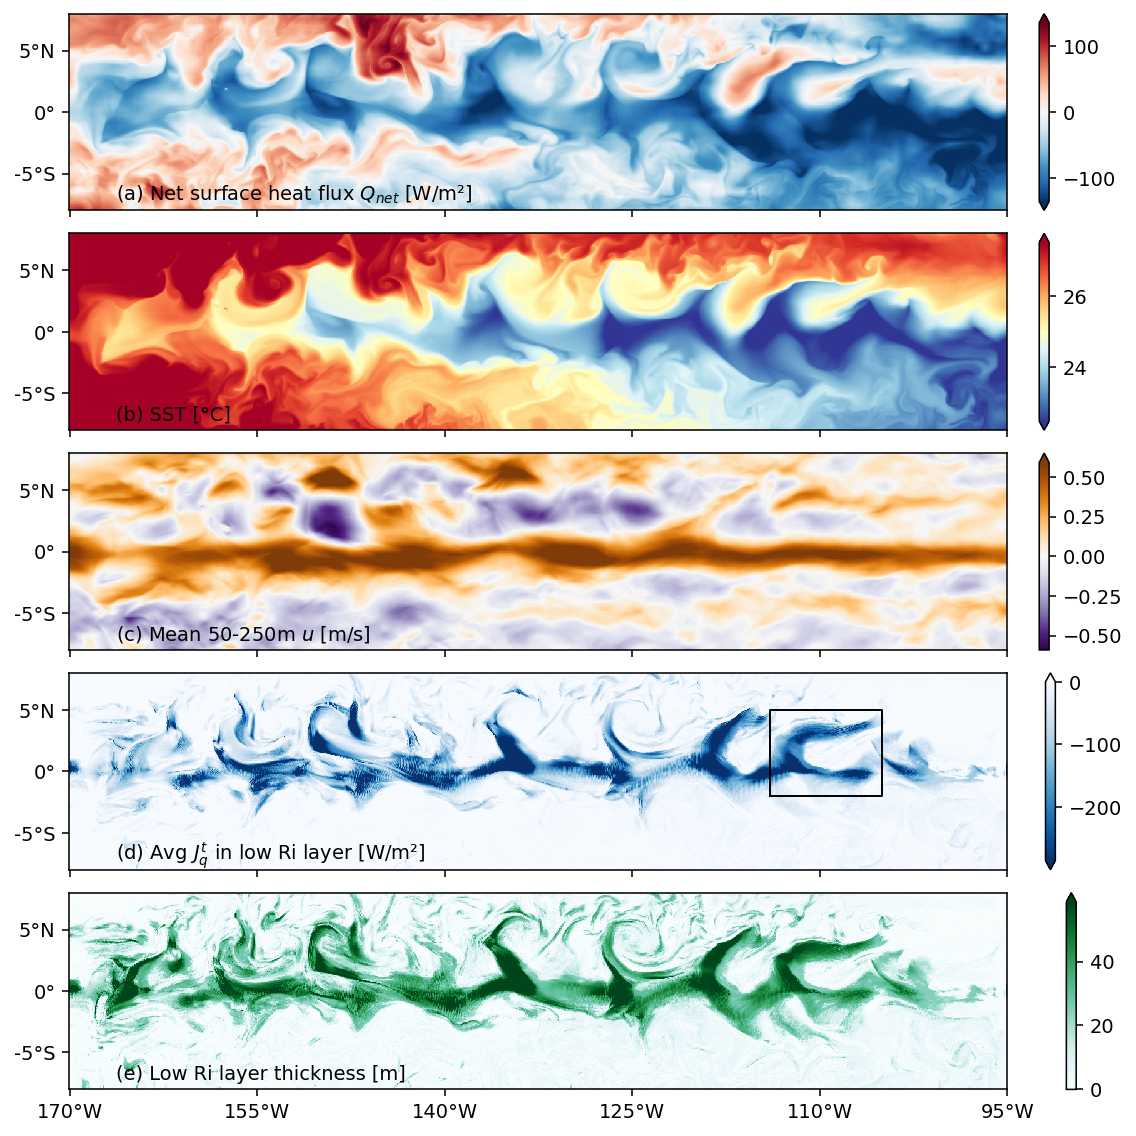
Figure 2: validation#
Shows that TIWs and mean state are reasonable
johnson = pump.obs.read_johnson()
tao = pump.obs.read_tao_zarr()
sections = xr.open_zarr("/glade/work/dcherian/pump/zarrs/gcm1-sections-rechunked.zarr")
lon = -110
taosub = (
tao.sel(longitude=lon, time=slice("1990", "2000"))
.groupby("time.dayofyear")
.mean()
.rename({"dayofyear": "time"})
)
modelsub = (
sections.sel(longitude=lon, latitude=0, method="nearest").sel(time="1996")
# .pipe(slice_like, taosub.time)
)
def plot(data, ax=None, **kwargs):
if ax is None:
ax = plt.gca()
mean, std = dask.compute(data.mean("time"), data.std("time"))
if "depth" in data.dims:
kwargs.update(dict(y="depth"))
plotfunc = "fill_betweenx"
coord = data.depth
elif "latitude" in data.dims:
kwargs.update(dict(x="latitude"))
plotfunc = "fill_between"
coord = data.latitude
else:
raise ValueError(f"Don't know how to handle data with dims: {data.dims}")
hdl = mean.plot(**kwargs, ax=ax)
getattr(ax, plotfunc)(
coord,
(mean - std).values,
(mean + std).values,
color=hdl[0].get_color(),
alpha=0.3,
)
return hdl[0]
f = plt.figure(constrained_layout=True)
gs = f.add_gridspec(4, 2, height_ratios=[1.5, 1, 1, 1])
ax = [0, 1, 2, 3, 4]
ax[0] = f.add_subplot(gs[0, 0])
ax[1] = f.add_subplot(gs[0, 1], sharey=ax[0])
ax[2] = f.add_subplot(gs[1, :])
ax[3] = f.add_subplot(gs[2, :], sharex=ax[2])
ax[4] = f.add_subplot(gs[3, :], sharex=ax[3])
# f, ax = plt.subplots(1, 2, sharey=True, constrained_layout=True)
htao = plot(taosub.T, ax=ax[0])
hmod = plot(modelsub.theta, ax=ax[0])
hjohn = johnson.temp.sel(longitude=lon, latitude=0).plot(y="depth", ax=ax[0])
plot(taosub.u, ax=ax[1])
plot(modelsub.u, ax=ax[1])
johnson.u.sel(longitude=lon, latitude=0).plot(y="depth", ax=ax[1])
plot(sections.sel(longitude=lon, depth=0, method="nearest").theta, ax=ax[3], color="C1")
johnson.temp.sel(longitude=lon, depth=0, method="nearest").plot(
x="latitude", ax=ax[3], color="C2"
)
# plot(sections.sel(longitude=lon, depth=0, method="nearest").theta, ax=ax[3])
plot(
sections.sel(longitude=lon, depth=-75, method="nearest").theta, ax=ax[4], color="C1"
)
johnson.temp.sel(longitude=lon, depth=-75, method="nearest").plot(
x="latitude", ax=ax[4], color="C2"
)
ax[0].legend(
handles=(htao, hmod, hjohn[0]),
labels=["TAO", "Model", "Johnson"],
loc="lower right",
)
(
-1
* sections.sel(longitude=lon, time="1996")
.mean("time")
.sel(depth=slice(-250))
.u.integrate("depth")
).plot(ax=ax[2], color="C1")
(
(-1 * johnson.sel(longitude=lon).sel(depth=slice(-250)).u.integrate("depth")).plot(
xlim=(-7.5, 7.5), ax=ax[2], color="C2"
)
)
ax[0].set_xlim((12, None))
ax[0].set_ylim(-250, 0)
dcpy.plots.liney(0, ax=ax[2])
dcpy.plots.clean_axes(ax[:2])
ax[0].set_xlabel("$T$ [°C]")
ax[1].set_xlabel("$u$ [m/s]")
ax[2].set_ylabel("$\int u dz$ [m²/s]")
ax[3].set_ylabel("$T$ [°C]")
ax[4].set_ylabel("$T$ [°C]")
ax[3].set_xlabel("")
ax[2].set_xlabel("")
ax[4].set_xlabel("Latitude [°N]")
ax[4].set_xlim((-7.5, 7.5))
dcpy.plots.clean_axes([[aa] for aa in ax[2:]])
[aa.set_title("") for aa in ax]
dcpy.plots.label_subplots(ax, labels=["", "", "Top 250m", "Surface", "75m"])
f.set_size_inches((dcpy.plots.pub_fig_width("jpo", "two column"), 8))
f.suptitle("(0°N, 110°W)")
f.savefig("images/gcm-20-validation.png")
Task exception was never retrieved
future: <Task finished name='Task-186048' coro=<WebSocketProtocol13.write_message.<locals>.wrapper() done, defined at /glade/u/home/dcherian/miniconda3/envs/dcpy/lib/python3.8/site-packages/tornado/websocket.py:1102> exception=WebSocketClosedError()>
Traceback (most recent call last):
File "/glade/u/home/dcherian/miniconda3/envs/dcpy/lib/python3.8/site-packages/tornado/websocket.py", line 1104, in wrapper
await fut
tornado.iostream.StreamClosedError: Stream is closed
During handling of the above exception, another exception occurred:
Traceback (most recent call last):
File "/glade/u/home/dcherian/miniconda3/envs/dcpy/lib/python3.8/site-packages/tornado/websocket.py", line 1106, in wrapper
raise WebSocketClosedError()
tornado.websocket.WebSocketClosedError
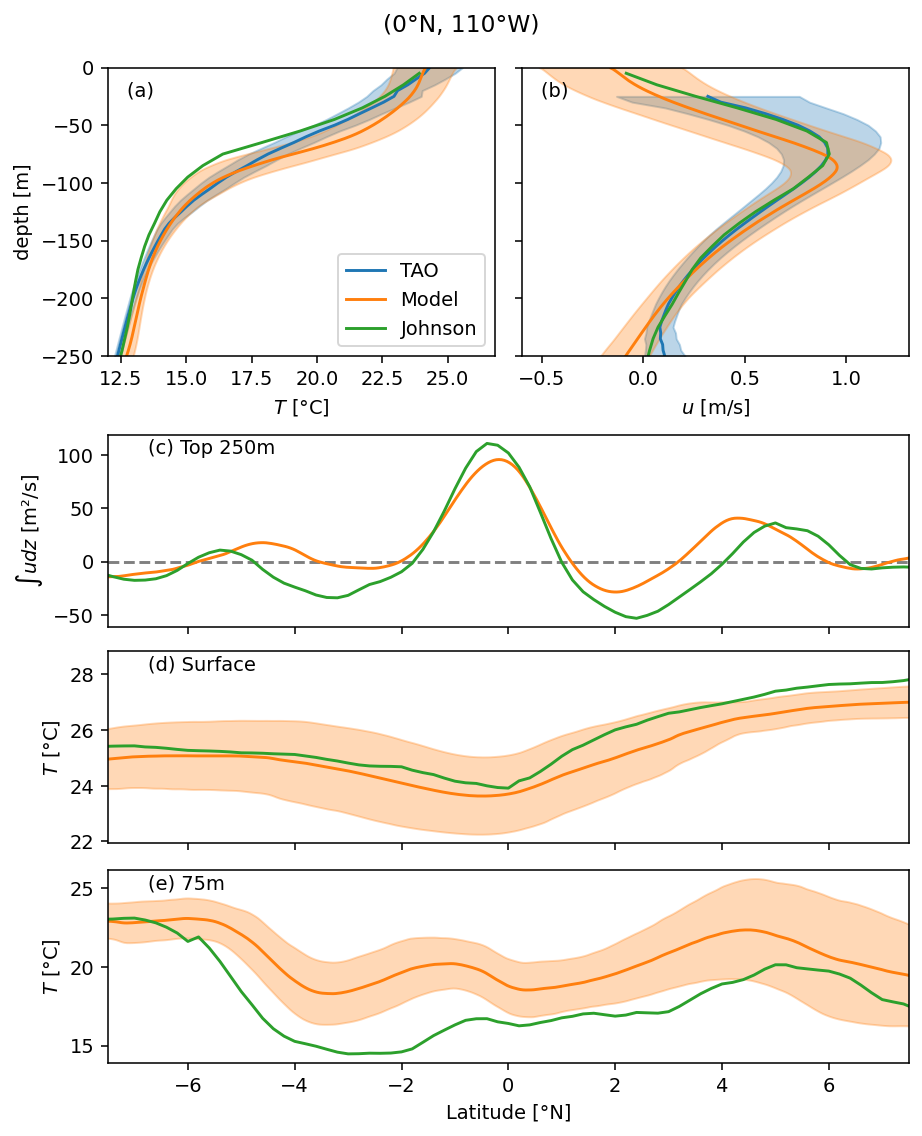
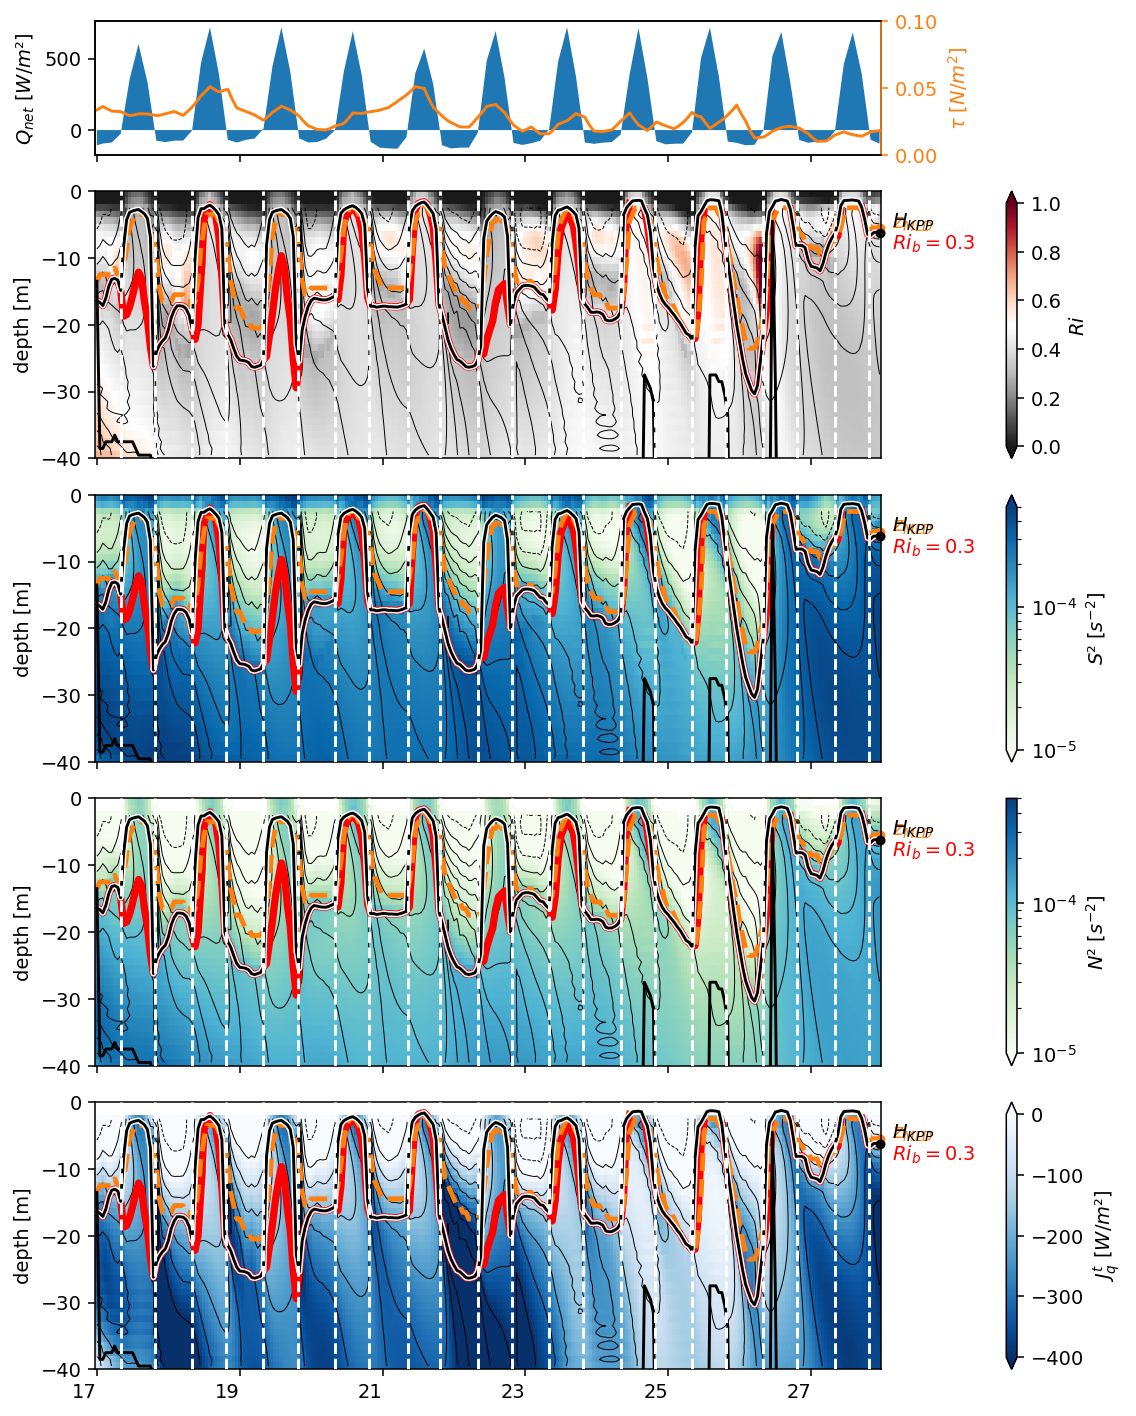
Figure 3: 0, 3.5N deep cycle heat flux + Ri profile#
f, ax = pump.plot.plot_jq_sst(
period4.isel(longitude=1),
lon=-110,
periods=slice("1995-11-15", "1995-12-15"),
lat=[0, 3.5],
time_Ri={
0: slice("1995-11-17", "1995-11-29"),
3.5: slice("1995-11-28", "1995-12-09"),
},
)
axes = list(ax.flat)
del axes[1]
del axes[2]
[aa.set_title("") for aa in ax[:, 0]]
axes[-2].set_xlabel("time")
dcpy.plots.label_subplots(
axes,
x=0.01,
y=0.05,
labels=[
"SST [°C]",
"Avg $J_q^t$ in low Ri layer [W/m²]",
"$J_q^t$ [W/m²] at 3.5°N",
"$Ri$",
"$J_q^t$ [W/m²] at 0°",
"$Ri$",
],
)
f.text(0.7, 0.53, "$J_q^t$ [W/m²]")
f.savefig("../images/sst-deep-cycle-3N.png")
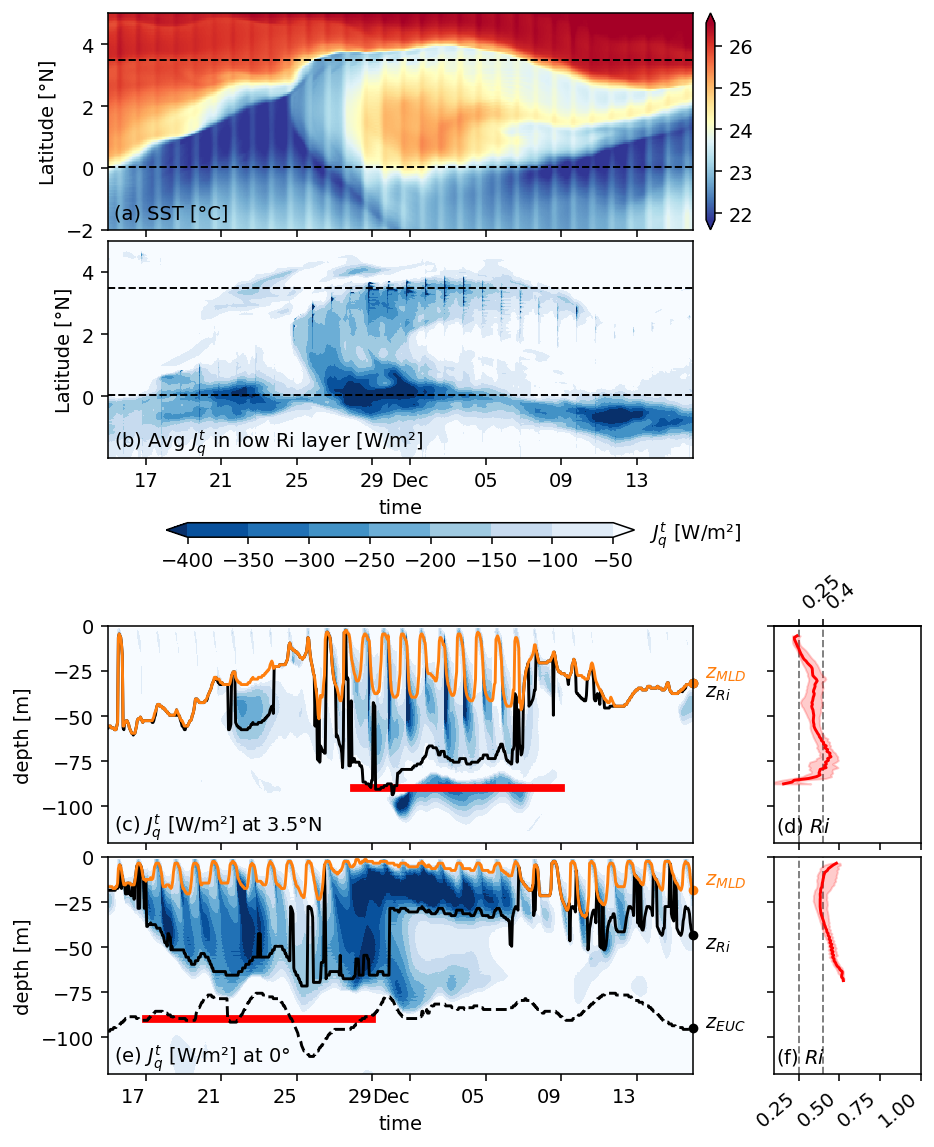
Figure 4: daily cycles at 3.5N#
jrafull = pump.obs.read_jra()
station = (
period4.isel(longitude=1)
.sel(latitude=3.5, method="nearest")
.chunk({"depth": -1, "time": 10})
)
forcing = pump.obs.interp_jra_to_station(jrafull, station)
fluxes, coare = pump.calc.coare_fluxes_jra(station, forcing)
/glade/u/home/dcherian/python/xcoare/xcoare/coare35vn.py:466: RuntimeWarning: invalid value encountered in greater
k = u10 > umax
/glade/u/home/dcherian/python/xcoare/xcoare/coare35vn.py:480: RuntimeWarning: invalid value encountered in greater
charn = np.where(ut > 0, 0.011 + (ut - 10) / (18 - 10) * (0.018 - 0.011), 0.011)
/glade/u/home/dcherian/python/xcoare/xcoare/coare35vn.py:481: RuntimeWarning: invalid value encountered in greater
charn[ut > 18] = 0.018
station = station.merge(fluxes, compat="override")
station = station.merge(coare, compat="override")
station = station.merge(forcing, compat="override")
station = station.isel(time=slice(1, -1))
kpp = pump.calc.calc_kpp_terms(station)
kpp.hbl.plot()
kpp.hunlimit.plot()
%matplotlib ipympl
(
period4.KPP_diffusivity.rolling(depth=2)
.mean()
.isel(longitude=1)
.sel(latitude=3.5, method="nearest")
.sel(depth=slice(0, -120))
.plot(x="time", norm=mpl.colors.LogNorm(1e-5, 1e-2))
)
(-1 * kpp.hunlimit).plot()
(-1 * kpp.hbl).plot()
Warning: Cannot change to a different GUI toolkit: ipympl. Using qt instead.
[<matplotlib.lines.Line2D at 0x2b1a5003e490>]
/glade/u/home/dcherian/miniconda3/envs/dcpy2/lib/python3.7/site-packages/matplotlib/colors.py:1171: RuntimeWarning: invalid value encountered in less_equal
mask |= resdat <= 0
ds = (
period4.isel(longitude=1)
.sel(time=slice("1995-11-25", "1995-12-07"), depth=slice(-100))
# .sel(time=slice("1995-11-05", "1995-12-15"), depth=slice(-130))
.sel(latitude=3.5, method="nearest")
.assign(latitude=3.5)
).compute()
ds["Jq"] = ds.Jq.rolling(depth=2).mean()
ds["Jq"].attrs = period4.Jq.attrs
with plt.rc_context({"font.size": 8}):
f, _ = pump.plot.plot_daily_cycles(ds)
f.savefig("images/110-deep-cycle-35.png")
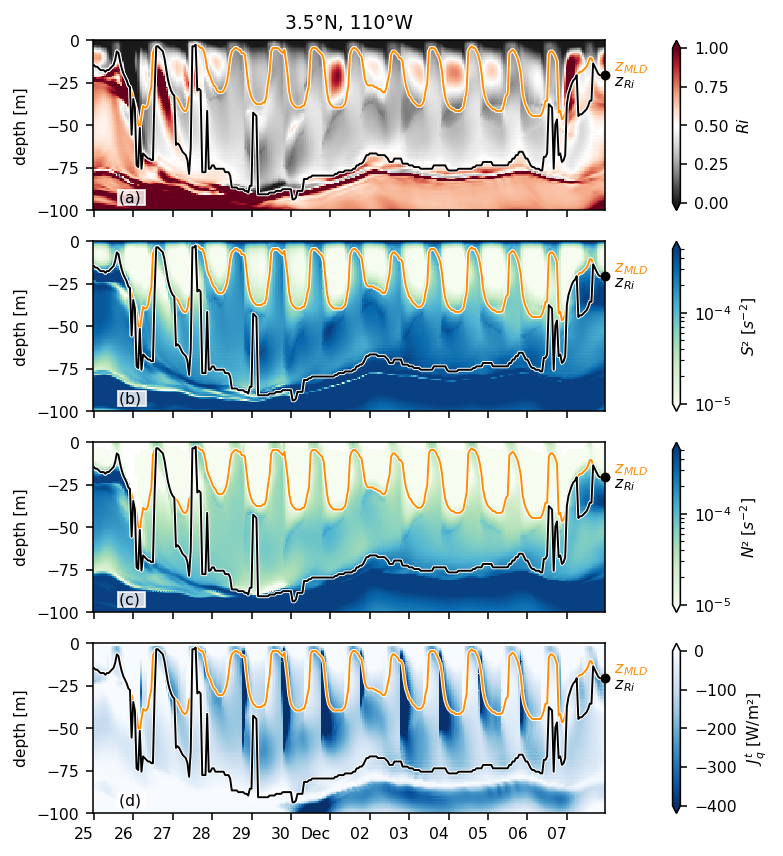
Figure 5: DCL everywhere#
sections = pump.utils.read_gcm1_zarr_subset(gcm1).chunk({"time": 300, "depth": 100})
sections.to_zarr(
"/glade/work/dcherian/pump/gcm1-sections-rechunked.zarr",
consolidated=True,
encoding={k: {} for k in sections.data_vars},
mode="w",
)
xarray.Dataset
- depth: 345
- latitude: 480
- longitude: 4
- time: 2947
- depth(depth)float32-0.5 -1.5 ... -5665.922 -5765.922
array([-5.000000e-01, -1.500000e+00, -2.500000e+00, ..., -5.565922e+03, -5.665922e+03, -5.765922e+03], dtype=float32) - latitude(latitude)float32-12.0 -11.949896 ... 11.949896 12.0
array([-12. , -11.949896, -11.899791, ..., 11.899791, 11.949896, 12. ], dtype=float32) - longitude(longitude)int64-110 -125 -140 -155
array([-110, -125, -140, -155])
- time(time)datetime64[ns]1995-09-01 ... 1997-01-04T12:00:00
- _CoordinateAxisType :
- Time
- axis :
- T
- long_name :
- Time (hours since 1950-01-01)
- standard_name :
- time
array(['1995-09-01T00:00:00.000000000', '1995-09-01T04:00:00.000000000', '1995-09-01T08:00:00.000000000', ..., '1997-01-03T20:00:00.000000000', '1997-01-04T00:00:00.000000000', '1997-01-04T12:00:00.000000000'], dtype='datetime64[ns]')
- Jq(time, depth, latitude, longitude)float64dask.array<chunksize=(300, 100, 240, 1), meta=np.ndarray>
- long_name :
- $J_q^t$
- units :
- W/m$^2$
Array Chunk Bytes 15.62 GB 57.60 MB Shape (2947, 345, 480, 4) (300, 100, 240, 1) Count 141777 Tasks 320 Chunks Type float64 numpy.ndarray - KPP_diffusivity(time, depth, latitude, longitude)float32dask.array<chunksize=(300, 100, 138, 1), meta=np.ndarray>
Array Chunk Bytes 7.81 GB 16.56 MB Shape (2947, 345, 480, 4) (300, 100, 138, 1) Count 236401 Tasks 640 Chunks Type float32 numpy.ndarray - dens(time, depth, latitude, longitude)float32dask.array<chunksize=(300, 100, 138, 1), meta=np.ndarray>
Array Chunk Bytes 7.81 GB 16.56 MB Shape (2947, 345, 480, 4) (300, 100, 138, 1) Count 236401 Tasks 640 Chunks Type float32 numpy.ndarray - salt(time, depth, latitude, longitude)float32dask.array<chunksize=(300, 100, 138, 1), meta=np.ndarray>
Array Chunk Bytes 7.81 GB 16.56 MB Shape (2947, 345, 480, 4) (300, 100, 138, 1) Count 236401 Tasks 640 Chunks Type float32 numpy.ndarray - theta(time, depth, latitude, longitude)float32dask.array<chunksize=(300, 100, 138, 1), meta=np.ndarray>
Array Chunk Bytes 7.81 GB 16.56 MB Shape (2947, 345, 480, 4) (300, 100, 138, 1) Count 236401 Tasks 640 Chunks Type float32 numpy.ndarray - u(time, depth, latitude, longitude)float32dask.array<chunksize=(300, 100, 138, 1), meta=np.ndarray>
Array Chunk Bytes 7.81 GB 16.56 MB Shape (2947, 345, 480, 4) (300, 100, 138, 1) Count 236401 Tasks 640 Chunks Type float32 numpy.ndarray - v(time, depth, latitude, longitude)float32dask.array<chunksize=(300, 100, 138, 1), meta=np.ndarray>
Array Chunk Bytes 7.81 GB 16.56 MB Shape (2947, 345, 480, 4) (300, 100, 138, 1) Count 236401 Tasks 640 Chunks Type float32 numpy.ndarray - w(time, depth, latitude, longitude)float32dask.array<chunksize=(300, 100, 138, 1), meta=np.ndarray>
Array Chunk Bytes 7.81 GB 16.56 MB Shape (2947, 345, 480, 4) (300, 100, 138, 1) Count 236401 Tasks 640 Chunks Type float32 numpy.ndarray
- easting :
- longitude
- field_julian_date :
- 400296
- julian_day_unit :
- days since 1950-01-01 00:00:00
- northing :
- latitude
- title :
- daily snapshot from 1/20 degree Equatorial Pacific MITgcm simulation
sections = xr.open_zarr(
"/glade/work/dcherian/pump/gcm1-sections-rechunked.zarr", consolidated=True
)
sections["dens"] = pump.mdjwf.dens(sections.salt, sections.theta, np.array([0.0]))
sections = pump.calc.calc_reduced_shear(sections)
sections["mld"] = pump.calc.get_mld(sections.dens)
sections
medianRi = (
sections.Ri.where(
(sections.depth < sections.mld) & (sections.depth > sections.mld - 40)
)
.resample(time="D")
.median(["time", "depth"])
.compute()
)
medianRi = medianRi.assign_coords(longitude=np.round(medianRi.longitude))
medianRi.attrs["long_name"] = "Median $Ri$ within 40m of the mixed layer base"
sst = sections.theta.isel(depth=0).rolling(time=6).mean().persist()
u = (
sections.u.sel(depth=slice(-250))
.rolling(time=4 * 6, min_periods=1)
.mean()
.persist()
)
eucmax = pump.calc.get_euc_bounds(u).compute()
(
sections.u.sel(depth=slice(-150), time=slice("1996-04-01", "1996-07-01"))
.sel(
longitude=-125,
latitude=2,
method="nearest",
)
.hvplot.quadmesh(y="depth")
)
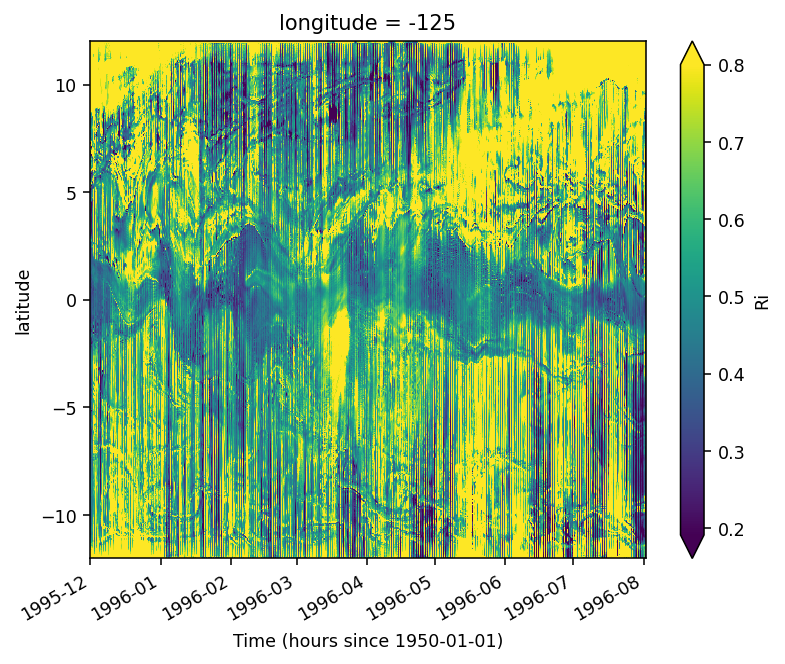
(
sections.Ri.sel(depth=slice(-50, 90))
.median("depth")
.sel(longitude=-125, method="nearest")
.sel(time=slice("1995-Dec", "1996-Aug-01"))
.plot(x="time", robust=True, vmax=0.8)
)
<matplotlib.collections.QuadMesh at 0x2ade290ed210>
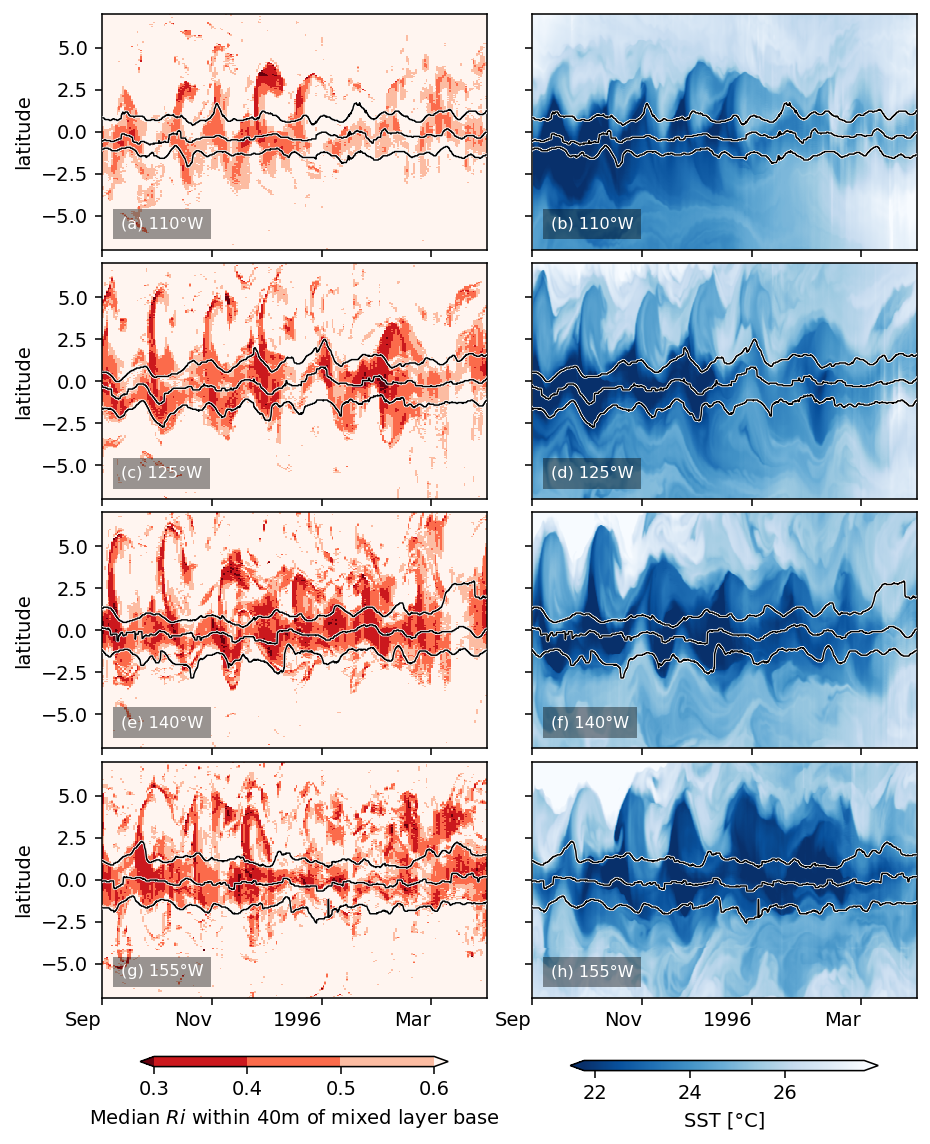
import itertools
import facetgrid
labels = [lon + "°W" for lon in str(np.abs(medianRi.longitude.values))[1:-1].split(" ")]
cbkwargs = {"orientation": "horizontal", "shrink": 0.8, "aspect": 30}
def plot_euc(ax, loc):
kwargs = dict(ax=ax, _labels=False, add_legend=False, hue="variable", zorder=10)
eucmax.sel(**loc).to_array().plot.line(color="w", lw=1.5, **kwargs)
eucmax.sel(**loc).to_array().plot.line(color="k", lw=0.75, **kwargs)
ax.set_title("")
with plt.rc_context({"font.size": 10}):
fg = facetgrid.facetgrid(row=medianRi.longitude, col=["Ri", "SST"])
fg.map_col(
"Ri",
medianRi.sel(latitude=slice(-7, 7)),
xr.plot.pcolormesh,
x="time",
levels=np.arange(0.3, 0.61, 0.1),
cmap=mpl.cm.Reds_r,
)
fg.map_col(
"SST",
sst.sel(latitude=slice(-7, 7)),
xr.plot.pcolormesh,
robust=True,
cmap=mpl.cm.Blues_r,
)
fg.set_ylabels("latitude")
# fg.set_row_labels(labels)
fg.fig.set_size_inches(dcpy.plots.pub_fig_width("jpo", "two column"), 8)
fg.fig.colorbar(
fg.handles["Ri"][0],
ax=fg.axes[:, 0],
**cbkwargs,
label="Median $Ri$ within 40m of mixed layer base",
)
fg.fig.colorbar(
fg.handles["SST"][0],
ax=fg.axes[:, 1],
**cbkwargs,
label="SST [°C]",
extend="both",
)
dcpy.plots.label_subplots(
fg.axes.flat,
y=0.09,
labels=list(itertools.chain(*[(v, v) for v in labels])),
color="w",
bbox=dict(alpha=0.4, color="black", linewidth=0),
# fontweight="bold",
fontsize="small",
)
for loc, ax in zip(fg.row_locs, fg.axes):
[plot_euc(aa, {"longitude": loc}) for aa in ax]
[dcpy.plots.concise_date_formatter(ax, show_offset=False) for ax in fg.axes[-1, :]]
fg.axes[0, 0].set_xlim((None, "1996-Apr-01"))
fg.fig.savefig("images/Ri-lat-time.png", dpi=300)
/glade/u/home/dcherian/miniconda3/envs/dcpy/lib/python3.8/site-packages/xarray/plot/plot.py:970: MatplotlibDeprecationWarning: Passing parameters norm and vmin/vmax simultaneously is deprecated since 3.3 and will become an error two minor releases later. Please pass vmin/vmax directly to the norm when creating it.
primitive = ax.pcolormesh(x, y, z, **kwargs)
labels = [lon + "°W" for lon in str(np.abs(medianRi.longitude.values))[1:-1].split(" ")]
with plt.rc_context({"font.size": 10}):
f, ax = plt.subplots(4, 2, sharex=True, sharey=True)
fg = medianRi.sel(latitude=slice(-7, 7)).plot.contourf(
aspect=3,
x="time",
levels=np.arange(0.3, 0.81, 0.1),
cmap=mpl.cm.Spectral,
row="longitude",
add_colorbar=False,
)
levels = [24.6, 24.95, 25, 26.25]
kwargs = dict(_labels=False, add_legend=False, hue="variable", zorder=10)
for loc, ax, level in zip(fg.name_dicts.flat, fg.axes.flat, levels):
# hc = sst.sel(**loc, method="nearest").plot.contour(
# ax=ax, x="time", levels=[level], colors="k", add_labels=False, linewidths=1,
# )
kwargs.update(ax=ax)
eucmax.sel(**loc).to_array().plot.line(color="w", lw=1.5, **kwargs)
eucmax.sel(**loc).to_array().plot.line(color="k", lw=0.75, **kwargs)
ax.set_title("")
fg.set_xlabels("")
dcpy.plots.label_subplots(
fg.axes.flat, y=0.1, labels=labels, fontsize="small", color="w"
)
fg.fig.set_size_inches(dcpy.plots.pub_fig_width("jpo", "medium 2"), 8)
plt.tight_layout(pad=0.7)
fg.add_colorbar(**{"orientation": "horizontal", "shrink": 0.8, "aspect": 40})
# fg.fig.savefig("images/Ri-lat-time.png", dpi=300)
Figure 6: TIW lat-depth slices#
subset = (
period4.set_coords(["mld", "dcl_base"])
.sel(latitude=slice(-3, 6))
.isel(longitude=1)[["sst", "uz", "vz", "mld", "dcl_base", "dcl_mask", "S2", "N2"]]
).compute()
pump.plot.plot_tiw_lat_lon_summary(subset, times=snapshot_times)
plt.gcf().savefig("images/surface-summary.png", dpi=150)
<Figure size 906.6x700 with 0 Axes>
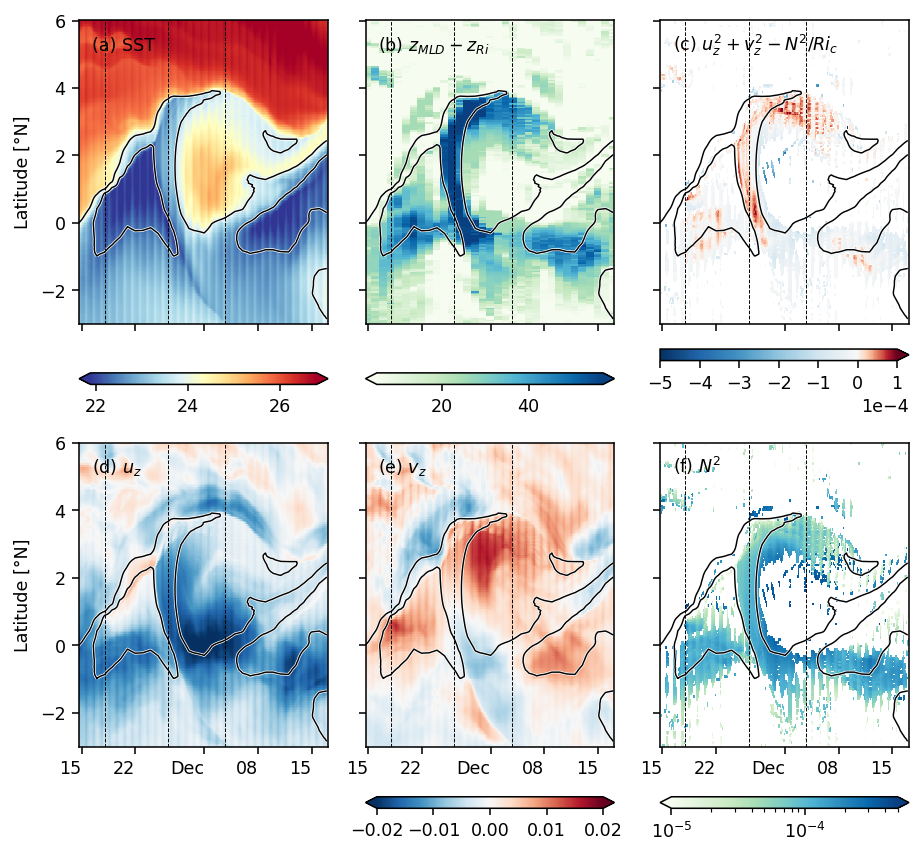
Figure 7: Shred2 depth-lat snapshots#
pump.plot.plot_tiw_period_snapshots(
period4.set_coords(["mld", "dcl_base"]).sel(latitude=slice(-5, 5)),
lon=-110,
period=None,
times=snapshot_times,
)
plt.gcf().savefig("images/dcl-shred2.png", dpi=150)
/glade/u/home/dcherian/miniconda3/envs/dcpy/lib/python3.8/site-packages/xarray/plot/plot.py:970: MatplotlibDeprecationWarning: Passing parameters norm and vmin/vmax simultaneously is deprecated since 3.3 and will become an error two minor releases later. Please pass vmin/vmax directly to the norm when creating it.
primitive = ax.pcolormesh(x, y, z, **kwargs)
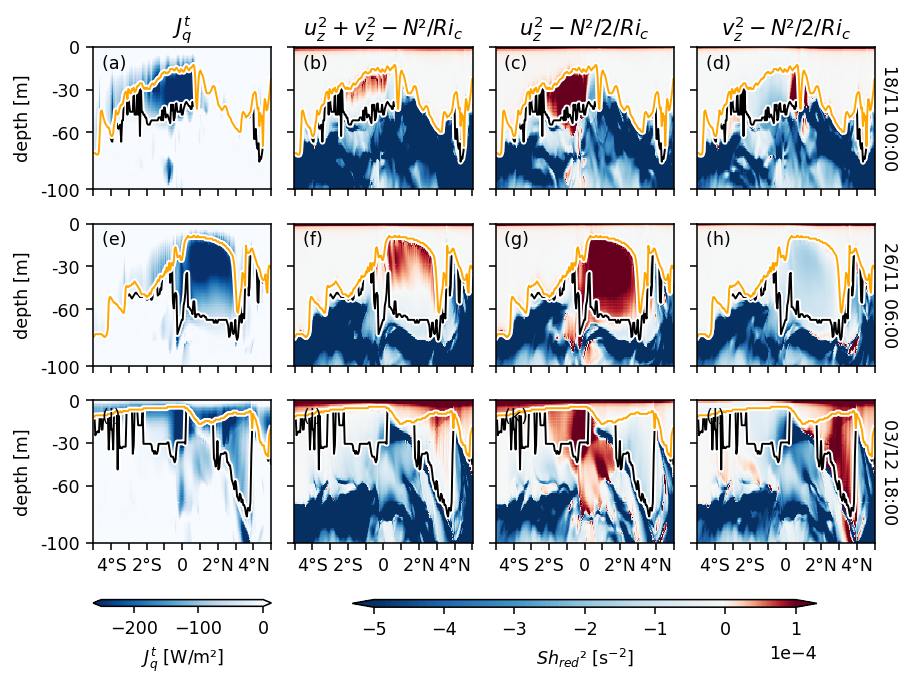
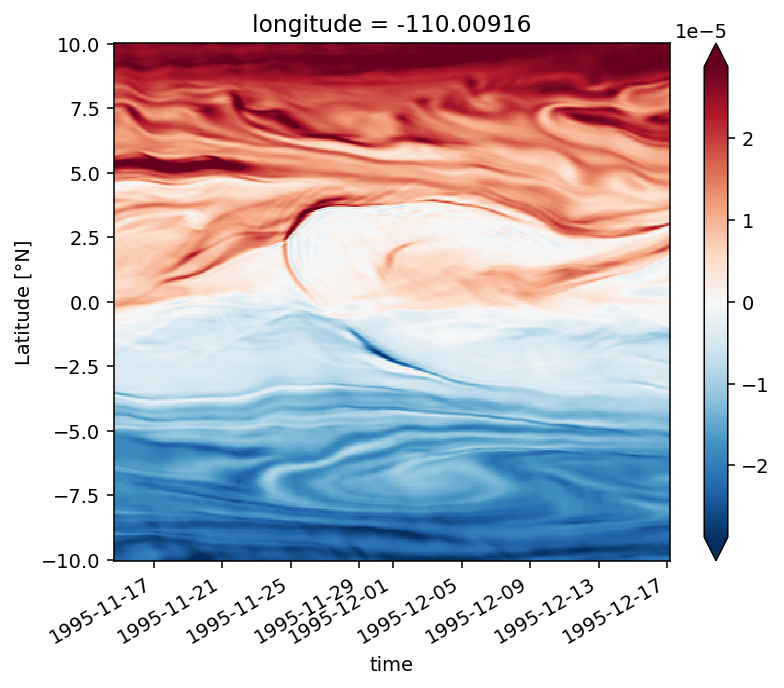
Figure 7: horizontal vorticity vector#
dirname = "/glade/campaign/cgd/oce/people/dcherian/TPOS_MITgcm_1_hb/HOLD"
tiw_all = xr.open_mfdataset(f"{dirname}/File*.nc", parallel=True)
tiw = tiw_all.sel(time="1995-Dec-01 00:00", longitude=slice(-115, -106))
tiw_vort = pump.calc.vorticity(tiw)
tiw_vort
<xarray.Dataset>
Dimensions: (depth: 280, latitude: 400, longitude: 180)
Coordinates:
* latitude (latitude) float32 -10.0 -9.95 -9.9 -9.85 ... 9.85 9.9 9.95 10.0
* longitude (longitude) float32 -115.0 -114.9 -114.9 ... -106.1 -106.1 -106.0
* depth (depth) float32 -0.5 -1.5 -2.5 -3.5 ... -378.4 -391.7 -406.3
time datetime64[ns] 1995-12-01
Data variables:
x (depth, latitude, longitude) float32 dask.array<chunksize=(280, 400, 180), meta=np.ndarray>
y (depth, latitude, longitude) float32 dask.array<chunksize=(280, 400, 180), meta=np.ndarray>
z (depth, latitude, longitude) float32 dask.array<chunksize=(280, 400, 180), meta=np.ndarray>
vx (depth, latitude, longitude) float32 dask.array<chunksize=(280, 400, 180), meta=np.ndarray>
uy (depth, latitude, longitude) float32 dask.array<chunksize=(280, 400, 180), meta=np.ndarray>
f (latitude) float32 -2.526e-05 -2.513e-05 ... 2.513e-05 2.526e-05xarray.Dataset
- depth: 280
- latitude: 400
- longitude: 180
- latitude(latitude)float32-10.0 -9.95 -9.9 ... 9.9 9.95 10.0
array([-10. , -9.949875, -9.89975 , ..., 9.89975 , 9.949875, 10. ], dtype=float32) - longitude(longitude)float32-115.0 -114.9 ... -106.1 -106.0
array([-114.96265 , -114.91261 , -114.86258 , -114.812546, -114.76251 , -114.71247 , -114.66244 , -114.612404, -114.56237 , -114.51233 , -114.462296, -114.41226 , -114.36223 , -114.312195, -114.26215 , -114.21212 , -114.16209 , -114.11205 , -114.06201 , -114.01198 , -113.961945, -113.91191 , -113.86188 , -113.81184 , -113.7618 , -113.71177 , -113.661736, -113.6117 , -113.56166 , -113.51163 , -113.46159 , -113.41156 , -113.36152 , -113.311485, -113.26145 , -113.21142 , -113.161385, -113.11134 , -113.06131 , -113.01128 , -112.96124 , -112.9112 , -112.86117 , -112.811134, -112.7611 , -112.71107 , -112.661026, -112.61099 , -112.56096 , -112.510925, -112.46089 , -112.41085 , -112.36082 , -112.31078 , -112.26075 , -112.21071 , -112.160675, -112.11064 , -112.06061 , -112.010574, -111.96053 , -111.9105 , -111.860466, -111.81043 , -111.76039 , -111.71036 , -111.660324, -111.61029 , -111.56026 , -111.510216, -111.46018 , -111.41015 , -111.360115, -111.310074, -111.26004 , -111.21001 , -111.15997 , -111.10994 , -111.0599 , -111.009865, -110.95983 , -110.9098 , -110.859764, -110.80972 , -110.75969 , -110.709656, -110.65962 , -110.60958 , -110.55955 , -110.509514, -110.45948 , -110.40945 , -110.359406, -110.30937 , -110.25934 , -110.209305, -110.15926 , -110.10923 , -110.0592 , -110.00916 , -109.95913 , -109.90909 , -109.859055, -109.80902 , -109.75899 , -109.70895 , -109.65891 , -109.60888 , -109.558846, -109.50881 , -109.45877 , -109.40874 , -109.3587 , -109.30867 , -109.25864 , -109.208595, -109.15856 , -109.10853 , -109.058495, -109.00845 , -108.95842 , -108.90839 , -108.85835 , -108.80832 , -108.75828 , -108.708244, -108.65821 , -108.60818 , -108.558136, -108.5081 , -108.45807 , -108.408035, -108.358 , -108.30796 , -108.25793 , -108.20789 , -108.15786 , -108.10782 , -108.057785, -108.00775 , -107.95772 , -107.907684, -107.85764 , -107.80761 , -107.757576, -107.70754 , -107.65751 , -107.60747 , -107.557434, -107.5074 , -107.45737 , -107.407326, -107.35729 , -107.30726 , -107.257225, -107.20719 , -107.15715 , -107.10712 , -107.05708 , -107.00705 , -106.95701 , -106.906975, -106.85694 , -106.80691 , -106.756874, -106.70683 , -106.6568 , -106.606766, -106.55673 , -106.5067 , -106.45666 , -106.406624, -106.35659 , -106.30656 , -106.256516, -106.20648 , -106.15645 , -106.106415, -106.05638 , -106.00634 ], dtype=float32) - depth(depth)float32-0.5 -1.5 -2.5 ... -391.7 -406.3
array([ -0.5 , -1.5 , -2.5 , ..., -378.44086, -391.7377 , -406.29776], dtype=float32) - time()datetime64[ns]1995-12-01
- long_name :
- Time (hours since 1950-01-01)
- standard_name :
- time
- axis :
- T
- _CoordinateAxisType :
- Time
array('1995-12-01T00:00:00.000000000', dtype='datetime64[ns]')
- x(depth, latitude, longitude)float32dask.array<chunksize=(280, 400, 180), meta=np.ndarray>
Array Chunk Bytes 80.64 MB 80.64 MB Shape (280, 400, 180) (280, 400, 180) Count 4690 Tasks 1 Chunks Type float32 numpy.ndarray - y(depth, latitude, longitude)float32dask.array<chunksize=(280, 400, 180), meta=np.ndarray>
Array Chunk Bytes 80.64 MB 80.64 MB Shape (280, 400, 180) (280, 400, 180) Count 4690 Tasks 1 Chunks Type float32 numpy.ndarray - z(depth, latitude, longitude)float32dask.array<chunksize=(280, 400, 180), meta=np.ndarray>
Array Chunk Bytes 80.64 MB 80.64 MB Shape (280, 400, 180) (280, 400, 180) Count 4691 Tasks 1 Chunks Type float32 numpy.ndarray - vx(depth, latitude, longitude)float32dask.array<chunksize=(280, 400, 180), meta=np.ndarray>
Array Chunk Bytes 80.64 MB 80.64 MB Shape (280, 400, 180) (280, 400, 180) Count 2345 Tasks 1 Chunks Type float32 numpy.ndarray - uy(depth, latitude, longitude)float32dask.array<chunksize=(280, 400, 180), meta=np.ndarray>
Array Chunk Bytes 80.64 MB 80.64 MB Shape (280, 400, 180) (280, 400, 180) Count 2345 Tasks 1 Chunks Type float32 numpy.ndarray - f(latitude)float32-2.526e-05 -2.513e-05 ... 2.526e-05
array([-2.52561058e-05, -2.51307883e-05, -2.50054509e-05, -2.48800898e-05, -2.47547141e-05, -2.46293203e-05, -2.45039064e-05, -2.43784743e-05, -2.42530223e-05, -2.41275538e-05, -2.40020654e-05, -2.38765588e-05, -2.37510321e-05, -2.36254891e-05, -2.34999279e-05, -2.33743503e-05, -2.32487528e-05, -2.31231388e-05, -2.29975049e-05, -2.28718527e-05, -2.27461878e-05, -2.26205029e-05, -2.24947999e-05, -2.23690804e-05, -2.22433446e-05, -2.21175906e-05, -2.19918202e-05, -2.18660334e-05, -2.17402285e-05, -2.16144090e-05, -2.14885731e-05, -2.13627172e-05, -2.12368468e-05, -2.11109600e-05, -2.09850568e-05, -2.08591391e-05, -2.07332032e-05, -2.06072546e-05, -2.04812841e-05, -2.03553045e-05, -2.02293068e-05, -2.01032944e-05, -1.99772676e-05, -1.98512244e-05, -1.97251647e-05, -1.95990906e-05, -1.94730019e-05, -1.93468968e-05, -1.92207790e-05, -1.90946448e-05, -1.89684961e-05, -1.88423346e-05, -1.87161568e-05, -1.85899662e-05, -1.84637611e-05, -1.83375396e-05, -1.82113072e-05, -1.80850584e-05, -1.79587987e-05, -1.78325226e-05, -1.77062338e-05, -1.75799323e-05, -1.74536162e-05, -1.73272874e-05, -1.72009441e-05, -1.70745898e-05, -1.69482209e-05, -1.68218394e-05, -1.66954451e-05, -1.65690362e-05, -1.64426165e-05, -1.63161840e-05, -1.61897387e-05, -1.60632826e-05, -1.59368119e-05, -1.58103285e-05, -1.56838360e-05, -1.55573307e-05, -1.54308127e-05, -1.53042802e-05, ... 1.58103285e-05, 1.59368119e-05, 1.60632826e-05, 1.61897387e-05, 1.63161840e-05, 1.64426165e-05, 1.65690362e-05, 1.66954451e-05, 1.68218394e-05, 1.69482209e-05, 1.70745898e-05, 1.72009441e-05, 1.73272874e-05, 1.74536162e-05, 1.75799323e-05, 1.77062338e-05, 1.78325226e-05, 1.79587987e-05, 1.80850584e-05, 1.82113072e-05, 1.83375396e-05, 1.84637611e-05, 1.85899662e-05, 1.87161568e-05, 1.88423346e-05, 1.89684961e-05, 1.90946448e-05, 1.92207790e-05, 1.93468968e-05, 1.94730019e-05, 1.95990906e-05, 1.97251647e-05, 1.98512244e-05, 1.99772676e-05, 2.01032944e-05, 2.02293068e-05, 2.03553045e-05, 2.04812841e-05, 2.06072546e-05, 2.07332032e-05, 2.08591391e-05, 2.09850568e-05, 2.11109600e-05, 2.12368468e-05, 2.13627172e-05, 2.14885731e-05, 2.16144090e-05, 2.17402285e-05, 2.18660334e-05, 2.19918202e-05, 2.21175906e-05, 2.22433446e-05, 2.23690804e-05, 2.24947999e-05, 2.26205029e-05, 2.27461878e-05, 2.28718527e-05, 2.29975049e-05, 2.31231388e-05, 2.32487528e-05, 2.33743503e-05, 2.34999279e-05, 2.36254891e-05, 2.37510321e-05, 2.38765588e-05, 2.40020654e-05, 2.41275538e-05, 2.42530223e-05, 2.43784743e-05, 2.45039064e-05, 2.46293203e-05, 2.47547141e-05, 2.48800898e-05, 2.50054509e-05, 2.51307883e-05, 2.52561058e-05], dtype=float32)
tiw["dens"] = pump.mdjwf.dens(tiw.salt, tiw.theta, tiw.depth)
tiw = pump.calc.calc_reduced_shear(tiw)
tiw["mld"] = pump.calc.get_mld(tiw.dens)
tiw["dcl_base"] = pump.calc.get_dcl_base_Ri(tiw)
tiw["dcl"] = tiw["mld"] - tiw["dcl_base"]
calc uz
calc vz
calc S2
calc N2
calc shred2
Calc Ri
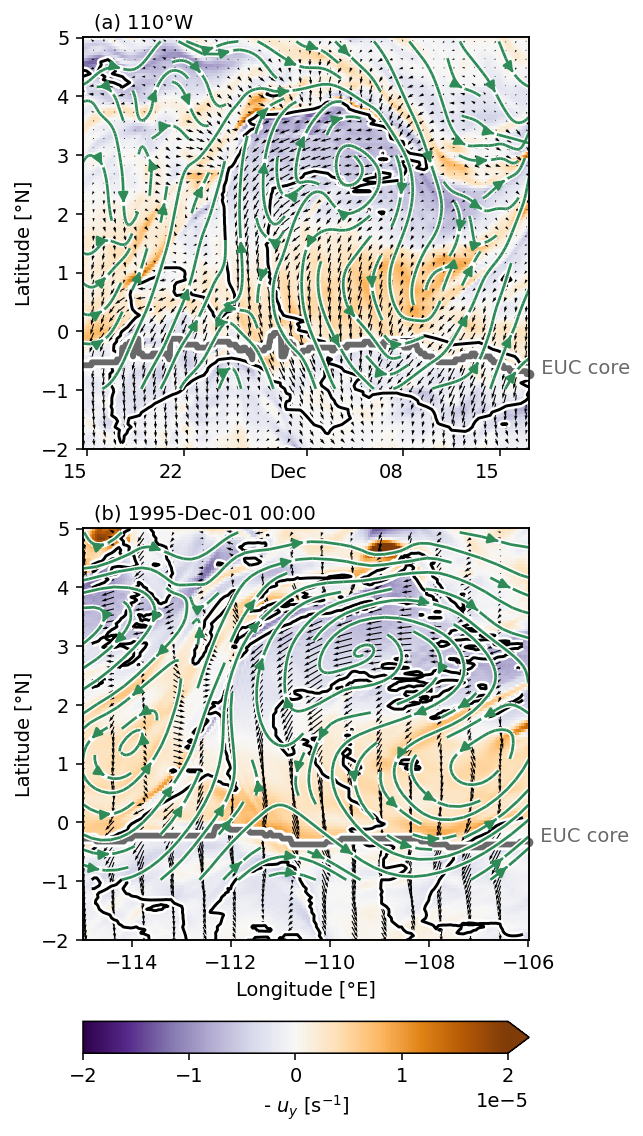
f, ax = plt.subplots(2, 1, sharey=True, constrained_layout=True)
pump.plot.vor_streamplot(
period4, vort, stride=3, refspeed=0.5, ax=ax[0], colorbar=False
)
pump.plot.vor_streamplot(
tiw, tiw_vort, stride=2, refspeed=0.5, x="longitude", scale=0.4, ax=ax[1]
)
f.set_size_inches((dcpy.plots.pub_fig_width("jpo", "medium 1"), 8))
dcpy.plots.label_subplots(ax, y=1.02, x=0.025, labels=["110°W", "1995-Dec-01 00:00"])
plt.gcf().savefig("../images/110-period-4-vort-vec-rot.png")
[Text(0.025, 1.02, '(a) 110°W'), Text(0.025, 1.02, '(b) 1995-Dec-01 00:00')]
x = "longitude"
refspeed = 0.5
tiw = tiw_all.sel(time="1995-Dec-01 00:00", longitude=slice(-115, -106))
subset = (
tiw[["u", "v"]]
.sel(latitude=slice(-1, 5), depth=slice(0, -70))
.isel(latitude=slice(0, -1, 1))
.mean("depth")
).compute()
dx = np.arange(0, 0.05 * subset.sizes["longitude"], 0.05)
dy = subset.latitude.data
dx, y, u, v = dask.compute(
dx,
dy,
subset.u.transpose("latitude", x) + refspeed,
subset.v.transpose("latitude", x),
)
plt.streamplot(
dx,
dy,
u.values,
v.values,
color="k",
linewidth=3,
arrowstyle="-",
density=0.8,
)
<matplotlib.streamplot.StreamplotSet at 0x2b0fe5d1d1f0>
pump.plot.vor_streamplot(period4, vort, stride=3, refspeed=0.5)
plt.gcf().savefig("../images/110-period-4-vort-vec-rot.png")
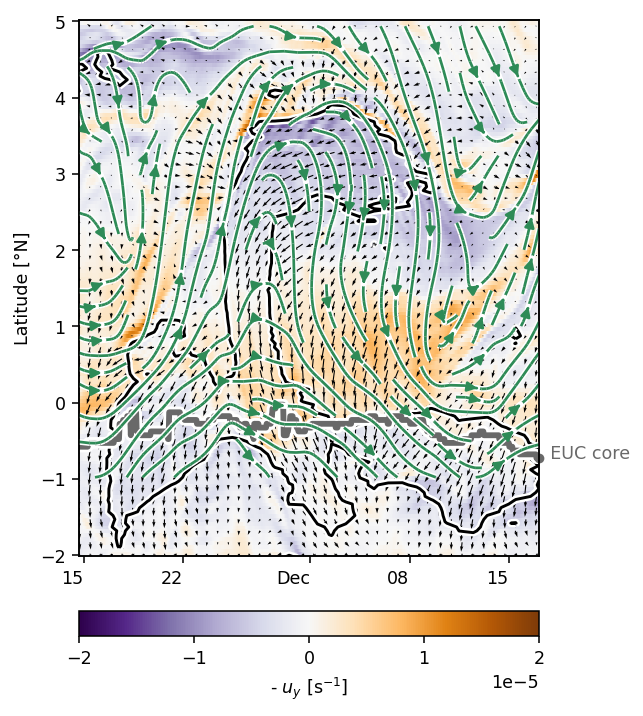
Figure 8: shear evolution + snapshots#
duzdt, dvzdt = dask.compute(*pump.calc.estimate_shear_evolution_terms(period4))
duzdt
<xarray.Dataset>
Dimensions: (depth: 200, latitude: 400, time: 779)
Coordinates:
* depth (depth) float64 -0.5 -1.5 -2.5 -3.5 ... -197.5 -198.5 -199.5
* latitude (latitude) float32 -10.0 -9.949875 -9.89975 ... 9.949875 10.0
longitude float32 -110.00916
* time (time) datetime64[ns] 1995-11-14T17:00:00 ... 1995-12-17T03:00:00
Data variables:
xadv (time, depth, latitude) float32 2.5738722e-09 ... 2.641062e-10
yadv (time, depth, latitude) float32 1.7001174e-10 ... -1.6879712e-10
str (time, depth, latitude) float32 1.6083877e-08 ... 1.447781e-10
tilt (latitude, time, depth) float32 -2.5338989e-07 ... 2.8220213e-09
vtilt (latitude, time, depth) float32 -2.2721191e-07 ... 2.814436e-09
htilt (time, depth, latitude) float32 -2.617798e-08 ... 7.58544e-12
buoy (time, depth, latitude) float32 1.524855e-08 ... 2.5125453e-09
fric (time, depth, latitude) float32 nan nan nan nan ... nan nan nan
Attributes:
description: Zonal shear evolution termsxarray.Dataset
- depth: 200
- latitude: 400
- time: 779
- depth(depth)float64-0.5 -1.5 -2.5 ... -198.5 -199.5
- units :
- m
array([ -0.5, -1.5, -2.5, -3.5, -4.5, -5.5, -6.5, -7.5, -8.5, -9.5, -10.5, -11.5, -12.5, -13.5, -14.5, -15.5, -16.5, -17.5, -18.5, -19.5, -20.5, -21.5, -22.5, -23.5, -24.5, -25.5, -26.5, -27.5, -28.5, -29.5, -30.5, -31.5, -32.5, -33.5, -34.5, -35.5, -36.5, -37.5, -38.5, -39.5, -40.5, -41.5, -42.5, -43.5, -44.5, -45.5, -46.5, -47.5, -48.5, -49.5, -50.5, -51.5, -52.5, -53.5, -54.5, -55.5, -56.5, -57.5, -58.5, -59.5, -60.5, -61.5, -62.5, -63.5, -64.5, -65.5, -66.5, -67.5, -68.5, -69.5, -70.5, -71.5, -72.5, -73.5, -74.5, -75.5, -76.5, -77.5, -78.5, -79.5, -80.5, -81.5, -82.5, -83.5, -84.5, -85.5, -86.5, -87.5, -88.5, -89.5, -90.5, -91.5, -92.5, -93.5, -94.5, -95.5, -96.5, -97.5, -98.5, -99.5, -100.5, -101.5, -102.5, -103.5, -104.5, -105.5, -106.5, -107.5, -108.5, -109.5, -110.5, -111.5, -112.5, -113.5, -114.5, -115.5, -116.5, -117.5, -118.5, -119.5, -120.5, -121.5, -122.5, -123.5, -124.5, -125.5, -126.5, -127.5, -128.5, -129.5, -130.5, -131.5, -132.5, -133.5, -134.5, -135.5, -136.5, -137.5, -138.5, -139.5, -140.5, -141.5, -142.5, -143.5, -144.5, -145.5, -146.5, -147.5, -148.5, -149.5, -150.5, -151.5, -152.5, -153.5, -154.5, -155.5, -156.5, -157.5, -158.5, -159.5, -160.5, -161.5, -162.5, -163.5, -164.5, -165.5, -166.5, -167.5, -168.5, -169.5, -170.5, -171.5, -172.5, -173.5, -174.5, -175.5, -176.5, -177.5, -178.5, -179.5, -180.5, -181.5, -182.5, -183.5, -184.5, -185.5, -186.5, -187.5, -188.5, -189.5, -190.5, -191.5, -192.5, -193.5, -194.5, -195.5, -196.5, -197.5, -198.5, -199.5]) - latitude(latitude)float32-10.0 -9.949875 ... 9.949875 10.0
- long_name :
- Latitude
- units :
- °N
array([-10. , -9.949875, -9.89975 , ..., 9.89975 , 9.949875, 10. ], dtype=float32) - longitude()float32-110.00916
array(-110.00916, dtype=float32)
- time(time)datetime64[ns]1995-11-14T17:00:00 ... 1995-12-...
array(['1995-11-14T17:00:00.000000000', '1995-11-14T18:00:00.000000000', '1995-11-14T19:00:00.000000000', ..., '1995-12-17T01:00:00.000000000', '1995-12-17T02:00:00.000000000', '1995-12-17T03:00:00.000000000'], dtype='datetime64[ns]')
- xadv(time, depth, latitude)float322.5738722e-09 ... 2.641062e-10
- term :
- $-u ∂_xu_z$
- long_name :
- zonal adv.
array([[[ 2.57387223e-09, 2.67581912e-09, 3.13446491e-09, ..., 3.04907317e-08, 1.48272807e-08, -1.99386960e-08], [ 1.46694712e-09, 1.57427615e-09, 2.03740247e-09, ..., 2.95973397e-08, 1.65832414e-08, -1.18662475e-08], [ 1.68435751e-10, 2.90054092e-10, 7.94342980e-10, ..., 1.24453177e-08, 7.77786369e-09, 2.16988316e-09], ..., [ 3.24825167e-10, -9.72816064e-11, -6.72459033e-10, ..., 5.87240187e-11, 3.86444661e-11, -3.20180618e-11], [ 5.42330625e-10, 8.50935156e-11, -5.15549325e-10, ..., 7.33257136e-11, 5.09154247e-11, -3.18901607e-11], [ 6.42568387e-10, 1.75517004e-10, -4.28123897e-10, ..., 8.13803261e-11, 5.70474189e-11, -3.20806402e-11]], [[ 1.00363096e-09, 3.27139343e-10, 9.08592146e-10, ..., 1.57106044e-08, -6.46544152e-09, -4.90739822e-08], [ 1.80204060e-10, -4.23774543e-10, 1.06279471e-10, ..., 1.79432469e-08, 1.68328507e-09, -3.48563383e-08], [-8.17275803e-10, -1.35998646e-09, -8.87845686e-10, ..., 9.92351534e-09, 2.86825541e-09, -2.39384090e-09], ... 7.43748174e-10, 1.34461575e-09, 3.61692926e-10], [ 3.30809247e-09, 4.64583838e-09, 4.23076640e-09, ..., 6.80700496e-10, 1.29337863e-09, 3.02524922e-10], [ 3.73778342e-09, 4.92575047e-09, 4.49668880e-09, ..., 6.51631693e-10, 1.25839916e-09, 2.76873829e-10]], [[ 5.87481730e-10, 8.92568131e-10, 1.18243548e-09, ..., 8.33107694e-10, 1.21677757e-09, 1.82932147e-09], [ 3.40539236e-10, 5.52679347e-10, 7.52162943e-10, ..., 6.75554224e-10, 9.74877068e-10, 1.44403756e-09], [ 1.52593355e-10, 1.93475874e-10, 3.07772835e-10, ..., 6.50776100e-10, 1.07586340e-09, 1.46592216e-09], ..., [ 3.28005867e-09, 4.76332884e-09, 4.33104574e-09, ..., 7.14573511e-10, 1.34252931e-09, 3.50884960e-10], [ 3.83493859e-09, 5.09214537e-09, 4.60811123e-09, ..., 6.51346421e-10, 1.29893352e-09, 2.90764440e-10], [ 4.24890834e-09, 5.32536237e-09, 4.83575491e-09, ..., 6.22141061e-10, 1.26764099e-09, 2.64106209e-10]]], dtype=float32) - yadv(time, depth, latitude)float321.7001174e-10 ... -1.6879712e-10
- term :
- $-v ∂_yu_z$
- long_name :
- meridional adv.
array([[[ 1.70011741e-10, 1.70456968e-10, 1.41285483e-10, ..., 1.15915739e-08, 1.74701906e-08, 2.69725735e-08], [ 2.37593362e-10, 2.37604963e-10, 2.01422379e-10, ..., 5.93271343e-09, 9.90143256e-09, 1.74478565e-08], [ 3.17823795e-10, 3.18354509e-10, 2.77822682e-10, ..., 9.07182329e-09, 1.06945164e-08, 1.19091217e-08], ..., [ 2.68276457e-10, 1.93877206e-10, -1.66239626e-11, ..., -3.39661216e-10, -2.08433167e-11, 6.62999169e-11], [ 1.56050117e-10, 1.47823545e-10, -3.65081888e-11, ..., -3.67445130e-10, -1.67427686e-11, 4.48139130e-11], [ 9.98886529e-11, 1.16668925e-10, -5.60580159e-11, ..., -3.73887560e-10, -1.89277552e-11, 2.78860129e-11]], [[ 8.70164774e-11, 3.50784540e-11, -2.38434966e-11, ..., 3.54014134e-08, 4.62030840e-08, 4.87522591e-08], [ 1.66162528e-10, 1.09900401e-10, 4.08781446e-11, ..., 2.56053756e-08, 3.34958230e-08, 3.52852574e-08], [ 2.91335456e-10, 2.37670772e-10, 1.57577035e-10, ..., 1.45566963e-08, 1.74959531e-08, 2.02655990e-08], ... -2.96645819e-10, -2.54485627e-10, -1.55008048e-10], [-4.74665818e-09, -4.93325203e-09, -4.25904867e-09, ..., -3.01024289e-10, -2.61399818e-10, -1.59417105e-10], [-4.82335327e-09, -4.93893859e-09, -3.85627441e-09, ..., -3.06215719e-10, -2.66432265e-10, -1.62333924e-10]], [[-6.35248854e-10, -4.74577433e-10, -4.23435453e-10, ..., -2.84585577e-09, -1.26742705e-09, 1.59248292e-09], [-4.49402238e-10, -3.19435867e-10, -2.77680323e-10, ..., -2.80501533e-09, -1.26319721e-09, 1.50963864e-09], [-5.05386732e-10, -2.99130193e-10, -1.64244840e-10, ..., -3.34763595e-09, -5.51503232e-10, 2.00058792e-09], ..., [-4.65762984e-09, -4.90625096e-09, -4.70395589e-09, ..., -3.15087262e-10, -2.61183131e-10, -1.59807667e-10], [-4.73114570e-09, -4.77530682e-09, -3.82464149e-09, ..., -3.19328508e-10, -2.68935180e-10, -1.65299843e-10], [-4.77358686e-09, -4.74480855e-09, -3.39194184e-09, ..., -3.24194088e-10, -2.74377271e-10, -1.68797115e-10]]], dtype=float32) - str(time, depth, latitude)float321.6083877e-08 ... 1.447781e-10
- term :
- $u_z v_y$
- long_name :
- stretching
array([[[ 1.60838773e-08, 1.50004329e-08, 1.48731809e-08, ..., -3.51504714e-09, -3.79170428e-09, 6.29380048e-10], [ 1.30953071e-08, 1.22238291e-08, 1.20910100e-08, ..., -3.00326275e-09, -3.34760175e-09, 2.79691860e-11], [ 9.04452602e-09, 8.44517167e-09, 8.32775093e-09, ..., -2.36188558e-09, -2.81092882e-09, -2.45716086e-10], ..., [-1.43218781e-09, -1.29474986e-09, -9.97514404e-10, ..., 2.02525687e-11, 1.31126056e-11, 1.53354048e-11], [-1.37480838e-09, -1.28975541e-09, -9.97066651e-10, ..., 2.00188477e-11, 1.40549222e-11, 1.54237057e-11], [-1.34443456e-09, -1.28574296e-09, -1.00008157e-09, ..., 2.00854038e-11, 1.45801028e-11, 1.53016193e-11]], [[ 1.79633979e-08, 1.63461458e-08, 1.45469361e-08, ..., -2.27962405e-09, -5.14990051e-09, -2.43568321e-09], [ 1.43556802e-08, 1.30796680e-08, 1.16408652e-08, ..., -1.87892302e-09, -4.11688594e-09, -2.01511585e-09], [ 9.51370183e-09, 8.67185257e-09, 7.71021469e-09, ..., -1.42424139e-09, -3.06597792e-09, -1.45601642e-09], ... 3.24349644e-11, 1.40873938e-10, 1.57207511e-10], [-2.68394129e-09, -2.09844497e-09, -1.11265519e-09, ..., 3.09656606e-11, 1.38501460e-10, 1.53583174e-10], [-2.87783108e-09, -2.05970552e-09, -9.36017042e-10, ..., 3.03388946e-11, 1.35935874e-10, 1.49057516e-10]], [[ 3.69341091e-09, 9.63506445e-12, -8.40123171e-09, ..., 2.73140390e-08, 3.13865129e-08, 3.09981409e-08], [ 2.67901967e-09, 2.26384120e-11, -6.08199047e-09, ..., 1.96969712e-08, 2.24622578e-08, 2.21304948e-08], [ 1.37635348e-09, 2.83809001e-11, -3.04320391e-09, ..., 1.03219833e-08, 1.16628787e-08, 1.15132615e-08], ..., [-3.00834535e-09, -2.41181475e-09, -1.48307477e-09, ..., 1.61718208e-11, 1.26922930e-10, 1.51204008e-10], [-3.10386583e-09, -2.24517982e-09, -1.18102339e-09, ..., 1.47394284e-11, 1.25203098e-10, 1.48534421e-10], [-3.18259818e-09, -2.14864060e-09, -9.92167348e-10, ..., 1.41214289e-11, 1.23192692e-10, 1.44778106e-10]]], dtype=float32) - tilt(latitude, time, depth)float32-2.5338989e-07 ... 2.8220213e-09
- term :
- $(f-u_y) v_z$
- long_name :
- tilting
array([[[-2.53389885e-07, -1.97459016e-07, -1.22315669e-07, ..., 3.42002657e-08, 3.32516272e-08, 3.27927978e-08], [-2.43301429e-07, -1.85223655e-07, -1.07535577e-07, ..., 3.46173330e-08, 3.35880550e-08, 3.30797469e-08], [-2.26404239e-07, -1.65794802e-07, -8.52680628e-08, ..., 3.48594469e-08, 3.37576225e-08, 3.32035519e-08], ..., [-8.45478851e-08, -5.81357398e-08, -2.44484717e-08, ..., -1.86180826e-09, 8.40963654e-09, 1.31310411e-08], [-9.68319114e-08, -6.72647289e-08, -2.95691454e-08, ..., 5.60978330e-09, 1.49453392e-08, 1.91439469e-08], [-1.05395287e-07, -7.37124424e-08, -3.32580221e-08, ..., 1.19716947e-08, 2.03923811e-08, 2.40957654e-08]], [[-2.51904339e-07, -1.96242894e-07, -1.21461838e-07, ..., 3.42377824e-08, 3.33934551e-08, 3.29169509e-08], [-2.41517768e-07, -1.83735182e-07, -1.06434172e-07, ..., 3.45027331e-08, 3.36593438e-08, 3.31846124e-08], [-2.22897327e-07, -1.63124895e-07, -8.36656042e-08, ..., 3.45214985e-08, 3.36678063e-08, 3.31904566e-08], ... 5.35888400e-09, 5.53997603e-09, 5.62061286e-09], [-2.12962750e-08, -1.20746497e-08, -2.19191346e-10, ..., 5.17345455e-09, 5.36783240e-09, 5.45531220e-09], [-4.13050323e-08, -2.61865534e-08, -6.82196344e-09, ..., 4.91777241e-09, 5.12608622e-09, 5.22058619e-09]], [[ 1.93666551e-07, 1.67790731e-07, 1.73869537e-07, ..., 2.24021801e-09, 2.03671369e-09, 1.93028660e-09], [ 1.63374338e-07, 1.44276981e-07, 1.55302132e-07, ..., 2.60789301e-09, 2.40529241e-09, 2.29913999e-09], [ 1.35209291e-07, 1.22778118e-07, 1.43223588e-07, ..., 2.94911073e-09, 2.74735856e-09, 2.64144706e-09], ..., [-1.66530274e-08, -8.92402241e-09, 9.69263336e-10, ..., 3.13395465e-09, 3.08421488e-09, 3.05435988e-09], [-2.99347356e-08, -1.86802129e-08, -4.29324087e-09, ..., 3.03433789e-09, 3.00156655e-09, 2.97791680e-09], [-5.04607840e-08, -3.34210633e-08, -1.16634045e-08, ..., 2.85250135e-09, 2.83808776e-09, 2.82202128e-09]]], dtype=float32) - vtilt(latitude, time, depth)float32-2.2721191e-07 ... 2.814436e-09
- term :
- $ζ v_z$
- long_name :
- vvort tilting
array([[[-2.27211913e-07, -1.77189563e-07, -1.09830992e-07, ..., 3.86682686e-08, 3.76975180e-08, 3.72739670e-08], [-2.17689987e-07, -1.65841101e-07, -9.63396900e-08, ..., 3.91890183e-08, 3.81318443e-08, 3.76577063e-08], [-2.02954055e-07, -1.48755134e-07, -7.65623653e-08, ..., 3.94951805e-08, 3.83601204e-08, 3.78388414e-08], ..., [-8.95593431e-08, -6.15978735e-08, -2.59069601e-08, ..., -1.93061367e-09, 8.76808581e-09, 1.37633194e-08], [-1.02672203e-07, -7.13429245e-08, -3.13651185e-08, ..., 5.83365223e-09, 1.56239572e-08, 2.01145678e-08], [-1.11772160e-07, -7.81938923e-08, -3.52824436e-08, ..., 1.24778987e-08, 2.13627924e-08, 2.53636969e-08]], [[-2.29718026e-07, -1.79079265e-07, -1.10903578e-07, ..., 3.87721748e-08, 3.79162266e-08, 3.74706346e-08], [-2.20456755e-07, -1.67824609e-07, -9.72728884e-08, ..., 3.90747061e-08, 3.82246768e-08, 3.77865419e-08], [-2.04273803e-07, -1.49625976e-07, -7.67990755e-08, ..., 3.90789161e-08, 3.82211418e-08, 3.77843747e-08], ... 5.33969091e-09, 5.51547519e-09, 5.59088242e-09], [-2.30028103e-08, -1.30435467e-08, -2.36792808e-10, ..., 5.16922860e-09, 5.35898126e-09, 5.44160672e-09], [-4.44573054e-08, -2.81853048e-08, -7.34258032e-09, ..., 4.92470065e-09, 5.12908560e-09, 5.21915666e-09]], [[ 1.89826821e-07, 1.64503561e-07, 1.70347619e-07, ..., 2.16083440e-09, 1.96236782e-09, 1.85787896e-09], [ 1.59901887e-07, 1.41395248e-07, 1.52121515e-07, ..., 2.51382359e-09, 2.31605313e-09, 2.21160290e-09], [ 1.32289131e-07, 1.20811407e-07, 1.40963806e-07, ..., 2.83730817e-09, 2.64048960e-09, 2.53623744e-09], ..., [-1.79587207e-08, -9.62412816e-09, 1.04529285e-09, ..., 3.11256465e-09, 3.06189607e-09, 3.03090641e-09], [-3.21109930e-08, -2.00375716e-08, -4.60490179e-09, ..., 3.02284797e-09, 2.98891401e-09, 2.96398261e-09], [-5.39127463e-08, -3.57021186e-08, -1.24576145e-08, ..., 2.84749402e-09, 2.83183765e-09, 2.81443602e-09]]], dtype=float32) - htilt(time, depth, latitude)float32-2.617798e-08 ... 7.58544e-12
- term :
- $-v_x v_z$
- long_name :
- hvort tilting
array([[[-2.61779807e-08, -2.21863168e-08, -1.79411757e-08, ..., 3.87951893e-09, 3.30422512e-09, 3.83972987e-09], [-2.02694519e-08, -1.71636394e-08, -1.38549172e-08, ..., 3.49467766e-09, 3.09358805e-09, 3.28716721e-09], [-1.24846808e-08, -1.05582600e-08, -8.50701376e-09, ..., 3.54143337e-09, 3.36843020e-09, 3.52191520e-09], ..., [-4.46800197e-09, -4.53439464e-09, -4.49043469e-09, ..., -4.86527658e-11, 3.94920659e-11, 7.93835622e-11], [-4.44588988e-09, -4.52277193e-09, -4.46950477e-09, ..., -6.03842740e-11, 3.24156153e-11, 7.43457865e-11], [-4.48116921e-09, -4.55368543e-09, -4.49592186e-09, ..., -6.57448818e-11, 2.88809272e-11, 7.24076701e-11]], [[-2.56114419e-08, -2.10610001e-08, -1.65570686e-08, ..., 1.95806193e-09, 1.62200042e-09, 3.47245077e-09], [-1.93825720e-08, -1.59105689e-08, -1.24723876e-08, ..., 1.95216798e-09, 1.59469649e-09, 2.88174307e-09], [-1.11958913e-08, -9.16128684e-09, -7.15603221e-09, ..., 2.33360842e-09, 2.02180228e-09, 3.18061955e-09], ... -1.47707437e-11, 4.22567233e-12, 1.14898603e-11], [-6.78618994e-10, -1.91875871e-09, -2.23258745e-09, ..., -1.09785939e-11, 8.85123658e-12, 1.26525431e-11], [-9.70622138e-10, -2.08865680e-09, -2.23717445e-09, ..., -7.42504235e-12, 1.37056139e-11, 1.39343693e-11]], [[ 6.37685993e-09, 3.57637386e-09, 1.54358426e-09, ..., 2.62593947e-09, 3.15227311e-09, 3.45196560e-09], [ 4.48145121e-09, 2.53386445e-09, 1.12055853e-09, ..., 1.61904767e-09, 1.99875139e-09, 2.28105890e-09], [ 2.02442196e-09, 1.14666843e-09, 5.17169640e-10, ..., 3.17915583e-10, 5.20617105e-10, 7.94210808e-10], ..., [-5.06203579e-10, -1.85926563e-09, -2.32548714e-09, ..., -1.91731474e-11, -6.92793696e-12, 5.00730707e-12], [-9.70411640e-10, -2.12190909e-09, -2.32219111e-09, ..., -1.57130663e-11, -2.99962442e-12, 6.25023427e-12], [-1.26793276e-09, -2.24733476e-09, -2.27541808e-09, ..., -1.24195055e-11, 1.42938016e-12, 7.58544009e-12]]], dtype=float32) - buoy(time, depth, latitude)float321.524855e-08 ... 2.5125453e-09
- term :
- $-b_x$
- long_name :
- buoyancy
array([[[ 1.52485509e-08, 1.75878174e-08, 2.00137240e-08, ..., 9.01050790e-09, 1.84542124e-08, 2.07068407e-08], [ 1.52485509e-08, 1.75878174e-08, 1.99270840e-08, ..., 9.61698365e-09, 1.89740508e-08, 2.09667572e-08], [ 1.53351909e-08, 1.77610957e-08, 2.00137240e-08, ..., 1.02234603e-08, 1.93206091e-08, 2.10533972e-08], ..., [-1.51619108e-08, -1.55951092e-08, -1.61149458e-08, ..., 8.66394956e-10, 8.66395011e-11, -5.19836951e-10], [-1.51619108e-08, -1.55951092e-08, -1.59416675e-08, ..., 8.66394956e-10, 8.66395011e-11, -5.19836951e-10], [-1.52485509e-08, -1.55951092e-08, -1.56817492e-08, ..., 8.66394956e-10, 1.73279002e-10, -5.19836951e-10]], [[ 1.46420742e-08, 1.68947007e-08, 1.92339673e-08, ..., 7.36435712e-09, 1.68947007e-08, 2.22663505e-08], [ 1.46420742e-08, 1.69813408e-08, 1.92339673e-08, ..., 7.97083377e-09, 1.75011774e-08, 2.24396288e-08], [ 1.47287142e-08, 1.70679808e-08, 1.93206091e-08, ..., 8.49067039e-09, 1.81942941e-08, 2.26129071e-08], ... -1.47287149e-09, 5.19836951e-10, 2.77246404e-09], [ 1.12631344e-08, 1.10032161e-08, 9.27042620e-09, ..., -1.55951085e-09, 5.19836951e-10, 2.85910340e-09], [ 1.11764953e-08, 1.10032161e-08, 9.18378706e-09, ..., -1.73278991e-09, 5.19836951e-10, 2.77246404e-09]], [[-4.67853267e-09, -4.50525395e-09, -4.07205647e-09, ..., -6.49796261e-09, -5.19836973e-09, -3.03238235e-09], [-4.59189353e-09, -4.41861436e-09, -3.98541689e-09, ..., -6.49796261e-09, -5.28500976e-09, -3.11902171e-09], [-4.50525395e-09, -4.41861436e-09, -4.07205647e-09, ..., -6.49796261e-09, -5.37164890e-09, -3.20566129e-09], ..., [ 1.07432978e-08, 9.70362368e-09, 7.62427543e-09, ..., -1.64615044e-09, 2.59918476e-10, 2.68582445e-09], [ 1.08299378e-08, 9.79026282e-09, 7.71091546e-09, ..., -1.90606886e-09, 1.73279002e-10, 2.59918487e-09], [ 1.09165770e-08, 9.87690196e-09, 7.71091546e-09, ..., -1.81942938e-09, 8.66395011e-11, 2.51254528e-09]]], dtype=float32) - fric(time, depth, latitude)float32nan nan nan nan ... nan nan nan nan
- term :
- $F^x_z$
- long_name :
- friction
array([[[ nan, nan, nan, ..., nan, nan, nan], [ nan, nan, nan, ..., nan, nan, nan], [ 5.5284465e-07, 5.5085138e-07, 5.4969075e-07, ..., -7.5650519e-07, -5.2114177e-07, -4.2506804e-07], ..., [ 5.7488964e-10, 4.9197013e-10, -1.0673240e-10, ..., 6.4123040e-11, 6.4497532e-11, -5.6312982e-11], [ nan, nan, nan, ..., nan, nan, nan], [ nan, nan, nan, ..., nan, nan, nan]], [[ nan, nan, nan, ..., nan, nan, nan], [ nan, nan, nan, ..., nan, nan, nan], [ 6.3967309e-07, 6.6414441e-07, 6.7975441e-07, ..., -6.6768195e-07, -5.6563471e-07, -4.4416191e-07], ... [ 3.4184211e-10, -7.0674133e-11, -8.5519147e-11, ..., 8.1531226e-11, 2.4196334e-10, 2.5132130e-10], [ nan, nan, nan, ..., nan, nan, nan], [ nan, nan, nan, ..., nan, nan, nan]], [[ nan, nan, nan, ..., nan, nan, nan], [ nan, nan, nan, ..., nan, nan, nan], [ 1.5086073e-08, 1.3100930e-08, 1.7141815e-08, ..., 2.9696423e-08, 1.7770674e-08, 1.7050070e-08], ..., [ 6.7593042e-11, -2.6587976e-10, -1.7207125e-10, ..., 7.8923756e-11, 2.4007663e-10, 2.6535441e-10], [ nan, nan, nan, ..., nan, nan, nan], [ nan, nan, nan, ..., nan, nan, nan]]], dtype=float32)
- description :
- Zonal shear evolution terms
dcl = period4.dcl.resample(time="D").mean().rolling(latitude=3).mean().isel(longitude=1)
mpl.rcParams["hatch.color"] = "lightgray"
dcl.plot(x="time", robust=True)
dcl.where(dcl < 20).plot.contourf(x="time", hatches=".", colors="w")
<matplotlib.contour.QuadContourSet at 0x2b1e48139e48>
f, ax = pump.plot.plot_shear_terms(
period4,
duzdt.drop_vars(["xadv", "yadv"]).resample(time="D").mean(),
dvzdt.drop_vars(["xadv", "yadv"]).resample(time="D").mean(),
mask_dcl=False,
)
[
dcpy.plots.linex(snapshot_times, zorder=3, ax=aa, lw=1, ls="--", color="k")
for aa in unpack(ax)
]
f.savefig("images/shear-evolution.png")
/glade/u/home/dcherian/miniconda3/envs/dcpy/lib/python3.8/site-packages/xarray/core/nanops.py:142: RuntimeWarning: Mean of empty slice
return np.nanmean(a, axis=axis, dtype=dtype)
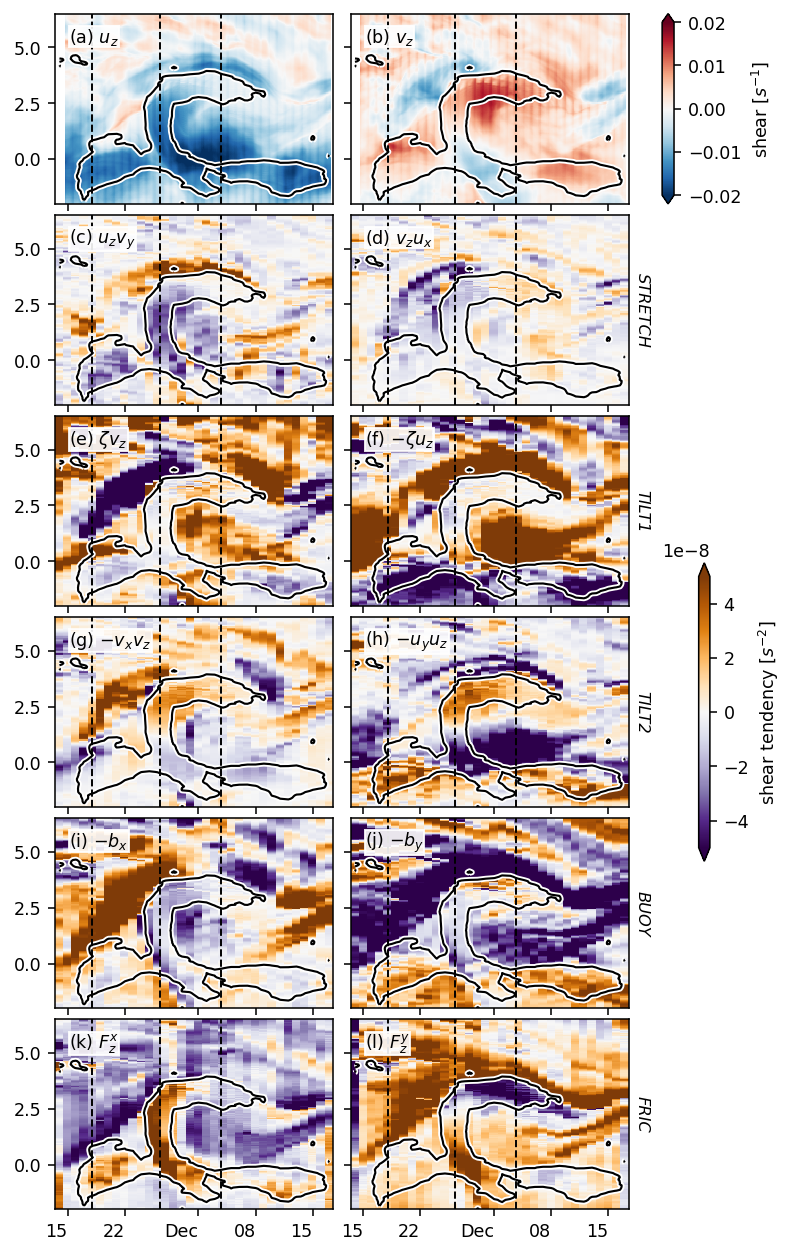
(ddy(period4.u) + ddx(period4.v)).isel(longitude=1).sel(depth=slice(-60)).mean(
"depth"
).plot(x="time", robust=True)
<matplotlib.collections.QuadMesh at 0x2b09bee68cd0>
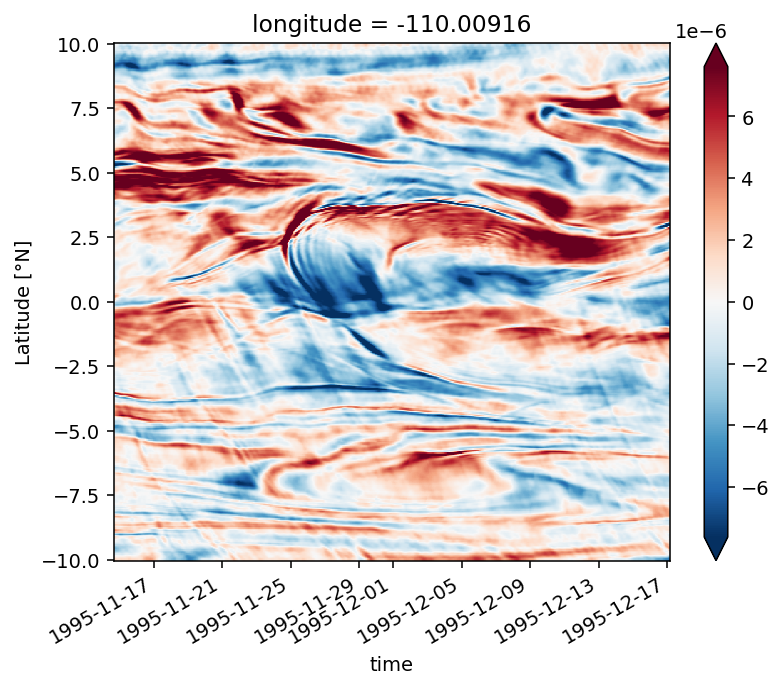
S2 = xr.Dataset()
S2["str"] = duzdt["str"] * period4.uz.isel(longitude=1) + dvzdt[
"str"
] * period4.vz.isel(longitude=1)
S2["htilt"] = (-period4.uz * period4.vz * (ddy(period4.u) + ddx(period4.v))).isel(
longitude=1
)
S2
<xarray.Dataset>
Dimensions: (depth: 200, latitude: 400, time: 779)
Coordinates:
* depth (depth) float64 -0.5 -1.5 -2.5 -3.5 ... -197.5 -198.5 -199.5
* latitude (latitude) float32 -10.0 -9.949875 -9.89975 ... 9.949875 10.0
longitude float32 -110.00916
* time (time) datetime64[ns] 1995-11-14T17:00:00 ... 1995-12-17T03:00:00
Data variables:
str (time, depth, latitude) float32 dask.array<chunksize=(50, 200, 400), meta=np.ndarray>
htilt (time, depth, latitude) float32 dask.array<chunksize=(50, 200, 400), meta=np.ndarray>xarray.Dataset
- depth: 200
- latitude: 400
- time: 779
- depth(depth)float64-0.5 -1.5 -2.5 ... -198.5 -199.5
- units :
- m
array([ -0.5, -1.5, -2.5, -3.5, -4.5, -5.5, -6.5, -7.5, -8.5, -9.5, -10.5, -11.5, -12.5, -13.5, -14.5, -15.5, -16.5, -17.5, -18.5, -19.5, -20.5, -21.5, -22.5, -23.5, -24.5, -25.5, -26.5, -27.5, -28.5, -29.5, -30.5, -31.5, -32.5, -33.5, -34.5, -35.5, -36.5, -37.5, -38.5, -39.5, -40.5, -41.5, -42.5, -43.5, -44.5, -45.5, -46.5, -47.5, -48.5, -49.5, -50.5, -51.5, -52.5, -53.5, -54.5, -55.5, -56.5, -57.5, -58.5, -59.5, -60.5, -61.5, -62.5, -63.5, -64.5, -65.5, -66.5, -67.5, -68.5, -69.5, -70.5, -71.5, -72.5, -73.5, -74.5, -75.5, -76.5, -77.5, -78.5, -79.5, -80.5, -81.5, -82.5, -83.5, -84.5, -85.5, -86.5, -87.5, -88.5, -89.5, -90.5, -91.5, -92.5, -93.5, -94.5, -95.5, -96.5, -97.5, -98.5, -99.5, -100.5, -101.5, -102.5, -103.5, -104.5, -105.5, -106.5, -107.5, -108.5, -109.5, -110.5, -111.5, -112.5, -113.5, -114.5, -115.5, -116.5, -117.5, -118.5, -119.5, -120.5, -121.5, -122.5, -123.5, -124.5, -125.5, -126.5, -127.5, -128.5, -129.5, -130.5, -131.5, -132.5, -133.5, -134.5, -135.5, -136.5, -137.5, -138.5, -139.5, -140.5, -141.5, -142.5, -143.5, -144.5, -145.5, -146.5, -147.5, -148.5, -149.5, -150.5, -151.5, -152.5, -153.5, -154.5, -155.5, -156.5, -157.5, -158.5, -159.5, -160.5, -161.5, -162.5, -163.5, -164.5, -165.5, -166.5, -167.5, -168.5, -169.5, -170.5, -171.5, -172.5, -173.5, -174.5, -175.5, -176.5, -177.5, -178.5, -179.5, -180.5, -181.5, -182.5, -183.5, -184.5, -185.5, -186.5, -187.5, -188.5, -189.5, -190.5, -191.5, -192.5, -193.5, -194.5, -195.5, -196.5, -197.5, -198.5, -199.5]) - latitude(latitude)float32-10.0 -9.949875 ... 9.949875 10.0
- long_name :
- Latitude
- units :
- °N
array([-10. , -9.949875, -9.89975 , ..., 9.89975 , 9.949875, 10. ], dtype=float32) - longitude()float32-110.00916
array(-110.00916, dtype=float32)
- time(time)datetime64[ns]1995-11-14T17:00:00 ... 1995-12-...
array(['1995-11-14T17:00:00.000000000', '1995-11-14T18:00:00.000000000', '1995-11-14T19:00:00.000000000', ..., '1995-12-17T01:00:00.000000000', '1995-12-17T02:00:00.000000000', '1995-12-17T03:00:00.000000000'], dtype='datetime64[ns]')
- str(time, depth, latitude)float32dask.array<chunksize=(50, 200, 400), meta=np.ndarray>
- term :
- $u_z v_y$
- long_name :
- stretching
Array Chunk Bytes 249.28 MB 16.00 MB Shape (779, 200, 400) (50, 200, 400) Count 178 Tasks 16 Chunks Type float32 numpy.ndarray - htilt(time, depth, latitude)float32dask.array<chunksize=(50, 200, 400), meta=np.ndarray>
Array Chunk Bytes 249.28 MB 16.00 MB Shape (779, 200, 400) (50, 200, 400) Count 368 Tasks 16 Chunks Type float32 numpy.ndarray
period4.S2.where(period4.dcl_mask).mean("depth").isel(longitude=1).plot(
robust=True, x="time", vmin=0, cmap=mpl.cm.Spectral_r
)
<matplotlib.collections.QuadMesh at 0x2b0b0c89c0a0>
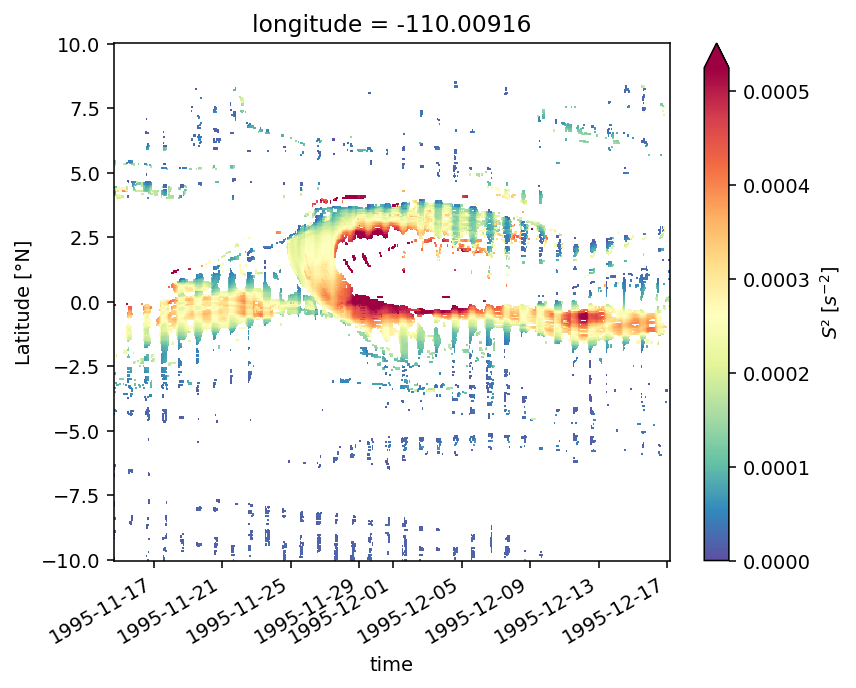
S2.to_array().sel(depth=slice(-60)).mean("depth").sum("variable").plot(
robust=True, x="time", vmax=5e-10, ylim=(-3, 6)
)
<matplotlib.collections.QuadMesh at 0x2acaecbdafd0>
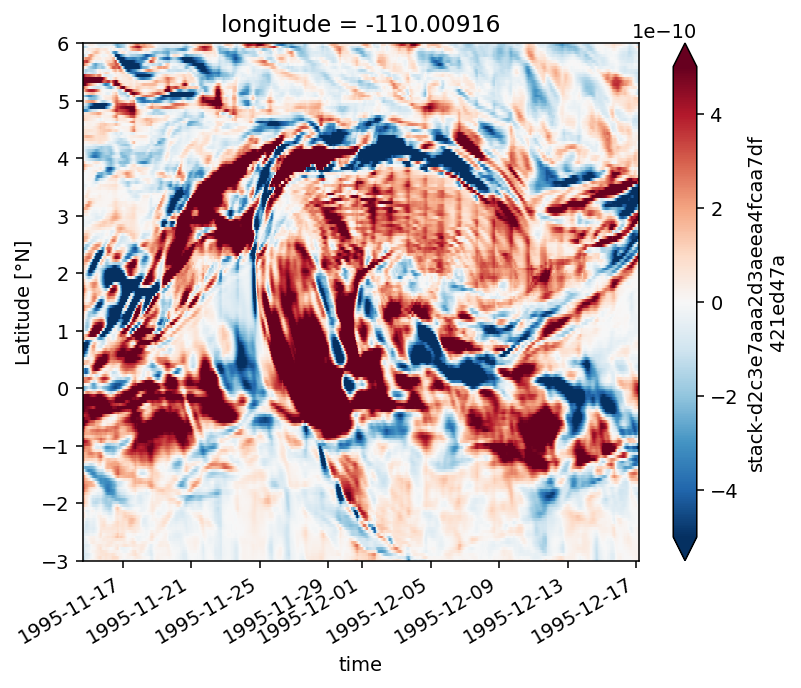
S2.to_array().where(period4.dcl_mask.isel(longitude=1)).sel(depth=slice(-60)).mean(
"depth"
).plot(col="variable", robust=True, x="time", vmax=5e-10, ylim=(-3, 6))
<xarray.plot.facetgrid.FacetGrid at 0x2b0b007288e0>
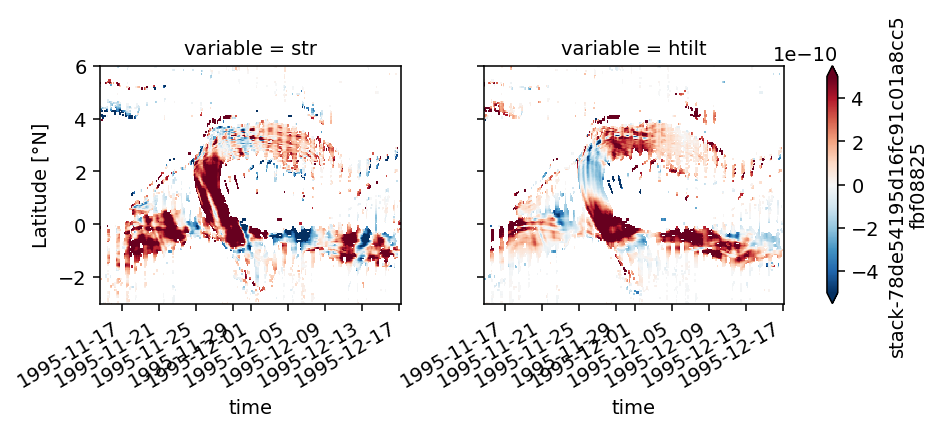
ddy(period4.w).isel(longitude=1).sel(depth=slice(-60)).mean("depth").plot(
x="time", robust=True
)
<matplotlib.collections.QuadMesh at 0x2b09be691c70>
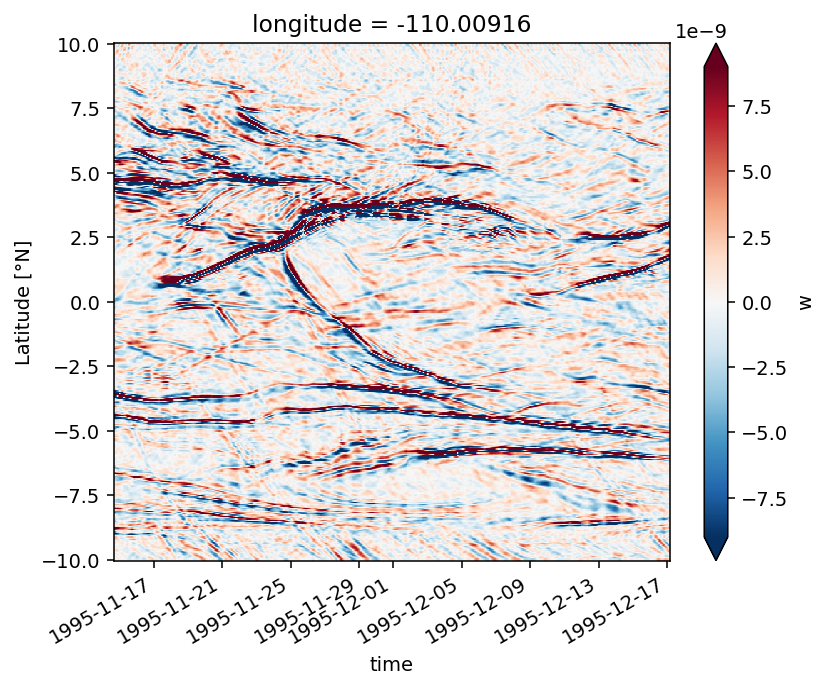
uyvx.isel(longitude=1).sel(depth=slice(-60)).mean("depth").plot(
y="latitude", robust=True
)
<matplotlib.collections.QuadMesh at 0x2b09bae84ac0>
Figure 9: KPP deep cycle for period4#
%matplotlib inline
subset.cf.describe()
Axes:
X: []
Y: []
Z: ['depth']
T: ['time']
Coordinates:
longitude: []
latitude: []
vertical: []
time: ['time']
Cell Measures:
area: []
volume: []
Standard Names:
subset.cf.axes
{'Z': ['depth'], 'T': ['time']}
jra = pump.obs.read_jra_95()
subset = period4.isel(longitude=1).sel(latitude=3.5, method="nearest").load()
subset.depth.attrs["axis"] = "Z"
forcing = pump.obs.interp_jra_to_station(jra, subset)
fluxes, coare = pump.calc.coare_fluxes_jra(subset.expand_dims("latitude"), forcing)
fluxes["netflux"] *= -1 # sign convention matches Jq
kpp = pump.calc.calc_kpp_terms(subset.merge(fluxes).chunk({"depth": -1}).fillna(0))
/glade/u/home/dcherian/python/xcoare/xcoare/coare35vn.py:777: RuntimeWarning: invalid value encountered in power
x = (1 - 18 * zet) ** 0.25
/glade/u/home/dcherian/python/xcoare/xcoare/coare35vn.py:780: RuntimeWarning: invalid value encountered in power
x = (1 - 10 * zet) ** 0.3333
/glade/u/home/dcherian/python/xcoare/xcoare/coare35vn.py:731: RuntimeWarning: invalid value encountered in sqrt
x = (1 - 15 * zet) ** 0.5
/glade/u/home/dcherian/python/xcoare/xcoare/coare35vn.py:733: RuntimeWarning: invalid value encountered in power
x = (1 - 34.15 * zet) ** 0.3333
/glade/u/home/dcherian/python/xcoare/xcoare/coare35vn.py:755: RuntimeWarning: invalid value encountered in power
x = (1 - 15 * zet) ** 0.25
/glade/u/home/dcherian/python/xcoare/xcoare/coare35vn.py:757: RuntimeWarning: invalid value encountered in power
x = (1 - 10.15 * zet) ** 0.3333
/glade/u/home/dcherian/python/xcoare/xcoare/coare35vn.py:516: RuntimeWarning: invalid value encountered in power
ug = np.where(Bf > 0, Beta * (Bf * zi) ** 0.333, 0.2)
/glade/u/home/dcherian/pump/pump/calc.py:1147: FutureWarning: ``output_sizes`` should be given in the ``dask_gufunc_kwargs`` parameter. It will be removed as direct parameter in a future version.
h = xr.apply_ufunc(
import hvplot.xarray
(
(-1 * kpp.hmonob).sel(time=slice("1995-12-03", "1995-12-04")).hvplot.line()
* (-1 * subset.KPPhbl).sel(time=slice("1995-12-03", "1995-12-04")).hvplot.line()
)
%matplotlib inline
subset2 = xr.merge([subset, fluxes]).squeeze()
f, ax = pump.plot.plot_dcl(
subset2.sel(time=slice("1995-12-03", "1995-12-04"), depth=slice(-100)),
kpp_terms=False,
lw=1.5,
)
ax[0, 0].set_title("(3.5°N, 110°W)")
ax[0, 0].set_ylim(None, 300)
# kpp.hmonob.plot(ax=ax[1, 0], zorder=14, color='g', marker='o')
dcpy.plots.label_subplots(ax.flat)
f.set_size_inches(dcpy.plots.pub_fig_width("jpo", "two column"), 8)
f.savefig("../images/kpp-deep-cycle-35.png")
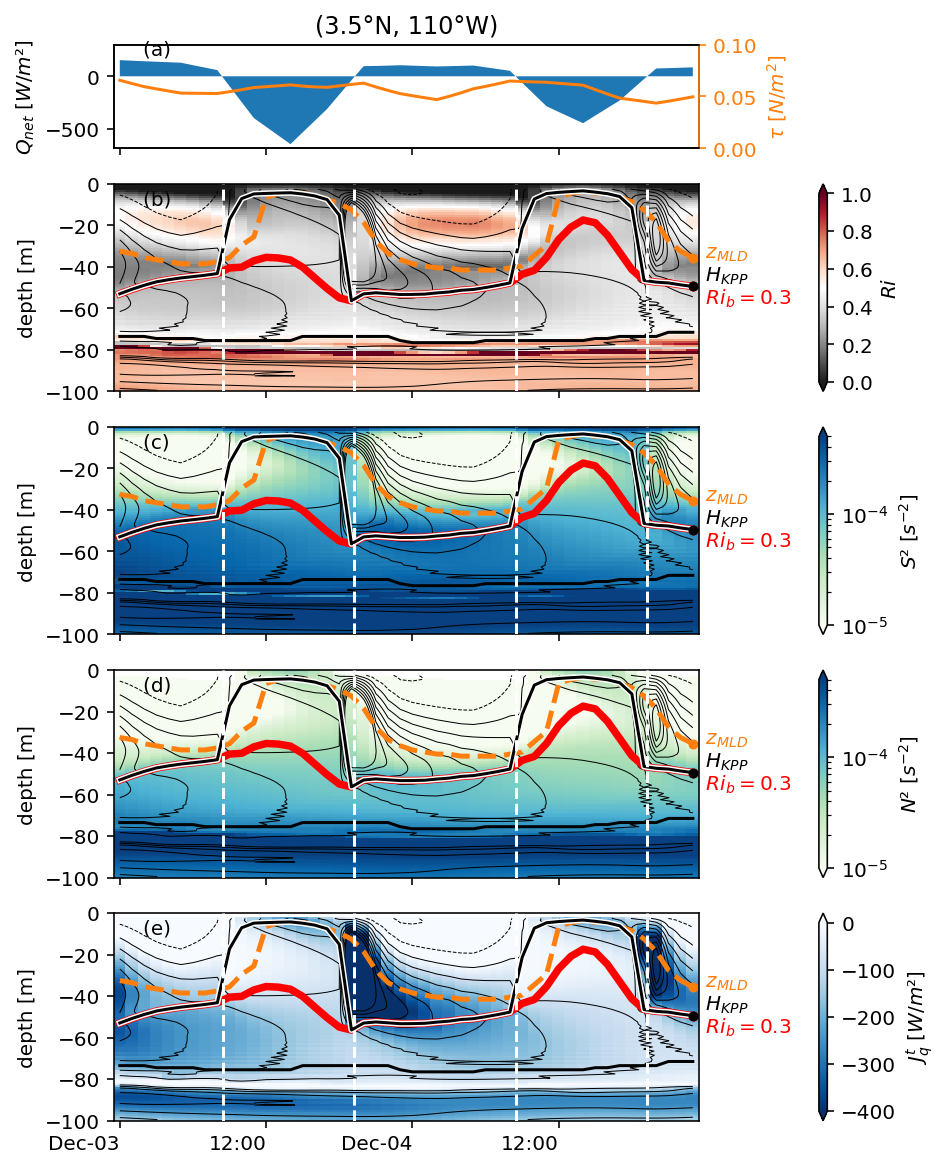
debugging#
budget = xr.open_mfdataset(
"/glade/campaign/cgd/oce/people/bachman/TPOS_MITgcm_1_hb/HOLD_NC_LINKS/Day_0[4-6]*sf.nc",
parallel=True,
)
budget["time"] = budget.time - pd.Timedelta("7h")
netflux = (
budget.oceQnet.sel(time=slice(period4.time[0].values, period4.time[-1].values))
.interp(longitude=subset.longitude, latitude=subset.latitude)
.compute()
)
xr.set_options(display_style="text")
<xarray.core.options.set_options at 0x2baf840c0ee0>
%matplotlib widget
plt.figure()
netflux.plot(x="time", marker="x")
fluxes.netflux.assign_coords(time=fluxes.time + pd.Timedelta("24h")).plot(
x="time", marker="."
)
fluxes.netflux.assign_coords(time=fluxes.time + pd.Timedelta("24h")).interp(
time=netflux.time
).plot(marker="o", ls="none")
plt.xlim("1995-11-30", "1995-12-01 00:00")
(9464.0, 9465.0)
## binary
file = "/glade/scratch/bachman/TPOS_MITgcm_1_hb/swrad.bin_1995-97"
array = np.memmap(file, dtype=np.float64, mode="r", order="C", shape=(4377, 480, 1500))
swrad = xr.DataArray(
array,
dims=["time", "latitude", "longitude"],
coords={
"time": jra.time, # pd.date_range("1995-09-01", end="1997-03-01", freq="3H") - pd.Timedelta("7h"),
"latitude": budget.latitude,
"longitude": budget.longitude,
},
)
binary = swrad.sel(time=slice(period4.time[0].values, period4.time[-1].values)).interp(
latitude=3.5, longitude=-110
)
binary = binary.copy(data=binary.data.byteswap())
# JRA SW
jra_sw = jra.rsds.sel(
time=slice(period4.time[0].values, period4.time[-1].values)
).interp(latitude=3.5, longitude=-110)
plt.figure()
# (0.9 * binary).plot()
(0.9 * jra_sw).plot()
# budget.oceQsw.sel(latitude=0, longitude=-110, method="nearest").sel(
# time=slice(period4.time[0].values, period4.time[-1].values)
# ).fillna(0).plot()
fluxes.short.assign_coords(time=fluxes.time).plot()
[<matplotlib.lines.Line2D at 0x2baf6ec0b730>]
plt.figure()
subset.KPPbo.plot(marker="x")
[<matplotlib.lines.Line2D at 0x2b43adaa4940>]
Figure 10: partition KPP heat flux#
Jq = xr.Dataset()
Jq["Total DCL"] = period4.Jq.where(period4.dcl_mask)
Jq["Within KPP BL"] = period4.Jq.where(
period4.dcl_mask & (period4.depth > -period4.KPPhbl)
)
Jq["Below KPP BL"] = period4.Jq.where(
period4.dcl_mask & (period4.depth <= -period4.KPPhbl)
)
Jq = Jq.isel(longitude=1).to_array().load()
S2 = (
1e4
* period4.S2.where(period4.dcl_mask)
.isel(longitude=1)
.mean(["time", "depth"])
.load()
)
S2.attrs["long_name"] = "Median $S²$ in low Ri layer"
S2.attrs["units"] = "$10^{-4} s^{-2}$"
N2 = (
1e4
* period4.N2.where(period4.dcl_mask)
.isel(longitude=1)
.mean(["time", "depth"])
.load()
)
# N2.attrs["long_name"] = "Median $N²$ in low Ri layer"
N2.attrs["units"] = "$10^{-4} s^{-2}$"
kpphbl = (
period4.KPPhbl.where(period4.dcl_mask.sum("depth") > 5).isel(longitude=1).compute()
)
kpphbl.attrs["long_name"] = "$H_{KPP}$"
kpphbl.attrs["units"] = "m"
zri = (
np.abs(period4.dcl_base.where(period4.dcl_mask.sum("depth") > 5))
.isel(longitude=1)
.compute()
)
zri.attrs["long_name"] = "$z_{MLD} - z_{Ri}$"
zri.attrs["units"] = "m"
mld = (
np.abs(period4.mld.where(period4.dcl_mask.sum("depth") > 5))
.isel(longitude=1)
.compute()
)
mld.attrs["long_name"] = "$z_{MLD} - z_{Ri}$"
mld.attrs["units"] = "m"
f, axx = plt.subplots(1, 3, constrained_layout=1, squeeze=False, sharey=True)
ax = axx[0, 0]
(
(
(-1 * Jq).fillna(0).integrate("time", datetime_unit="s").integrate("depth")
/ (86400 * 30 * 50)
).plot.line(
hue="variable",
y="latitude",
add_legend=False,
ax=ax,
)
)
N2.plot(ax=axx[0, 1], color="k", y="latitude")
S2.plot(ax=axx[0, 1], color="C2", y="latitude")
axx[0, 1].legend(["$N²$", "$S²$"])
axx[0, 1].set_xlabel("Mean $N²,S²$ in low Ri layer \n[$10^{-4}$ s$^{-2}$]")
(
(mld).mean("time")
# .rolling(latitude=5, center=True)
# .mean()
.plot(ax=axx[0, 2], y="latitude", color="C1")
)
(
(kpphbl).mean("time")
# .rolling(latitude=5, center=True)
# .mean()
.plot(ax=axx[0, 2], y="latitude", color="k")
)
(
(zri).mean("time")
# .rolling(latitude=5, center=True)
# .mean()
.plot(ax=axx[0, 2], y="latitude", color="C2")
)
axx[0, 2].legend(["$z_{MLD}$", "$H_{KPP}$", "$z_{Ri}$"])
# (
# zri.mean("time")
# .rolling(latitude=5, center=True)
# .mean()
# .plot(ax=axx[0, 2], y="latitude", color="k")
# )
axx[0, 2].set_xlabel("[m]")
ax.legend(Jq["variable"].values, loc="lower right")
ax.set_xlabel("Avg $J_q$ [W/m²]")
# ax.set_title("Parameterized heat flux \nin low Ri layer at 110°W")
dcpy.plots.clean_axes(axx)
dcpy.plots.label_subplots(axx.flat)
for aa in axx.flat:
aa.set_title("")
aa.xaxis.set_minor_locator(mpl.ticker.AutoMinorLocator(4))
aa.grid(True, which="both")
aa.set_ylim((-3, 5))
for aa in axx.flat[1:]:
aa.set_xlim((0, None))
axx[0, 0].set_xlim((None, 0))
f.set_size_inches((dcpy.plots.pub_fig_width("jpo", "medium 2"), 5))
f.savefig("images/kpp-deep-cycle-bl-int-heat-flux.png")
N² budget#
def avg1(ds, dim):
return (ds + ds.shift({dim: -1})) / 2
%matplotlib inline
RAC = metrics.sel(latitude=subset.latitude, longitude=subset.longitude).RAC
plt.figure()
subset = period4.isel(longitude=1, time=120).sel(latitude=0, method="nearest")
myJq = (
1035 * 3999 * (subset.KPPdiffT * subset.theta.diff("depth", label="upper"))
) + subset.nonlocal_flux.fillna(0)
(subset.Jq).plot(y="depth")
myJq.plot(y="depth", ylim=(-120, 0))
dcpy.plots.liney(-1 * subset.KPPhbl)
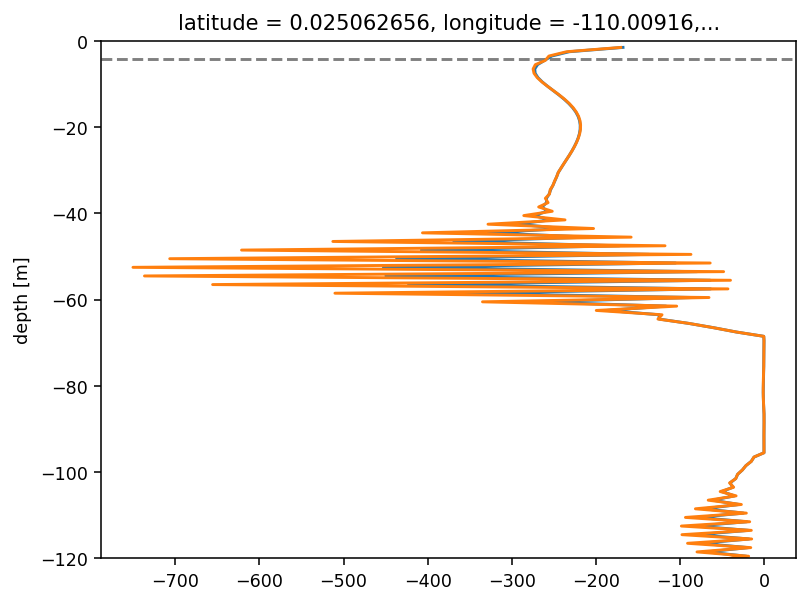
period4
<xarray.Dataset>
Dimensions: (depth: 200, latitude: 400, longitude: 3, time: 779)
Coordinates:
* depth (depth) float64 -0.5 -1.5 -2.5 -3.5 ... -197.5 -198.5 -199.5
* latitude (latitude) float32 -10.0 -9.949875 -9.89975 ... 9.949875 10.0
* longitude (longitude) float32 -110.0592 -110.00916 -109.95913
* time (time) datetime64[ns] 1995-11-14T17:00:00 ... 1995-12-17T0...
Data variables:
DFrI_TH (time, depth, latitude, longitude) float32 dask.array<chunksize=(1, 200, 400, 3), meta=np.ndarray>
ETAN (time, latitude, longitude) float32 dask.array<chunksize=(1, 400, 3), meta=np.ndarray>
Jq (time, depth, latitude, longitude) float64 dask.array<chunksize=(1, 200, 400, 3), meta=np.ndarray>
KPPRi (time, depth, latitude, longitude) float32 dask.array<chunksize=(1, 200, 400, 3), meta=np.ndarray>
KPPbo (time, latitude, longitude) float32 dask.array<chunksize=(1, 400, 3), meta=np.ndarray>
KPPdiffT (time, depth, latitude, longitude) float32 dask.array<chunksize=(1, 200, 400, 3), meta=np.ndarray>
KPPg_TH (time, depth, latitude, longitude) float32 dask.array<chunksize=(1, 200, 400, 3), meta=np.ndarray>
KPPhbl (time, latitude, longitude) float32 dask.array<chunksize=(1, 400, 3), meta=np.ndarray>
KPPviscA (time, depth, latitude, longitude) float32 dask.array<chunksize=(1, 200, 400, 3), meta=np.ndarray>
N2 (time, depth, latitude, longitude) float32 dask.array<chunksize=(1, 200, 400, 3), meta=np.ndarray>
Ri (time, depth, latitude, longitude) float32 dask.array<chunksize=(1, 200, 400, 3), meta=np.ndarray>
S2 (time, depth, latitude, longitude) float32 dask.array<chunksize=(1, 200, 400, 3), meta=np.ndarray>
Um_Diss (time, depth, latitude, longitude) float32 dask.array<chunksize=(1, 200, 400, 3), meta=np.ndarray>
VISrI_Um (time, depth, latitude, longitude) float32 dask.array<chunksize=(1, 200, 400, 3), meta=np.ndarray>
VISrI_Vm (time, depth, latitude, longitude) float32 dask.array<chunksize=(1, 200, 400, 3), meta=np.ndarray>
Vm_Diss (time, depth, latitude, longitude) float32 dask.array<chunksize=(1, 200, 400, 3), meta=np.ndarray>
dcl (time, latitude, longitude) float32 dask.array<chunksize=(1, 400, 3), meta=np.ndarray>
dcl_base (time, latitude, longitude) float32 dask.array<chunksize=(1, 400, 3), meta=np.ndarray>
dens (time, depth, latitude, longitude) float32 dask.array<chunksize=(1, 200, 400, 3), meta=np.ndarray>
eucmax (time, longitude) float64 dask.array<chunksize=(779, 3), meta=np.ndarray>
mld (time, latitude, longitude) float32 dask.array<chunksize=(1, 400, 3), meta=np.ndarray>
salt (time, depth, latitude, longitude) float32 dask.array<chunksize=(1, 200, 400, 3), meta=np.ndarray>
shear (time, depth, latitude, longitude) float32 dask.array<chunksize=(1, 200, 400, 3), meta=np.ndarray>
shred2 (time, depth, latitude, longitude) float32 dask.array<chunksize=(1, 200, 400, 3), meta=np.ndarray>
sst (time, latitude, longitude) float32 dask.array<chunksize=(1, 400, 3), meta=np.ndarray>
theta (time, depth, latitude, longitude) float32 dask.array<chunksize=(1, 200, 400, 3), meta=np.ndarray>
u (time, depth, latitude, longitude) float32 dask.array<chunksize=(1, 200, 400, 3), meta=np.ndarray>
uz (time, depth, latitude, longitude) float32 dask.array<chunksize=(1, 200, 400, 3), meta=np.ndarray>
v (time, depth, latitude, longitude) float32 dask.array<chunksize=(1, 200, 400, 3), meta=np.ndarray>
vz (time, depth, latitude, longitude) float32 dask.array<chunksize=(1, 200, 400, 3), meta=np.ndarray>
w (time, depth, latitude, longitude) float32 dask.array<chunksize=(1, 200, 400, 3), meta=np.ndarray>
Um_Impl (time, depth, latitude, longitude) float32 dask.array<chunksize=(1, 200, 400, 3), meta=np.ndarray>
Vm_Impl (time, depth, latitude, longitude) float32 dask.array<chunksize=(1, 200, 400, 3), meta=np.ndarray>
nonlocal_flux (time, depth, latitude, longitude) float64 dask.array<chunksize=(1, 200, 400, 3), meta=np.ndarray>
dcl_mask (depth, time, latitude, longitude) bool dask.array<chunksize=(200, 1, 400, 3), meta=np.ndarray>
Attributes:
easting: longitude
field_julian_date: 400296
julian_day_unit: days since 1950-01-01 00:00:00
northing: latitude
title: daily snapshot from 1/20 degree Equatorial Pacific MI...xarray.Dataset
- depth: 200
- latitude: 400
- longitude: 3
- time: 779
- depth(depth)float64-0.5 -1.5 -2.5 ... -198.5 -199.5
- units :
- m
array([ -0.5, -1.5, -2.5, -3.5, -4.5, -5.5, -6.5, -7.5, -8.5, -9.5, -10.5, -11.5, -12.5, -13.5, -14.5, -15.5, -16.5, -17.5, -18.5, -19.5, -20.5, -21.5, -22.5, -23.5, -24.5, -25.5, -26.5, -27.5, -28.5, -29.5, -30.5, -31.5, -32.5, -33.5, -34.5, -35.5, -36.5, -37.5, -38.5, -39.5, -40.5, -41.5, -42.5, -43.5, -44.5, -45.5, -46.5, -47.5, -48.5, -49.5, -50.5, -51.5, -52.5, -53.5, -54.5, -55.5, -56.5, -57.5, -58.5, -59.5, -60.5, -61.5, -62.5, -63.5, -64.5, -65.5, -66.5, -67.5, -68.5, -69.5, -70.5, -71.5, -72.5, -73.5, -74.5, -75.5, -76.5, -77.5, -78.5, -79.5, -80.5, -81.5, -82.5, -83.5, -84.5, -85.5, -86.5, -87.5, -88.5, -89.5, -90.5, -91.5, -92.5, -93.5, -94.5, -95.5, -96.5, -97.5, -98.5, -99.5, -100.5, -101.5, -102.5, -103.5, -104.5, -105.5, -106.5, -107.5, -108.5, -109.5, -110.5, -111.5, -112.5, -113.5, -114.5, -115.5, -116.5, -117.5, -118.5, -119.5, -120.5, -121.5, -122.5, -123.5, -124.5, -125.5, -126.5, -127.5, -128.5, -129.5, -130.5, -131.5, -132.5, -133.5, -134.5, -135.5, -136.5, -137.5, -138.5, -139.5, -140.5, -141.5, -142.5, -143.5, -144.5, -145.5, -146.5, -147.5, -148.5, -149.5, -150.5, -151.5, -152.5, -153.5, -154.5, -155.5, -156.5, -157.5, -158.5, -159.5, -160.5, -161.5, -162.5, -163.5, -164.5, -165.5, -166.5, -167.5, -168.5, -169.5, -170.5, -171.5, -172.5, -173.5, -174.5, -175.5, -176.5, -177.5, -178.5, -179.5, -180.5, -181.5, -182.5, -183.5, -184.5, -185.5, -186.5, -187.5, -188.5, -189.5, -190.5, -191.5, -192.5, -193.5, -194.5, -195.5, -196.5, -197.5, -198.5, -199.5]) - latitude(latitude)float32-10.0 -9.949875 ... 9.949875 10.0
- long_name :
- Latitude
- units :
- °N
array([-10. , -9.949875, -9.89975 , ..., 9.89975 , 9.949875, 10. ], dtype=float32) - longitude(longitude)float32-110.0592 -110.00916 -109.95913
array([-110.0592 , -110.00916, -109.95913], dtype=float32)
- time(time)datetime64[ns]1995-11-14T17:00:00 ... 1995-12-...
array(['1995-11-14T17:00:00.000000000', '1995-11-14T18:00:00.000000000', '1995-11-14T19:00:00.000000000', ..., '1995-12-17T01:00:00.000000000', '1995-12-17T02:00:00.000000000', '1995-12-17T03:00:00.000000000'], dtype='datetime64[ns]')
- DFrI_TH(time, depth, latitude, longitude)float32dask.array<chunksize=(1, 200, 400, 3), meta=np.ndarray>
Array Chunk Bytes 747.84 MB 960.00 kB Shape (779, 200, 400, 3) (1, 200, 400, 3) Count 779 Tasks 779 Chunks Type float32 numpy.ndarray - ETAN(time, latitude, longitude)float32dask.array<chunksize=(1, 400, 3), meta=np.ndarray>
Array Chunk Bytes 3.74 MB 4.80 kB Shape (779, 400, 3) (1, 400, 3) Count 779 Tasks 779 Chunks Type float32 numpy.ndarray - Jq(time, depth, latitude, longitude)float64dask.array<chunksize=(1, 200, 400, 3), meta=np.ndarray>
- long_name :
- $J^t_q$
- units :
- W/m²
Array Chunk Bytes 1.50 GB 1.92 MB Shape (779, 200, 400, 3) (1, 200, 400, 3) Count 779 Tasks 779 Chunks Type float64 numpy.ndarray - KPPRi(time, depth, latitude, longitude)float32dask.array<chunksize=(1, 200, 400, 3), meta=np.ndarray>
Array Chunk Bytes 747.84 MB 960.00 kB Shape (779, 200, 400, 3) (1, 200, 400, 3) Count 779 Tasks 779 Chunks Type float32 numpy.ndarray - KPPbo(time, latitude, longitude)float32dask.array<chunksize=(1, 400, 3), meta=np.ndarray>
Array Chunk Bytes 3.74 MB 4.80 kB Shape (779, 400, 3) (1, 400, 3) Count 779 Tasks 779 Chunks Type float32 numpy.ndarray - KPPdiffT(time, depth, latitude, longitude)float32dask.array<chunksize=(1, 200, 400, 3), meta=np.ndarray>
Array Chunk Bytes 747.84 MB 960.00 kB Shape (779, 200, 400, 3) (1, 200, 400, 3) Count 779 Tasks 779 Chunks Type float32 numpy.ndarray - KPPg_TH(time, depth, latitude, longitude)float32dask.array<chunksize=(1, 200, 400, 3), meta=np.ndarray>
Array Chunk Bytes 747.84 MB 960.00 kB Shape (779, 200, 400, 3) (1, 200, 400, 3) Count 779 Tasks 779 Chunks Type float32 numpy.ndarray - KPPhbl(time, latitude, longitude)float32dask.array<chunksize=(1, 400, 3), meta=np.ndarray>
Array Chunk Bytes 3.74 MB 4.80 kB Shape (779, 400, 3) (1, 400, 3) Count 779 Tasks 779 Chunks Type float32 numpy.ndarray - KPPviscA(time, depth, latitude, longitude)float32dask.array<chunksize=(1, 200, 400, 3), meta=np.ndarray>
Array Chunk Bytes 747.84 MB 960.00 kB Shape (779, 200, 400, 3) (1, 200, 400, 3) Count 779 Tasks 779 Chunks Type float32 numpy.ndarray - N2(time, depth, latitude, longitude)float32dask.array<chunksize=(1, 200, 400, 3), meta=np.ndarray>
- long_name :
- $N²$
- units :
- $s^{-2}$
Array Chunk Bytes 747.84 MB 960.00 kB Shape (779, 200, 400, 3) (1, 200, 400, 3) Count 779 Tasks 779 Chunks Type float32 numpy.ndarray - Ri(time, depth, latitude, longitude)float32dask.array<chunksize=(1, 200, 400, 3), meta=np.ndarray>
- long_name :
- $Ri$
- units :
Array Chunk Bytes 747.84 MB 960.00 kB Shape (779, 200, 400, 3) (1, 200, 400, 3) Count 779 Tasks 779 Chunks Type float32 numpy.ndarray - S2(time, depth, latitude, longitude)float32dask.array<chunksize=(1, 200, 400, 3), meta=np.ndarray>
- long_name :
- $S²$
- units :
- $s^{-2}$
Array Chunk Bytes 747.84 MB 960.00 kB Shape (779, 200, 400, 3) (1, 200, 400, 3) Count 779 Tasks 779 Chunks Type float32 numpy.ndarray - Um_Diss(time, depth, latitude, longitude)float32dask.array<chunksize=(1, 200, 400, 3), meta=np.ndarray>
Array Chunk Bytes 747.84 MB 960.00 kB Shape (779, 200, 400, 3) (1, 200, 400, 3) Count 779 Tasks 779 Chunks Type float32 numpy.ndarray - VISrI_Um(time, depth, latitude, longitude)float32dask.array<chunksize=(1, 200, 400, 3), meta=np.ndarray>
Array Chunk Bytes 747.84 MB 960.00 kB Shape (779, 200, 400, 3) (1, 200, 400, 3) Count 779 Tasks 779 Chunks Type float32 numpy.ndarray - VISrI_Vm(time, depth, latitude, longitude)float32dask.array<chunksize=(1, 200, 400, 3), meta=np.ndarray>
Array Chunk Bytes 747.84 MB 960.00 kB Shape (779, 200, 400, 3) (1, 200, 400, 3) Count 779 Tasks 779 Chunks Type float32 numpy.ndarray - Vm_Diss(time, depth, latitude, longitude)float32dask.array<chunksize=(1, 200, 400, 3), meta=np.ndarray>
Array Chunk Bytes 747.84 MB 960.00 kB Shape (779, 200, 400, 3) (1, 200, 400, 3) Count 779 Tasks 779 Chunks Type float32 numpy.ndarray - dcl(time, latitude, longitude)float32dask.array<chunksize=(1, 400, 3), meta=np.ndarray>
Array Chunk Bytes 3.74 MB 4.80 kB Shape (779, 400, 3) (1, 400, 3) Count 779 Tasks 779 Chunks Type float32 numpy.ndarray - dcl_base(time, latitude, longitude)float32dask.array<chunksize=(1, 400, 3), meta=np.ndarray>
- description :
- Deepest depth above EUC where Ri=0.54
- long_name :
- DCL Base (Ri)
- units :
- m
Array Chunk Bytes 3.74 MB 4.80 kB Shape (779, 400, 3) (1, 400, 3) Count 779 Tasks 779 Chunks Type float32 numpy.ndarray - dens(time, depth, latitude, longitude)float32dask.array<chunksize=(1, 200, 400, 3), meta=np.ndarray>
Array Chunk Bytes 747.84 MB 960.00 kB Shape (779, 200, 400, 3) (1, 200, 400, 3) Count 779 Tasks 779 Chunks Type float32 numpy.ndarray - eucmax(time, longitude)float64dask.array<chunksize=(779, 3), meta=np.ndarray>
- long_name :
- Depth of EUC max
- units :
- m
Array Chunk Bytes 18.70 kB 18.70 kB Shape (779, 3) (779, 3) Count 1 Tasks 1 Chunks Type float64 numpy.ndarray - mld(time, latitude, longitude)float32dask.array<chunksize=(1, 400, 3), meta=np.ndarray>
- description :
- Interpolate density to 1m grid. Search for max depth where |drho| > 0.01 and N2 > 1e-5
- long_name :
- MLD
- units :
- m
Array Chunk Bytes 3.74 MB 4.80 kB Shape (779, 400, 3) (1, 400, 3) Count 779 Tasks 779 Chunks Type float32 numpy.ndarray - salt(time, depth, latitude, longitude)float32dask.array<chunksize=(1, 200, 400, 3), meta=np.ndarray>
Array Chunk Bytes 747.84 MB 960.00 kB Shape (779, 200, 400, 3) (1, 200, 400, 3) Count 779 Tasks 779 Chunks Type float32 numpy.ndarray - shear(time, depth, latitude, longitude)float32dask.array<chunksize=(1, 200, 400, 3), meta=np.ndarray>
- long_name :
- |$u_z$|
- units :
- s$^{-1}$
Array Chunk Bytes 747.84 MB 960.00 kB Shape (779, 200, 400, 3) (1, 200, 400, 3) Count 779 Tasks 779 Chunks Type float32 numpy.ndarray - shred2(time, depth, latitude, longitude)float32dask.array<chunksize=(1, 200, 400, 3), meta=np.ndarray>
- long_name :
- Reduced shear$^2$
- units :
- $s^{-2}$
Array Chunk Bytes 747.84 MB 960.00 kB Shape (779, 200, 400, 3) (1, 200, 400, 3) Count 779 Tasks 779 Chunks Type float32 numpy.ndarray - sst(time, latitude, longitude)float32dask.array<chunksize=(1, 400, 3), meta=np.ndarray>
Array Chunk Bytes 3.74 MB 4.80 kB Shape (779, 400, 3) (1, 400, 3) Count 779 Tasks 779 Chunks Type float32 numpy.ndarray - theta(time, depth, latitude, longitude)float32dask.array<chunksize=(1, 200, 400, 3), meta=np.ndarray>
Array Chunk Bytes 747.84 MB 960.00 kB Shape (779, 200, 400, 3) (1, 200, 400, 3) Count 779 Tasks 779 Chunks Type float32 numpy.ndarray - u(time, depth, latitude, longitude)float32dask.array<chunksize=(1, 200, 400, 3), meta=np.ndarray>
Array Chunk Bytes 747.84 MB 960.00 kB Shape (779, 200, 400, 3) (1, 200, 400, 3) Count 779 Tasks 779 Chunks Type float32 numpy.ndarray - uz(time, depth, latitude, longitude)float32dask.array<chunksize=(1, 200, 400, 3), meta=np.ndarray>
Array Chunk Bytes 747.84 MB 960.00 kB Shape (779, 200, 400, 3) (1, 200, 400, 3) Count 779 Tasks 779 Chunks Type float32 numpy.ndarray - v(time, depth, latitude, longitude)float32dask.array<chunksize=(1, 200, 400, 3), meta=np.ndarray>
Array Chunk Bytes 747.84 MB 960.00 kB Shape (779, 200, 400, 3) (1, 200, 400, 3) Count 779 Tasks 779 Chunks Type float32 numpy.ndarray - vz(time, depth, latitude, longitude)float32dask.array<chunksize=(1, 200, 400, 3), meta=np.ndarray>
Array Chunk Bytes 747.84 MB 960.00 kB Shape (779, 200, 400, 3) (1, 200, 400, 3) Count 779 Tasks 779 Chunks Type float32 numpy.ndarray - w(time, depth, latitude, longitude)float32dask.array<chunksize=(1, 200, 400, 3), meta=np.ndarray>
Array Chunk Bytes 747.84 MB 960.00 kB Shape (779, 200, 400, 3) (1, 200, 400, 3) Count 779 Tasks 779 Chunks Type float32 numpy.ndarray - Um_Impl(time, depth, latitude, longitude)float32dask.array<chunksize=(1, 200, 400, 3), meta=np.ndarray>
Array Chunk Bytes 747.84 MB 960.00 kB Shape (779, 200, 400, 3) (1, 200, 400, 3) Count 779 Tasks 779 Chunks Type float32 numpy.ndarray - Vm_Impl(time, depth, latitude, longitude)float32dask.array<chunksize=(1, 200, 400, 3), meta=np.ndarray>
Array Chunk Bytes 747.84 MB 960.00 kB Shape (779, 200, 400, 3) (1, 200, 400, 3) Count 779 Tasks 779 Chunks Type float32 numpy.ndarray - nonlocal_flux(time, depth, latitude, longitude)float64dask.array<chunksize=(1, 200, 400, 3), meta=np.ndarray>
Array Chunk Bytes 1.50 GB 1.92 MB Shape (779, 200, 400, 3) (1, 200, 400, 3) Count 779 Tasks 779 Chunks Type float64 numpy.ndarray - dcl_mask(depth, time, latitude, longitude)booldask.array<chunksize=(200, 1, 400, 3), meta=np.ndarray>
- units :
- m
Array Chunk Bytes 186.96 MB 240.00 kB Shape (200, 779, 400, 3) (200, 1, 400, 3) Count 779 Tasks 779 Chunks Type bool numpy.ndarray
- easting :
- longitude
- field_julian_date :
- 400296
- julian_day_unit :
- days since 1950-01-01 00:00:00
- northing :
- latitude
- title :
- daily snapshot from 1/20 degree Equatorial Pacific MITgcm simulation
ds = period4
ds["b"] = -9.81 / 1035 * period4.dens
from pump.calc import ddx, ddy, ddz
dN2dt = xr.Dataset()
dN2dt["xadv"] = -ds.u * ddx(ds.N2)
dN2dt["yadv"] = -ds.v * ddy(ds.N2)
dN2dt["zadv"] = -ds.w * ddz(ds.N2)
dN2dt["uzbx"] = -ds.uz * ddx(ds.b)
dN2dt["vzby"] = -ds.vz * ddy(ds.b)
dN2dt["wzbz"] = -ddz(ds.w) * ddz(ds.b)
dN2dt["mix"] = -ddz(9.81 * 2e-4 * ddz(ds.Jq / 1035 / 3995))
dN2dt["adv"] = dN2dt.xadv + dN2dt.yadv + dN2dt.zadv
dN2dt["tilt"] = dN2dt.uzbx + dN2dt.vzby + dN2dt.wzbz
dN2dt["lag"] = dN2dt.tilt + dN2dt.mix
mask = period4.dcl_mask.where(period4.dcl > 30, False)
dN2dt = dN2dt.persist()
f, axx = plt.subplots(
4, 1, sharex=True, sharey=True, squeeze=False, constrained_layout=True
)
ax = dict(zip(["N2", "lag", "tilt", "mix"], axx.flat))
hN2 = (
period4.N2.where(mask)
.isel(longitude=1)
.mean("depth")
.plot(
x="time",
vmin=1e-5,
vmax=2e-4,
cmap=mpl.cm.GnBu,
levels=np.arange(0, 2.1e-4, 5e-5),
ylim=(-3, 5),
ax=ax["N2"],
add_colorbar=False,
)
)
for key in list(ax.keys())[1:]:
hdN2 = (
-1 * dN2dt[key].where(mask).isel(longitude=1).fillna(0).integrate("depth")
).plot(
ax=ax[key],
vmax=3e-8,
x="time",
ylim=(-3.5, 5),
add_colorbar=False,
)
ax[key].set_title("")
cbN2 = f.colorbar(
hN2, ax=ax["N2"], orientation="horizontal", aspect=50, label="$N²$ [s$^{-2}$]"
)
fmt = mpl.ticker.ScalarFormatter()
fmt.set_powerlimits((-1, 1))
cbN2.ax.xaxis.set_major_formatter(fmt)
cbdN2 = f.colorbar(
hdN2,
ax=axx.flat[1:],
orientation="horizontal",
aspect=50,
label="$∂N²/∂t$ [s$^{-3}$]",
extend="both",
)
axx[0, 0].set_title("")
[
period4.dcl.isel(longitude=1)
.resample(time="D")
.mean()
.plot.contour(levels=[30], ax=aa, x="time", colors="w")
for aa in axx.flat
]
[
period4.dcl.isel(longitude=1)
.resample(time="D")
.mean()
.plot.contour(levels=[30], ax=aa, x="time", colors="k", linewidths=1)
for aa in axx.flat
]
dcpy.plots.label_subplots(
axx.flat,
labels=["$N²$", "TILT + STRETCH + MIX", "TILT + STRETCH", "MIX"],
y=0.05,
fontsize="small",
)
dcpy.plots.clean_axes(axx)
dcpy.plots.concise_date_formatter(axx.flat[-1], show_offset=False)
axx[0, 0].set_title("")
f.set_size_inches((dcpy.plots.pub_fig_width("jpo", "single column"), 8))
f.savefig("../images/period4-N2.png", dpi=150)
/glade/u/home/dcherian/miniconda3/envs/dcpy/lib/python3.8/site-packages/xarray/plot/plot.py:970: MatplotlibDeprecationWarning: Passing parameters norm and vmin/vmax simultaneously is deprecated since 3.3 and will become an error two minor releases later. Please pass vmin/vmax directly to the norm when creating it.
primitive = ax.pcolormesh(x, y, z, **kwargs)
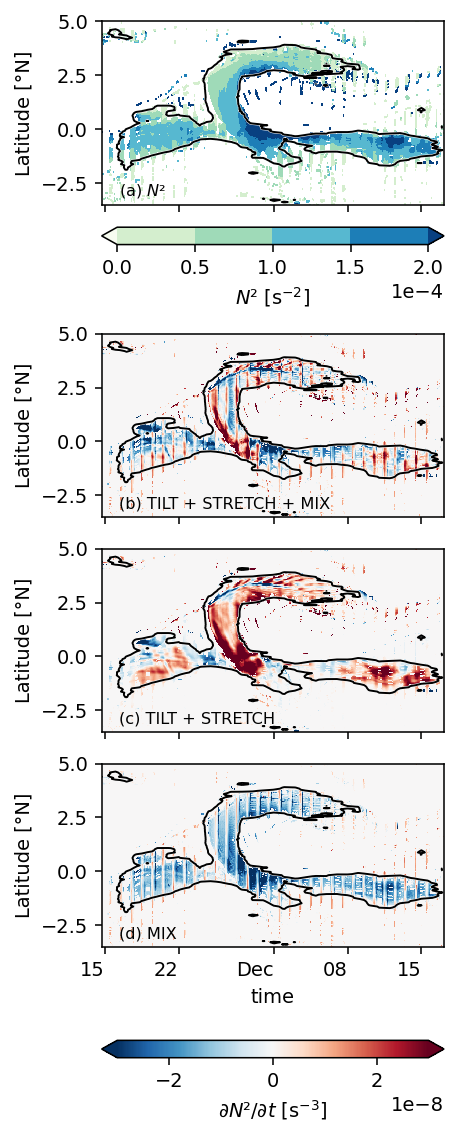
(
dN2dt[["lag", "tilt", "mix"]]
.where(mask)
.isel(longitude=1)
# .sel(depth=slice(-20, -50))
.sum("depth")
.to_array()
# .resample(time="D")
# .sum()
.plot(vmax=3e-8, x="time", col="variable", ylim=(-3.5, 5))
)
<xarray.plot.facetgrid.FacetGrid at 0x2b7e0d350d90>
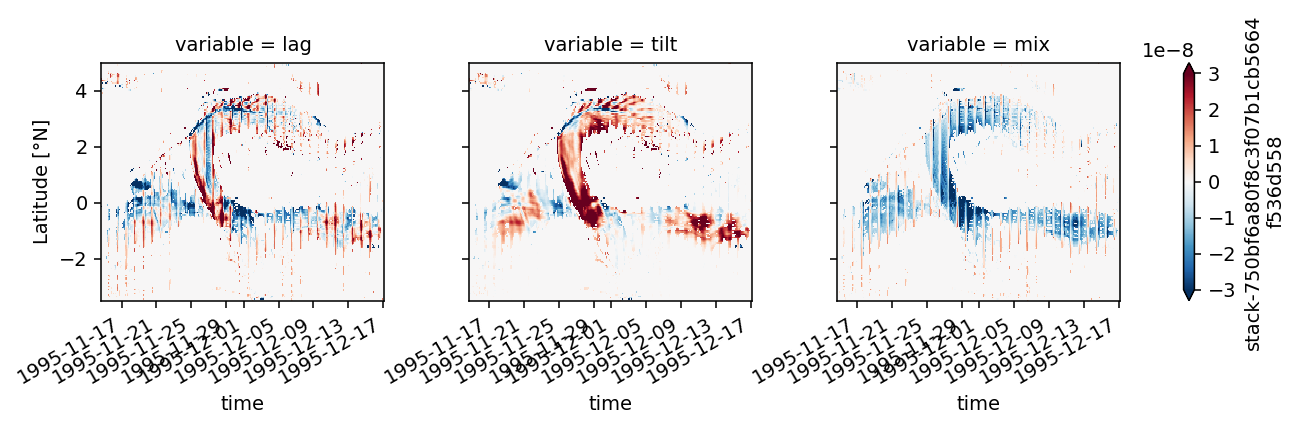
(
dN2dt.where(period4.dcl_mask)
.isel(longitude=1)
.sum("depth")[["uzbx", "vzby", "wzbz", "fric"]]
.to_array()
# .resample(time="D")
# .mean()
.plot(col="variable", col_wrap=2, robust=True, x="time")
)
<xarray.plot.facetgrid.FacetGrid at 0x2ae026275100>
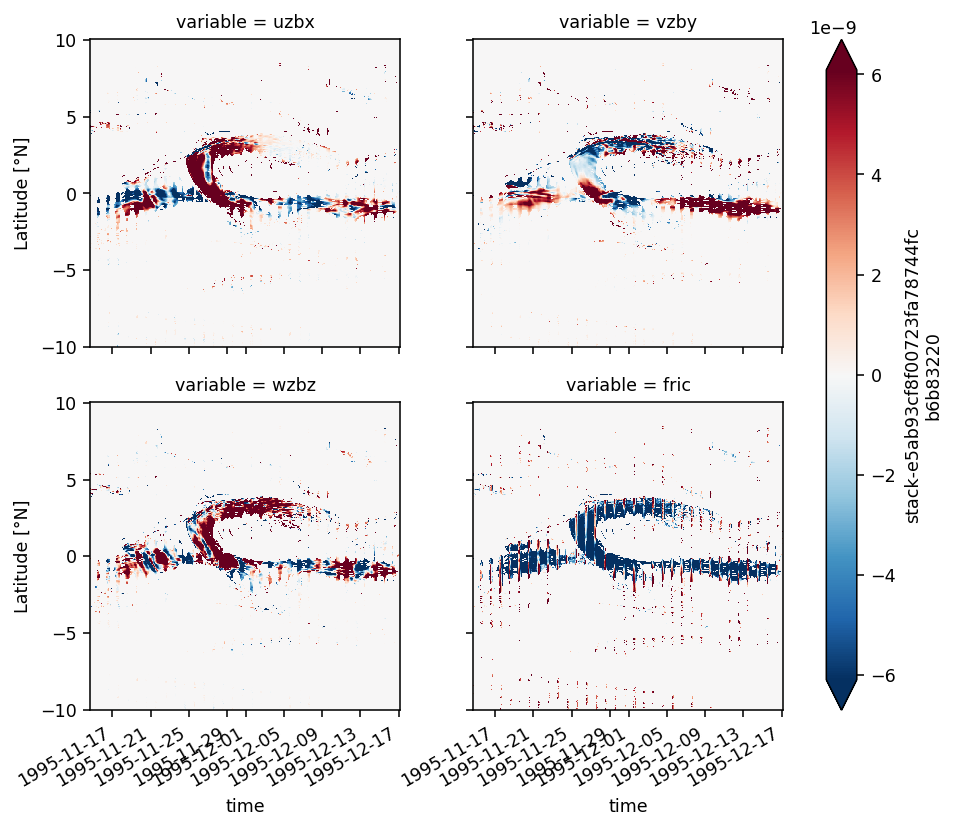
f, ax = plt.subplots(1, 3, sharex=True, sharey=True, constrained_layout=True)
kwargs = dict(
x="time", robust=True, cbar_kwargs={"orientation": "horizontal"}, ylim=(-3, 5)
)
period4.N2.where(period4.dcl_mask).isel(longitude=1).median("depth").plot(
**kwargs, ax=ax[0], **pump.plot.cmaps["N2"]
)
(
dN2dt.lag.where(period4.dcl_mask)
.isel(longitude=1)
.mean("depth")
# .resample(time="D")
# .mean()
.plot(**kwargs, ax=ax[1])
)
(
dN2dt.fric.where(period4.dcl_mask)
.isel(longitude=1)
.mean("depth")
# .resample(time="D")
# .mean()
.plot(**kwargs, ax=ax[2])
)
dcpy.plots.clean_axes(ax)
for aa in ax.flat:
aa.set_title("")
aa.set_xlabel("")
dcpy.plots.label_subplots(
ax.flat, labels=["$N^2$ [s$^{-2}$]", "Lagrangian terms", "Mixing"]
)
/glade/u/home/dcherian/miniconda3/envs/dcpy/lib/python3.8/site-packages/xarray/plot/plot.py:970: MatplotlibDeprecationWarning: Passing parameters norm and vmin/vmax simultaneously is deprecated since 3.3 and will become an error two minor releases later. Please pass vmin/vmax directly to the norm when creating it.
primitive = ax.pcolormesh(x, y, z, **kwargs)
[Text(0.05, 0.9, '(a) $N^2$ [s$^{-2}$]'),
Text(0.05, 0.9, '(b) Lagrangian terms'),
Text(0.05, 0.9, '(c) Mixing')]
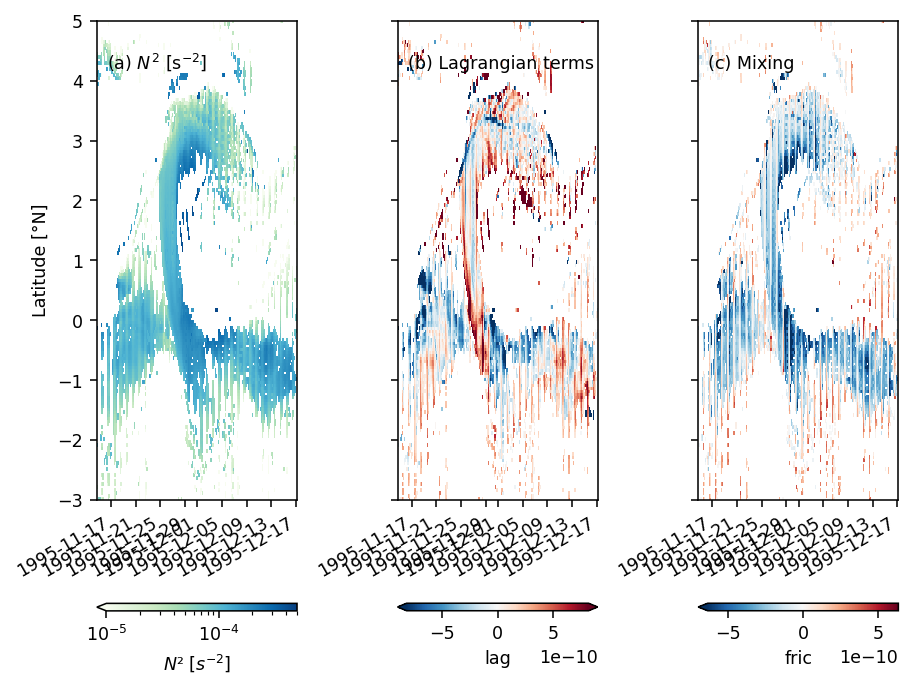
(
period4.N2.isel(longitude=1)
.sel(time="1995-12-05 12:00")
.plot(y="depth", robust=True, vmax=1e-4, cmap=mpl.cm.Greens)
)
<matplotlib.collections.QuadMesh at 0x2ac09b2fde10>
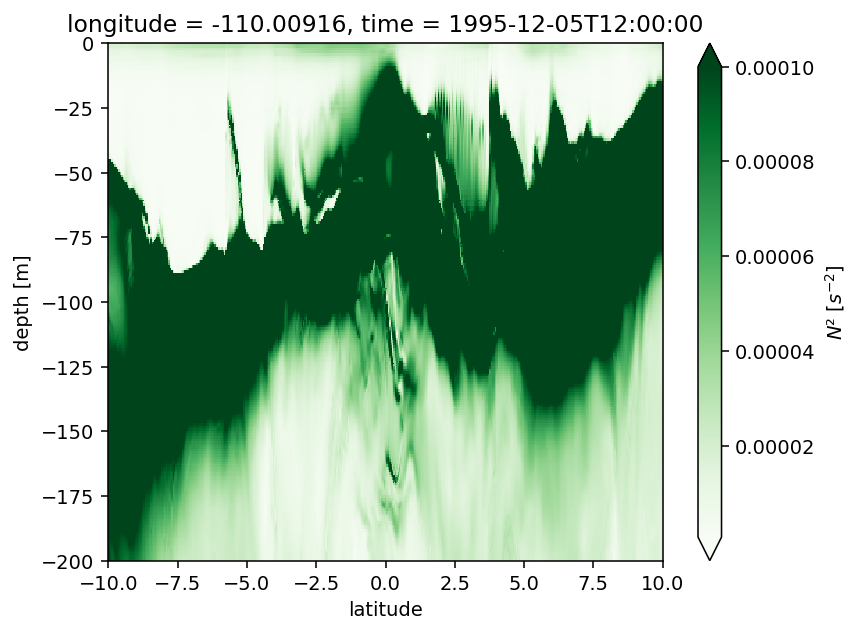
f, ax = plt.subplots(1, 2, sharex=True, sharey=True, constrained_layout=True)
period4.isel(longitude=1).mld.resample(time="D").min().plot.contourf(
x="time",
robust=True,
levels=[0, -10, -20, -30, -40, -50],
cmap=mpl.cm.Blues_r,
ax=ax[0],
cbar_kwargs={"orientation": "horizontal"},
)
(
period4.dcl.isel(longitude=1)
.resample(time="D")
.mean()
.plot.contour(
x="time",
levels=[30, 60],
add_labels=False,
colors="k",
ax=ax[0],
)
)
period4.isel(longitude=1).dcl_base.resample(time="D").min().plot.contourf(
x="time",
robust=True,
levels=[0, -40, -50, -60, -70, -80, -90],
cmap=mpl.cm.Greens_r,
ax=ax[1],
cbar_kwargs={"orientation": "horizontal"},
)
(
period4.dcl.isel(longitude=1)
.resample(time="D")
.mean()
.plot.contour(
x="time",
levels=[30, 60],
add_labels=False,
colors="k",
ax=ax[1],
)
)
ax[1].set_ylim((-3, 5))
(-3.0, 5.0)
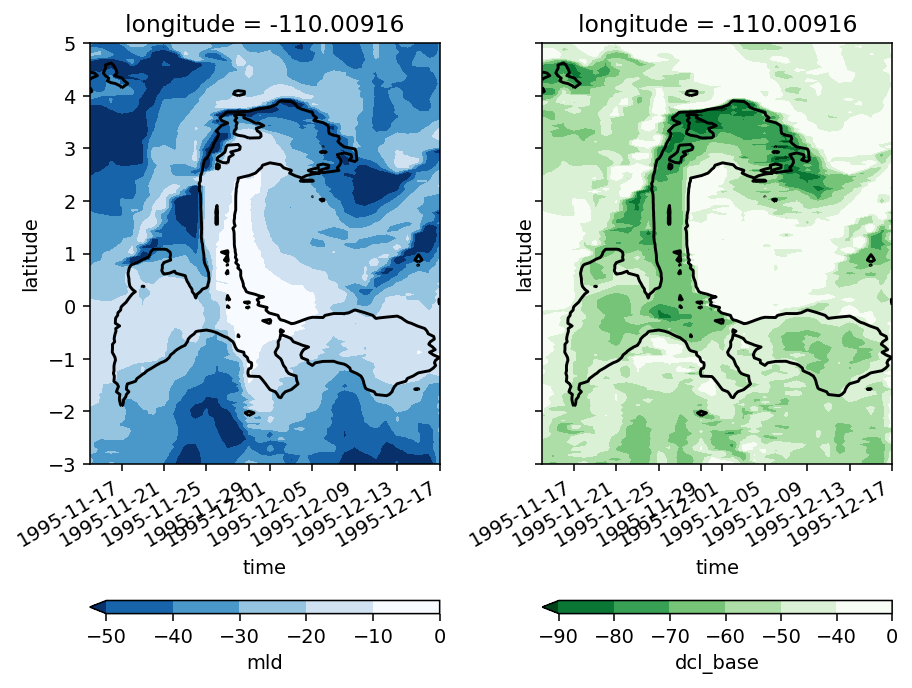
(
period4.N2.isel(longitude=1)
.sel(depth=slice(-40, -60), latitude=slice(-2, 6.5))
.mean("depth")
).plot(robust=True, x="time", levels=np.arange(5e-5, 2e-4, 2.5e-5), cmap=mpl.cm.Greens)
(
period4.dcl.isel(longitude=1)
.resample(time="D")
.mean()
.plot.contour(
x="time",
levels=[30, 60],
add_labels=False,
colors="k",
)
)
<matplotlib.contour.QuadContourSet at 0x2ac079403d50>
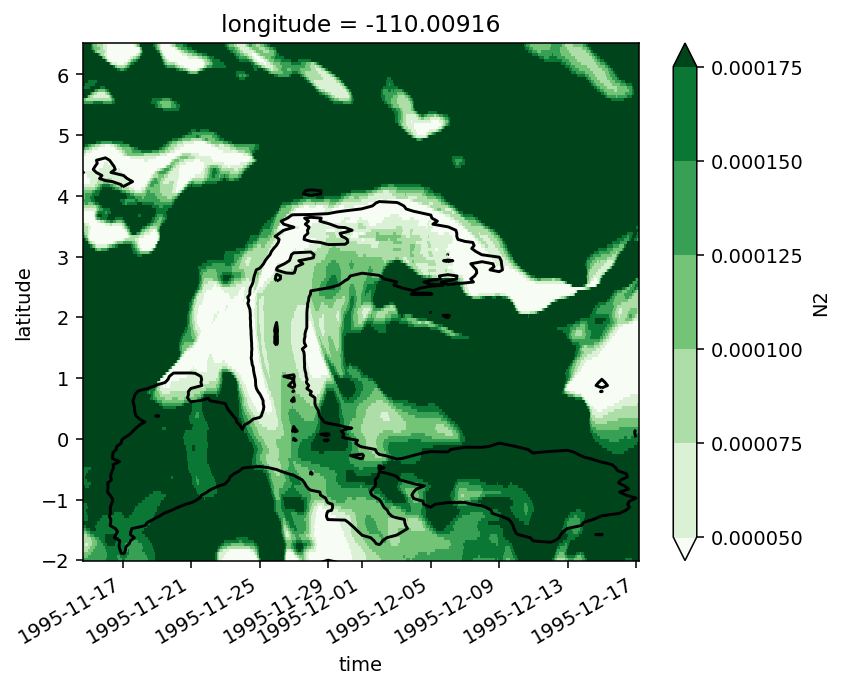
DCL mask is reasonable
(
period4.Jq.where(period4.dcl_mask)
.isel(longitude=1)
.mean("depth")
.resample(time="D")
.mean()
.plot(x="time", robust=True)
)
<matplotlib.collections.QuadMesh at 0x2ac07d828110>
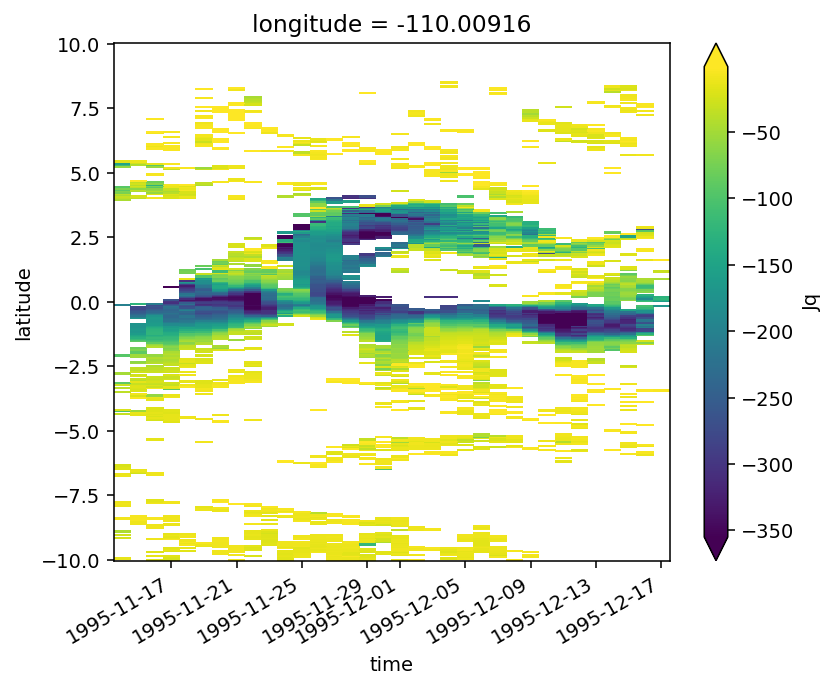
def subber(ds):
return (
ds.sel(time="1995-12-05")
.isel(time=23, longitude=1)
.sel(latitude=slice(-3, 7), depth=slice(-120))
)
subber(dN2dt).fric.rolling(depth=2).mean().plot(
y="depth", robust=True, cmap=mpl.cm.BrBG_r
)
# (-subber(period4).Jq.rolling(depth=2).mean().compute().pipe(ddz)).plot.contour(
# y="depth", robust=True, levels=12, colors="k", linewidths=0.25
# )
subber(period4).mld.plot(color="orange")
subber(period4).dcl_base.plot(color="k")
dcpy.plots.liney((-40, -60), zorder=10)
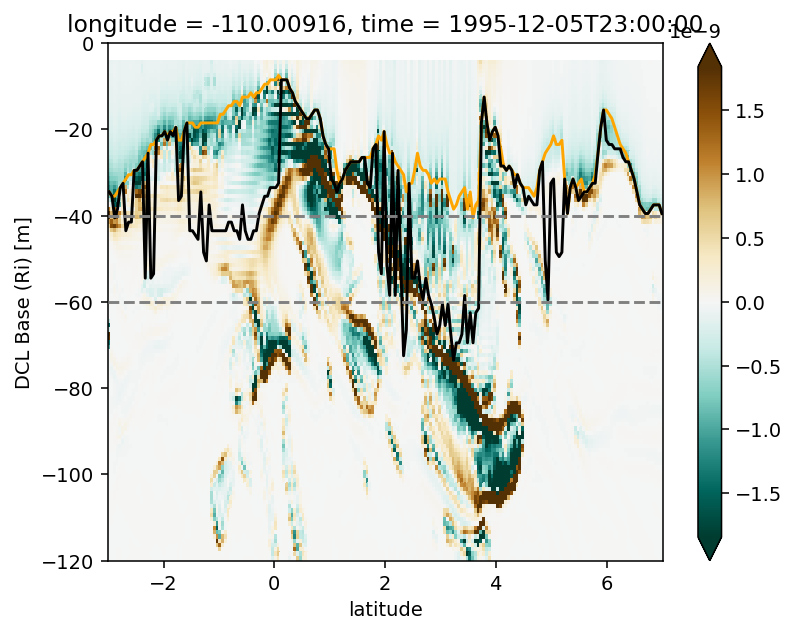
dN2dt.lag.where(period4.dcl_mask).isel(longitude=1).mean("depth").plot(
x="time", robust=True
)
<matplotlib.collections.QuadMesh at 0x2ae07db30610>
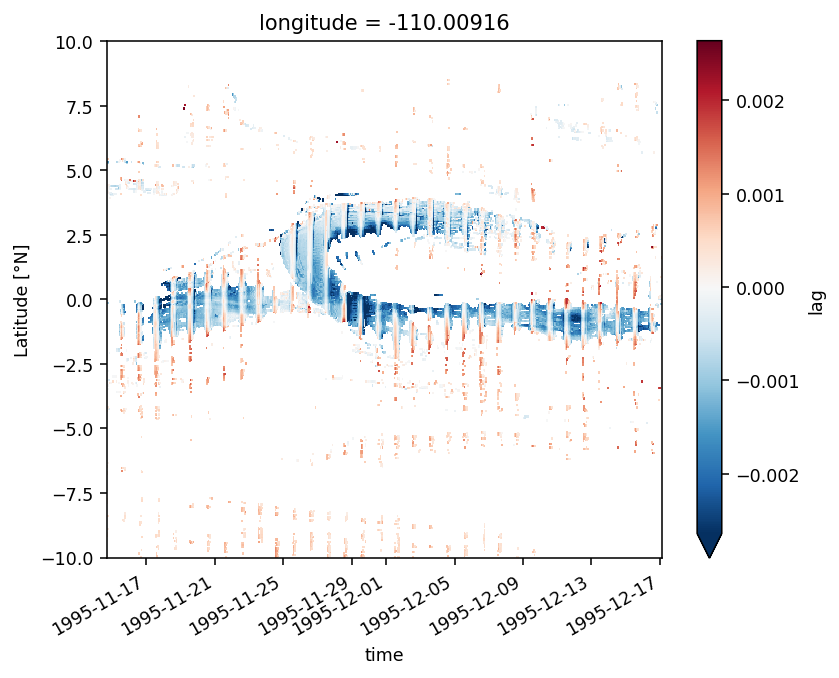
%matplotlib inline
ddt = (
dN2dt.where(period4.dcl_mask)
.isel(longitude=1)
.sel(latitude=slice(-2, 6.5))
.mean("depth")
.resample(time="D")
.mean()
.to_array()
).compute()
fg = ddt.plot(
col="variable",
x="time",
robust=True,
col_wrap=3,
vmax=4e-10,
cbar_kwargs={"orientation": "horizontal", "label": "∂N²/∂t"},
)
fg.map(
lambda: period4.dcl.isel(longitude=1)
.resample(time="D")
.mean()
.plot.contour(x="time", levels=[30, 60], add_labels=False, colors="k")
)
fg.fig.suptitle("Daily avg(N² budget terms averaged over DCL)", y=1.01)
fg.fig.savefig("images/N2-budget-period4.png")
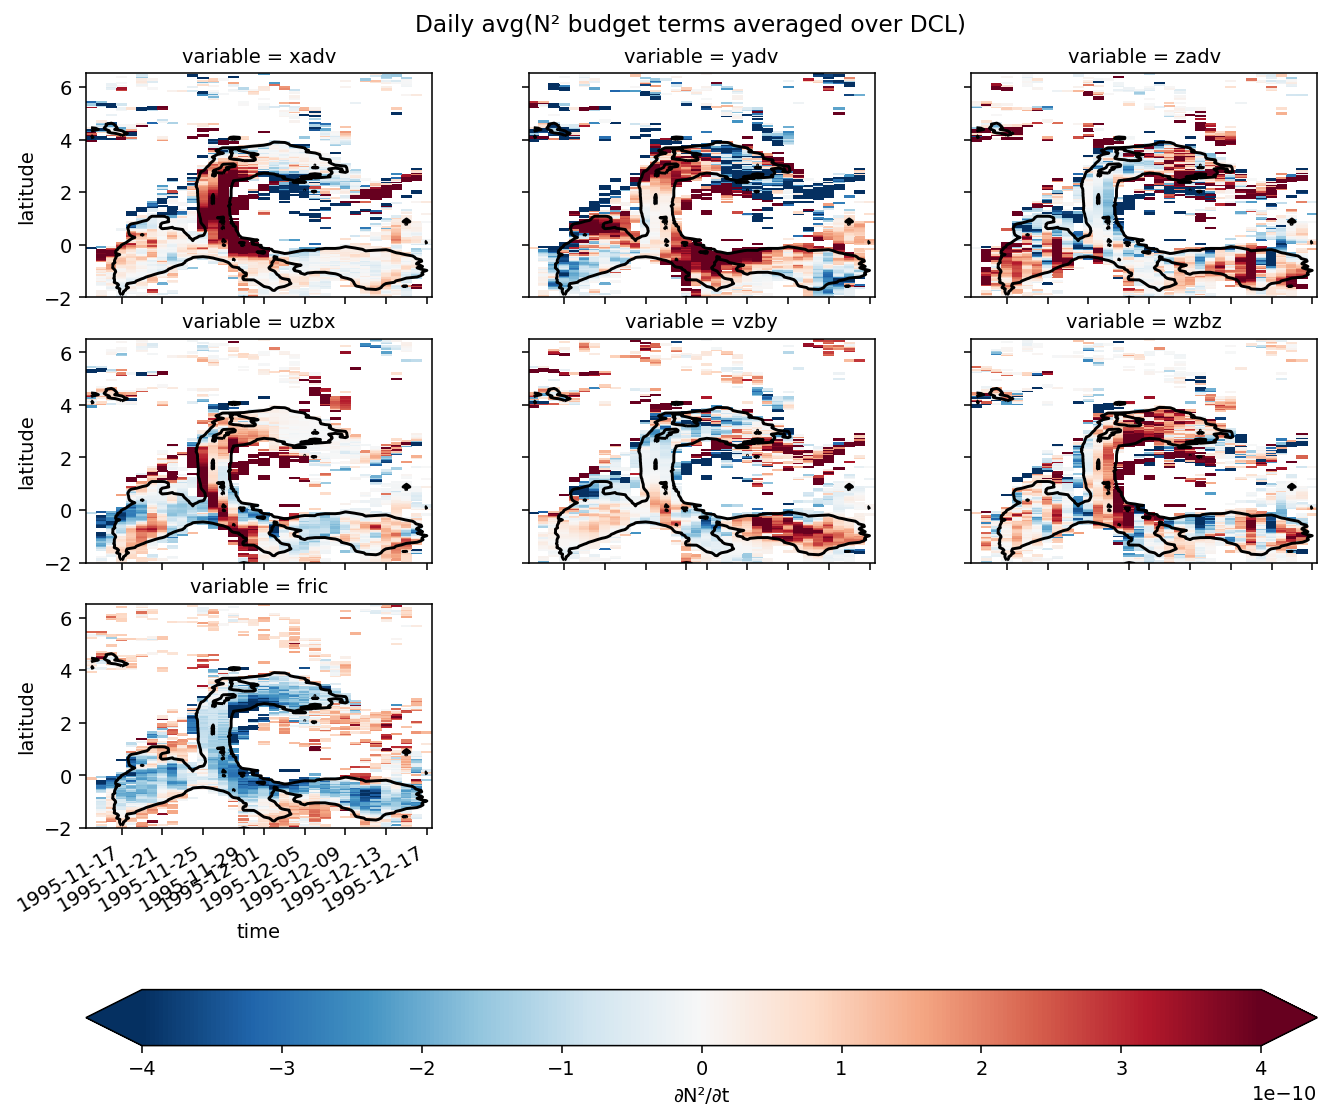
building intuition for effect of mixing on N²#
def subber(ds):
return (
ds.sel(time="1995-12-05")
.isel(time=23, longitude=1)
.sel(latitude=slice(-3, 7), depth=slice(-120))
)
(
subber(period4.Jq)
.rolling(depth=12, center=True)
.mean()
.compute()
.diff("depth")
.rolling(depth=12, center=True)
.mean()
.diff("depth")
.rolling(depth=12, center=True)
.mean()
.sel(latitude=0, method="nearest")
.plot()
)
[<matplotlib.lines.Line2D at 0x2ac0ac4eac90>]
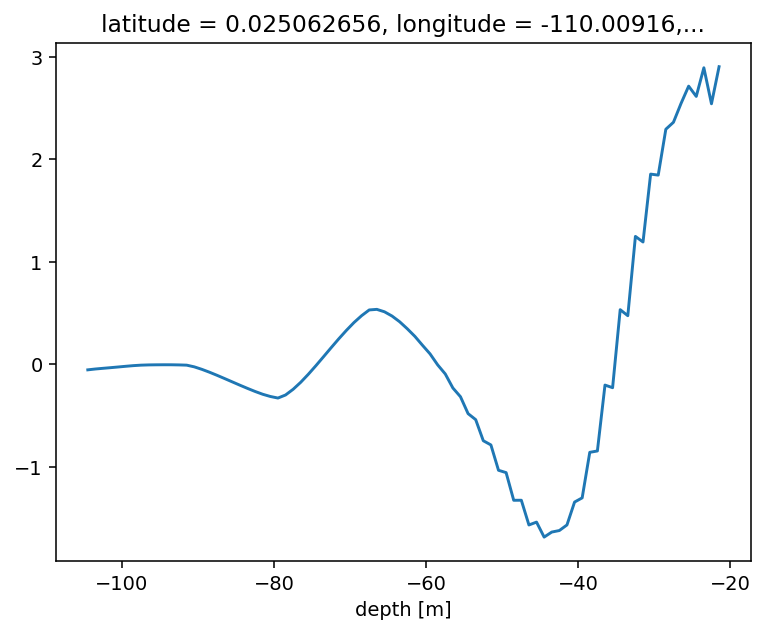
z = ds.depth[:60]
J = np.sin(-2 * np.pi * z / 50)
J.plot(y="depth")
(-J.differentiate("depth") * 10).plot(y="depth")
(-J.differentiate("depth").differentiate("depth") * 100).plot(y="depth")
[<matplotlib.lines.Line2D at 0x2af3782eeb90>]
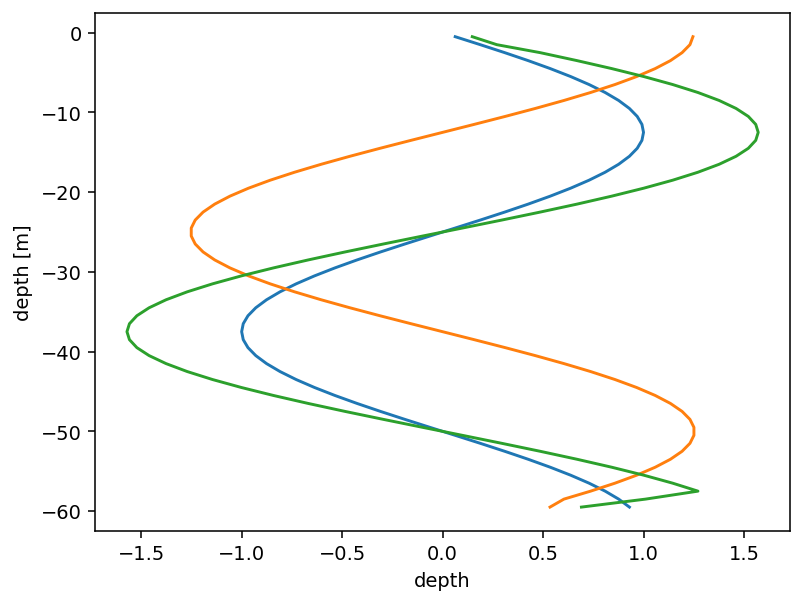
Supplementary Figures#
shear advection terms#
f, ax = pump.plot.plot_shear_terms(
period4,
duzdt[["xadv", "yadv"]].resample(time="D").mean(),
dvzdt[["xadv", "yadv"]].resample(time="D").mean(),
mask_dcl=False,
)
[
dcpy.plots.linex(snapshot_times, zorder=3, ax=aa, lw=1, ls="--", color="k")
for aa in unpack(ax)
]
f.savefig("images/shear-evolution-advective.png")
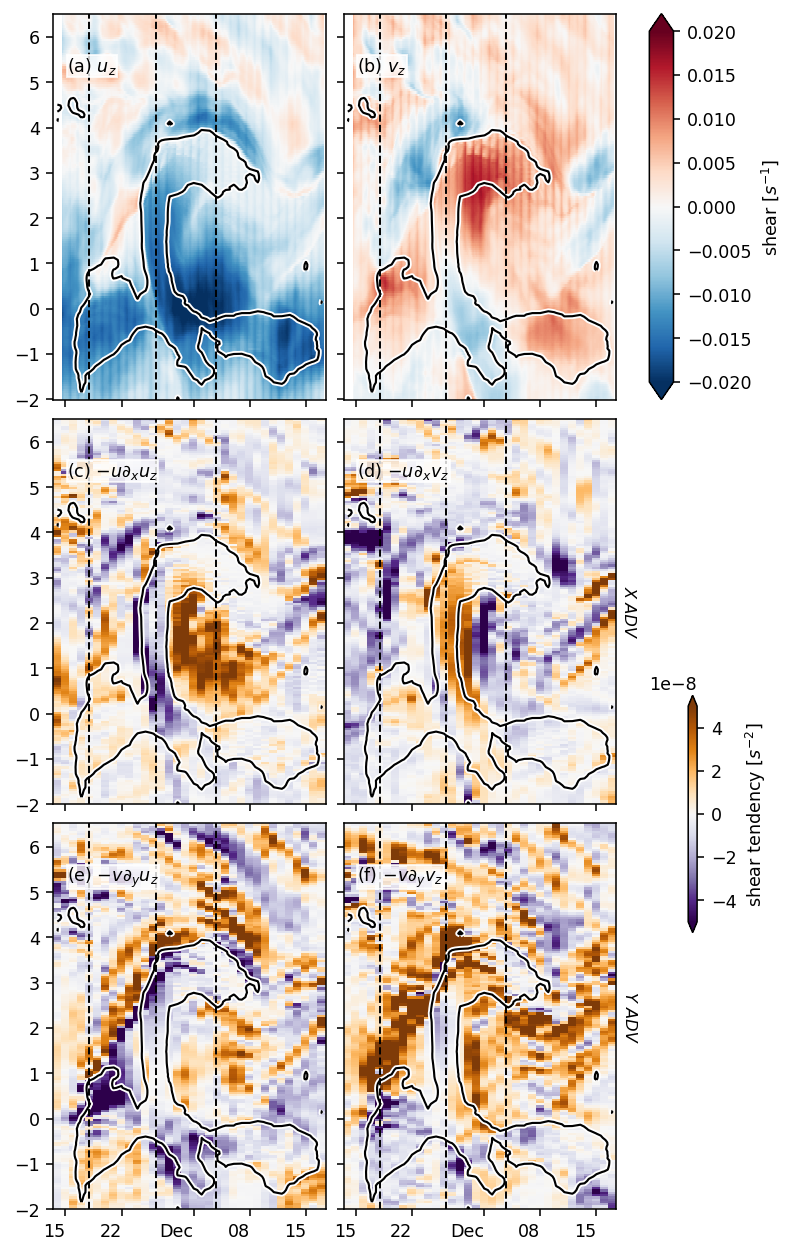
KPP at eq#
jra = pump.obs.read_jra_95()
subset = period4.isel(longitude=1).sel(latitude=0, method="nearest").load()
forcing = pump.obs.interp_jra_to_station(jra, subset)
fluxes, coare = pump.calc.coare_fluxes_jra(subset, forcing)
kpp = pump.calc.calc_kpp_terms(subset.merge(fluxes).chunk({"depth": -1}).fillna(0))
/glade/u/home/dcherian/python/xcoare/xcoare/coare35vn.py:733: RuntimeWarning: invalid value encountered in power
x = (1 - 34.15 * zet) ** 0.3333
/glade/u/home/dcherian/python/xcoare/xcoare/coare35vn.py:516: RuntimeWarning: invalid value encountered in power
ug = np.where(Bf > 0, Beta * (Bf * zi) ** 0.333, 0.2)
%matplotlib inline
for sub in [
period4.isel(longitude=1).sel(latitude=0, method="nearest"),
period4.isel(longitude=1).sel(latitude=3.5, method="nearest"),
]:
(sub.hRib - (-1 * sub.KPPhbl)).plot()
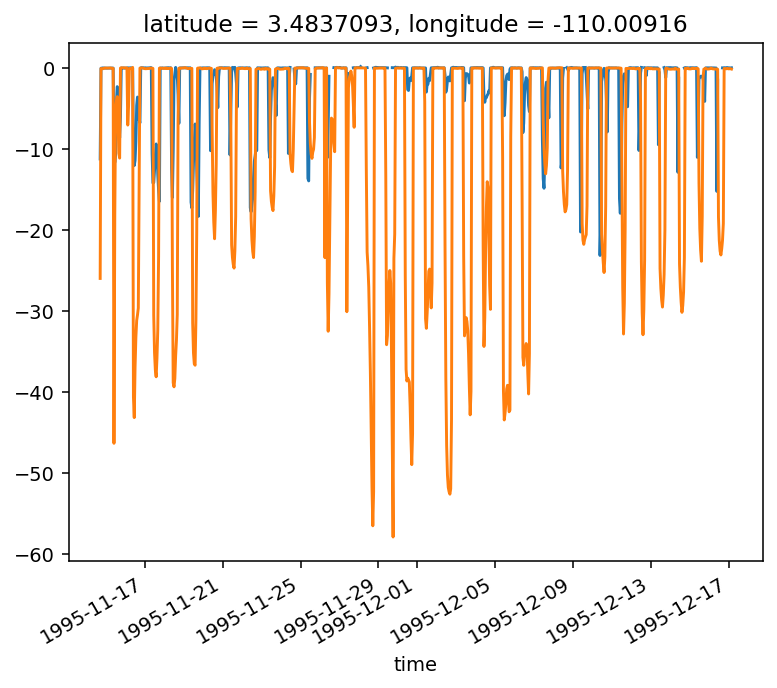
%matplotlib widget
subset2.hRib.plot(color="r", lw=3)
(-1 * subset2.KPPhbl).plot(color="k", lw=1)
[<matplotlib.lines.Line2D at 0x2b4c11699490>]
subset2 = xr.merge([subset, fluxes])
f, ax = pump.plot.plot_dcl(
subset2.sel(time=slice("1995-11-17", "1995-11-27"), depth=slice(-40)),
kpp_terms=False,
lw=1.5,
)